

Annexure - Directorate of Economics and Statistics
Annexure - Directorate of Economics and Statistics
Annexure - Directorate of Economics and Statistics

Create successful ePaper yourself
Turn your PDF publications into a flip-book with our unique Google optimized e-Paper software.
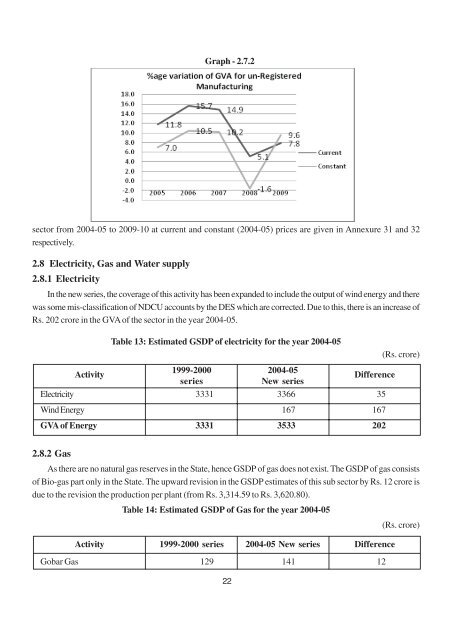
sector from 2004-05 to 2009-10 at current <strong>and</strong> constant (2004-05) prices are given in <strong>Annexure</strong> 31 <strong>and</strong> 32<br />
respectively.<br />
2.8 Electricity, Gas <strong>and</strong> Water supply<br />
2.8.1 Electricity<br />
In the new series, the coverage <strong>of</strong> this activity has been exp<strong>and</strong>ed to include the output <strong>of</strong> wind energy <strong>and</strong> there<br />
was some mis-classification <strong>of</strong> NDCU accounts by the DES which are corrected. Due to this, there is an increase <strong>of</strong><br />
Rs. 202 crore in the GVA <strong>of</strong> the sector in the year 2004-05.<br />
Table 13: Estimated GSDP <strong>of</strong> electricity for the year 2004-05<br />
Activity<br />
1999-2000<br />
series<br />
2004-05<br />
New series<br />
Difference<br />
Electricity 3331 3366 35<br />
Wind Energy 167 167<br />
GVA <strong>of</strong> Energy 3331 3533 202<br />
(Rs. crore)<br />
2.8.2 Gas<br />
As there are no natural gas reserves in the State, hence GSDP <strong>of</strong> gas does not exist. The GSDP <strong>of</strong> gas consists<br />
<strong>of</strong> Bio-gas part only in the State. The upward revision in the GSDP estimates <strong>of</strong> this sub sector by Rs. 12 crore is<br />
due to the revision the production per plant (from Rs. 3,314.59 to Rs. 3,620.80).<br />
Table 14: Estimated GSDP <strong>of</strong> Gas for the year 2004-05<br />
(Rs. crore)<br />
Activity<br />
Graph - 2.7.2<br />
1999-2000 series 2004-05 New series Difference<br />
Gobar Gas 129 141 12<br />
22