Back Cocktail Isaan Power - the Netherlands - Thai Chamber of ...
Back Cocktail Isaan Power - the Netherlands - Thai Chamber of ...
Back Cocktail Isaan Power - the Netherlands - Thai Chamber of ...

Create successful ePaper yourself
Turn your PDF publications into a flip-book with our unique Google optimized e-Paper software.
<strong>Thai</strong> Trade Notes Part II: The<br />
Ne<strong>the</strong>rlands’ international trade<br />
position<br />
F<br />
T<br />
Feature<br />
ollowing part I <strong>of</strong> <strong>the</strong> <strong>Thai</strong> Trade Notes in <strong>the</strong> last edition <strong>of</strong> Commerce Magazine, part II discusses<br />
<strong>the</strong> Ne<strong>the</strong>rlands’ international trade position. Figures show that <strong>the</strong> market between <strong>the</strong> Ne<strong>the</strong>rlands<br />
and <strong>Thai</strong>land still show a lot <strong>of</strong> potential. Figures compiled by <strong>the</strong> Economic Department <strong>of</strong> <strong>the</strong><br />
Ne<strong>the</strong>rlands Embassy. Statistics by <strong>the</strong> Bank <strong>of</strong> <strong>Thai</strong>land, <strong>Thai</strong> Customs Department and Statistics<br />
Ne<strong>the</strong>rlands (CBS).<br />
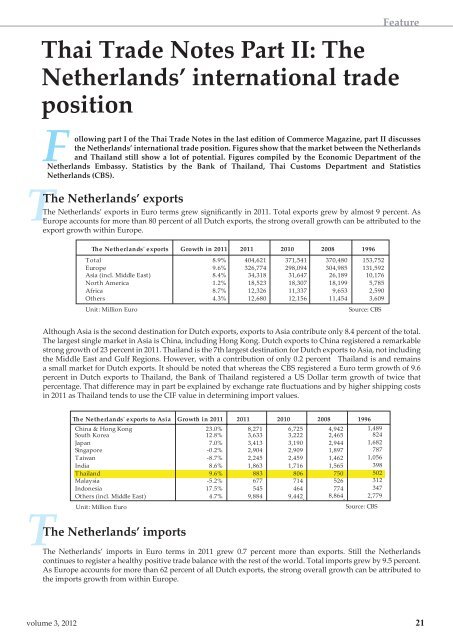
The Ne<strong>the</strong>rlands’ exports<br />
The Ne<strong>the</strong>rlands’ exports in Euro terms grew signifi cantly in 2011. Total exports grew by almost 9 percent. As<br />
Europe accounts for more than 80 percent <strong>of</strong> all Dutch exports, <strong>the</strong> strong overall growth can be att ributed to <strong>the</strong><br />
export growth within Europe.<br />
The Ne<strong>the</strong>rlands' exports Growth in 2011 2011 2010 2008 1996<br />
Total 8.9% 404,621 371,541 370,480 153,752<br />
Europe 9.6% 326,774 298,094 304,985 131,592<br />
Asia (incl. Middle East) 8.4% 34,318 31,647 26,189 10,176<br />
North America 1.2% 18,523 18,307 18,199 5,785<br />
Africa 8.7% 12,326 11,337 9,653 2,590<br />
O<strong>the</strong>rs 4.3% 12,680 12,156 11,454 3,609<br />
Unit: Million Euro Source: CBS<br />
Although Asia is <strong>the</strong> second destination for Dutch exports, exports to Asia contribute only 8.4 percent <strong>of</strong> <strong>the</strong> total.<br />
The largest single market in Asia is China, including Hong Kong. Dutch exports to China registered a remarkable<br />
strong growth <strong>of</strong> 23 percent in 2011. <strong>Thai</strong>land is <strong>the</strong> 7th largest destination for Dutch exports to Asia, not including<br />
<strong>the</strong> Middle East and Gulf Regions. However, with a contribution <strong>of</strong> only 0.2 percent <strong>Thai</strong>land is and remains<br />
a small market for Dutch exports. It should be noted that whereas <strong>the</strong> CBS registered a Euro term growth <strong>of</strong> 9.6<br />
percent in Dutch exports to <strong>Thai</strong>land, <strong>the</strong> Bank <strong>of</strong> <strong>Thai</strong>land registered a US Dollar term growth <strong>of</strong> twice that<br />
percentage. That diff erence may in part be explained by exchange rate fl uctuations and by higher shipping costs<br />
in 2011 as <strong>Thai</strong>land tends to use <strong>the</strong> CIF value in determining import values.<br />
The Ne<strong>the</strong>rlands' exports to Asia Growth in 2011 2011 2010 2008 1996<br />
China & Hong Kong<br />
South Korea<br />
23.0%<br />
12.8%<br />
8,271<br />
3,633<br />
6,725<br />
3,222<br />
4,942<br />
2,465<br />
1,489<br />
824<br />
Japan 7.0% 3,413 3,190 2,944 1,682<br />
Singapore -0.2% 2,904 2,909 1,897 787<br />
Taiwan -8.7% 2,245 2,459 1,462 1,056<br />
India 8.6% 1,863 1,716 1,565 398<br />
<strong>Thai</strong>land 9.6% 883 806 750 502<br />
Malaysia -5.2% 677 714 526 312<br />
Indonesia 17.5% 545 464 774 347<br />
O<strong>the</strong>rs (incl. Middle East) 4.7% 9,884 9,442 8,864 2,779<br />
Unit: Million Euro<br />
Source: CBS<br />
TThe<br />
Ne<strong>the</strong>rlands’ imports<br />
The Ne<strong>the</strong>rlands’ imports in Euro terms in 2011 grew 0.7 percent more than exports. Still <strong>the</strong> Ne<strong>the</strong>rlands<br />
continues to register a healthy positive trade balance with <strong>the</strong> rest <strong>of</strong> <strong>the</strong> world. Total imports grew by 9.5 percent.<br />
As Europe accounts for more than 62 percent <strong>of</strong> all Dutch exports, <strong>the</strong> strong overall growth can be att ributed to<br />
<strong>the</strong> imports growth from within Europe.<br />
volume 3, 2012 21