Cool Farming: Climate impacts of agriculture and mitigation potential
Cool Farming: Climate impacts of agriculture and mitigation potential
Cool Farming: Climate impacts of agriculture and mitigation potential

You also want an ePaper? Increase the reach of your titles
YUMPU automatically turns print PDFs into web optimized ePapers that Google loves.
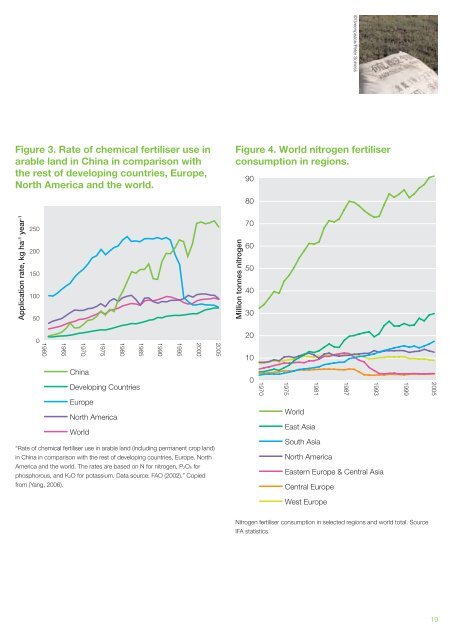
Figure 3. Rate <strong>of</strong> chemical fertiliser use in<br />
arable l<strong>and</strong> in China in comparison with<br />
the rest <strong>of</strong> developing countries, Europe,<br />
North America <strong>and</strong> the world.<br />
Application rate, kg ha -1 year -1<br />
250<br />
200<br />
150<br />
100<br />
50<br />
0<br />
1960<br />
1965<br />
1970<br />
China<br />
Developing Countries<br />
Europe<br />
North America<br />
World<br />
1975<br />
“Rate <strong>of</strong> chemical fertiliser use in arable l<strong>and</strong> (including permanent crop l<strong>and</strong>)<br />
in China in comparison with the rest <strong>of</strong> developing countries, Europe, North<br />
America <strong>and</strong> the world. The rates are based on N for nitrogen, P2O5 for<br />
phosphorous, <strong>and</strong> K2O for potassium. Data source: FAO (2002).” Copied<br />
from (Yang, 2006).<br />
1980<br />
1985<br />
1990<br />
1995<br />
2000<br />
2005<br />
Figure 4. World nitrogen fertiliser<br />
consumption in regions.<br />
Million tonnes nitrogen<br />
90<br />
80<br />
70<br />
60<br />
50<br />
40<br />
30<br />
20<br />
10<br />
0<br />
1970<br />
1975<br />
World<br />
East Asia<br />
1981<br />
South Asia<br />
North America<br />
©Greenpeace/Peter Solness<br />
Eastern Europe & Central Asia<br />
Central Europe<br />
West Europe<br />
Nitrogen fertiliser consumption in selected regions <strong>and</strong> world total. Source<br />
IFA statistics.<br />
1987<br />
1993<br />
1999<br />
2005<br />
19