Bringing BAW Technology into Volume Production: The ... - TriQuint
Bringing BAW Technology into Volume Production: The ... - TriQuint
Bringing BAW Technology into Volume Production: The ... - TriQuint

You also want an ePaper? Increase the reach of your titles
YUMPU automatically turns print PDFs into web optimized ePapers that Google loves.
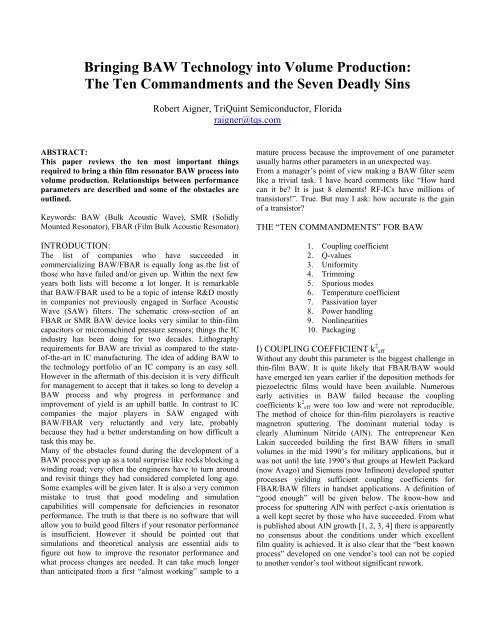
<strong>Bringing</strong> <strong>BAW</strong> <strong>Technology</strong> <strong>into</strong> <strong>Volume</strong> <strong>Production</strong>:<br />
<strong>The</strong> Ten Commandments and the Seven Deadly Sins<br />
ABSTRACT:<br />
This paper reviews the ten most important things<br />
required to bring a thin film resonator <strong>BAW</strong> process <strong>into</strong><br />
volume production. Relationships between performance<br />
parameters are described and some of the obstacles are<br />
outlined.<br />
Keywords: <strong>BAW</strong> (Bulk Acoustic Wave), SMR (Solidly<br />
Mounted Resonator), FBAR (Film Bulk Acoustic Resonator)<br />
INTRODUCTION:<br />
<strong>The</strong> list of companies who have succeeded in<br />
commercializing <strong>BAW</strong>/FBAR is equally long as the list of<br />
those who have failed and/or given up. Within the next few<br />
years both lists will become a lot longer. It is remarkable<br />
that <strong>BAW</strong>/FBAR used to be a topic of intense R&D mostly<br />
in companies not previously engaged in Surface Acoustic<br />
Wave (SAW) filters. <strong>The</strong> schematic cross-section of an<br />
FBAR or SMR <strong>BAW</strong> device looks very similar to thin-film<br />
capacitors or micromachined pressure sensors; things the IC<br />
industry has been doing for two decades. Lithography<br />
requirements for <strong>BAW</strong> are trivial as compared to the stateof-the-art<br />
in IC manufacturing. <strong>The</strong> idea of adding <strong>BAW</strong> to<br />
the technology portfolio of an IC company is an easy sell.<br />
However in the aftermath of this decision it is very difficult<br />
for management to accept that it takes so long to develop a<br />
<strong>BAW</strong> process and why progress in performance and<br />
improvement of yield is an uphill battle. In contrast to IC<br />
companies the major players in SAW engaged with<br />
<strong>BAW</strong>/FBAR very reluctantly and very late, probably<br />
because they had a better understanding on how difficult a<br />
task this may be.<br />
Many of the obstacles found during the development of a<br />
<strong>BAW</strong> process pop up as a total surprise like rocks blocking a<br />
winding road; very often the engineers have to turn around<br />
and revisit things they had considered completed long ago.<br />
Some examples will be given later. It is also a very common<br />
mistake to trust that good modeling and simulation<br />
capabilities will compensate for deficiencies in resonator<br />
performance. <strong>The</strong> truth is that there is no software that will<br />
allow you to build good filters if your resonator performance<br />
is insufficient. However it should be pointed out that<br />
simulations and theoretical analysis are essential aids to<br />
figure out how to improve the resonator performance and<br />
what process changes are needed. It can take much longer<br />
than anticipated from a first “almost working” sample to a<br />
Robert Aigner, <strong>TriQuint</strong> Semiconductor, Florida<br />
raigner@tqs.com<br />
mature process because the improvement of one parameter<br />
usually harms other parameters in an unexpected way.<br />
From a manager’s point of view making a <strong>BAW</strong> filter seem<br />
like a trivial task. I have heard comments like “How hard<br />
can it be? It is just 8 elements! RF-ICs have millions of<br />
transistors!”. True. But may I ask: how accurate is the gain<br />
of a transistor?<br />
THE “TEN COMMANDMENTS” FOR <strong>BAW</strong><br />
1. Coupling coefficient<br />
2. Q-values<br />
3. Uniformity<br />
4. Trimming<br />
5. Spurious modes<br />
6. Temperature coefficient<br />
7. Passivation layer<br />
8. Power handling<br />
9. Nonlinearities<br />
10. Packaging<br />
I) COUPLING COEFFICIENT k 2 eff<br />
Without any doubt this parameter is the biggest challenge in<br />
thin-film <strong>BAW</strong>. It is quite likely that FBAR/<strong>BAW</strong> would<br />
have emerged ten years earlier if the deposition methods for<br />
piezoelectric films would have been available. Numerous<br />
early activities in <strong>BAW</strong> failed because the coupling<br />
coefficients k 2 eff were too low and were not reproducible.<br />
<strong>The</strong> method of choice for thin-film piezolayers is reactive<br />
magnetron sputtering. <strong>The</strong> dominant material today is<br />
clearly Aluminum Nitride (AlN). <strong>The</strong> entrepreneur Ken<br />
Lakin succeeded building the first <strong>BAW</strong> filters in small<br />
volumes in the mid 1990’s for military applications, but it<br />
was not until the late 1990’s that groups at Hewlett Packard<br />
(now Avago) and Siemens (now Infineon) developed sputter<br />
processes yielding sufficient coupling coefficients for<br />
FBAR/<strong>BAW</strong> filters in handset applications. A definition of<br />
“good enough” will be given below. <strong>The</strong> know-how and<br />
process for sputtering AlN with perfect c-axis orientation is<br />
a well kept secret by those who have succeeded. From what<br />
is published about AlN growth [1, 2, 3, 4] there is apparently<br />
no consensus about the conditions under which excellent<br />
film quality is achieved. It is also clear that the “best known<br />
process” developed on one vendor’s tool can not be copied<br />
to another vendor’s tool without significant rework.
<strong>The</strong>re is strong indication that the layer on which AlN is<br />
deposited plays an important role. <strong>The</strong> following parameters<br />
have been reported to influence k 2 eff significantly:<br />
- material and orientation of bottom-electrode [1]<br />
- smoothness of bottom-electrode surface<br />
- chemical surface condition [3]<br />
Material science groups often present AlN results in terms of<br />
XRD (X-Ray Diffraction) peak-width “rocking-curve<br />
FWHM angle”, it is important to note that a small FWHM<br />
angle is a necessary condition for high coupling but it is by<br />
no means a sufficient condition. Even if XRD shows perfect<br />
orientation there can be an amorphous AlN “starting layer”<br />
on the bottom electrode. <strong>The</strong> X-ray signal of the amorphous<br />
starting layer would be hidden behind the large peaks of the<br />
oriented AlN. Amorphous layers between the electrode and<br />
the piezolayer harm a resonator badly, the effective coupling<br />
coefficient of a 2GHz resonator can degrade from 6.6% to<br />
6.3% as a consequence of an only 30nm thick amorphous<br />
layer. A method to analyze if an amorphous starting layer is<br />
present is HR-TEM (High Resolution Transmission Electron<br />
Microscopy). In HR-TEM it is actually possible to image<br />
atomic lattice planes of AlN, identify the grains and check if<br />
they are correctly aligned. In bad AlN one may also observe<br />
mis-oriented grains of large size which slowly decay the<br />
thicker the film grows. In such a case the starting layer is not<br />
really amorphous but nevertheless it is a dead zone in terms<br />
of coupling and will harm performance badly.<br />
20 nm<br />
Another case in which XRD would fail to detect a growth<br />
problem is the effect of flipped grains in AlN [3]. Flipped<br />
grains will counteract the actuation of their correctly<br />
oriented neighbors and generate “dead” regions (and<br />
potentially strong acoustic losses). 2% flipped grains will<br />
bring down coupling from 6.6% to 6.3%.<br />
Fig. 2 sketches the hexagonal crystal structure of AlN<br />
(Wurtzite, class 6mm) in the two possible c-axis<br />
configurations. Note that in both configurations hexagonal<br />
monolayers of Aluminum and Nitrogen exist and that it is<br />
therefore not sufficient to start out with the “right” material<br />
as a first monolayer. What distinguishes the two<br />
configurations is the density of Al – N bonds from the first<br />
Al monolayer to the Nitrogen atoms above; in the upper<br />
picture the area density of bonds is a factor of three higher<br />
than in the lower picture. In addition it is reasonable to<br />
assume that the nature of the vertical Al – N bonds is<br />
different from the three other bonds (Al is a group III<br />
element, N is a group V element). Without offering scientific<br />
proof for this hypothesis it appears that growing high quality<br />
AlN requires a seeding condition that provides the right<br />
number and type of bonds during the initial seed formation<br />
phase of AlN. Reference [4] discloses amorphous Silicon as<br />
a good candidate to improve AlN quality.<br />
AlN<br />
Fig. 1: HR-TEM image of AlN on an “as deposited” Tungsten bottom electrode as disclosed in [4] and [6], showing misaligned<br />
grains in the interface region.<br />
W
Fig 2a: AlN crystal structure, c-axis pointing upwards<br />
Fig. 2b: AlN crystal structure, c-axis pointing downwards<br />
(same as 2a but up-side-down)<br />
<strong>The</strong> most reliable and relevant evaluation of k 2 eff is to build a<br />
simple <strong>BAW</strong> resonator that can be RF-probed. From the Sparameter<br />
data of resonators, the frequencies of resonance<br />
and anti-resonance can be extracted with high accuracy.<br />
Very short leads must be used between the RF-probe pads<br />
and the actual resonator in order to avoid series inductance<br />
which would result in an overestimation of k 2 eff. Wideband<br />
measurements should always be made to confirm that series<br />
inductance is negligible. Resonators with strong spurious<br />
modes can be problematic for k 2 eff extraction purposes as<br />
those may show distorted phase slopes and will introduce<br />
scatter in the determination of the resonance frequencies. It<br />
is highly recommended to fit a BVD model to the<br />
measurement data rather than just detecting the zerocrossings<br />
of the phase.<br />
<strong>The</strong> value of k 2 eff can be straight forward calculated from the<br />
resonance frequency fs and the anti-resonance frequency fp.<br />
Unfortunately not all groups working in this field use the<br />
same formulas. On a first look the differences are not big but<br />
one should keep in mind that if k 2 eff drops from 6.6% to<br />
6.3% it can lower yield from 80% down to zero. <strong>The</strong><br />
following definitions are used by various groups:<br />
k<br />
k<br />
k<br />
k<br />
2<br />
eff<br />
2<br />
eff<br />
2<br />
eff<br />
2<br />
eff<br />
π f<br />
=<br />
2 f<br />
=<br />
=<br />
=<br />
s<br />
p<br />
1<br />
⎛<br />
⎜<br />
π f<br />
tan<br />
⎜<br />
⎝ 2 f<br />
s<br />
p<br />
⎞<br />
⎟<br />
⎠<br />
2<br />
π ⎛ ⎞ ⎛ − ⎞<br />
⎜<br />
f f p f<br />
s<br />
s ⎟ ⋅⎜<br />
⎟<br />
4 ⎜ ⎟ ⎜ ⎟<br />
⎝ f p ⎠ ⎝ f p ⎠<br />
2<br />
π ⎛ f ⎞ p − f s<br />
⋅⎜<br />
⎟<br />
4 ⎜ ⎟<br />
⎝ f p ⎠<br />
2<br />
π ⎛ f p − f s ⎞<br />
⋅ ⎜<br />
⎟<br />
4 ⎝ f s ⎠<br />
fp/fs = 1.0284 k 2 eff<br />
IEEE standard 6.63 %<br />
2 nd order Taylor 6.62 %<br />
1 st order Taylor 6.81%<br />
Optimist’s favorite 7.01%<br />
IEEE definition<br />
2 nd order Taylor approx.<br />
1 st order Taylor approx.<br />
“Optimist’s favorite”<br />
Table 1 shows by how much the four definitions differ for a<br />
good SMR-<strong>BAW</strong>. fs = 1866 MHz and fp = 1919 MHz.<br />
<strong>The</strong> IEEE standard definition is fully consistent with the<br />
results derived for a resonator with infinitely thin electrodes<br />
in classical <strong>BAW</strong> literature [5]. <strong>The</strong> reason why this<br />
definition is not widely used is the trouble one runs <strong>into</strong><br />
when inverting the transcendent function for modeling<br />
purposes. <strong>The</strong> 2 nd order Taylor series is a very good<br />
approximation and should be used as a standard. However<br />
most groups and tool vendors use the 1 st order Taylor (or<br />
even the “Optimist’s favorite”) because they show higher<br />
values for k 2 eff.<br />
<strong>The</strong> values achieved in state-of-the-art deposition tools (on a<br />
regular basis and as an average over full wafer area) are<br />
k 2 eff = 6.7% (using IEEE standard definition) for an<br />
SMR-<strong>BAW</strong> at 2 GHz.<br />
It should be pointed out that it makes no sense to benchmark<br />
this number against published data for mono-crystalline AlN.<br />
<strong>The</strong> layer stack and most importantly the electrodes used<br />
have a strong influence on coupling and this has nothing to<br />
do with the AlN quality. A properly designed layer stack can<br />
enhance coupling [6], a badly designed stack will degrade<br />
coupling. In addition to this a thin film piezolayer is laterally<br />
clamped and the d33 parameter of a crystal differs from a<br />
thin-film [1].<br />
Despite the fact that ZnO has in theory a slightly higher<br />
coupling coefficient than AlN it has so far not been<br />
demonstrated as a viable alternative to AlN. <strong>The</strong> other<br />
prominent piezomaterial PZT is an interesting material for<br />
MEMS and low frequency devices as it has very high<br />
coupling along with extremely high dielectric constant. In<br />
the GHz range PZT appears to have too high intrinsic losses<br />
[7]. Moreover the high dielectric constant and low acoustic
velocity would result in extremely small resonators which in<br />
turn would make it very hard to control acoustic behavior.<br />
II) Q-VALUES<br />
It is a fact that the high Q-values achieved with FBAR were<br />
a key advantage over SAW in the frequency range up to 2<br />
GHz at the time FBAR emerged on the market. In order for<br />
FBAR/<strong>BAW</strong> to remain competitive against SAW in this<br />
frequency range, the Q-values of next generation <strong>BAW</strong><br />
products must improve significantly. Q = 2000 is a<br />
reasonable target.<br />
Most groups working in FBAR/<strong>BAW</strong> use their own<br />
definition of Q-values. While in all cases the Q-valuedefinition<br />
is related to the impedance-phase-slope of a<br />
resonator, there are different ways to smooth and average the<br />
results obtained. Furthermore, the “de-embedding” of<br />
electrical losses can change results significantly.<br />
Spurious modes may be present in the surrounding of fs<br />
and/or fp and it is not a good idea to use local derivatives to<br />
calculate Q because that can lead to huge scatter in the Qvalue<br />
data extracted. A fit function based on a BVD model<br />
can be used to fit the slope before the extraction of Q is done.<br />
In a really good resonator of reasonable size (20 to 150 ohm<br />
impedance level) the phase-slope is steeper at fp because the<br />
series resistances of the RF-probes, pads and leads have no<br />
effect at this frequency. Whenever a resonator shows a bad<br />
phase-slope at fp it is most likely an acoustic loss that causes<br />
this problem. In order to describe a resonator properly one<br />
would have to define 3 different Q-values:<br />
- the “acoustic” Qa-value represented by the acoustic<br />
branch resistance Ra in Fig.3<br />
- Q@fs which includes the series resistance Rs<br />
- Q@fp which includes Rsi.<br />
R s<br />
R a L a C a<br />
C 0<br />
R si<br />
Fig.3 shows the electrical equivalent circuit of a resonator<br />
know as “modified BVD” [8]<br />
In a good resonator Rsi is extremely small or zero and<br />
Qa = Q@fp. <strong>The</strong> best values reported to date for FBAR are<br />
Q>2000 [9] and for SMR-<strong>BAW</strong> are Q=2500 [10].<br />
<strong>The</strong> Q-values of SMR-<strong>BAW</strong>s were extremely poor until the<br />
discovery was made by Infineon’s <strong>BAW</strong> group in year 2000<br />
that shear waves generated as a by-product of thickness<br />
expansional vibration will leak out through the bottom<br />
reflector [11]. Up to this point in time reflectors were built<br />
from quarter wavelength thick layers of high- and lowimpedance<br />
materials. After changing this to fix the dominant<br />
loss mechanism by modifying the reflector to work both for<br />
the longitudinal and the shear wave, the Q-values jumped<br />
from below 700 to above 1300 without any other concurrent<br />
changes.<br />
Hunting down the loss mechanism that presently limits Qvalues<br />
in SMR-<strong>BAW</strong>s is on the agenda of many groups.<br />
Attempts to explain part of the losses by lateral acoustic<br />
leakage or lateral redistribution currents in the electrodes<br />
[12] have been published. However it is not proven at this<br />
point in time that losses of this nature limit the Q-values we<br />
see in experiments. To my knowledge there is no publication<br />
about a method that would consistently predict the<br />
theoretical limit for Q for FBAR or SMR.<br />
III) UNIFORMITY<br />
Uniformity of layer thickness across a wafer is one of the<br />
obvious challenges in FBAR/<strong>BAW</strong>. Using a Mason-model<br />
approach one can derive the change of resonance frequency<br />
if a layer thickness is off target. Layer thickness uniformity<br />
has been discussed in many publications [13]. <strong>The</strong>re are<br />
many aspects of uniformity that are less obvious and easily<br />
escape people’s attention:<br />
- uniformity of acoustic parameters (velocity, density) is<br />
equally important to thickness-uniformity.<br />
- Uniformity of k 2 eff across the wafer is related to<br />
maximum yield.<br />
- Some types of uniformity problems can be fixed by<br />
trimming while others can’t. Some layers deep down in<br />
the stack do not change frequency by a significant<br />
amount but they are important with regard to acoustic<br />
wave dispersion.<br />
- Uniformity on a small lateral scale is very important. A<br />
change of layer thickness or material parameters within<br />
one resonator can kill resonator performance. Any<br />
unintended change of parameters between the resonators<br />
comprising a filter or between neighboring filters on a<br />
wafer will cause severe yield losses. No trimming<br />
method is able to fix this type of problem.<br />
While thickness uniformity, as it concerns frequency<br />
tolerance is somewhat overemphasized, the severity of the<br />
other aspects is clearly underestimated. At this point it is<br />
worth mentioning that many of the methods used to measure<br />
and map thickness are indirect and need very careful<br />
calibration. For transparent layers the standard tool is an<br />
optical spectrometer/ellipsometer. It measures thickness very<br />
accurately if refractive index and the optical properties of the<br />
layer underneath are well defined. A change in “optical<br />
length” is not necessarily related to “acoustical length”.<br />
Another example is the thickness measurement of metal<br />
layers. <strong>The</strong> 4-Point-Resistance method is a standard method<br />
in many IC fabs. <strong>The</strong> result of the measurement is the<br />
“Rsquare” of a metal layer which is inversely proportional to<br />
thickness. <strong>The</strong> conductivity is a calibration parameter. It is<br />
wrong to assume that conductivity is in any way related to<br />
the acoustic properties of the film. <strong>The</strong>re is no way to<br />
distinguish if a change in Rsquare is related to a thickness<br />
changes or if conductivity has changed. <strong>The</strong> 4-Point-<br />
Resistance method is not suited to verify the uniformity of<br />
metal layers for <strong>BAW</strong>. A somewhat better way to measure<br />
thickness is XRF (X-Ray Fluorescence). <strong>The</strong> calibration<br />
parameter is density and the assumption is that alloy
composition does not change. Thin and heavy layers can be<br />
measured with XRF quite well but it is not possible to<br />
measure multilayer stacks. <strong>The</strong> king of metrology methods<br />
for FBAR/<strong>BAW</strong> is Femtosecond Laser-Pulse Sonar. <strong>The</strong><br />
tool measures acoustic delay time(s) of layer(s) and directly<br />
extracts the parameters needed for a Mason model. Even if<br />
the calibration parameter “acoustic velocity” is slightly off,<br />
the error will, to a large extent, self-correct when calculating<br />
the frequency. One of the nice features of this method is the<br />
small spot size (10 .. 20 μm) and the capability to measure<br />
multi-layers in one shot.<br />
IV) TRIMMING<br />
A typical PCS duplexer spec requires hitting a frequency<br />
target accurately to ±1 MHz, which is equivalent to ±0.05%<br />
relative error. Accordingly the layer thickness, acoustic<br />
velocity and density of several layers would have to be<br />
accurate to ±0.02% each. <strong>The</strong>re is no hope to achieve such a<br />
high accuracy “as deposited”. As a consequence frequency<br />
trimming is one of the key processes in FBAR/<strong>BAW</strong>. Runto-run<br />
variations can be corrected by feed-forward control of<br />
deposition thickness. However correction of uniformity<br />
errors requires “localized processing”. Off-the-shelf<br />
trimming tools for <strong>BAW</strong> and SAW are now available and<br />
they are all based on local Ion-beam etching. A very narrow<br />
Ion-beam is scanned over the wafer surface at a controlled<br />
speed which determines the local removal that occurs [14].<br />
<strong>The</strong> challenge in trimming is to choose the right strategy.<br />
Trimming for volume production is a balancing act between<br />
accuracy and throughput. <strong>The</strong> input data for trimming comes<br />
from mapping the thickness and/or frequency. <strong>The</strong> mapping<br />
grid must satisfy Shannon’s sampling theorem in both<br />
coordinate directions. <strong>The</strong> size and shape of the ion-beam is<br />
a very important parameter which determines the maximaum<br />
frequency gradient the tool can handle. Small diameter<br />
beams allow very large gradients but tend to have a very low<br />
volume etch rate which results in very long processing times.<br />
<strong>The</strong> stability of the beam shape over a long time is crucial<br />
for the accuracy the tool will achieve.<br />
<strong>The</strong> topmost layer from which the Ion-beam is supposed to<br />
removes material must be chosen considering the following<br />
parameters:<br />
- Trimming <strong>into</strong> heavy layers allows very high<br />
throughput but there are limitations in accuracy. Even at<br />
maximum scanning speed, the frequency shift can be<br />
larger than desired on certain spots on the wafer. <strong>The</strong><br />
maximum speed and acceleration of the mechanical<br />
scanning system can accommodate is an important<br />
parameter for such a case.<br />
- Metal layers may grow a native oxide layer in air. <strong>The</strong><br />
thickness of this layer is not predictable. In most cases<br />
this native oxide exhibits a different etch rate than the<br />
metal below. This results in strong nonlinear behavior in<br />
the dose versus removal curve. <strong>The</strong> worst materials to<br />
trim are Al alloys. Al2O3 etches factor 5 slower than the<br />
Al below.<br />
- Dielectric materials are well suited to trim very<br />
accurately. On the other hand, the frequency shift that<br />
can be obtained is very limited because suitable layers<br />
(SiO2 or Si3N4) have a low mass density and low etch<br />
rate. In general dielectric layers show excellent<br />
reproducibility of trimming rate. <strong>The</strong> drawback of<br />
dielectric layers is that their presence generally degrades<br />
coupling coefficient without contributing to the<br />
conductivity of the electrode. <strong>The</strong> maximum thickness<br />
of a dielectric layer is determined by how much margin,<br />
in coupling coefficient, a filter has.<br />
V) SPURIOUS MODES<br />
Spurious modes are related to lateral standing waves in a<br />
<strong>BAW</strong> or FBAR resonator. Only a very tiny amount of<br />
spurious ripple is acceptable in filters with stringent<br />
amplitude ripple and group delay ripple specs. Moreover the<br />
presence of spurious modes usually goes along with<br />
degraded Q-values. <strong>The</strong>re are different ways to fight<br />
spurious modes in FBARs and in SMRs. For SMRs it is<br />
certain that pronounced spurious modes will show up when<br />
the Q-values exceed 1000 (regardless of resonator shape)<br />
and they will be really bad at Q = 1500. At Q
It is possible to further improve TCF in SMRs by increasing<br />
the SiO2 content and by moving the SiO2 closer to the high<br />
stress regions in the stack. SMRs with essentially zero TCF<br />
have been reported [21]. All of these approaches harm k 2 eff<br />
massively and can only be used for filters and resonators<br />
with small fractional bandwidth. In order to have a zero TCF<br />
one would have to accept k 2 eff of an SMR resonator below<br />
4%.<br />
VII) PASSIVATION LAYER<br />
<strong>The</strong> purpose of a passivation layer is to protect the<br />
resonators from detrimental effects caused by humidity or<br />
corrosive fluids. Whether they are required or not has been a<br />
topic of heated discussions. This question can only be<br />
answered after reviewing the packaging options and<br />
preferences for FBAR/<strong>BAW</strong>.<br />
<strong>The</strong> main challenge of passivation layers for <strong>BAW</strong>-SMRs at<br />
high frequencies is that, for acoustical reasons, one can not<br />
choose layers as thick as in traditional IC processes. While<br />
IC process typically use a combination of 300nm SiO2 with<br />
300nm Si3N4 on top, the maximum thickness for an SMR at<br />
2GHz is less than 100nm (or else the k 2 eff degrades badly). It<br />
is possible to deposit a pin-hole free layer of that thickness.<br />
This layer can also serve as a “trimming layer”.<br />
VIII) POWER HANDLING<br />
FBAR/<strong>BAW</strong> devices endure higher power levels better than<br />
SAWs mainly because the electrical currents distribute more<br />
evenly. <strong>The</strong>re are no narrow IDT fingers like in SAW which<br />
are prone to electromigration damage. Even though the<br />
minimum feature size of <strong>BAW</strong> is much larger, the current<br />
densities can be enormous. For a <strong>BAW</strong> at 32dB transmit<br />
power at the upper passband skirt (worst case scenario) the<br />
following observation has been made. Depending on the<br />
electrode materials used the combined effect of current<br />
density and mechanical stress will cause the electrode<br />
material to migrate and form rough regions on the resonator<br />
surface. <strong>The</strong> losses of that resonator will increase and so will<br />
the temperature of the resonator. As migration effects follow<br />
an Arrhenius type law with temperature, the damage<br />
accelerates and the resonator will self-destroy within<br />
minutes. <strong>The</strong> power handling of <strong>BAW</strong>s is a strong function<br />
of the ambient temperature as suggested by the Arrhenius<br />
law. It is very important to keep the filter chip as cold as<br />
possible, therefore it is necessary to provide a good heat sink.<br />
<strong>The</strong> key to excellent power handling is to improve the<br />
electro- and stress-migration properties of the weakest<br />
material involved. This is an exercise the SAW vendors have<br />
successfully completed during the last years [22]. Significant<br />
material research activities will be required to find an<br />
optimum solution for <strong>BAW</strong>.<br />
IX) NON-LINEARITIES<br />
<strong>The</strong> discovery of nonlinear behavior in <strong>BAW</strong> and FBAR<br />
was first reported in 2005 [20]. It has long been known that<br />
solids exhibit nonlinear stress-strain relationships at high<br />
stress levels [23]. <strong>The</strong> binding forces of the atoms in a lattice<br />
are a strongly nonlinear function of distance. This effect is<br />
described by the 3 rd order elastic constants of a material. In<br />
addition to that the piezoelectric constants change as the<br />
crystal deforms. It should not come as a total surprise that<br />
the elastic constants of a material are modulated by strain<br />
generated by large voltage swings at high RF-power levels<br />
or by bias voltages. To my knowledge no complete theory<br />
about the nonlinear behavior of AlN based <strong>BAW</strong> resonators<br />
has been published.<br />
<strong>The</strong>re are known tricks to improve the linearity of <strong>BAW</strong><br />
filters. Cascading of two double sized resonators to replace<br />
one resonator in a filter is one of them, however this is not<br />
possible for all resonators in a filter as it would increase the<br />
size of a <strong>BAW</strong> by a factor of 4. Other tricks involve partial<br />
compensation of harmonic tones.<br />
X) PACKAGING.<br />
<strong>The</strong> fact that <strong>BAW</strong> filters can be processed on Silicon<br />
wafers is a big advantage for packaging. Silicon is much<br />
easier to handle than Lithium Tantalate or other piezo<br />
materials SAW filters are typically made from. Silicon is<br />
inherently stronger and less fragile, moreover it can be<br />
temperature ramped at a high rate which is a significant<br />
advantage over SAW. <strong>The</strong> thermal expansion coefficient of<br />
Silicon is small and isotropic and the heat conductivity is<br />
excellent.<br />
FBARs and <strong>BAW</strong>s need a cavity above the top electrode<br />
which was also true for all SAW filters until the recent<br />
introduction of Boundary-Wave-Acoustic Devices [24].<br />
Providing this cavity in a cost efficient way is a key for<br />
commercial success in consumer markets. <strong>The</strong> method of<br />
choice is to use a Wafer-Level-Packaging (WLP) approach<br />
in which the cavities are created in a batch process. FBAR<br />
[25] and <strong>BAW</strong> WLPs [26] are in volume production and<br />
details are published. [25] describes a process using waferbonding<br />
with a hermetic seal while [26] uses a polymer<br />
build-up approach which is not hermetic. <strong>The</strong> non-hermetic<br />
approach is potentially lower in cost but requires perfectly<br />
passivated resonators which do not corrode in a humid<br />
environment. Passivation is much easier to apply to <strong>BAW</strong>-<br />
SMR than to FBAR because there is no bottom cavity. For<br />
<strong>BAW</strong>-SMR a pin-hole free protection layer on the top<br />
surface is sufficient.<br />
SUMMARY<br />
<strong>The</strong> market share that FBAR/<strong>BAW</strong> will be able to gather is<br />
largely dependent on how well they support RF-integration.<br />
It is a clear trend in the wireless industry that companies<br />
building phones want to source functional blocks and<br />
modules rather than discrete filters. For the phone<br />
manufacturer the filters are invisible; it is the supplier’s<br />
responsibility to make filters and active components work<br />
together smoothly. <strong>The</strong> determining factor will be whether<br />
SAW or FBAR/<strong>BAW</strong> will provide a more cost competitive<br />
solution that meets the necessary performance level.
THE “SEVEN DEADLY SINS”<br />
(AND HOW MANAGERS CAN AVOID THEM)<br />
LUXURIA (extravagance)<br />
Choose your target markets and applications wisely.<br />
GULA (gluttony)<br />
Don’t build more capacity than you can fill.<br />
AVARITIA (greed)<br />
Don’t be “penny wise and pound foolish”; don’t try to<br />
save money in the wrong place.<br />
ACEDIA (sloth)<br />
Not applicable. Eningeers don’t have this bad habit.<br />
IRA (wrath)<br />
Engineers do their best to meet your aggressive<br />
schedules; don’t demand miracles.<br />
INVIDIA (envy)<br />
Don’t think your competitors were just lucky.<br />
SUPERBIA (pride)<br />
Know what SAW is capable of doing and what your<br />
competitors are up to.<br />
ACKNOWLEDGEMENTS:<br />
Many thanks to Ben Abbott for discussions on the crystal<br />
structure of AlN and for introducing me to the world of<br />
SAW.<br />
REFERENCES:<br />
[1] M.-A. Dubois, P. Muralt, L. Sagalowicz, “Aluminum Nitride<br />
Thin Films for High Frequency Applications”, Ferroelectrics, 1999,<br />
Vol. 224, pp. 243 – 250<br />
[2] R. S. Naik, R. Reif, J.J. Lutsky, C. G. Sodini, “Low-<br />
Temperature Deposition of Highly Textured Aluminum Nitride by<br />
Direct Current Magnetron Sputtering for Applications in Thin-Film<br />
Resonators”, Journal of <strong>The</strong> Electrochemical Society, 146 (2) 691 –<br />
696, 1999<br />
[3] J.A. Ruffner, P.G. Clem, B.A. Tuttle, D. Dimos, D.M.Gonzales,<br />
“Effect of substrate composition on the piezoelectric response of<br />
reactively sputtered AlN thin film”, Thin Solid Films 354 (1999)<br />
256-261<br />
[4] US patent, US6878604B2<br />
[5] J.F. Rosenbaum, “Bulk Acoustic Wave <strong>The</strong>ory and Devices”,<br />
Artech House, Boston, London, 1988<br />
[6] US patent, US6291391B1<br />
[7] Q-X Su, P. Kirby, E. Komuro, M. Imura, Q. Zhang, R.<br />
Whatmore,”Thin-Film Bulk Acoustic Resonators and Filters Using<br />
ZnO and Lead-Zirconium-Titanate Thin Films”, IEEE Transactions<br />
on Microwave <strong>The</strong>ory and Techniques, Vol. 49, No. 4, April 2001<br />
[8] J.D. LarsonIII, P.D. Bradley, S. Wartenberg, R.C. Ruby,<br />
“Modified Butterworth-Van Dyke circuit for FBAR resonators and<br />
automated measurement system”, IEEE Ultrasonics Symposium<br />
2000, vol.1 page 863-868<br />
[9] R. Ruby, J. D. LarsonIII, R. S. Fazzio, C. Feng, “Performance<br />
Degradation Effects in FBAR Filters and Resonators due to Lamb<br />
Wave Modes”, Proceedings of IEEE Ultrasonics Symposium 2005,<br />
Rotterdam<br />
[10] G. Fattinger, R. Aigner, S. Marksteiner, “Everything you<br />
always wanted to know about <strong>BAW</strong>”, Workshop proceedings,<br />
APMC2006, Yokohama Dec. 2006<br />
[11] S. Marksteiner, J. Kaitila, G. G. Fattinger, R. Aigner,<br />
„Optimization of Acoustic Mirrors for Solidly Mounted <strong>BAW</strong><br />
Resonators”, Proceedings of IEEE Ultrasonics Symposium 2005,<br />
Rotterdam<br />
[12] R. Thalhammer, R. Aigner, “Energy loss mechanisms in<br />
SMR–type <strong>BAW</strong> devices”, Proceedings of IEEE IMS-MTT-S 2005,<br />
Long Beach<br />
[13] R. Lanz, et.al. “Aluminum-Nitride Manufacturing Solution for<br />
<strong>BAW</strong> and other MEMS Applications Using a Novel, High-<br />
Uniformity PVD Source”, Proceedings of IEEE Ultrasonics<br />
Symposium 2006, Vancouver<br />
[14] European patent EP1456947B1<br />
[15] G. G. Fattinger, S. Marksteiner, J. Kaitila, and R. Aigner,<br />
„Optimization of Acoustic Dispersion for High Performance Thin<br />
Film <strong>BAW</strong> Resonators”, Proceedings of IEEE Ultrasonics<br />
Symposium 2005, Rotterdam<br />
[16] A. Link, et.al “Suppression of Spurious Modes in Mirror-Type<br />
Thin Film <strong>BAW</strong> Resonators Using an Appropriate Shape of the<br />
Active Area”, Proceedings of IEEE Ultrasonics Symposium 2005,<br />
Rotterdam<br />
[17] US patents US6182619 B1 and US6788170 B1<br />
[18] National Institute of Standards (NIST) ceramic database,<br />
http://www.ceramics.nist.gov/srd/summary/emodox00.htm<br />
[19] R. Aigner, “<strong>Volume</strong> manufacturing of <strong>BAW</strong>-filters in a<br />
CMOS fab”, Acoustic Wave Device Symposium 2004, Chiba<br />
Japan, March 2004<br />
[20] R. Aigner, N.-H. Huynh, M. Handtmann, S. Marksteiner<br />
“Behavior of <strong>BAW</strong> devices at high power levels” Proceedings of<br />
IEEE IMS-MTT-S 2005, Long Beach<br />
[21] K.M. Lakin, “A Review of Thin-Film Resonator <strong>Technology</strong>”,<br />
IEEE microwave magazine, Dec. 2003<br />
[22] O. Nakagawara, et al. “High power durable SAW antenna<br />
duplexers for W-CDMA with epitaxially grown aluminum<br />
electrodes”, IEEE Ultrasonics Symposium 2002<br />
[23] W.P. Mason, “Physical Acoustics, Vol III, part A” chapter 5,<br />
pp 199. Academic Press, New York and London, 1966<br />
[24] H. Kando, et. al. “RF Filter using Boundary Acoustic Wave”,<br />
Proceedings of IEEE Ultrasonics Symposium 2006, Vancouver<br />
[25] K. Wang, M. Frank, P. Bradley, R. Ruby, W. Mueller, „FBAR<br />
Rx filter for handset front-end modules with wafer-levelpackaging“,<br />
Proceedings of IEEE Ultrasonics Symposium 2003,<br />
Honolulu<br />
[26] M. Franosch, K.-G. Oppermann, A. Meckes, W. Nessler, R.<br />
Aigner, “A Wafer-Level-Process using Photo-Epoxy to create Air-<br />
Cavities for Bulk-Acoustic-Wave RF-Filters”, Proceedings of<br />
IMAPS 2004 conference, Long Beach California, Nov. 2004