
Create successful ePaper yourself
Turn your PDF publications into a flip-book with our unique Google optimized e-Paper software.
<strong>Climate</strong> & <strong>Biodiversity</strong> Comparisons<br />
The Leys Primary & Nursery School
An enrichment club was set up at The Leys Primary School, with the<br />
support of a ‘Tomorrow’s <strong>Climate</strong> Scientists’ grant’ from the Royal<br />
Society to compare the climate <strong>and</strong> biodiversity found in <strong>and</strong> around<br />
our school with that found in Kathm<strong>and</strong>u, Nepal.<br />
This <strong>project</strong> explores the multiple causes of climate change, the<br />
approaches being taken to tackle it <strong>and</strong> potential impact on<br />
biodiversity. In order to provide a focus to the issues, air pollution<br />
was used as the main discussion point as it is something that<br />
communities all over the world can change – today & tomorrow.<br />
This links in closely with several of the Sustainable Development<br />
Goals (SDGs).
The SDGs, also known as the Global Goals, were adopted by the<br />
United Nations in 2015 as a universal call to action to end poverty,<br />
protect the planet, <strong>and</strong> ensure that by 2030 all people enjoy peace<br />
<strong>and</strong> prosperity.<br />
The 17 SDGs are integrated—<br />
recognizing that action in one<br />
area will affect outcomes in<br />
others <strong>and</strong> air quality can be<br />
linked to several Global Goals,<br />
including 3, 4, 7, 9, 11, 12 <strong>and</strong> 13.
Dr Carolyn Devereux - who<br />
supported this <strong>project</strong> – is from<br />
the University of Hertfordshire.<br />
Carolyn is a lecturer in Astrophysics <strong>and</strong> explained to<br />
students from The Leys Primary what her job involves.<br />
She teaches Physics to university students <strong>and</strong> some of<br />
this involves measuring <strong>and</strong> gathering data - including<br />
climate data. Hence why Carolyn is also part of the Centre<br />
for <strong>Climate</strong> Change Research (C3R) at the University.
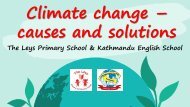
Poster created by a student<br />
at The Leys Primary<br />
to raise awareness of<br />
climate change
Air quality – particle pollution<br />
Particle pollution — also called particulate matter (PM) — is made<br />
up of particles of solids or liquids that are in the air. Some particles<br />
are big enough (or appear dark enough) to see — for example, you<br />
can often see smoke in the air. Others are so small that you can’t<br />
see them in the air.<br />
Breathing in particle pollution can be harmful to your health.<br />
Coarse (bigger) particles, called PM 10 , can irritate your eyes, nose,<br />
<strong>and</strong> throat. Dust from roads, farms, dry riverbeds, construction<br />
sites, <strong>and</strong> mines are types of PM 10 .<br />
Fine (smaller) particles, called PM 2.5 , are more dangerous because<br />
they can get deep into your lungs - or even into your blood.
Stevenage, UK<br />
A local newspaper article from<br />
May 2023, highlighted that air<br />
pollution in Stevenage was well<br />
over the 'health limit' set out by<br />
the World Health Organisation<br />
(WHO), according to Friends of<br />
the Earth data. The statistics<br />
showed the annual concentration<br />
of PM 2.5 in Stevenage was<br />
significantly higher than the<br />
WHO's 5 µg/m 3 'health limit',<br />
sitting at 7.8 µg/m 3 .
PM 2.5 measurement -<br />
Near Stevenage (S<strong>and</strong>y)
Key findings<br />
●<br />
●<br />
●<br />
●<br />
●<br />
Levels of pollution have decreased over the past 10 years<br />
Rarely gets to levels that are deemed unhealthy for all people<br />
The highest levels of pollution were recorded from 2016-18 during<br />
the early parts of the year<br />
However, 2019 appears to goes against the trend in that it has<br />
lower levels compared to 2020. We predict this is because of the<br />
Covid-19 lockdown when people were not allowed to leave their<br />
homes. Therefore, reducing the numbers of cars on the road<br />
From 2014-2019, the air pollution is greater at beginning<br />
of the year. This could be because the colder months generally<br />
find more people using vehicles to get around.
Kathm<strong>and</strong>u, the capital<br />
city of Nepal, is a<br />
‘hotspot’ of urban air<br />
pollution in South Asia.<br />
The reason for this is<br />
partly to do its<br />
geographical location:<br />
it’s found in a bowlshaped<br />
valley which is<br />
surrounded by tall<br />
mountains which trap<br />
urban air pollutants.<br />
Kathm<strong>and</strong>u, Nepal
PM 2.5 measurement -<br />
Kathm<strong>and</strong>u (US Embassy)
PM 2.5 measurement -<br />
Kathm<strong>and</strong>u (US Embassy)
Key findings<br />
●<br />
●<br />
●<br />
●<br />
Far higher pollution levels than recorded for Stevenage<br />
Highest levels of pollution occur in winter months. This could be<br />
because colder air will take longer to rise out of Kathm<strong>and</strong>u<br />
valley<br />
During winter months, pollution is deemed to be a health hazard<br />
for all of the population<br />
2020 appears to goes against the trend of decreasing over time.<br />
This may be due to the Covid-19 p<strong>and</strong>emic when free movement<br />
of people was restricted. Therefore, reducing the numbers of cars<br />
<strong>and</strong> other vehicles on the road.
Poster created by a student<br />
at The Leys Primary<br />
to raise awareness of<br />
climate change
A common narrative we see in public<br />
discussions is that levels of air pollution<br />
are at their highest levels in history.<br />
With continued urbanization, denselypopulated<br />
cities <strong>and</strong> city driving, this<br />
narrative can be easy to believe. But for<br />
rich countries today, such as the UK,<br />
this is far from true. Air pollution levels<br />
today are at some of their lowest levels<br />
in decades.
In the scatterplot opposite we see the comparison of exposure to<br />
PM 2.5 in 1990 (y-axis) <strong>and</strong> exposure in 2017 (x-axis).<br />
Here we see a very strong regional split: pollution levels have fallen<br />
across most of Europe <strong>and</strong> North America whilst pollution has<br />
increased in recent decades across most countries in Asia <strong>and</strong> Africa.
Is climate change real?<br />
There is unequivocal evidence that the Earth is warming at an<br />
unprecedented rate, this includes the following parameters:<br />
• Global temperature is rising<br />
• The oceans are getting warmer<br />
• The ice sheets are shrinking<br />
• Glaciers are retreating<br />
• Sea levels are rising
Yearly global<br />
temperatures from<br />
1880-2023 compared to<br />
the twentieth-century<br />
average. Global average<br />
surface temperature<br />
has risen 0.14 degrees<br />
Fahrenheit per decade<br />
since 1880. The rate of<br />
warming has more than<br />
doubled since 1981.<br />
Data from NOAA NCEI.
Seasonal heat content<br />
in the top half-mile of<br />
the ocean compared to<br />
the 1955-2006 average.<br />
Heat content in the<br />
global ocean has been<br />
above-average (red<br />
bars) since the mid-<br />
1990s. Graph by NOAA<br />
<strong>Climate</strong>.gov, based on<br />
data from NOAA NCEI.
The total area of the<br />
Arctic Ocean that was<br />
at least 15% ice covered<br />
each September from<br />
1979–2023. Since 1980,<br />
the amount of ice that<br />
survives the summer<br />
has declined by 13.1<br />
percent per decade.<br />
Data from the National<br />
Snow <strong>and</strong> Ice Data<br />
Center (NSIDC).
Ice loss relative to 1970<br />
for the glaciers in the<br />
World Glacier<br />
Monitoring Service's<br />
climate reference<br />
network. Including the<br />
preliminary values for<br />
2019-2020, these<br />
glaciers have lost a<br />
volume of ice equivalent<br />
to about 27.5 meters (90<br />
feet) of water spread<br />
out over each glacier.<br />
Data from WGMS.
Seasonal sea level<br />
compared to the 1993-<br />
2008 average, based on<br />
a combination of tide<br />
gauges (light blue) <strong>and</strong><br />
satellite data (darker<br />
blue). In 2020, global<br />
mean sea level hit a<br />
new record high: 91.3<br />
mm (3.6 inches) above<br />
1993 levels. Data from<br />
UHSLC.
Benefits of exercise<br />
The WHO recommends that children aged 5 – 17 should take part in<br />
at least 60 minutes of moderate to vigorous intensity physical<br />
activity every day.<br />
Students from all year groups at The Leys Primary (n = 370) were<br />
asked how they travel to school to determine how much physical<br />
activity this involves.
The survey showed<br />
that less than 60%<br />
of students got<br />
some form of<br />
exercise travelling<br />
to <strong>and</strong> from school.
Examples of<br />
badges made<br />
by students<br />
from The<br />
Leys Primary
Poster created by a student<br />
at The Leys Primary<br />
to raise awareness of<br />
climate change
Impact of exercise<br />
on the circulatory system
Scientific investigation<br />
Pupils then investigated the impact of exercise on heart rate <strong>and</strong><br />
blood pressure.<br />
Students to add the results <strong>and</strong> conclusions from the investigation
Benefits of active travel<br />
Encouraging students to walk, cycle or scooter to school rather<br />
than come by car can help them to become fitter <strong>and</strong> healthier<br />
whilst also addressing the amount of air pollution emitted by cars.
Exercise vs air pollution<br />
When you are physically active, you breathe more often <strong>and</strong><br />
take more air into your lungs than when you are inactive.<br />
If the air quality is poor, you may breathe in a larger amount<br />
of harmful pollutants. In addition, while exercising, you are<br />
more likely to breathe through your<br />
mouth rather than your nose. Unlike<br />
the nose, the mouth is unable to<br />
filter out certain large pollutants in<br />
the air <strong>and</strong> stop them from entering<br />
the lungs. Therefore, breathing<br />
through the mouth can lead to more<br />
pollutants entering the airways <strong>and</strong><br />
potentially damaging the lungs.
Long-term impact of air pollution<br />
Long-term exposure to<br />
polluted air can have<br />
permanent health<br />
effects, including<br />
making people more<br />
susceptible to illness<br />
<strong>and</strong> disease. Many of<br />
these effects may not<br />
become apparent for<br />
many years, but the air<br />
children breathe today<br />
can have a significant<br />
impact on their health<br />
in later life.
What can we do?
Clean Air Day is the UK's largest<br />
campaign on air pollution.<br />
Coordinated by Global Action Plan,<br />
the campaign encourages schools,<br />
businesses <strong>and</strong> communities to find<br />
about more about air pollution <strong>and</strong><br />
show their support for action to<br />
make our air cleaner <strong>and</strong> healthier<br />
for everyone.
This Clean Air Day Thursday 20th June,<br />
take simple actions <strong>and</strong> make a difference!<br />
• Learn: Find out more about how air pollution impacts<br />
our mental, physical <strong>and</strong> planet’s health.<br />
• Act: Walk, wheel or use public transport to reduce<br />
your exposure <strong>and</strong> contribution to air pollution. If you<br />
take the car, try leaving it behind on Clean Air Day <strong>and</strong><br />
one day every week.<br />
• Ask: Get in touch with your local councillor to ask<br />
them to support clean air measures that make it easier<br />
for you to breathe clean air.
45
Local biodiversity study
The students will use iNaturalist to help them identify the plants<br />
<strong>and</strong> animals that are found in <strong>and</strong> around their school<br />
environment whilst also generating data for science<br />
<strong>and</strong> conservation.<br />
They will then investigate the difference types<br />
of species that were found in the UK <strong>and</strong> Nepal<br />
<strong>and</strong> aim to identify similarities <strong>and</strong> differences.
49<br />
Poster created by a student<br />
at The Leys Primary<br />
to raise awareness of<br />
climate change
CREDITS: This presentation template was created by Slidesgo, <strong>and</strong><br />
includes icons by Flaticon <strong>and</strong> infographics & images by Freepik