Prof. Dr. Wolfgang König, Prof. Dr.-Ing. Ralf ... - E-Finance Lab
Prof. Dr. Wolfgang König, Prof. Dr.-Ing. Ralf ... - E-Finance Lab
Prof. Dr. Wolfgang König, Prof. Dr.-Ing. Ralf ... - E-Finance Lab

You also want an ePaper? Increase the reach of your titles
YUMPU automatically turns print PDFs into web optimized ePapers that Google loves.
given QoS constraints in practical application. Referring to<br />
[10], deterministic methods regularly fail to correctly quantify<br />
such risks, specifically if large and complex networks<br />
and workflows, respectively, are concerned.<br />
Thus, regarding our example scenario, an optimization<br />
approach based on deterministic QoS values does not capture<br />
the risk of violating QoS constraints. For instance, if a<br />
selected service experiences unusually high demand, it may<br />
not be able to provide a certain response time, even if a<br />
corresponding bound has been guaranteed by the service<br />
provider. Thus, in turn, an execution plan may not satisfy<br />
the QoS requirements in some cases. The existence of<br />
substantial QoS fluctuations – specifically with respect to<br />
Web service response times – has been empirically shown,<br />
for instance by Rosario et al. [11] and Miede et al. [12]. In<br />
the work at hand, we quantify these inherent risks through<br />
simulation, i.e., repeated “virtual” execution of a workflow.<br />
B. Stochastic QoS Parameters<br />
As previously stated, it is assumed in most related approaches<br />
addressing the SSP that a “hard” – deterministic<br />
– QoS guarantee is specified for each service candidate and<br />
QoS parameter. In order to perform a simulation, we further<br />
assume that probabilistic QoS specifications are available.<br />
In accordance with the notation in Section III-A, Rij, Aij,<br />
and Dij represent random variables for the QoS parameters<br />
response time, availability, and throughput of service j<br />
for task i. These random variables may follow arbitrary<br />
probability distributions. For instance, the response time of<br />
a service may be modeled using a normal distribution, i.e.,<br />
Rij ∼ N(100, 20). For an overview of common probability<br />
distributions, we refer to corresponding compendiums [13].<br />
Probability distributions can be deduced in at least two<br />
principle ways: First, they may be explicitly provided by a<br />
service provider as part of contracted guarantees in terms of<br />
Service Level Agreements (SLA), following the idea of “soft<br />
contracts” [11]. Second, they may be inferred by mining the<br />
monitoring data from past service executions.<br />
C. Execution of the Simulation<br />
For the actual simulation, we virtually execute the previously<br />
computed execution plan a predefined number of<br />
times. In each iteration, we draw a specific realization of<br />
each QoS parameter for each selected service, based on<br />
the given random variables Rij, Aij, and Dij. In addition,<br />
depending on the branching probabilities of XOR-splits, we<br />
draw random variables in order to determine which paths<br />
are actually executed in the current iteration. The realized<br />
values of the individual services are aggregated afterwards<br />
according to the respective workflow structure applying the<br />
aggregation functions from Table I. This way, we compute<br />
the overall QoS values for the whole workflow.<br />
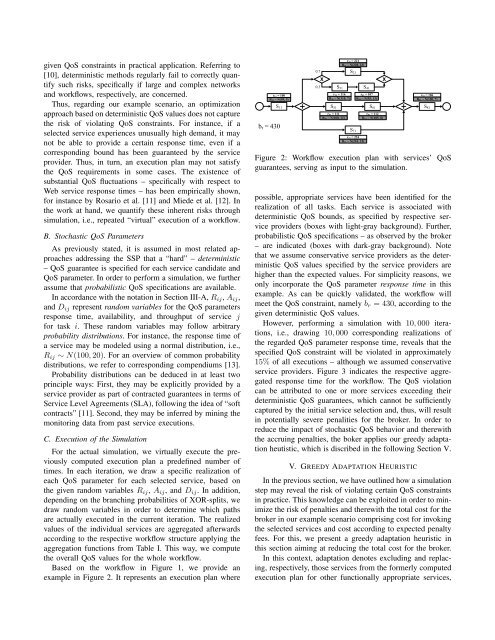
Based on the workflow in Figure 1, we provide an<br />
example in Figure 2. It represents an execution plan where<br />
r11 = 100<br />
R11 ~ N(95, 5)<br />
S11<br />
br = 430<br />
0.7<br />
0.3<br />
S51<br />
S21<br />
X X<br />
S31<br />
r31 = 116<br />
R31 ~ N(110, 7)<br />
r51 = 111<br />
R51 ~ N(100, 12)<br />
r21 = 221<br />
R21 ~ N(220, 23)<br />
S71<br />
r71 = 224<br />
R71 ~ N(210, 15)<br />
S41<br />
r41 = 107<br />
R41 ~ N(95, 13)<br />
S61<br />
r61 = 112<br />
R61 ~ N(105, 8)<br />
r81 = 106<br />
R81 ~ N(100, 7)<br />
Figure 2: Workflow execution plan with services’ QoS<br />
guarantees, serving as input to the simulation.<br />
possible, appropriate services have been identified for the<br />
realization of all tasks. Each service is associated with<br />
deterministic QoS bounds, as specified by respective service<br />
providers (boxes with light-gray background). Further,<br />
probabilistic QoS specifications – as observed by the broker<br />
– are indicated (boxes with dark-gray background). Note<br />
that we assume conservative service providers as the deterministic<br />
QoS values specified by the service providers are<br />
higher than the expected values. For simplicity reasons, we<br />
only incorporate the QoS parameter response time in this<br />
example. As can be quickly validated, the workflow will<br />
meet the QoS constraint, namely br = 430, according to the<br />
given deterministic QoS values.<br />
However, performing a simulation with 10, 000 iterations,<br />
i.e., drawing 10, 000 corresponding realizations of<br />
the regarded QoS parameter response time, reveals that the<br />
specified QoS constraint will be violated in approximately<br />
15% of all executions – although we assumed conservative<br />
service providers. Figure 3 indicates the respective aggregated<br />
response time for the workflow. The QoS violation<br />
can be attributed to one or more services exceeding their<br />
deterministic QoS guarantees, which cannot be sufficiently<br />
captured by the initial service selection and, thus, will result<br />
in potentially severe penalities for the broker. In order to<br />
reduce the impact of stochastic QoS behavior and therewith<br />
the accruing penalties, the boker applies our greedy adaptation<br />
heutistic, which is discribed in the following Section V.<br />
V. GREEDY ADAPTATION HEURISTIC<br />
In the previous section, we have outlined how a simulation<br />
step may reveal the risk of violating certain QoS constraints<br />
in practice. This knowledge can be exploited in order to minimize<br />
the risk of penalties and therewith the total cost for the<br />
broker in our example scenario comprising cost for invoking<br />
the selected services and cost according to expected penalty<br />
fees. For this, we present a greedy adaptation heuristic in<br />
this section aiming at reducing the total cost for the broker.<br />
In this context, adaptation denotes excluding and replacing,<br />
respectively, those services from the formerly computed<br />
execution plan for other functionally appropriate services,<br />
S81