Prof. Dr. Wolfgang König, Prof. Dr.-Ing. Ralf ... - E-Finance Lab
Prof. Dr. Wolfgang König, Prof. Dr.-Ing. Ralf ... - E-Finance Lab
Prof. Dr. Wolfgang König, Prof. Dr.-Ing. Ralf ... - E-Finance Lab

Create successful ePaper yourself
Turn your PDF publications into a flip-book with our unique Google optimized e-Paper software.
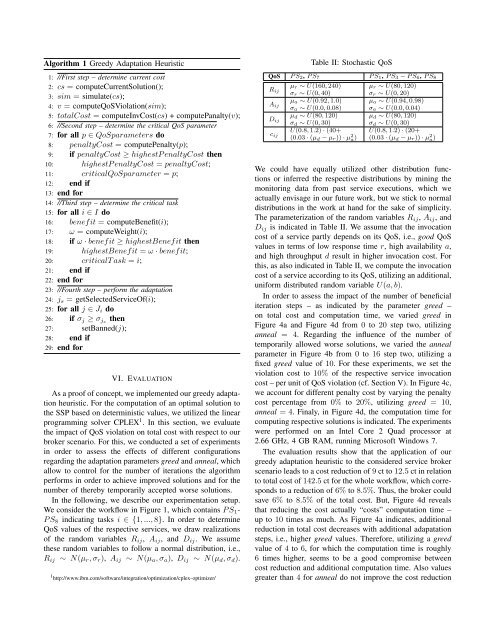
Algorithm 1 Greedy Adaptation Heuristic<br />
1: //First step – determine current cost<br />
2: cs = computeCurrentSolution();<br />
3: sim = simulate(cs);<br />
4: v = computeQoSViolation(sim);<br />
5: totalCost = computeInvCost(cs) + computePanalty(v);<br />
6: //Second step – determine the critical QoS parameter<br />
7: for all p ∈ QoSparameters do<br />
8: penaltyCost = computePenalty(p);<br />
9: if penaltyCost ≥ highestP enaltyCost then<br />
10: highestP enaltyCost = penaltyCost;<br />
11: criticalQoSparameter = p;<br />
12: end if<br />
13: end for<br />
14: //Third step – determine the critical task<br />
15: for all i ∈ I do<br />
16: benefit = computeBenefit(i);<br />
17: ω = computeWeight(i);<br />
18: if ω · benefit ≥ highestBenefit then<br />
19: highestBenefit = ω · benefit;<br />
20: criticalT ask = i;<br />
21: end if<br />
22: end for<br />
23: //Fourth step – perform the adaptation<br />
24: js = getSelectedServiceOf(i);<br />
25: for all j ∈ Ji do<br />
26: if σj ≥ σjs then<br />
27: setBanned(j);<br />
28: end if<br />
29: end for<br />
VI. EVALUATION<br />
As a proof of concept, we implemented our greedy adaptation<br />
heuristic. For the computation of an optimal solution to<br />
the SSP based on deterministic values, we utilized the linear<br />
programming solver CPLEX 1 . In this section, we evaluate<br />
the impact of QoS violation on total cost with respect to our<br />
broker scenario. For this, we conducted a set of experiments<br />
in order to assess the effects of different configurations<br />
regarding the adaptation parameters greed and anneal, which<br />
allow to control for the number of iterations the algorithm<br />
performs in order to achieve improved solutions and for the<br />
number of thereby temporarily accepted worse solutions.<br />
In the following, we describe our experimentation setup.<br />
We consider the workflow in Figure 1, which contains P S1-<br />
P S8 indicating tasks i ∈ {1, ..., 8}. In order to determine<br />
QoS values of the respective services, we draw realizations<br />
of the random variables Rij, Aij, and Dij. We assume<br />
these random variables to follow a normal distribution, i.e.,<br />
Rij ∼ N(µr, σr), Aij ∼ N(µa, σa), Dij ∼ N(µd, σd).<br />
1 http://www.ibm.com/software/integration/optimization/cplex-optimizer/<br />
Table II: Stochastic QoS<br />
QoS P S2, P S7 P S1, P S3 − P S6, P S8<br />
Rij<br />
Aij<br />
Dij<br />
cij<br />
µr ∼ U(160, 240)<br />
σr ∼ U(0, 40)<br />
µa ∼ U(0.92, 1.0)<br />
σa ∼ U(0.0, 0.08)<br />
µd ∼ U(80, 120)<br />
σd ∼ U(0, 30)<br />
U(0.8, 1.2) · (40+<br />
(0.03 · (µd − µr)) · µ 2 a )<br />
µr ∼ U(80, 120)<br />
σr ∼ U(0, 20)<br />
µa ∼ U(0.94, 0.98)<br />
σa ∼ U(0.0, 0.04)<br />
µd ∼ U(80, 120)<br />
σd ∼ U(0, 30)<br />
U(0.8, 1.2) · (20+<br />
(0.03 · (µd − µr)) · µ 2 a )<br />
We could have equally utilized other distribution functions<br />
or inferred the respective distributions by mining the<br />
monitoring data from past service executions, which we<br />
actually envisage in our future work, but we stick to normal<br />
distributions in the work at hand for the sake of simplicity.<br />
The parameterization of the random variables Rij, Aij, and<br />
Dij is indicated in Table II. We assume that the invocation<br />
cost of a service partly depends on its QoS, i.e., good QoS<br />
values in terms of low response time r, high availability a,<br />
and high throughput d result in higher invocation cost. For<br />
this, as also indicated in Table II, we compute the invocation<br />
cost of a service according to its QoS, utilizing an additional,<br />
uniform distributed random variable U(a, b).<br />
In order to assess the impact of the number of beneficial<br />
iteration steps – as indicated by the parameter greed –<br />
on total cost and computation time, we varied greed in<br />
Figure 4a and Figure 4d from 0 to 20 step two, utilizing<br />
anneal = 4. Regarding the influence of the number of<br />
temporarily allowed worse solutions, we varied the anneal<br />
parameter in Figure 4b from 0 to 16 step two, utilizing a<br />
fixed greed value of 10. For these experiments, we set the<br />
violation cost to 10% of the respective service invocation<br />
cost – per unit of QoS violation (cf. Section V). In Figure 4c,<br />
we account for different penalty cost by varying the penalty<br />
cost percentage from 0% to 20%, utilizing greed = 10,<br />
anneal = 4. Finaly, in Figure 4d, the computation time for<br />
computing respective solutions is indicated. The experiments<br />
were performed on an Intel Core 2 Quad processor at<br />
2.66 GHz, 4 GB RAM, running Microsoft Windows 7.<br />
The evaluation results show that the application of our<br />
greedy adaptation heuristic to the considered service broker<br />
scenario leads to a cost reduction of 9 ct to 12.5 ct in relation<br />
to total cost of 142.5 ct for the whole workflow, which corresponds<br />
to a reduction of 6% to 8.5%. Thus, the broker could<br />
save 6% to 8.5% of the total cost. But, Figure 4d reveals<br />
that reducing the cost actually “costs” computation time –<br />
up to 10 times as much. As Figure 4a indicates, additional<br />
reduction in total cost decreases with additional adapatation<br />
steps, i.e., higher greed values. Therefore, utilizing a greed<br />
value of 4 to 6, for which the computation time is roughly<br />
6 times higher, seems to be a good compromise between<br />
cost reduction and additional computation time. Also values<br />
greater than 4 for anneal do not improve the cost reduction