Chondrostoma nasus - Biology Centre of the Academy of Sciences of
Chondrostoma nasus - Biology Centre of the Academy of Sciences of
Chondrostoma nasus - Biology Centre of the Academy of Sciences of

Create successful ePaper yourself
Turn your PDF publications into a flip-book with our unique Google optimized e-Paper software.
Water temperature (ºC)<br />
in Fischa river and Danuba river<br />
Water level Fischa river (cm)<br />
18<br />
16<br />
14<br />
12<br />
10<br />
8<br />
6<br />
4<br />
2<br />
0<br />
700<br />
600<br />
500<br />
400<br />
300<br />
200<br />
100<br />
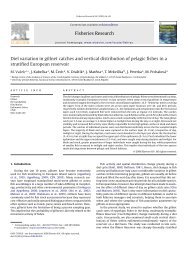
Spawning area<br />
Danube<br />
1 : 1<br />
0 2 4 6 8 10 12 14 16 18<br />
Water temperature (°C)<br />
in <strong>the</strong> confluence Fischa - Danube<br />
Spawning area<br />
Transition area<br />
1 : 1<br />
0<br />
0 100 200 300 400 500 600 700<br />
Water level Danube river (cm)<br />
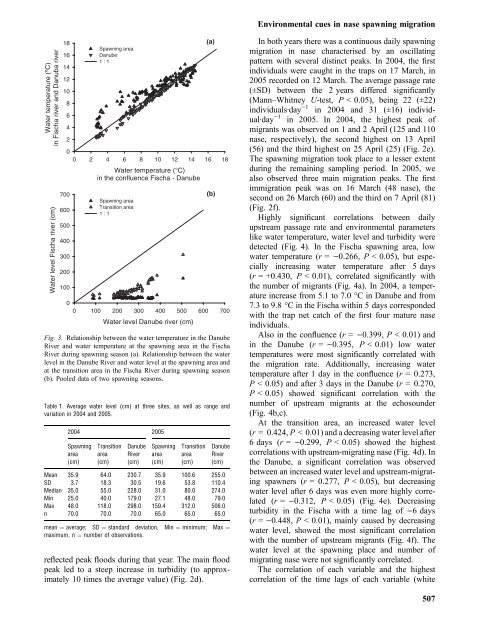
Fig. 3. Relationship between <strong>the</strong> water temperature in <strong>the</strong> Danube<br />
River and water temperature at <strong>the</strong> spawning area in <strong>the</strong> Fischa<br />
River during spawning season (a). Relationship between <strong>the</strong> water<br />
level in <strong>the</strong> Danube River and water level at <strong>the</strong> spawning area and<br />
at <strong>the</strong> transition area in <strong>the</strong> Fischa River during spawning season<br />
(b). Pooled data <strong>of</strong> two spawning seasons.<br />
Table 1. Average water level (cm) at three sites, as well as range and<br />
variation in 2004 and 2005.<br />
2004 2005<br />
Spawning<br />
area<br />
(cm)<br />
Transition<br />
area<br />
(cm)<br />
Danube<br />
River<br />
(cm)<br />
Spawning<br />
area<br />
(cm)<br />
Transition<br />
area<br />
(cm)<br />
reflected peak floods during that year. The main flood<br />
peak led to a steep increase in turbidity (to approximately<br />
10 times <strong>the</strong> average value) (Fig. 2d).<br />
(a)<br />
(b)<br />
Danube<br />
River<br />
(cm)<br />
Mean 35.9 64.0 230.7 35.9 100.6 255.0<br />
SD 3.7 18.3 30.5 19.6 53.8 110.4<br />
Median 35.0 55.0 228.0 31.0 80.0 274.0<br />
Min 25.0 40.0 179.0 27.1 48.0 79.0<br />
Max 48.0 118.0 298.0 159.4 312.0 506.0<br />
n 70.0 70.0 70.0 65.0 65.0 65.0<br />
mean ¼ average; SD ¼ standard deviation, Min ¼ minimum; Max ¼<br />
maximum, n ¼ number <strong>of</strong> observations.<br />
Environmental cues in nase spawning migration<br />
In both years <strong>the</strong>re was a continuous daily spawning<br />
migration in nase characterised by an oscillating<br />
pattern with several distinct peaks. In 2004, <strong>the</strong> first<br />
individuals were caught in <strong>the</strong> traps on 17 March, in<br />
2005 recorded on 12 March. The average passage rate<br />
(±SD) between <strong>the</strong> 2 years differed significantly<br />
(Mann–Whitney U-test, P < 0.05), being 22 (±22)<br />
individualsÆday )1 in 2004 and 31 (±16) individualÆday<br />
)1 in 2005. In 2004, <strong>the</strong> highest peak <strong>of</strong><br />
migrants was observed on 1 and 2 April (125 and 110<br />
nase, respectively), <strong>the</strong> second highest on 13 April<br />
(56) and <strong>the</strong> third highest on 25 April (25) (Fig. 2e).<br />
The spawning migration took place to a lesser extent<br />
during <strong>the</strong> remaining sampling period. In 2005, we<br />
also observed three main migration peaks. The first<br />
immigration peak was on 16 March (48 nase), <strong>the</strong><br />
second on 26 March (60) and <strong>the</strong> third on 7 April (81)<br />
(Fig. 2f).<br />
Highly significant correlations between daily<br />
upstream passage rate and environmental parameters<br />
like water temperature, water level and turbidity were<br />
detected (Fig. 4). In <strong>the</strong> Fischa spawning area, low<br />
water temperature (r =)0.266, P < 0.05), but especially<br />
increasing water temperature after 5 days<br />
(r = +0.430, P < 0.01), correlated significantly with<br />
<strong>the</strong> number <strong>of</strong> migrants (Fig. 4a). In 2004, a temperature<br />
increase from 5.1 to 7.0 °C in Danube and from<br />
7.3 to 9.8 °C in <strong>the</strong> Fischa within 5 days corresponded<br />
with <strong>the</strong> trap net catch <strong>of</strong> <strong>the</strong> first four mature nase<br />
individuals.<br />
Also in <strong>the</strong> confluence (r =)0.399, P < 0.01) and<br />
in <strong>the</strong> Danube (r =)0.395, P < 0.01) low water<br />
temperatures were most significantly correlated with<br />
<strong>the</strong> migration rate. Additionally, increasing water<br />
temperature after 1 day in <strong>the</strong> confluence (r =0.273,<br />
P < 0.05) and after 3 days in <strong>the</strong> Danube (r =0.270,<br />
P < 0.05) showed significant correlation with <strong>the</strong><br />
number <strong>of</strong> upstream migrants at <strong>the</strong> echosounder<br />
(Fig. 4b,c).<br />
At <strong>the</strong> transition area, an increased water level<br />
(r =0.424, P < 0.01) and a decreasing water level after<br />
6 days (r =)0.299, P < 0.05) showed <strong>the</strong> highest<br />
correlations with upstream-migrating nase (Fig. 4d). In<br />
<strong>the</strong> Danube, a significant correlation was observed<br />
between an increased water level and upstream-migrating<br />
spawners (r =0.277, P < 0.05), but decreasing<br />
water level after 6 days was even more highly correlated<br />
(r =)0.312, P < 0.05) (Fig. 4e). Decreasing<br />
turbidity in <strong>the</strong> Fischa with a time lag <strong>of</strong> )6 days<br />
(r = )0.448, P < 0.01), mainly caused by decreasing<br />
water level, showed <strong>the</strong> most significant correlation<br />
with <strong>the</strong> number <strong>of</strong> upstream migrants (Fig. 4f). The<br />
water level at <strong>the</strong> spawning place and number <strong>of</strong><br />
migrating nase were not significantly correlated.<br />
The correlation <strong>of</strong> each variable and <strong>the</strong> highest<br />
correlation <strong>of</strong> <strong>the</strong> time lags <strong>of</strong> each variable (white<br />
507