An introduction to power and sample size estimation
An introduction to power and sample size estimation
An introduction to power and sample size estimation

Create successful ePaper yourself
Turn your PDF publications into a flip-book with our unique Google optimized e-Paper software.
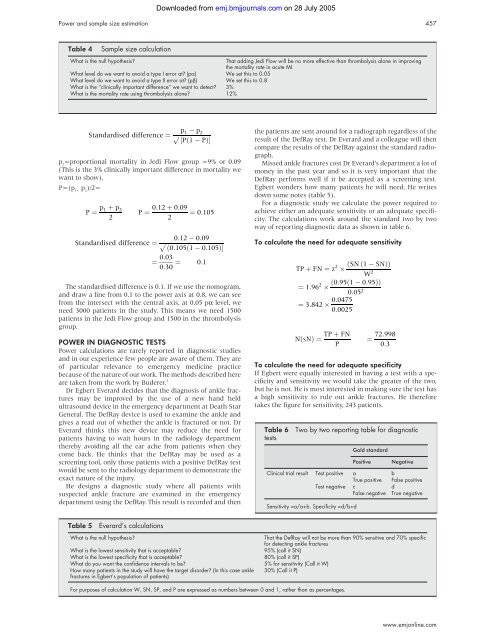
Table 4 Sample <strong>size</strong> calculation<br />
What is the null hypothesis? That adding Jedi Flow will be no more effective than thrombolysis alone in improving<br />
the mortality rate in acute MI.<br />
What level do we want <strong>to</strong> avoid a type I error at? (pα) We set this <strong>to</strong> 0.05<br />
What level do we want <strong>to</strong> avoid a type II error at? (pβ) We set this <strong>to</strong> 0.8<br />
What is the “clinically important difference” we want <strong>to</strong> detect? 3%<br />
What is the mortality rate using thrombolysis alone? 12%<br />
p2=proportional mortality in Jedi Flow group =9% or 0.09<br />
(This is the 3% clinically important difference in mortality we<br />
want <strong>to</strong> show).<br />
P=(p1+ p2)/2= The st<strong>and</strong>ardised difference is 0.1. If we use the nomogram,<br />
<strong>and</strong> draw a line from 0.1 <strong>to</strong> the <strong>power</strong> axis at 0.8, we can see<br />
from the intersect with the central axis, at 0.05 pα level, we<br />
need 3000 patients in the study. This means we need 1500<br />
patients in the Jedi Flow group <strong>and</strong> 1500 in the thrombolysis<br />
group.<br />
POWER IN DIAGNOSTIC TESTS<br />
Power calculations are rarely reported in diagnostic studies<br />
<strong>and</strong> in our experience few people are aware of them. They are<br />
of particular relevance <strong>to</strong> emergency medicine practice<br />
because of the nature of our work. The methods described here<br />
are taken from the work by Buderer. 3<br />
Dr Egbert Everard decides that the diagnosis of ankle fractures<br />
may be improved by the use of a new h<strong>and</strong> held<br />
ultrasound device in the emergency department at Death Star<br />
General. The DefRay device is used <strong>to</strong> examine the ankle <strong>and</strong><br />
gives a read out of whether the ankle is fractured or not. Dr<br />
Everard thinks this new device may reduce the need for<br />
patients having <strong>to</strong> wait hours in the radiology department<br />
thereby avoiding all the ear ache from patients when they<br />
come back. He thinks that the DefRay may be used as a<br />
screening <strong>to</strong>ol, only those patients with a positive DefRay test<br />
would be sent <strong>to</strong> the radiology department <strong>to</strong> demonstrate the<br />
exact nature of the injury.<br />
He designs a diagnostic study where all patients with<br />
suspected ankle fracture are examined in the emergency<br />
department using the DefRay. This result is recorded <strong>and</strong> then<br />
Table 5 Everard’s calculations<br />
Downloaded from<br />
emj.bmjjournals.com on 28 July 2005<br />
Power <strong>and</strong> <strong>sample</strong> <strong>size</strong> <strong>estimation</strong> 457<br />
the patients are sent around for a radiograph regardless of the<br />
result of the DefRay test. Dr Everard <strong>and</strong> a colleague will then<br />
compare the results of the DefRay against the st<strong>and</strong>ard radiograph.<br />
Missed ankle fractures cost Dr Everard’s department a lot of<br />
money in the past year <strong>and</strong> so it is very important that the<br />
DefRay performs well if it be accepted as a screening test.<br />
Egbert wonders how many patients he will need. He writes<br />
down some notes (table 5).<br />
For a diagnostic study we calculate the <strong>power</strong> required <strong>to</strong><br />
achieve either an adequate sensitivity or an adequate specificity.<br />
The calculations work around the st<strong>and</strong>ard two by two<br />
way of reporting diagnostic data as shown in table 6.<br />
To calculate the need for adequate sensitivity<br />
To calculate the need for adequate specificity<br />
If Egbert were equally interested in having a test with a specificity<br />
<strong>and</strong> sensitivity we would take the greater of the two,<br />
but he is not. He is most interested in making sure the test has<br />
a high sensitivity <strong>to</strong> rule out ankle fractures. He therefore<br />
takes the figure for sensitivity, 243 patients.<br />
Table 6 Two by two reporting table for diagnostic<br />
tests<br />
Gold st<strong>and</strong>ard<br />
Positive Negative<br />
Clinical trial result Test positive a b<br />
True positive False positive<br />
Test negative c d<br />
False negative True negative<br />
Sensitivity =a/a+b. Specificity =d/b+d<br />
What is the null hypothesis? That the DefRay will not be more than 90% sensitive <strong>and</strong> 70% specific<br />
for detecting ankle fractures<br />
What is the lowest sensitivity that is acceptable? 95% (call it SN)<br />
What is the lowest specificity that is acceptable? 80% (call it SP)<br />
What do you want the confidence intervals <strong>to</strong> be? 5% for sensitivity (Call it W)<br />
How many patients in the study will have the target disorder? (In this case ankle<br />
fractures in Egbert’s population of patients)<br />
30% (Call it P)<br />
For purposes of calculation W, SN, SP, <strong>and</strong> P are expressed as numbers between 0 <strong>and</strong> 1, rather than as percentages.<br />
www.emjonline.com