Basem Ahmed Zoheir_Barramiya, OGR_2011.pdf
Basem Ahmed Zoheir_Barramiya, OGR_2011.pdf
Basem Ahmed Zoheir_Barramiya, OGR_2011.pdf

Create successful ePaper yourself
Turn your PDF publications into a flip-book with our unique Google optimized e-Paper software.
homogenization temperatures exclude fluid immiscibility as an entrapment<br />
mechanism of the investigated fluid inclusions (cf. Ramboz et al.,<br />
1982; Touret, 2001). Post-entrapment modifications may also account<br />
for the heterogeneous state and the observed variations of the studied<br />
inclusions (Crawford and Hollister, 1986; Huizenga and Touret, 1999).<br />
Although inclusions clearly showing textures of post-entrapment<br />
modification were avoided in measurements, there is microstructural<br />
evidence of recrystallization and grain boundary migration of the host<br />
quartz. It is therefore suggested that post-entrapment modifications are<br />
likely responsible for variations in the fluid inclusion populations in the<br />
quartz lodes.<br />
7.4. Sulfur isotope values<br />
Sulfur isotope values of disseminated pyrite and arsenopyrite<br />
in quartz veins and adjacent intensely altered wallrocks are shown<br />
in Fig. 10. Generally, most of the values fall within a relatively<br />
narrow range, suggesting simple metallogenic history of the<br />
<strong>Barramiya</strong> gold deposit. The calculated δ 34 S values of H 2S in some<br />
sulfides range between −6.6 and 3.2‰ (Table 5) using temperatures<br />
of the fluid inclusions and applying the equations proposed by<br />
Ohmoto and Rye (1979). The relative homogeneity of the isotopic<br />
data likely implies isotopic equilibrium conditions at the scale of<br />
the mineralized quartz veins. The relatively narrow range of δ 34 SΣs<br />
B. <strong>Zoheir</strong>, B. Lehmann / Ore Geology Reviews 39 (2011) 101–115<br />
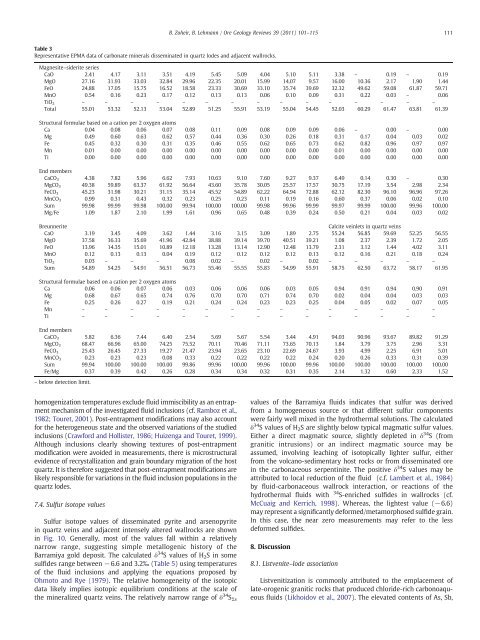
Table 3<br />
Representative EPMA data of carbonate minerals disseminated in quartz lodes and adjacent wallrocks.<br />
Magnesite–siderite series<br />
CaO 2.41 4.17 3.11 3.51 4.19 5.45 5.09 4.04 5.10 5.11 3.38 – 0.19 – 0.19<br />
MgO 27.16 31.93 33.03 32.84 29.96 22.35 20.01 15.99 14.07 9.57 16.00 10.36 2.17 1.90 1.44<br />
FeO 24.88 17.05 15.75 16.52 18.58 23.33 30.69 33.10 35.74 39.69 32.32 49.62 59.08 61.87 59.71<br />
MnO 0.54 0.16 0.23 0.17 0.12 0.13 0.13 0.06 0.10 0.09 0.31 0.22 0.03 – 0.06<br />
TiO 2 – – – – – – – – – – – – – – –<br />
Total 55.01 53.32 52.13 53.04 52.89 51.25 55.91 53.19 55.04 54.45 52.03 60.29 61.47 63.81 61.39<br />
Structural formulae based on a cation per 2 oxygen atoms<br />
Ca 0.04 0.08 0.06 0.07 0.08 0.11 0.09 0.08 0.09 0.09 0.06 – 0.00 – 0.00<br />
Mg 0.49 0.60 0.63 0.62 0.57 0.44 0.36 0.30 0.26 0.18 0.31 0.17 0.04 0.03 0.02<br />
Fe 0.45 0.32 0.30 0.31 0.35 0.46 0.55 0.62 0.65 0.73 0.62 0.82 0.96 0.97 0.97<br />
Mn 0.01 0.00 0.00 0.00 0.00 0.00 0.00 0.00 0.00 0.00 0.01 0.00 0.00 0.00 0.00<br />
Ti 0.00 0.00 0.00 0.00 0.00 0.00 0.00 0.00 0.00 0.00 0.00 0.00 0.00 0.00 0.00<br />
End members<br />
CaCO3 4.38 7.82 5.96 6.62 7.93 10.63 9.10 7.60 9.27 9.37 6.49 0.14 0.30 – 0.30<br />
MgCO3 49.38 59.89 63.37 61.92 56.64 43.60 35.78 30.05 25.57 17.57 30.75 17.19 3.54 2.98 2.34<br />
FeCO3 45.23 31.98 30.21 31.15 35.14 45.52 54.89 62.22 64.94 72.88 62.12 82.30 96.10 96.96 97.26<br />
MnCO3 0.99 0.31 0.43 0.32 0.23 0.25 0.23 0.11 0.19 0.16 0.60 0.37 0.06 0.02 0.10<br />
Sum 99.98 99.99 99.98 100.00 99.94 100.00 100.00 99.98 99.96 99.99 99.97 99.99 100.00 99.96 100.00<br />
Mg/Fe 1.09 1.87 2.10 1.99 1.61 0.96 0.65 0.48 0.39 0.24 0.50 0.21 0.04 0.03 0.02<br />
Breunnerite Calcite veinlets in quartz veins<br />
CaO 3.19 3.45 4.09 3.62 1.44 3.16 3.15 3.09 1.89 2.75 55.24 56.85 59.69 52.25 56.55<br />
MgO 37.58 36.33 35.69 41.96 42.84 38.88 39.14 39.70 40.51 39.21 1.08 2.37 2.39 1.72 2.05<br />
FeO 13.96 14.35 15.01 10.89 12.18 13.28 13.14 12.90 12.48 13.79 2.31 3.12 1.44 4.02 3.11<br />
MnO 0.12 0.13 0.13 0.04 0.19 0.12 0.12 0.12 0.12 0.13 0.12 0.16 0.21 0.18 0.24<br />
TiO 2 0.03 – – – 0.08 0.02 – 0.02 – 0.02 – – – – –<br />
Sum 54.89 54.25 54.91 56.51 56.73 55.46 55.55 55.83 54.99 55.91 58.75 62.50 63.72 58.17 61.95<br />
Structural formulae based on a cation per 2 oxygen atoms<br />
Ca 0.06 0.06 0.07 0.06 0.03 0.06 0.06 0.06 0.03 0.05 0.94 0.91 0.94 0.90 0.91<br />
Mg 0.68 0.67 0.65 0.74 0.76 0.70 0.70 0.71 0.74 0.70 0.02 0.04 0.04 0.03 0.03<br />
Fe 0.25 0.26 0.27 0.19 0.21 0.24 0.24 0.23 0.23 0.25 0.04 0.05 0.02 0.07 0.05<br />
Mn – – – – – – – – – – – – – – –<br />
Ti – – – – – – – – – – – – – – –<br />
End members<br />
CaCO3 5.82 6.36 7.44 6.40 2.54 5.69 5.67 5.54 3.44 4.91 94.03 90.96 93.67 89.82 91.29<br />
MgCO3 68.47 66.96 65.00 74.25 75.52 70.11 70.46 71.11 73.65 70.13 1.84 3.79 3.75 2.96 3.31<br />
FeCO3 25.43 26.45 27.33 19.27 21.47 23.94 23.65 23.10 22.69 24.67 3.93 4.99 2.25 6.91 5.01<br />
MnCO3 0.23 0.23 0.23 0.08 0.33 0.22 0.22 0.22 0.22 0.24 0.20 0.26 0.33 0.31 0.39<br />
Sum 99.94 100.00 100.00 100.00 99.86 99.96 100.00 99.96 100.00 99.96 100.00 100.00 100.00 100.00 100.00<br />
Fe/Mg 0.37 0.39 0.42 0.26 0.28 0.34 0.34 0.32 0.31 0.35 2.14 1.32 0.60 2.33 1.52<br />
– below detection limit.<br />
values of the <strong>Barramiya</strong> fluids indicates that sulfur was derived<br />
from a homogeneous source or that different sulfur components<br />
were fairly well mixed in the hydrothermal solutions. The calculated<br />
δ 34 S values of H 2S are slightly below typical magmatic sulfur values.<br />
Either a direct magmatic source, slightly depleted in δ 34 S (from<br />
granitic intrusions) or an indirect magmatic source may be<br />
assumed, involving leaching of isotopically lighter sulfur, either<br />
from the volcano-sedimentary host rocks or from disseminated ore<br />
in the carbonaceous serpentinite. The positive δ 34 S values may be<br />
attributed to local reduction of the fluid (c.f. Lambert et al., 1984)<br />
by fluid-carbonaceous wallrock interaction, or reactions of the<br />
hydrothermal fluids with 34 S-enriched sulfides in wallrocks (cf.<br />
McCuaig and Kerrich, 1998). Whereas, the lightest value (−6.6)<br />
may represent a significantly deformed/metamorphosed sulfide grain.<br />
In this case, the near zero measurements may refer to the less<br />
deformed sulfides.<br />
8. Discussion<br />
8.1. Listvenite–lode association<br />
Listvenitization is commonly attributed to the emplacement of<br />
late-orogenic granitic rocks that produced chloride-rich carbonoaqueous<br />
fluids (Likhoidov et al., 2007). The elevated contents of As, Sb,<br />
111