Basem Ahmed Zoheir_Barramiya, OGR_2011.pdf
Basem Ahmed Zoheir_Barramiya, OGR_2011.pdf
Basem Ahmed Zoheir_Barramiya, OGR_2011.pdf

Create successful ePaper yourself
Turn your PDF publications into a flip-book with our unique Google optimized e-Paper software.
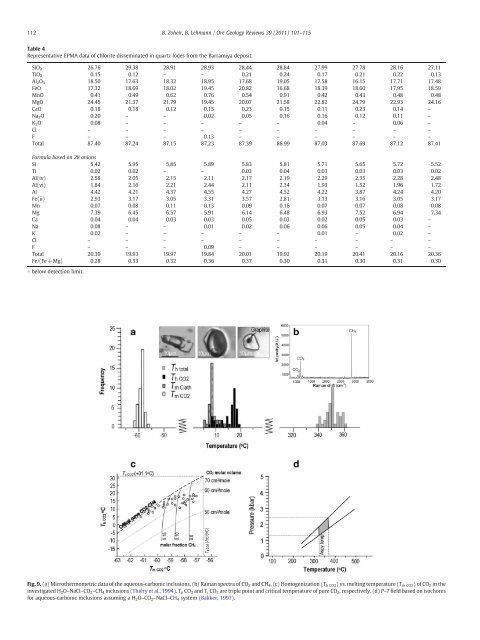
112 B. <strong>Zoheir</strong>, B. Lehmann / Ore Geology Reviews 39 (2011) 101–115<br />
Table 4<br />
Representative EPMA data of chlorite disseminated in quartz lodes from the <strong>Barramiya</strong> deposit.<br />
SiO2 26.76 29.38 28.91 28.93 28.44 28.84 27.99 27.78 28.16 27.11<br />
TiO2 0.15 0.12 – – 0.21 0.24 0.17 0.21 0.22 0.13<br />
Al 2O 3 18.50 17.63 18.32 18.95 17.68 19.05 17.58 16.15 17.71 17.48<br />
FeO 17.32 18.69 18.02 19.45 20.82 16.68 18.39 18.60 17.95 18.59<br />
MnO 0.41 0.49 0.62 0.76 0.54 0.91 0.42 0.43 0.48 0.48<br />
MgO 24.45 21.37 21.79 19.45 20.07 21.58 22.82 24.79 22.93 24.16<br />
CaO 0.18 0.18 0.12 0.15 0.23 0.15 0.11 0.23 0.14 –<br />
Na 2O 0.20 – – 0.02 0.05 0.16 0.16 0.12 0.11 –<br />
K2O 0.08 – – – – – 0.04 – 0.06 –<br />
Cl – – – – – – – – – –<br />
F – – – 0.13 – – – – – –<br />
Total 87.40 87.24 87.15 87.23 87.39 86.99 87.03 87.69 87.12 87.41<br />
Formula based on 28 anions<br />
Si 5.42 5.95 5.85 5.89 5.83 5.81 5.71 5.65 5.72 5.52<br />
Ti 0.02 0.02 – – 0.03 0.04 0.03 0.03 0.03 0.02<br />
Al(iv) 2.58 2.05 2.15 2.11 2.17 2.19 2.29 2.35 2.28 2.48<br />
Al(vi) 1.84 2.16 2.21 2.44 2.11 2.34 1.93 1.52 1.96 1.72<br />
Al 4.42 4.21 4.37 4.55 4.27 4.52 4.22 3.87 4.24 4.20<br />
Fe(ii) 2.93 3.17 3.05 3.31 3.57 2.81 3.13 3.16 3.05 3.17<br />
Mn 0.07 0.08 0.11 0.13 0.09 0.16 0.07 0.07 0.08 0.08<br />
Mg 7.39 6.45 6.57 5.91 6.14 6.48 6.93 7.52 6.94 7.34<br />
Ca 0.04 0.04 0.03 0.03 0.05 0.03 0.02 0.05 0.03 –<br />
Na 0.08 – – 0.01 0.02 0.06 0.06 0.05 0.04 –<br />
K 0.02 – – – – – 0.01 – 0.02 –<br />
Cl – – – – – – – – – –<br />
F – – – 0.09 – – – – – –<br />
Total 20.39 19.93 19.97 19.84 20.01 19.92 20.19 20.41 20.16 20.36<br />
Fe/(Fe +Mg)<br />
– below detection limit.<br />
0.28 0.33 0.32 0.36 0.37 0.30 0.31 0.30 0.31 0.30<br />
Fig. 9. (a) Microthermometric data of the aqueous-carbonic inclusions, (b) Raman spectra of CO2 and CH4, (c) Homogenization (Th CO2) vs. melting temperature (Tm CO2)ofCO2 in the<br />
investigated H 2O–NaCl–CO 2–CH 4 inclusions (Thiéry et al., 1994). T p CO 2 and T c CO 2 are triple point and critical temperature of pure CO 2, respectively, (d) P–T field based on isochores<br />
for aqueous-carbonic inclusions assuming a H 2O–CO 2–NaCl–CH 4 system (Bakker, 1997).