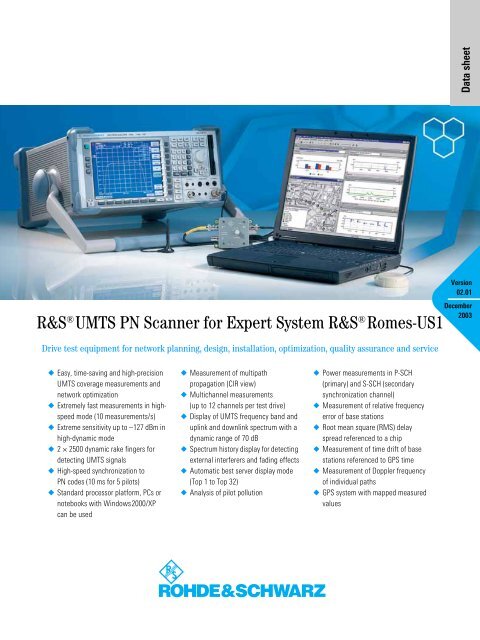
R&S UMTS PN Scanner for Expert System R&S Romes-US1 - Isotest
R&S UMTS PN Scanner for Expert System R&S Romes-US1 - Isotest
R&S UMTS PN Scanner for Expert System R&S Romes-US1 - Isotest

You also want an ePaper? Increase the reach of your titles
YUMPU automatically turns print PDFs into web optimized ePapers that Google loves.
◆ Easy, time-saving and high-precision<br />
<strong>UMTS</strong> coverage measurements and<br />
network optimization<br />
◆ Extremely fast measurements in highspeed<br />
mode (10 measurements/s)<br />
◆ Extreme sensitivity up to –127 dBm in<br />
high-dynamic mode<br />
◆ 2 × 2500 dynamic rake fingers <strong>for</strong><br />
detecting <strong>UMTS</strong> signals<br />
◆ High-speed synchronization to<br />
<strong>PN</strong> codes (10 ms <strong>for</strong> 5 pilots)<br />
◆ Standard processor plat<strong>for</strong>m, PCs or<br />
notebooks with Windows 2000/XP<br />
can be used<br />
◆ Measurement of multipath<br />
propagation (CIR view)<br />
◆ Multichannel measurements<br />
(up to 12 channels per test drive)<br />
◆ Display of <strong>UMTS</strong> frequency band and<br />
uplink and downlink spectrum with a<br />
dynamic range of 70 dB<br />
◆ Spectrum history display <strong>for</strong> detecting<br />
external interferers and fading effects<br />
◆ Automatic best server display mode<br />
(Top 1 to Top 32)<br />
◆ Analysis of pilot pollution<br />
◆ Power measurements in P-SCH<br />
(primary) and S-SCH (secondary<br />
synchronization channel)<br />
◆ Measurement of relative frequency<br />
error of base stations<br />
◆ Root mean square (RMS) delay<br />
spread referenced to a chip<br />
◆ Measurement of time drift of base<br />
stations referenced to GPS time<br />
◆ Measurement of Doppler frequency<br />
of individual paths<br />
◆ GPS system with mapped measured<br />
values<br />
Data sheet<br />
Version<br />
02.01<br />
December<br />
2003<br />
R&S ® <strong>UMTS</strong> <strong>PN</strong> <strong>Scanner</strong> <strong>for</strong> <strong>Expert</strong> <strong>System</strong> R&S ® <strong>Romes</strong>-<strong>US1</strong><br />
Drive test equipment <strong>for</strong> network planning, design, installation, optimization, quality assurance and service
<strong>PN</strong> scanners reduce problems in<br />
<strong>UMTS</strong> networks<br />
Pseudo random noise code scanners (<strong>PN</strong><br />
scanners) are used to closely analyze the<br />
reception conditions in a 3GPP network.<br />
By means of the measured data, network<br />
operators can quickly detect errors in<br />
planning and setup, eliminate them and<br />
also refine their planning tools. Pilot<br />
pollution can be caused by a number of<br />
factors, e.g. uneven terrain or bridges and<br />
overpasses that are covered by too many<br />
transmitter stations at the same time and<br />
on the same RF channel. Despite high<br />
field strength, connection is poor<br />
because of co-channel interference. In<br />
these situations, <strong>UMTS</strong> is more tolerant<br />
than GSM – interference does not lead to<br />
disconnection, only to a reduced data<br />
rate. This, however, causes additional<br />
load on the radio channel. To maintain<br />
the minimum transmission rate, transmit<br />
power is increased and handovers are<br />
made to the base stations with the best<br />
reception in this area. Since the desired<br />
characteristic, best server, is only of short<br />
duration with pilot pollution, handovers<br />
that tie up further precious channel<br />
resources occur frequently. By adjusting<br />
cell size parameters or aligning a few<br />
antennas, pilot pollution can often be<br />
eliminated by means of the measurement<br />
data from <strong>PN</strong> scanners, thus enabling<br />
better use of the limited frequency band<br />
and increasing the average data rate.<br />
Advantages of the ¸<strong>UMTS</strong> <strong>PN</strong><br />
<strong>Scanner</strong> <strong>Expert</strong> system<br />
◆ Universal RF frontend, spectrum<br />
analyzer or test receiver<br />
◆ No authorization, e.g. by SIM card,<br />
required <strong>for</strong> measuring<br />
◆ Versatile indoor and outdoor<br />
applications<br />
◆ Future-proof owing to modular<br />
¸ROMES control software<br />
◆ In<strong>for</strong>mative displays <strong>for</strong> online<br />
analysis such as X/Y diagram, table,<br />
statistics, map display, plus specific<br />
<strong>UMTS</strong> displays<br />
2 R&S ® <strong>UMTS</strong> <strong>PN</strong> <strong>Scanner</strong> <strong>for</strong> <strong>Expert</strong> <strong>System</strong> R&S ® <strong>Romes</strong>-<strong>US1</strong><br />
Tracer view configuration<br />
◆ Universal test concept; combinable<br />
with test receivers <strong>for</strong> pure CW<br />
measurement tasks and with test<br />
mobiles <strong>for</strong> CDMA, GSM/GPRS<br />
◆ Post Processing Tool ¸RODAS <strong>for</strong><br />
processing individual, regional or<br />
nationwide measurement data from<br />
<strong>UMTS</strong> or other technologies<br />
Rohde & Schwarz has developed this<br />
instrument to achieve highest quality and<br />
customer satisfaction. The minimum<br />
necessary components are<br />
◆ Test Receiver ¸ESPI or Spectrum<br />
Analyzer ¸FSP/FSU<br />
◆ ¸ROMES network optimization<br />
software with ¸<strong>UMTS</strong> <strong>PN</strong> <strong>Scanner</strong><br />
module<br />
◆ GPS with PPS pulse and/or<br />
synchronization unit <strong>for</strong> triggering<br />
◆ PC or notebook<br />
The principle behind this analyzer is<br />
different from that of all other currently<br />
available products. Ordinary <strong>PN</strong> scanners<br />
use the standard technology of mobile<br />
telephones by means of regular, hardware-based<br />
rake receivers. To fulfill the<br />
real requirements <strong>for</strong> interference analysis<br />
in <strong>UMTS</strong>, Rohde & Schwarz has<br />
replaced this principle by developing<br />
dynamic rake receivers. These dynamic<br />
rake receivers are capable of tracing up to<br />
5000 different signal propagation paths<br />
leading to max. 2500 node B simultaneously,<br />
while static rake receivers allow<br />
the tracing only of 4 or 8 paths.<br />
With this technology, the ¸<strong>UMTS</strong> <strong>PN</strong><br />
<strong>Scanner</strong> can synchronize on <strong>UMTS</strong> base<br />
stations with unprecedented speed,<br />
accuracy and dynamic range. Future<br />
development will include a 3GPP telephone<br />
(commercial and with trace function)<br />
to add smart control. The<br />
¸<strong>UMTS</strong> <strong>PN</strong> <strong>Scanner</strong> is part of the<br />
extensive ¸ROMES software plat<strong>for</strong>m,<br />
which supports simultaneous measurement<br />
and analysis within different<br />
wireless network technologies. Measurement<br />
data is stored together with positioning<br />
and timing in<strong>for</strong>mation, <strong>for</strong> replay
or detailed analysis and subsequent processing.<br />
SC (scrambling code) trace view<br />
To trace certain characteristics in the<br />
reception of one scrambling code from<br />
one node B, the SC trace view has been<br />
implemented in the ¸<strong>UMTS</strong> <strong>PN</strong><br />
<strong>Scanner</strong>. This view shows the channel<br />
impulse response (CIR) on one scrambling<br />
code, in a 2D chart and in a waterfall<br />
diagram, <strong>for</strong> analysis of propagation<br />
channels varying over time. Particularly<br />
the waterfall diagram gives insight into<br />
all reflections and interferers <strong>for</strong> a node<br />
B. It is possible to open multiple scrambling<br />
code trace views, as many as are<br />
necessary <strong>for</strong> a test drive. Otherwise one<br />
of the Top N scrambling codes of the<br />
CPICH view will be displayed. In addition,<br />
the tracer view can be configured with<br />
<strong>UMTS</strong> measurement and<br />
spectrum settings<br />
different colours to customize the displays<br />
as needed.<br />
RF spectrum view<br />
The display of RF spectra provides important<br />
in<strong>for</strong>mation about signal characteristics,<br />
particularly fading effects and interferers<br />
on co- or adjacent channels. The<br />
¸<strong>UMTS</strong> <strong>PN</strong> <strong>Scanner</strong> uses the spectrum<br />
analyzer functions of the ¸ESPI<br />
or ¸FSP/FSU to make different types<br />
of spectra available. It is possible to fully<br />
configure two independent spectrum displays.<br />
The spectra can, <strong>for</strong> example, show<br />
the uplink and downlink channels, or the<br />
complete <strong>UMTS</strong> DL band and one uplink<br />
Spectrum display of<br />
<strong>UMTS</strong> band – uplink<br />
and downlink<br />
channel. The update rates can be set by<br />
the operator, independent from each<br />
other.<br />
Spectrum history view<br />
For even better analysis, the spectrum<br />
history view is available. It shows more<br />
than just the current spectrum. A<br />
coloured waterfall diagram makes it easy<br />
to observe the spectrum development<br />
during the drive test. Fading effects on<br />
different channels as well as specific incidents<br />
can be seen. One extremely important<br />
aspect shown on this display is the<br />
detection of external (i.e. non-<strong>UMTS</strong>)<br />
interference, which can be determined<br />
easily. Like all other displays the spectrum<br />
history display can be configured,<br />
separately <strong>for</strong> uplink and downlink.<br />
R&S ® <strong>UMTS</strong> <strong>PN</strong> <strong>Scanner</strong> <strong>for</strong> <strong>Expert</strong> <strong>System</strong> R&S ® <strong>Romes</strong>-<strong>US1</strong> 3
Pilot view<br />
The pilot view shows all pilots found at<br />
the measurement point together with a<br />
history of previously measured pilots <strong>for</strong><br />
some time. The view has two display<br />
modes. The Min-Max-Average-Current<br />
mode shows the minimum, the maximum,<br />
the average and the current value<br />
of the RSCP of the scrambling code. The<br />
Bar mode shows the RSCP in the<br />
standard <strong>for</strong>m.<br />
Top N view<br />
For various optimization and verification<br />
measurements, a configurable display<br />
that automatically sorts the best values is<br />
very useful. The Top N view has these<br />
capabilities and permits the selection and<br />
display of the best server(s). See also the<br />
configuration settings <strong>for</strong> Top N views.<br />
Standard views<br />
In addition to the special ¸<strong>UMTS</strong> <strong>PN</strong><br />
<strong>Scanner</strong> views, the measured data (E c /I 0 ,<br />
SIR, RSCP, ISCP and power) can be displayed<br />
in the ¸ROMES standard<br />
views, e.g. alphanumeric view, 2D chart<br />
view and route track view.<br />
Frequency selection concept<br />
Since the system is able to analyze <strong>UMTS</strong><br />
signals in different frequency bands<br />
within one measurement section, all<br />
<strong>UMTS</strong> network in<strong>for</strong>mation views are<br />
with multiple views headlines and synchronized<br />
with one frequency selection<br />
bar. Each (multiple) view may be opened<br />
<strong>for</strong> different instances, and each instance<br />
may be configured separately. A frequency<br />
selection bar is available <strong>for</strong><br />
simultaneously switching all views with<br />
the same instance number to a selected<br />
frequency. It is possible to display measurement<br />
results of different frequency<br />
bands within multiple instances of <strong>UMTS</strong><br />
network in<strong>for</strong>mation views in parallel. By<br />
means of a single mouse click, the user<br />
can also open only one instance of different<br />
views and examine all views with reference<br />
to one measured frequency band.<br />
4 R&S ® <strong>UMTS</strong> <strong>PN</strong> <strong>Scanner</strong> <strong>for</strong> <strong>Expert</strong> <strong>System</strong> R&S ® <strong>Romes</strong>-<strong>US1</strong><br />
Pilot view (average, min, max, current)<br />
2D chart view <strong>for</strong> RSCP<br />
Route track module with GPS status info display
<strong>UMTS</strong> receiver settings <strong>for</strong> ¸ESPI or ¸FSP/FSU<br />
Top N view, E c/I o sorted<br />
Top N view, RSCP sorted<br />
When measurement results relating to<br />
different frequencies can be viewed such<br />
as in the spectrum, Top N or trace view,<br />
the frequency bar is switched to either<br />
"inactive" or "not implemented".<br />
<strong>UMTS</strong> receiver settings<br />
Only a few receiver settings need to be<br />
require the mere setting of<br />
◆ Type of receiver<br />
(Test Receiver ¸ESPI or Spectrum<br />
Analyzers ¸FSP/FSU)<br />
◆ Type of connection (LAN or IEEE<br />
488.2)<br />
◆ Selected frequency bands and<br />
provider name<br />
◆ New frequency bands and provider<br />
names, if needed<br />
◆ Simulation mode on/off<br />
All other relevant parameters will automatically<br />
be set to their optimum values<br />
◆ Minimum measurement interval<br />
in slots<br />
◆ Number of slots used<br />
◆ Number of rakes<br />
◆ Total dynamic range<br />
◆ Maximum peak dynamic range<br />
◆ Total dynamic range <strong>for</strong> code<br />
◆ Maximum peak dynamic range<br />
<strong>for</strong> code<br />
◆ Sample distance <strong>for</strong> spectrum<br />
◆ Number of samples <strong>for</strong> spectrum<br />
◆ Overlap of samples <strong>for</strong> spectrum<br />
R&S ® <strong>UMTS</strong> <strong>PN</strong> <strong>Scanner</strong> <strong>for</strong> <strong>Expert</strong> <strong>System</strong> R&S ® <strong>Romes</strong>-<strong>US1</strong> 5
Software user interface<br />
Modular concept<br />
¸ROMES is based on a modular system<br />
concept, allowing any type of data to<br />
be collected and analyzed. Any sensor<br />
(e.g. test receiver, test mobile or GPS<br />
receiver) capable of result transfer to a PC<br />
or notebook can be integrated into the<br />
system family. This opens a wide range of<br />
uses, from measurements in mobile radio<br />
to almost any kind of measurement application.<br />
The modular concept enables the<br />
implementation of very small systems<br />
and high-per<strong>for</strong>mance systems alike. And<br />
it makes the software future-proof, as it<br />
can easily be extended to accommodate<br />
upcoming technologies. The ¸<strong>UMTS</strong><br />
<strong>PN</strong> <strong>Scanner</strong> is embedded in the modular<br />
¸ROMES network optimization software.<br />
It consists of a dedicated driver<br />
which has to be installed together with<br />
the base software plat<strong>for</strong>m (see data<br />
sheet ¸ROMES, PD 0757.6679). The<br />
core acts as a shunting station. It transfers<br />
data from the external hardware via<br />
the driver to the result file and the displays.<br />
Two main types of display are supported:<br />
the general view e.g. 2D chart,<br />
Hardware Software<br />
RS-232-C<br />
IEEE<br />
USB<br />
EtherNet<br />
PCI<br />
ISA<br />
Driver<br />
Driver<br />
ASCII Excel<br />
EXP. EXP.<br />
Core<br />
Result file<br />
Device-dependent<br />
*.CMD <strong>for</strong>mat<br />
Device & technology-independent<br />
Technology-dependent<br />
User-configurable<br />
6 R&S ® <strong>UMTS</strong> <strong>PN</strong> <strong>Scanner</strong> <strong>for</strong> <strong>Expert</strong> <strong>System</strong> R&S ® <strong>Romes</strong>-<strong>US1</strong><br />
alphanumeric or GIS<br />
view, and the technically<br />
specific view,<br />
e.g. GSM measurement<br />
report,<br />
¸<strong>UMTS</strong> <strong>PN</strong><br />
<strong>Scanner</strong> view, etc.<br />
Data post-processing<br />
with external software,<br />
e.g. Excel is<br />
also possible. A convenient,user-definable<br />
export function<br />
and numerous<br />
specific export functions<br />
are available. The system can easily<br />
be upgraded to any new hardware that is<br />
attached merely by installing a new<br />
driver.<br />
Top N configuration<br />
All Top N views are fully user-configurable:<br />
◆ User-specific name of this Top N<br />
◆ Number of CPICHs<br />
◆ Frequencies: only CPICHs detected on<br />
the selected frequency are taken into<br />
account<br />
◆ Interval of observation <strong>for</strong> rank decision<br />
◆ Calculation mode: peak or average<br />
Techn. Techn.<br />
ROMES data Model<br />
Alphanumeric values<br />
Gener.<br />
GSS<br />
spec.<br />
GSS<br />
2D<br />
chart<br />
Map<br />
View<br />
Meas.<br />
report<br />
Layer 3<br />
GSS: Graphical subsystem<br />
<strong>UMTS</strong> Top N property settings<br />
◆ Hysteresis <strong>for</strong> rank changes<br />
All configured Top N views are available<br />
as parameters <strong>for</strong> all basic views, e.g.<br />
2D chart view, alphanumeric view or<br />
route track view. This allows the best<br />
server <strong>for</strong> a configured Top N to be followed<br />
– on the map or to see its graph in<br />
the 2D chart view.<br />
Pilot pollution configuration<br />
The ¸<strong>UMTS</strong> <strong>PN</strong> <strong>Scanner</strong> automatically<br />
calculates the pilot pollution <strong>for</strong> the<br />
current server. To provide a helpful and<br />
quick overview of the quality of the coverage,<br />
two parameters were designed. The<br />
Modular software concept of<br />
¸ROMES <strong>for</strong> <strong>UMTS</strong>
hard pilot pollution (HPP) counts all measured<br />
CPICHs with an RSCP higher than<br />
the red graph. The soft pilot pollution<br />
(SPP) counts all measured CPICHs, with<br />
an RSCP is higher than the red graph, and<br />
all that have an RSCP between the blue<br />
and red graph with a value between 0<br />
and 1.The red and blue graphs are user-<br />
<strong>System</strong><br />
configuration<br />
of the<br />
¸<strong>UMTS</strong><br />
<strong>PN</strong> <strong>Scanner</strong><br />
Pilot pollution info<br />
settings<br />
configurable and can be adapted to specific<br />
conditions or measurement goals.<br />
There is no difference between using E c /<br />
I 0 or RSCP <strong>for</strong> to calculate the pilot pollution,<br />
because [E c (SC 1)/I 0 ]/[E c (SC 2)/I 0 ] is<br />
identical to [RSCP(SC 1)]/[RSCP(SC 2)] <strong>for</strong><br />
one single measurement, where E c is<br />
directly proportional to RSCP.<br />
<strong>PN</strong> scanner configuration and<br />
applications<br />
The ¸<strong>UMTS</strong> <strong>PN</strong> <strong>Scanner</strong> can be configured<br />
either as a cost-effective version<br />
with a notebook or as a high-per<strong>for</strong>mance<br />
solution. The preferred system solution<br />
depends on the field of application. The<br />
notebook version is <strong>for</strong> flexible applications,<br />
e.g. when used in different vehicles<br />
or indoors. All system components can be<br />
used as standalone devices; magnetic<br />
antennas are employed, and power is<br />
supplied from the test vehicle. The highper<strong>for</strong>mance<br />
system solution is designed<br />
as a turnkey solution <strong>for</strong> installation in a<br />
test vehicle. The sturdy and robust construction<br />
ensures reliable tests and measurements<br />
even under difficult environmental<br />
conditions. The system can be<br />
configured either as a pure <strong>PN</strong> scanner or<br />
as a CW (level measurement, only<br />
¸ESPI) and <strong>PN</strong> scanner. The<br />
¸FSP/ESPI that are used as an RF<br />
frontend and spectrum analyzer in this<br />
application are top-quality, state-of-theart<br />
products from the Rohde & Schwarz<br />
family of test instruments.<br />
R&S ® <strong>UMTS</strong> <strong>PN</strong> <strong>Scanner</strong> <strong>for</strong> <strong>Expert</strong> <strong>System</strong> R&S ® <strong>Romes</strong>-<strong>US1</strong> 7
Future development<br />
Rohde & Schwarz ensures a long product<br />
life cycle. Part of this long-term planning<br />
is the continuous development and<br />
enhancement of existing products and<br />
plat<strong>for</strong>ms, but another part is development<br />
of new products that will be added<br />
to the ¸ROMES product family of network<br />
optimization systems. Compared to<br />
other available products, the ¸<strong>UMTS</strong><br />
<strong>PN</strong> <strong>Scanner</strong> has the exceptional<br />
advantage that it is developed as an<br />
¸ROMES software option that runs<br />
on regular PCs. Minor modifications or<br />
major add-ons are developed in short<br />
cycles; they require a mere software<br />
update or upgrade to the existing systems.<br />
No hardware changes are necessary.<br />
8 R&S ® <strong>UMTS</strong> <strong>PN</strong> <strong>Scanner</strong> <strong>for</strong> <strong>Expert</strong> <strong>System</strong> R&S ® <strong>Romes</strong>-<strong>US1</strong><br />
The ¸ESPI and the ¸FSP/FSU are<br />
being used as a frontend. For the future,<br />
new and more compact receivers that fulfill<br />
the necessary requirements <strong>for</strong> highquality<br />
measurements in <strong>UMTS</strong> and other<br />
bands can easily be integrated into the<br />
system concept. The road map <strong>for</strong> the<br />
¸<strong>UMTS</strong> <strong>PN</strong> <strong>Scanner</strong> <strong>for</strong>esees, among<br />
numerous other developments, the integration<br />
of <strong>UMTS</strong> test mobiles. This will<br />
allow the signalling capabilities of the<br />
test mobile to be combined with the RF<br />
analysis capabilities of the <strong>PN</strong> scanner.<br />
There will be a tracking mode in which<br />
the serving cells in <strong>UMTS</strong> will automatically<br />
be set <strong>for</strong> the analyzer (all RF channels<br />
and scrambling codes), provided the<br />
<strong>UMTS</strong> mobile phone delivers this in<strong>for</strong>mation.<br />
New features<br />
◆ Use of <strong>UMTS</strong> base station lists with<br />
position determination <strong>for</strong> unknown<br />
base stations<br />
◆ End-to-end data and testing (QoS)<br />
with commercial <strong>UMTS</strong> mobile<br />
phones<br />
◆ Evaluation software module <strong>UMTS</strong><br />
<strong>for</strong> ¸RODAS (successor of<br />
¸ROSEVAL)
Specifications<br />
RF frontend<br />
Frequency range 9 kHz to 3 GHz (7 GHz with ¸ESPI 7)<br />
Frequency accuracy ±1 ppm<br />
±0.01 ppm with OCXO Option ¸FSP-B4<br />
OCXO aging ±0.1 ppm<br />
Frequency resolution 0.1 Hz<br />
IF bandwidth 10 Hz to 10 MHz (steps 10, 3)<br />
Multiple special filters from 100 Hz to 8 MHz,<br />
specifically DAB/DVB, cdmaOne, TETRA,<br />
IS-136, WCDMA<br />
RF input 50 Ω impedance, N connector<br />
Trigger input BNC connector<br />
RF input range –150 dBm to +30 dBm (in <strong>UMTS</strong> band)<br />
Level accuracy
The following table shows the system's update rates in high-speed mode, based<br />
on measurements with the Process Controller ¸TSPC 2 (2 × Pentium III 1<br />
GHz). The measurements were per<strong>for</strong>med in July 2002 with ¸ROMES Version<br />
3.21 and 8 scrambling codes on one UARFCN:<br />
Update rate in measurements/s 10 5 2 1<br />
Spectrum uplink/downlink ➼ ➼ ➼ ➼ refresh adjustable<br />
Spectrum history ➼ ➼ ➼ ➼ refresh adjustable<br />
Top N ➼ ➼ ➼<br />
P-SCH ➼ ➼ ➼ ➼ refresh adjustable<br />
P-CPICH ➼ ➼ ➼ ➼<br />
Peaks ➼ ➼ ➼ ➼<br />
# node B 30 30 30 30<br />
Update [s] 0.1 0.2 0.5 1.0<br />
Update rates in high-speed mode<br />
The update rate in high-dynamic mode is approx. 1.0 s.<br />
Dynamic range and sensitivity<br />
The sensitivity of the ¸<strong>UMTS</strong> <strong>PN</strong> <strong>Scanner</strong> <strong>for</strong> the trace of E c/I 0 and RSCP can<br />
reasonably be given only by probability. The diagrams below show the likelihood<br />
of detecting of a pilot (per sample) <strong>for</strong> high-speed mode and high-dynamic mode.<br />
As up to 10 samples/s are taken in high-speed mode, a probability of 10 % still<br />
delivers approximately one valid value per second (E c/I 0 and RSCP) <strong>for</strong> the<br />
specified minimum sensitivity.<br />
Probability of detection per sample<br />
Probability of detection per sample<br />
100%<br />
80%<br />
60%<br />
40%<br />
20%<br />
0%<br />
100%<br />
80%<br />
60%<br />
40%<br />
20%<br />
0%<br />
RSCP trace sensitivity (high-speed)<br />
–116 –117 –118 –119 –120 –121<br />
RSCP sensitivity in dBm<br />
RSCP trace sensitivity (high-dynamic)<br />
–124 –125 –126 –127<br />
RSCP sensitivity in dBm<br />
10 R&S ® <strong>UMTS</strong> <strong>PN</strong> <strong>Scanner</strong> <strong>for</strong> <strong>Expert</strong> <strong>System</strong> R&S ® <strong>Romes</strong>-<strong>US1</strong><br />
According to the above tables, CPICHs will analyzed with reasonable success up<br />
to the following value:<br />
Mode Dynamic range<br />
per sample<br />
High-speed RSCP 20 dB<br />
(–119/–110 dBm<br />
to –10 dBm)<br />
Typical sensitivity and dynamic ranges<br />
Probability of detections per sample<br />
Probability of detection per sample<br />
100%<br />
80%<br />
60%<br />
40%<br />
20%<br />
0%<br />
100%<br />
80%<br />
60%<br />
40%<br />
20%<br />
0%<br />
Sensitivity of<br />
¸ESPI<br />
(¸FSP/FSU<br />
with ¸ESPI<br />
(with ¸ESPI-<br />
B2)<br />
E c /I o trace sensitivity (high-speed)<br />
–16.5 –17.5 –19.5<br />
E c/I o sensitivity in dBm<br />
E c /I o trace sensitivity (high-dynamic)<br />
–26 –28 –29<br />
E c /I o sensitivity in dBm<br />
Sensitivity of<br />
¸FSP/FSU<br />
without<br />
¸FSP<br />
(with FSP-B25)<br />
–119 dBm –110 dBm<br />
High-dynamic RSCP 29 dB<br />
(–127/–115 dBm<br />
to 0 dBm)<br />
–127 dBm –115 dBm
Ordering in<strong>for</strong>mation<br />
Laptop configuration<br />
Designation Type Order No.<br />
Tablet PC ¸TS-TB1 1070.5872.13<br />
IEC625/IEEE488 PCMCIA Type II Card ¸TSNB-IEC1 1042.0970.02<br />
GPS Navigation <strong>System</strong> ¸TS 95GPS 1090.8348.02<br />
EMI Test Receiver 1)<br />
Preselector <strong>for</strong> ¸ESPI 2)<br />
1) ¸FSP can replace ¸ESPI <strong>for</strong> <strong>PN</strong> scan only; no CW uses.<br />
2)<br />
Factory installation only <strong>for</strong> ¸ESPI.<br />
¸ESPI 3 1142.8007.03<br />
¸ESPI-B2 1129.7498.02<br />
LAN Interface 10/100 BaseT <strong>for</strong><br />
¸FSP/¸ESPI ¸FSP-B16 1129.8042.02<br />
OCXO 10 MHz <strong>for</strong> ¸FSP/ESPI ¸FSP-B4 1129.6740.02<br />
Power Supply 12 V DC <strong>for</strong> ¸FSP/ESPI ¸FSP-B30 1155.1158.02<br />
Documentation of Calibration Values ¸DCV-2 0240.2193.09<br />
Trigger <strong>for</strong> Coverage Measurements<br />
with ¸FSP/ESPI 3 ¸ESPI-K50 1106.4386.02<br />
CW Driver <strong>for</strong> ¸ESPI ¸ROMES-AS5 1143.8198.02<br />
Synchronization Unit <strong>for</strong> ¸TS 5K1C ¸TS-95SYN 1114.4817.02<br />
¸ROMES 3 ¸<strong>UMTS</strong> <strong>PN</strong> <strong>Scanner</strong><br />
Software Driver ¸ROMES-<strong>US1</strong> 1156.2858.02<br />
Basic Measurement Software<br />
¸ROMES 3 without Hardlock ¸ROMES 1143.7991.02<br />
Evaluation Software ¸RODAS Lite+ ¸RODAS 1117.5495.12<br />
<strong>UMTS</strong> Module <strong>for</strong> ¸RODAS ¸RODAS-U 1117.5495.20<br />
<strong>UMTS</strong> high-per<strong>for</strong>mance system<br />
Designation Type Order No.<br />
<strong>System</strong> controller, LC display and interfaces<br />
<strong>System</strong> Process Controller ¸TSPC 2 1161.4310.02<br />
High-Per<strong>for</strong>mance GPIB Interface ¸TS-IEC1 1042.1276.02<br />
RS-232-C Interface1) ¸TSPC-SER8 1029.5871.02<br />
15.1" TFT Display ¸TSPC-LCD1 1064.5800.02<br />
19" Rack <strong>for</strong> ¸TS 9955 (15 HU) ¸TS 955RA 1053.5590.02<br />
Measurement Cable Set <strong>for</strong> ¸TS 9955 ¸TS 955KS 1042.9631.02<br />
Hardware Integration into Rack <strong>for</strong><br />
¸TS 9955 ¸TS 955HI 1053.5603.02<br />
All other options as in the laptop configuration<br />
1) For <strong>System</strong> Process Controller ¸TSPC 2.<br />
R&S ® <strong>UMTS</strong> <strong>PN</strong> <strong>Scanner</strong> <strong>for</strong> <strong>Expert</strong> <strong>System</strong> R&S ® <strong>Romes</strong>-<strong>US1</strong> 11
More in<strong>for</strong>mation at<br />
www.rohde-schwarz.com<br />
(search term: <strong>UMTS</strong> <strong>PN</strong> <strong>Scanner</strong>, <strong>Romes</strong>-<strong>US1</strong>)<br />
Rohde & Schwarz GmbH & Co. KG ⋅ Mühldorfstraße 15 ⋅ 81671 München ⋅ Germany ⋅ P.O.B. 80 14 69 ⋅ 81614 München ⋅ Germany ⋅ Telephone +49 89 41 29-0<br />
www.rohde-schwarz.com ⋅ Customer Support: Telephone +49 180 512 42 42, Fax +49 89 41 29-137 77, E-mail: CustomerSupport@rohde-schwarz.com<br />
Printed in Germany (Pe as)<br />
R&S ® is a registered trademark of Rohde & Schwarz GmbH & Co. KG · Trade names are trademarks of the owners<br />
PD 0758.0045.32 ⋅ R&S ® <strong>UMTS</strong> <strong>PN</strong> <strong>Scanner</strong> <strong>for</strong> <strong>Expert</strong> <strong>System</strong> R&S ® <strong>Romes</strong>-<strong>US1</strong> ⋅ Version 02.01 ⋅ December 2003 ⋅ Data without tolerance limits is not binding ⋅ Subject to change