A New Paradigm for Managing Shareholder Value
A New Paradigm for Managing Shareholder Value
A New Paradigm for Managing Shareholder Value

Create successful ePaper yourself
Turn your PDF publications into a flip-book with our unique Google optimized e-Paper software.
managing current operations, is often<br />
not the competency they urgently need,<br />
getting a handle on future value.<br />
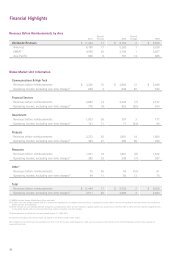
We have found, <strong>for</strong> example, that as of<br />
May 2003, 7 future value accounted <strong>for</strong><br />
77 percent of market capitalization and<br />
59 percent of the enterprise value 8 of<br />
the companies on the Russell 3000, an<br />
index that covers 98 percent of all<br />
listed US equities (see Exhibit 1).<br />
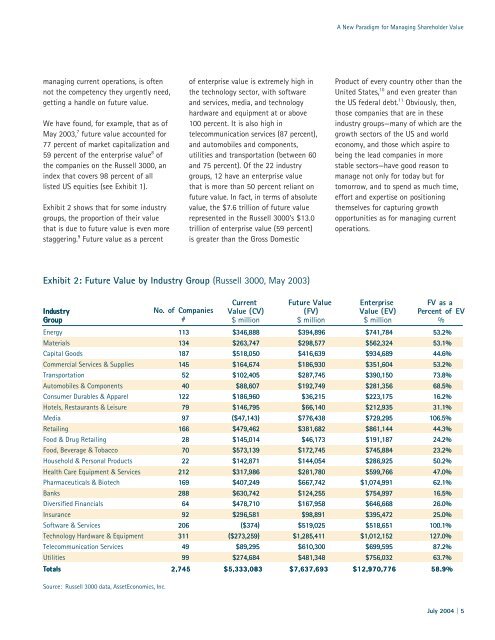
Exhibit 2 shows that <strong>for</strong> some industry<br />
groups, the proportion of their value<br />
that is due to future value is even more<br />
staggering. 9 Future value as a percent<br />
Industry<br />
Group<br />
Energy<br />
Materials<br />
Capital Goods<br />
Commercial Services & Supplies<br />
Transportation<br />
Automobiles & Components<br />
Consumer Durables & Apparel<br />
Hotels, Restaurants & Leisure<br />
Media<br />
Retailing<br />
Food & Drug Retailing<br />
Food, Beverage & Tobacco<br />
Household & Personal Products<br />
Health Care Equipment & Services<br />
Pharmaceuticals & Biotech<br />
Banks<br />
Diversified Financials<br />
Insurance<br />
Software & Services<br />
Technology Hardware & Equipment<br />
Telecommunication Services<br />
Utilities<br />
Totals Totals<br />
Source: Russell 3000 data, AssetEconomics, Inc.<br />
No. of Companies<br />
#<br />
113<br />
134 134<br />
187<br />
145<br />
52 52<br />
40 40<br />
122<br />
79 79<br />
97 97<br />
166<br />
28 28<br />
70 70<br />
22<br />
212<br />
169 169<br />
288<br />
64 64<br />
92 92<br />
206<br />
311<br />
49 49<br />
99 99<br />
2,745 2,745<br />
of enterprise value is extremely high in<br />
the technology sector, with software<br />
and services, media, and technology<br />
hardware and equipment at or above<br />
100 percent. It is also high in<br />
telecommunication services (87 percent),<br />
and automobiles and components,<br />
utilities and transportation (between 60<br />
and 75 percent). Of the 22 industry<br />
groups, 12 have an enterprise value<br />
that is more than 50 percent reliant on<br />
future value. In fact, in terms of absolute<br />
value, the $7.6 trillion of future value<br />
represented in the Russell 3000's $13.0<br />
trillion of enterprise value (59 percent)<br />
is greater than the Gross Domestic<br />
Exhibit 2: Future <strong>Value</strong> by Industry Group (Russell 3000, May 2003)<br />
Current<br />
<strong>Value</strong> (CV)<br />
$ million<br />
$346,888<br />
$263,747<br />
$518,050<br />
$164,674<br />
$102,405<br />
$88,607<br />
$186,960<br />
$146,795<br />
($47,143)<br />
$479,462<br />
$145,014<br />
$573,139<br />
$142,871<br />
$317,986<br />
$407,249<br />
$630,742<br />
$478,710<br />
$296,581<br />
($374)<br />
($273,259)<br />
$89,295<br />
$274,684<br />
$5,333,083<br />
Future <strong>Value</strong><br />
(FV)<br />
$ million<br />
$394,896<br />
$298,577<br />
$416,639<br />
$186,930<br />
$287,745<br />
$192,749<br />
$36,215<br />
$66,140<br />
$776,438<br />
$381,682<br />
$46,173<br />
$172,745<br />
$144,054<br />
$281,780<br />
$667,742<br />
$124,255<br />
$167,958<br />
$98,891<br />
$519,025<br />
$1,285,411<br />
$610,300<br />
$481,348<br />
$7,637,693<br />
A <strong>New</strong> <strong>Paradigm</strong> <strong>for</strong> <strong>Managing</strong> <strong>Shareholder</strong> <strong>Value</strong><br />
Product of every country other than the<br />
United States, 10 and even greater than<br />
the US federal debt. 11 Obviously, then,<br />
those companies that are in these<br />
industry groups—many of which are the<br />
growth sectors of the US and world<br />
economy, and those which aspire to<br />
being the lead companies in more<br />
stable sectors—have good reason to<br />
manage not only <strong>for</strong> today but <strong>for</strong><br />
tomorrow, and to spend as much time,<br />
ef<strong>for</strong>t and expertise on positioning<br />
themselves <strong>for</strong> capturing growth<br />
opportunities as <strong>for</strong> managing current<br />
operations.<br />
Enterprise<br />
<strong>Value</strong> (EV)<br />
$ million<br />
$741,784<br />
$562,324<br />
$934,689<br />
$351,604<br />
$390,150<br />
$281,356<br />
$223,175<br />
$212,935<br />
$729,295<br />
$861,144<br />
$191,187<br />
$745,884<br />
$286,925<br />
$599,766<br />
$1,074,991<br />
$754,997<br />
$646,668<br />
$395,472<br />
$518,651<br />
$1,012,152<br />
$699,595<br />
$756,032<br />
$12,970,776<br />
FV as a<br />
Percent of EV<br />
%<br />
53.2%<br />
53.1%<br />
44.6%<br />
53.2%<br />
73.8%<br />
68.5%<br />
16.2%<br />
31.1%<br />
106.5%<br />
44.3%<br />
24.2%<br />
23.2% 23.2%<br />
50.2%<br />
47.0% 47.0%<br />
62.1%<br />
16.5%<br />
26.0%<br />
25.0%<br />
100.1%<br />
127.0% 127.0%<br />
87.2% 87.2%<br />
63.7% 63.7%<br />
58.9%<br />
July 2004 | 5