- Page 1 and 2: Internationalisation Monitor 2012
- Page 3 and 4: Foreword This fifth edition of the
- Page 5 and 6: Contents Foreword 3 Introduction: t
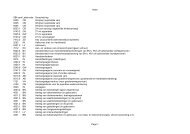
- Page 7: 10 International trade in goods by
- Page 11 and 12: Introduction: the Internationalisat
- Page 13 and 14: In each edition of the Internationa
- Page 15 and 16: indicate that Dutch enterprises sti
- Page 17 and 18: deepening already existing relation
- Page 19: new jobs and sustainable growth. Re
- Page 24 and 25: After the economic and financial cr
- Page 26 and 27: In contrast, Dutch exports of servi
- Page 28 and 29: 1.2.4 Breakdown of Dutch economic g
- Page 30 and 31: 1.3 Geographical composition of Dut
- Page 32 and 33: 1.4.1 Imports and exports of commod
- Page 34 and 35: 1.4.3 Geographical composition of i
- Page 36 and 37: Visualisation 1.4.4 shows how Dutch
- Page 38 and 39: 1.5.3 Geographical composition of D
- Page 40 and 41: 1.6 Conclusion 40 Statistics Nether
- Page 43: A closer look at BRIC traders
- Page 46 and 47: Economic growth is predominantly co
- Page 48 and 49: 2.3 Descriptive statistics Dutch im
- Page 50 and 51: (almost 60 percent), although unski
- Page 52 and 53: 52 Statistics Netherlands Dutch exp
- Page 54 and 55: 2.4 Regression results Firm size 54
- Page 56 and 57: There seems to be a significant neg
- Page 58 and 59: R&D activity We also want to analys
- Page 60 and 61: 2.4.5 Impact of firm characteristic
- Page 63: Trends in the international trade i
- Page 66 and 67: In recent decades, services have gr
- Page 68 and 69: 3.3 Composition of the Dutch intern
- Page 70 and 71:
3.3.3 Trends in total Dutch export
- Page 72 and 73:
In 2004, imports amounted to 3.2 bi
- Page 74 and 75:
3.6 The top four largest upcoming t
- Page 76 and 77:
3.7.1 Total export values of servic
- Page 78 and 79:
Ireland imported more than 10 billi
- Page 81 and 82:
Trends in foreign investments 4.1 4
- Page 83 and 84:
in foreign countries. In section 4.
- Page 85 and 86:
4.2.2 Dutch inward and outward FDI
- Page 87 and 88:
just like for inward FDI. The knowl
- Page 89 and 90:
Turnover of foreign controlled ente
- Page 91 and 92:
Dutch enterprises were afraid it wo
- Page 93 and 94:
Dutch controlled enterprises are ve
- Page 95:
in high level services in developed
- Page 99 and 100:
International enterprises in a regi
- Page 101 and 102:
5.2 Data and methodology In order t
- Page 103 and 104:
5.3.1 Local business units per regi
- Page 105 and 106:
5.3.3 Share of local business units
- Page 107 and 108:
5.3.6 Local business units under fo
- Page 109 and 110:
5.4.1 Local business units with onl
- Page 111 and 112:
5.4.5 Share of exporting local busi
- Page 113 and 114:
5.4.7 Share per municipality in imp
- Page 115 and 116:
5.4.10 Export value of local units
- Page 117 and 118:
5.5.1 International orientation of
- Page 119:
Enterprise demo- graphy of inter- n
- Page 122 and 123:
This chapter presents the differenc
- Page 124 and 125:
6.2.1 The entrepreneurial process P
- Page 126 and 127:
6.3.1 Sector classification Categor
- Page 128 and 129:
6.4.1 Birth and death rates of Dutc
- Page 130 and 131:
6.4.3 Enterprise growth rate of Dut
- Page 132 and 133:
Relative to the size of the enterpr
- Page 134 and 135:
the other sectors. Enterprises in t
- Page 136 and 137:
6.6.2 Survival rates of new start-u
- Page 138 and 139:
138 Statistics Netherlands The sect
- Page 140 and 141:
140 Statistics Netherlands period.
- Page 142 and 143:
Deaths of Dutch and foreign control
- Page 145 and 146:
Economic effects of enterprise dyna
- Page 147 and 148:
7.2 Theory and background Based on
- Page 149 and 150:
7.3.1 Availability of variables 200
- Page 151 and 152:
Description of the analysis The ana
- Page 153 and 154:
7.4.2 Share of starters in 2007 in
- Page 155 and 156:
7.4.5 Averages before and after mat
- Page 157 and 158:
7.4.6 Comparison of similar Dutch a
- Page 159 and 160:
As table 7.5.2 shows, there are aga
- Page 161 and 162:
7.5.5 Development of matched Dutch
- Page 163 and 164:
From these graphs one may conclude
- Page 165:
Enterprise dynamics and internation
- Page 168 and 169:
This chapter focuses on the demogra
- Page 170 and 171:
170 Statistics Netherlands number o
- Page 172 and 173:
8.3.1 Composition dataset 2007-2011
- Page 174 and 175:
8.4 Descriptive statistics Table 8.
- Page 176 and 177:
8.5.1 Trade portfolio at import sta
- Page 178 and 179:
Intensive Margin How important addi
- Page 180 and 181:
the annex. In this model, TypeStart
- Page 182 and 183:
around 17 percent. Two-way traders
- Page 184 and 185:
8.6.2 Survival rates of new traders
- Page 186 and 187:
186 Statistics Netherlands We also
- Page 188 and 189:
8.6.3 Enterprise survival of trader
- Page 190 and 191:
8.6.4 Survival rates of new traders
- Page 192 and 193:
8.6.4 Survival rates of new traders
- Page 194 and 195:
194 Statistics Netherlands (conditi
- Page 196 and 197:
8.3a Pairwise comparisons between d
- Page 199:
Enterprise dynamics during the fina
- Page 202 and 203:
The financial crisis that first hit
- Page 204 and 205:
still change due to mergers and acq
- Page 206 and 207:
9.3 Overall dynamics during the fin
- Page 208 and 209:
all sectors of activity with an 11
- Page 210 and 211:
9.4.1 Turnover, jobs, import and ex
- Page 212 and 213:
Figure 9.4.1 also shows that the cr
- Page 214 and 215:
of Dutch enterprises. A similar obs
- Page 216 and 217:
as expected, suffer most from an in
- Page 218 and 219:
Before looking at the corrected mod
- Page 220 and 221:
sales exposure, foreign ownership a
- Page 222 and 223:
222 Statistics Netherlands period.
- Page 225 and 226:
International trade in goods by ent
- Page 227 and 228:
eyond the scope of this analysis. A
- Page 229 and 230:
10.2.1 International trade in goods
- Page 231 and 232:
10.4 International trade in goods b
- Page 233 and 234:
10.5 International goods traders in
- Page 235:
International trade in services by
- Page 238 and 239:
11.1 Introduction 238 Statistics Ne
- Page 240 and 241:
11.2.1 Total Dutch imports and expo
- Page 242 and 243:
11.3.1 Import and export value of s
- Page 244 and 245:
education, health and other service
- Page 246 and 247:
In 2009, 1.4 percent of all active
- Page 249:
Foreign Direct Investments
- Page 252 and 253:
12.1 Introduction 252 Statistics Ne
- Page 254 and 255:
12.2.1 Shares in worldwide FDI (sto
- Page 256 and 257:
of an economy (OECD, 2008). Graph 1
- Page 258 and 259:
If we have a closer look at the EU-
- Page 260 and 261:
12.4.2 Origin of inward FDI (stocks
- Page 262 and 263:
12.5.1 Dutch FDI (stocks), by econo
- Page 265:
International traffic and transport
- Page 268 and 269:
13.1 Introduction The traffic and t
- Page 270 and 271:
Most international air passengers t
- Page 272 and 273:
13.3 International air freight and
- Page 274 and 275:
13.3.1 International transport of f
- Page 276 and 277:
13.4 Internationalisation of goods
- Page 278 and 279:
13.4.1 Weight of transported goods
- Page 280 and 281:
Despite 8 percent growth, the total
- Page 282 and 283:
13.5.1 Container transport to and f
- Page 285:
Internationalisation and employment
- Page 288 and 289:
Figures for Dutch and foreign contr
- Page 290 and 291:
14.2.1 Enterprises in the linked em
- Page 292 and 293:
14.3.1 Employment situation at Dutc
- Page 294 and 295:
transport and storage. This may be
- Page 296 and 297:
250 or more employees 50-249 employ
- Page 299 and 300:
References Alfaro, L. and M. X. Che
- Page 301 and 302:
Ernst & Young 2012. Nederland steed
- Page 303 and 304:
Kuypers, F., Lejour, A., Lemmers, O
- Page 305:
Contributors to the Internationalis