- Page 1 and 2: Internationalisation Monitor 2012
- Page 3 and 4: Foreword This fifth edition of the
- Page 5 and 6: Contents Foreword 3 Introduction: t
- Page 7: 10 International trade in goods by
- Page 11 and 12: Introduction: the Internationalisat
- Page 13 and 14: In each edition of the Internationa
- Page 15 and 16: indicate that Dutch enterprises sti
- Page 17 and 18: deepening already existing relation
- Page 19: new jobs and sustainable growth. Re
- Page 23 and 24: Trends in international trade in go
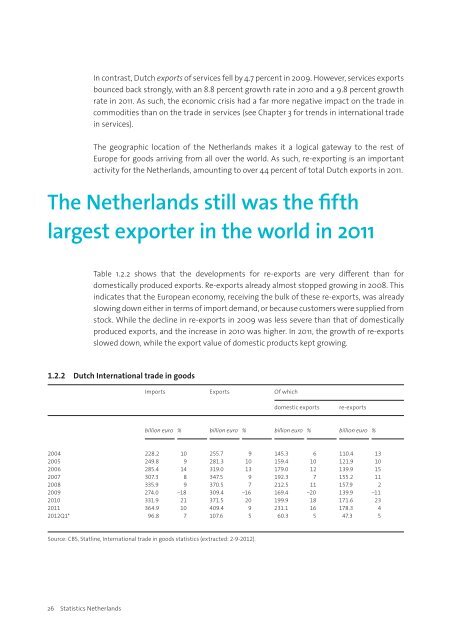
- Page 25: 1.2 Trends in trade and the economi
- Page 29 and 30: 1.2.5 Development of Dutch GDP; imp
- Page 31 and 32: 1.3.1 International trade in goods
- Page 33 and 34: The Netherlands seeks to expand kno
- Page 35 and 36: 1.4.4 Geographical composition of e
- Page 37 and 38: Table 1.5.2 shows the five main tra
- Page 39 and 40: 1.5.4 Geographical composition of r
- Page 41: 1.1.1a Annex Annex Level Descriptio
- Page 45 and 46: A closer look at BRIC traders 2.1 2
- Page 47 and 48: the characteristics of firms active
- Page 49 and 50: About 80 percent of the importers i
- Page 51 and 52: Table 2.3.4 shows BRIC trade by sec
- Page 53 and 54: Comparing BRIC traders to the avera
- Page 55 and 56: 2.4.1 Relation of BRIC trade to fir
- Page 57 and 58: egressions as in tables 2.4.1 and 2
- Page 59 and 60: Likelihood of BRIC trade Finally, a
- Page 61: 2.5 Conclusions This chapter analys
- Page 65 and 66: Trends in the international trade i
- Page 67 and 68: The overall Dutch import and export
- Page 69 and 70: 3.3.2 (imports) and 3.3.3 (exports)
- Page 71 and 72: 3.4.1 Share of business and persona
- Page 73 and 74: 0 2006 exported service to these tw
- Page 75 and 76: services. For Brazil and Australia
- Page 77 and 78:
3.7.3 Total import values of servic
- Page 79:
Trends in foreign investments
- Page 82 and 83:
This chapter presents the latest da
- Page 84 and 85:
Graph 4.2.1 shows that FDI flows fl
- Page 86 and 87:
4.2.3 Inward and outward FDI, by kn
- Page 88 and 89:
4.3.1 Share of foreign controlled e
- Page 90 and 91:
4.4 Dutch controlled enterprises ou
- Page 92 and 93:
4.4.3 Turnover of Dutch controlled
- Page 94 and 95:
4.4.5 Ratio of turnover outside the
- Page 97:
International enterprises in a regi
- Page 100 and 101:
Internationally active enterprises,
- Page 102 and 103:
5.3 International enterprises in a
- Page 104 and 105:
Local business units owned by a for
- Page 106 and 107:
Graph 5.3.3 shows the share of fore
- Page 108 and 109:
108 Statistics Netherlands Zeeuws-V
- Page 110 and 111:
5.4.3 Local business units of two-w
- Page 112 and 113:
112 Statistics Netherlands However,
- Page 114 and 115:
Table 5.4.9 and 5.4.10 show the int
- Page 116 and 117:
116 Statistics Netherlands Two thir
- Page 118 and 119:
is at foreign controlled local unit
- Page 121 and 122:
Enterprise demography of internatio
- Page 123 and 124:
to its trade portfolio, or by incre
- Page 125 and 126:
We also expect that the internation
- Page 127 and 128:
6.4 Descriptive statistics The demo
- Page 129 and 130:
owner) in the Netherlands and espec
- Page 131 and 132:
6.4.3 Enterprise growth rate of for
- Page 133 and 134:
abroad makes extra demands on an en
- Page 135 and 136:
6.6.1 Survival rates of new start-u
- Page 137 and 138:
6.6.3 Survival rates of new start-u
- Page 139 and 140:
6.7.1 Cox regression model fitted t
- Page 141 and 142:
Annex Births of Dutch and foreign c
- Page 143:
Economic effects of enterprise dyna
- Page 146 and 147:
We studied the development trajecto
- Page 148 and 149:
categories for 2008 alone, because
- Page 150 and 151:
150 Statistics Netherlands group cr
- Page 152 and 153:
Total turnover of the cohort of 200
- Page 154 and 155:
This table only shows some outlines
- Page 156 and 157:
7.4.6 Comparison of similar Dutch a
- Page 158 and 159:
7.5 Economic development before exi
- Page 160 and 161:
7.5.3 Matching variables and refere
- Page 162 and 163:
7.5.5 Development of matched Dutch
- Page 164 and 165:
164 Statistics Netherlands Research
- Page 167 and 168:
Enterprise dynamics and internation
- Page 169 and 170:
We start out by illustrating how ne
- Page 171 and 172:
8.3 Data and methodology In order t
- Page 173 and 174:
8.3.2 Enterprises with product-coun
- Page 175 and 176:
Continuing importers are by far the
- Page 177 and 178:
8.5.2 Trade portfolio at export sta
- Page 179 and 180:
Interesting to see is that both new
- Page 181 and 182:
8.6 Survival analysis In this parag
- Page 183 and 184:
Survival of international traders:
- Page 185 and 186:
8.6.2 Survival rates of new traders
- Page 187 and 188:
8.6.3 Enterprise survival of trader
- Page 189 and 190:
Survival of international traders:
- Page 191 and 192:
8.6.4 Survival rates of new traders
- Page 193 and 194:
Graph 8.6.4 shows that there is onl
- Page 195 and 196:
significant differences. Further an
- Page 197:
8.4a Pairwise comparisons between d
- Page 201 and 202:
Enterprise dynamics during the fina
- Page 203 and 204:
economic activity, size, (foreign)
- Page 205 and 206:
Linking the information on jobs and
- Page 207 and 208:
The birth and death rates as presen
- Page 209 and 210:
9.4 Economic impact of the financia
- Page 211 and 212:
9.4.1 Turnover, jobs, import and ex
- Page 213 and 214:
9.4.2 Dynamics of size classes betw
- Page 215 and 216:
International trade patterns of for
- Page 217 and 218:
9.5 Statistical analysis Our analys
- Page 219 and 220:
9.5.2 Year-on-year (corrected) mean
- Page 221 and 222:
turnover growth over the five years
- Page 223:
International trade in goods by ent
- Page 226 and 227:
This chapter presents information a
- Page 228 and 229:
10.2 Overview of international trad
- Page 230 and 231:
For SMEs that export goods, the sha
- Page 232 and 233:
10.4.1 Import and export value of g
- Page 234 and 235:
10.5.1 Share of importers/exporters
- Page 237 and 238:
International trade in services by
- Page 239 and 240:
11.2 Overview of the international
- Page 241 and 242:
11.3 International trade in service
- Page 243 and 244:
11.4 International trade in service
- Page 245 and 246:
11.4.2 Imports of services by econo
- Page 247:
11.5.1 Share of international servi
- Page 251 and 252:
Foreign Direct Investments 12.1 12.
- Page 253 and 254:
12.2 The Dutch share in worldwide F
- Page 255 and 256:
12.2.2 Dutch share in EU-15 FDI (st
- Page 257 and 258:
12.3.2 Dutch FDI (stocks) relative
- Page 259 and 260:
12.4.1 Dutch FDI (stocks), by count
- Page 261 and 262:
12.5 Dutch FDI stocks: by economic
- Page 263:
12.5.2 Inward FDI (stocks) by econo
- Page 267 and 268:
International traffic and transport
- Page 269 and 270:
13.2 International air passenger tr
- Page 271 and 272:
13.2.2 International passenger tran
- Page 273 and 274:
etween European countries (average
- Page 275 and 276:
13.3.2 Loaded and unloaded internat
- Page 277 and 278:
Vehicles registered in Germany, Bel
- Page 279 and 280:
13.4.2 Share of Dutch road transpor
- Page 281 and 282:
Malaysia (+18) and Hong Kong (+18)
- Page 283:
13.5.2 Sea container transport to a
- Page 287 and 288:
Internationalisation and employment
- Page 289 and 290:
14.2 Overview of the data on intern
- Page 291 and 292:
14.3 Employment situation at Dutch
- Page 293 and 294:
14.4 Workforce composition and job
- Page 295 and 296:
14.4.2 Job dynamics at Dutch and fo
- Page 297:
14.5.2 Share of high and low-paid e
- Page 300 and 301:
CBS. (2007). Key Figures Internatio
- Page 302 and 303:
Groot, S.P.T., De Groot, H., Lejour
- Page 304 and 305:
Ramaekers, P. and E. Daems. (2009).


