SOLUTIONS MAT 167: Statistics Test I - Anthony Tanbakuchi
SOLUTIONS MAT 167: Statistics Test I - Anthony Tanbakuchi
SOLUTIONS MAT 167: Statistics Test I - Anthony Tanbakuchi

Create successful ePaper yourself
Turn your PDF publications into a flip-book with our unique Google optimized e-Paper software.
<strong>MAT</strong> <strong>167</strong>: <strong>Statistics</strong>, <strong>Test</strong> I: Chapters 1-3 <strong>SOLUTIONS</strong> p. 4 of 14<br />
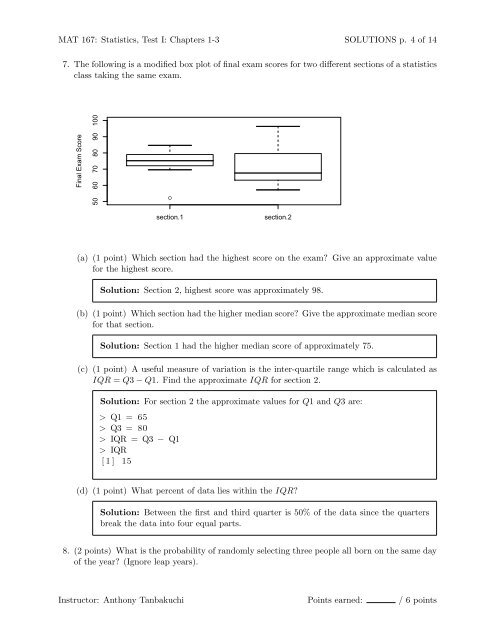
7. The following is a modified box plot of final exam scores for two different sections of a statistics<br />
class taking the same exam.<br />
Final Exam Score<br />
50 60 70 80 90 100<br />
●<br />
section.1 section.2<br />
(a) (1 point) Which section had the highest score on the exam? Give an approximate value<br />
for the highest score.<br />
Solution: Section 2, highest score was approximately 98.<br />
(b) (1 point) Which section had the higher median score? Give the approximate median score<br />
for that section.<br />
Solution: Section 1 had the higher median score of approximately 75.<br />
(c) (1 point) A useful measure of variation is the inter-quartile range which is calculated as<br />
IQR = Q3 − Q1. Find the approximate IQR for section 2.<br />
Solution: For section 2 the approximate values for Q1 and Q3 are:<br />
> Q1 = 65<br />
> Q3 = 80<br />
> IQR = Q3 − Q1<br />
> IQR<br />
[ 1 ] 15<br />
(d) (1 point) What percent of data lies within the IQR?<br />
Solution: Between the first and third quarter is 50% of the data since the quarters<br />
break the data into four equal parts.<br />
8. (2 points) What is the probability of randomly selecting three people all born on the same day<br />
of the year? (Ignore leap years).<br />
Instructor: <strong>Anthony</strong> <strong>Tanbakuchi</strong> Points earned: / 6 points