SOLUTIONS MAT 167: Statistics Test I - Anthony Tanbakuchi
SOLUTIONS MAT 167: Statistics Test I - Anthony Tanbakuchi
SOLUTIONS MAT 167: Statistics Test I - Anthony Tanbakuchi

You also want an ePaper? Increase the reach of your titles
YUMPU automatically turns print PDFs into web optimized ePapers that Google loves.
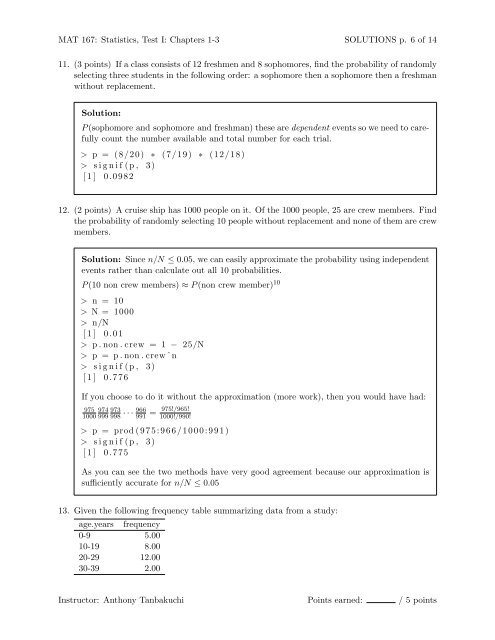
<strong>MAT</strong> <strong>167</strong>: <strong>Statistics</strong>, <strong>Test</strong> I: Chapters 1-3 <strong>SOLUTIONS</strong> p. 6 of 14<br />
11. (3 points) If a class consists of 12 freshmen and 8 sophomores, find the probability of randomly<br />
selecting three students in the following order: a sophomore then a sophomore then a freshman<br />
without replacement.<br />
Solution:<br />
P (sophomore and sophomore and freshman) these are dependent events so we need to carefully<br />
count the number available and total number for each trial.<br />
> p = (8/20) ∗ (7/19) ∗ (12/18)<br />
> s i g n i f (p , 3)<br />
[ 1 ] 0.0982<br />
12. (2 points) A cruise ship has 1000 people on it. Of the 1000 people, 25 are crew members. Find<br />
the probability of randomly selecting 10 people without replacement and none of them are crew<br />
members.<br />
Solution: Since n/N ≤ 0.05, we can easily approximate the probability using independent<br />
events rather than calculate out all 10 probabilities.<br />
P (10 non crew members) ≈ P (non crew member) 10<br />
> n = 10<br />
> N = 1000<br />
> n/N<br />
[ 1 ] 0 .01<br />
> p . non . crew = 1 − 25/N<br />
> p = p . non . crew ˆn<br />
> s i g n i f (p , 3)<br />
[ 1 ] 0.776<br />
If you choose to do it without the approximation (more work), then you would have had:<br />
975 974 973<br />
1000 999 998<br />
966 975!/965!<br />
· · · 991 = 1000!/990!<br />
> p = prod ( 9 7 5 : 9 6 6 / 1 0 0 0 : 9 9 1 )<br />
> s i g n i f (p , 3)<br />
[ 1 ] 0.775<br />
As you can see the two methods have very good agreement because our approximation is<br />
sufficiently accurate for n/N ≤ 0.05<br />
13. Given the following frequency table summarizing data from a study:<br />
age.years frequency<br />
0-9 5.00<br />
10-19 8.00<br />
20-29 12.00<br />
30-39 2.00<br />
Instructor: <strong>Anthony</strong> <strong>Tanbakuchi</strong> Points earned: / 5 points