24.02.2010 annual report 2009.pdf - Woodside
24.02.2010 annual report 2009.pdf - Woodside
24.02.2010 annual report 2009.pdf - Woodside

Create successful ePaper yourself
Turn your PDF publications into a flip-book with our unique Google optimized e-Paper software.
92<br />
Notes to and forming part<br />
of the financial <strong>report</strong><br />
For the year ended 31 December 2009<br />
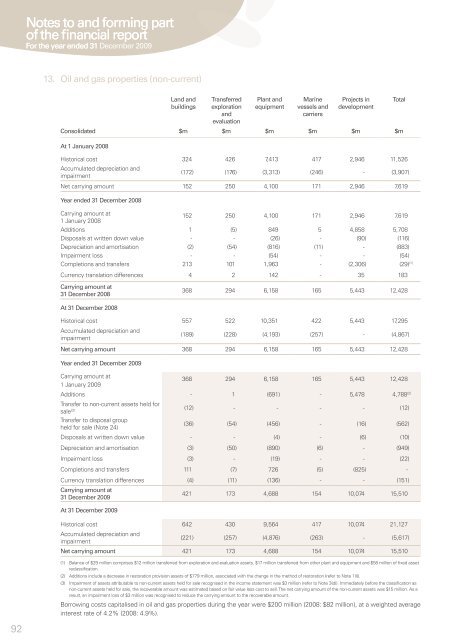
13. Oil and gas properties (non-current)<br />
Land and<br />
buildings<br />
Transferred<br />
exploration<br />
and<br />
evaluation<br />
Plant and<br />
equipment<br />
Marine<br />
vessels and<br />
carriers<br />
Projects in<br />
development<br />
Consolidated $m $m $m $m $m $m<br />
At 1 January 2008<br />
Historical cost 324 426 7,413 417 2,946 11,526<br />
Accumulated depreciation and<br />
impairment<br />
(172) (176) (3,313) (246) - (3,907)<br />
Net carrying amount 152 250 4,100 171 2,946 7,619<br />
Year ended 31 December 2008<br />
Carrying amount at<br />
1 January 2008<br />
152 250 4,100 171 2,946 7,619<br />
Additions 1 (5) 849 5 4,858 5,708<br />
Disposals at written down value - - (26) - (90) (116)<br />
Depreciation and amortisation (2) (54) (816) (11) - (883)<br />
Impairment loss - - (54) - - (54)<br />
Completions and transfers 213 101 1,963 - (2,306) (29) (1)<br />
Currency translation differences 4 2 142 - 35 183<br />
Carrying amount at<br />
31 December 2008<br />
At 31 December 2008<br />
Total<br />
368 294 6,158 165 5,443 12,428<br />
Historical cost 557 522 10,351 422 5,443 17,295<br />
Accumulated depreciation and<br />
impairment<br />
(189) (228) (4,193) (257) - (4,867)<br />
Net carrying amount 368 294 6,158 165 5,443 12,428<br />
Year ended 31 December 2009<br />
Carrying amount at<br />
1 January 2009<br />
368 294 6,158 165 5,443 12,428<br />
Additions - 1 (691) - 5,478 4,788 (2)<br />
Transfer to non-current assets held for<br />
sale (3) (12) - - - - (12)<br />
Transfer to disposal group<br />
held for sale (Note 24)<br />
(36) (54) (456) - (16) (562)<br />
Disposals at written down value - - (4) - (6) (10)<br />
Depreciation and amortisation (3) (50) (890) (6) - (949)<br />
Impairment loss (3) - (19) - - (22)<br />
Completions and transfers 111 (7) 726 (5) (825) -<br />
Currency translation differences (4) (11) (136) - - (151)<br />
Carrying amount at<br />
31 December 2009<br />
421 173 4,688 154 10,074 15,510<br />
At 31 December 2009<br />
Historical cost 642 430 9,564 417 10,074 21,127<br />
Accumulated depreciation and<br />
impairment<br />
(221) (257) (4,876) (263) - (5,617)<br />
Net carrying amount 421 173 4,688 154 10,074 15,510<br />
(1) Balance of $29 million comprises $12 million transferred from exploration and evaluation assets, $17 million transferred from other plant and equipment and $58 million of fixed asset<br />
reclassification.<br />
(2) Additions include a decrease in restoration provision assets of $779 million, associated with the change in the method of restoration (refer to Note 1(l)).<br />
(3) Impairment of assets attributable to non-current assets held for sale recognised in the income statement was $3 million (refer to Note 3(d)). Immediately before the classification as<br />
non-current assets held for sale, the recoverable amount was estimated based on fair value less cost to sell. The net carrying amount of the non-current assets was $15 million. As a<br />
result, an impairment loss of $3 million was recognised to reduce the carrying amount to the recoverable amount.<br />
Borrowing costs capitalised in oil and gas properties during the year were $200 million (2008: $82 million), at a weighted average<br />
interest rate of 4.2% (2008: 4.9%).