Chatroom - Hong Kong Exchanges and Clearing Limited
Chatroom - Hong Kong Exchanges and Clearing Limited
Chatroom - Hong Kong Exchanges and Clearing Limited

You also want an ePaper? Increase the reach of your titles
YUMPU automatically turns print PDFs into web optimized ePapers that Google loves.
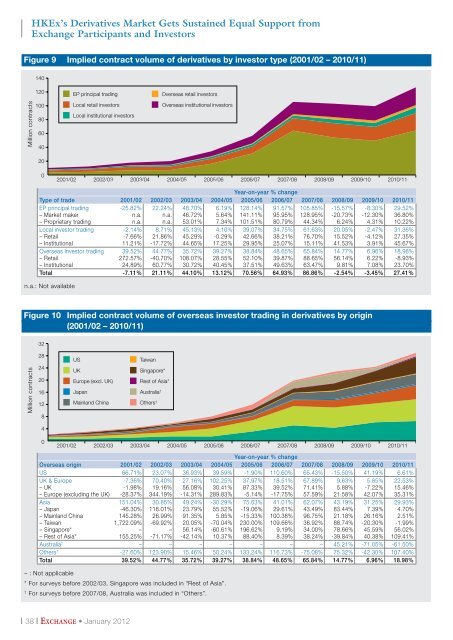
HKEx’s Derivatives Market Gets Sustained Equal Support from<br />
Exchange Participants <strong>and</strong> Investors<br />
Figure 9 Implied contract volume of derivatives by investor type (2001/02 – 2010/11)<br />
Million contracts<br />
Year-on-year % change<br />
Type of trade 2001/02 2002/03 2003/04 2004/05 2005/06 2006/07 2007/08 2008/09 2009/10 2010/11<br />
EP principal trading -25.82% 22.24% 48.70% 6.19% 128.14% 91.57% 105.85% -15.57% -8.30% 29.52%<br />
– Market maker n.a. n.a. 46.72% 5.64% 141.11% 95.95% 128.95% -20.73% -12.30% 36.80%<br />
– Proprietary trading n.a. n.a. 53.01% 7.34% 101.51% 80.79% 44.34% 6.24% 4.31% 10.22%<br />
Local investor trading -2.14% 8.71% 45.13% 4.10% 39.07% 34.75% 61.63% 20.05% -2.47% 31.36%<br />
– Retail -7.66% 21.86% 45.29% -0.29% 42.66% 38.21% 76.70% 15.52% -4.12% 27.35%<br />
– Institutional 11.21% -17.72% 44.65% 17.25% 29.95% 25.07% 15.11% 41.53% 3.91% 45.67%<br />
Overseas investor trading 39.52% 44.77% 35.72% 39.27% 38.84% 48.65% 65.84% 14.77% 6.96% 18.98%<br />
– Retail 272.57% -40.70% 108.07% 28.55% 52.10% 39.87% 88.65% 56.14% 6.22% -8.93%<br />
– Institutional 24.89% 60.77% 30.72% 40.45% 37.51% 49.63% 63.47% 9.81% 7.08% 23.70%<br />
Total -7.11% 21.11% 44.10% 13.12% 70.56% 64.93% 86.86% -2.54% -3.45% 27.41%<br />
n.a.: Not available<br />
Figure 10 Implied contract volume of overseas investor trading in derivatives by origin<br />
(2001/02 – 2010/11)<br />
Million contracts<br />
Year-on-year % change<br />
Overseas origin 2001/02 2002/03 2003/04 2004/05 2005/06 2006/07 2007/08 2008/09 2009/10 2010/11<br />
US 66.71% 23.07% 36.93% 39.59% -1.90% 110.60% 65.43% -15.50% 41.19% 6.61%<br />
UK & Europe -7.36% 70.40% 27.16% 102.25% 37.97% 18.51% 67.89% 9.63% 5.85% 22.53%<br />
– UK -1.98% 19.16% 56.08% 30.41% 87.33% 39.52% 71.41% 5.88% -7.22% 15.46%<br />
– Europe (excluding the UK) -28.37% 344.19% -14.31% 289.83% -5.14% -17.75% 57.59% 21.58% 42.07% 35.31%<br />
Asia 151.04% 30.85% 49.24% -30.29% 75.63% 41.01% 62.07% 43.19% 31.25% 29.93%<br />
– Japan -46.30% 118.01% 23.79% 55.52% -19.06% 29.61% 43.49% 83.44% 7.39% 4.70%<br />
– Mainl<strong>and</strong> China 145.28% 26.99% 91.35% 5.85% -15.33% 100.38% 96.75% 21.18% 26.16% 2.51%<br />
– Taiwan 1,722.09% -69.92% 20.05% -70.04% 230.00% 109.66% 36.92% 88.74% -20.30% -1.99%<br />
– Singapore* – – 56.14% -60.61% 196.62% 9.19% 34.00% 78.66% 45.59% 56.02%<br />
– Rest of Asia* 155.25% -71.17% -42.14% 10.37% 88.40% 8.39% 38.24% -39.84% 40.38% 109.41%<br />
Australia † – – – – – – – 45.21% -71.05% -61.50%<br />
Others † -27.60% 123.90% 15.46% 50.24% 133.24% 116.73% -75.08% 75.32% -42.30% 107.40%<br />
Total 39.52% 44.77% 35.72% 39.27% 38.84% 48.65% 65.84% 14.77% 6.96% 18.98%<br />
– : Not applicable<br />
* For surveys before 2002/03, Singapore was included in “Rest of Asia”.<br />
† For surveys before 2007/08, Australia was included in “Others”.<br />
38 Exchange • January 2012