electing the inlet size of a variable air volume (VAV ... - ashrae
electing the inlet size of a variable air volume (VAV ... - ashrae
electing the inlet size of a variable air volume (VAV ... - ashrae

Create successful ePaper yourself
Turn your PDF publications into a flip-book with our unique Google optimized e-Paper software.
By Steven T. Taylor, P.E., Fellow ASHRAE, and Jeff Stein, P.E., Member ASHRAE<br />
S<br />
The following article was published in ASHRAE Journal, March 2004. © Copyright 2004 American Society <strong>of</strong> Heating, Refrigerating and Air-<br />
Conditioning Engineers, Inc. It is presented for educational purposes only. This article may not be copied and/or distributed electronically or<br />
in paper form without permission <strong>of</strong> ASHRAE.<br />
<strong>electing</strong> <strong>the</strong> <strong>inlet</strong> <strong>size</strong> <strong>of</strong> a <strong>variable</strong> <strong>air</strong> <strong>volume</strong> (<strong>VAV</strong>) terminal box<br />
requires <strong>the</strong> consideration <strong>of</strong> five factors: (1) pressure drop across<br />
<strong>the</strong> box; (2) ability <strong>of</strong> <strong>the</strong> <strong>VAV</strong> box controller to measure and control<br />
<strong>the</strong> desired minimum and maximum <strong>air</strong>flow setpoints; (3) first costs <strong>of</strong><br />
<strong>the</strong> <strong>VAV</strong> box, its installation, and controls; (4) noise generation; and (5)<br />
space constraints.<br />
The first three considerations affect<br />
energy costs and first costs and ideally<br />
should be balanced to minimize lifecycle<br />
cost (LCC). The last two considerations<br />
represent installation and<br />
application constraints that can limit <strong>the</strong><br />
LCC optimum selection. This article<br />
summarizes a detailed analysis <strong>of</strong> <strong>VAV</strong><br />
box control and selection 1 and provides<br />
<strong>VAV</strong> boxes sizing criteria that will minimize<br />
LCC in typical applications.<br />
<strong>VAV</strong> Controls and Airflow Setpoints<br />
Figure 1 shows a single duct <strong>VAV</strong> box<br />
using pressure independent control<br />
logic. Pressure independent controls use<br />
two cascading control loops. The first<br />
loop controls space temperature; its output<br />
is an <strong>air</strong>flow setpoint limited to a<br />
range between <strong>the</strong> minimum <strong>air</strong>flow<br />
setpoint (V min ) and <strong>the</strong> maximum <strong>air</strong>flow<br />
setpoint (V max ). This setpoint is <strong>the</strong>n sent<br />
to <strong>the</strong> second control loop, which modulates<br />
<strong>the</strong> <strong>VAV</strong> damper to maintain <strong>the</strong> box<br />
<strong>air</strong>flow rate at setpoint.<br />
V max and V min are shown in Figure 2, a<br />
control schematic for a typical <strong>VAV</strong> reheat<br />
(VRH) box, and Figure 3, a control<br />
schematic for a parallel fan-powered <strong>VAV</strong><br />
(FPV) box. For both box types, V max is<br />
typically <strong>the</strong> design cooling <strong>air</strong>flow rate.<br />
For VRH boxes, V min is typically selected<br />
to be <strong>the</strong> largest <strong>of</strong> <strong>the</strong> following:<br />
1. The <strong>air</strong>flow required to meet <strong>the</strong> design<br />
heating load at a supply <strong>air</strong> temperature<br />
that is not too warm, e.g., ≤ 90°F<br />
(≤ 32°C). Warmer temperatures tend to<br />
result in poor temperature control due to<br />
stratification and short circuiting. 2<br />
2. The <strong>air</strong>flow required to prevent<br />
“dumping” and poor distribution. This<br />
limit depends on <strong>the</strong> diffuser style and<br />
sizing. Thirty percent is a common rule<strong>of</strong>-thumb<br />
but some research has shown<br />
that lower rates are satisfactory. 6<br />
3. The minimum required for ventilation.<br />
Depending on <strong>the</strong> code one is designing<br />
to, determining this rate can be<br />
About <strong>the</strong> Authors<br />
Steven T. Taylor, P.E., is a principal, and Jeff<br />
Stein, P.E., is a senior engineer at Taylor Engineering<br />
in Alameda, Calif.<br />
30 ASHRAE Journal <strong>ashrae</strong>.org March 2004
From Supply<br />
Duct Main<br />
simple (e.g., California’s Title 243 ) or it can be<br />
complex due to varying supply <strong>air</strong> rates and outdoor<br />
<strong>air</strong> percentage (e.g., ANSI/ASHRAE Standard<br />
62, Ventilation for Acceptable Indoor Air<br />
Quality4 ).<br />
For <strong>the</strong> FPV box, only <strong>the</strong> last issue typically<br />
applies because <strong>the</strong> parallel fan operation ensures<br />
sufficiently high supply <strong>air</strong> rates in <strong>the</strong> heating<br />
mode and at <strong>the</strong> diffuser. California’s Title 243 and <strong>the</strong> latest version <strong>of</strong> ASHRAE Standard 624 allow <strong>the</strong> designer to take credit for <strong>the</strong> dilution<br />
<strong>of</strong>fered by <strong>the</strong> transfer <strong>air</strong> supplied by <strong>the</strong> FPV<br />
fan. This allows <strong>the</strong> minimum primary <strong>air</strong>flow to<br />
<strong>the</strong> zone, Vmin , to be reduced to very low levels,<br />
even to zero in some cases depending on <strong>the</strong> details<br />
<strong>of</strong> <strong>the</strong> design.<br />
The above three factors determine <strong>the</strong> lowest<br />
required value <strong>of</strong> Vmin . On <strong>the</strong> high side, Vmin is<br />
limited by energy codes to minimize reheat energy<br />
losses. Both California’s Title 243 and<br />
ASHRAE Standard 90.15 limit Vmin to <strong>the</strong> largest<br />
<strong>of</strong>:<br />
30% <strong>of</strong> Vmax ;<br />
The minimum required for ventilation;<br />
0.4 cfm/ft2 (2 L/s per m2 100%<br />
0%<br />
) <strong>of</strong> conditioned floor<br />
area <strong>of</strong> <strong>the</strong> zone; and<br />
300 cfm (142 L/s).<br />
Vmin can have an impact on <strong>VAV</strong> box sizing<br />
because pressure independent controllers have a<br />
limit to how low <strong>the</strong>ir setpoint can be. The lowest<br />
non-zero setpoint is a function <strong>of</strong> <strong>the</strong> characteristics<br />
<strong>of</strong> <strong>the</strong> flow probe located at <strong>the</strong> box <strong>inlet</strong><br />
(Figure 1) and <strong>the</strong> accuracy <strong>of</strong> <strong>the</strong> transducer/<br />
100%<br />
controller (see sidebar). Different box <strong>size</strong>s using<br />
<strong>the</strong> same flow probes and<br />
0%<br />
transducer/controllers will have approximately<br />
<strong>the</strong> same minimum controllable velocity. Since<br />
<strong>the</strong> minimum velocity is <strong>the</strong> same, <strong>the</strong> larger <strong>the</strong><br />
<strong>VAV</strong> box, <strong>the</strong> higher <strong>the</strong> minimum <strong>air</strong>flow setpoint. For FPV<br />
systems that can meet ventilation codes at very low primary<br />
<strong>air</strong>flow rates, <strong>the</strong> minimum setpoint allowed by <strong>the</strong> controller<br />
can be higher than that required for ventilation. Thus, a larger<br />
box serving a given zone may need a higher minimum<br />
setpoint, which will result in higher central fan energy, reheat<br />
energy, and possibly cooling energy (for systems without<br />
economizers).<br />
This limitation typically does not affect VRH systems with<br />
digital controls because <strong>the</strong> minimum setpoint for proper heat-<br />
Total Pressure<br />
Static Pressure<br />
Differential<br />
Pressure<br />
Transmitter<br />
Reset Input<br />
<strong>VAV</strong> Box<br />
ing diffuser performance (e.g., 30% <strong>of</strong> V max ) is generally much<br />
higher than <strong>the</strong> lowest controller setpoint (see table in sidebar)<br />
unless <strong>the</strong> box is significantly over<strong>size</strong>d. It can be a limitation<br />
for VRH systems with pneumatic controls, which have relatively<br />
high minimum setpoints, or with digital controls when<br />
a “dual maximum” control strategy is used (see Reference 1<br />
for a complete description <strong>of</strong> this strategy).<br />
Pressure Drop and Fan Energy<br />
The pressure drop across <strong>the</strong> <strong>VAV</strong> box at <strong>the</strong> zone design<br />
March 2004 ASHRAE Journal 31<br />
DPT<br />
Figure 1: Typical <strong>VAV</strong> box controls.<br />
Percent Capacity<br />
Percent Capacity<br />
Hot Water<br />
Valve<br />
Heating Loop<br />
Deadband<br />
Figure 2: <strong>VAV</strong> reheat control diagram.<br />
Hot Water<br />
Valve<br />
Heating Loop<br />
Parallel Fan<br />
Deadband<br />
DM<br />
C<br />
Cold<br />
Supply Air<br />
V min<br />
To Space<br />
Space<br />
Thermostat<br />
Pressure T<br />
Independent<br />
Controller<br />
Cold<br />
Supply Air<br />
V min<br />
Cooling Loop<br />
Cooling Loop<br />
Figure 3: Parallel fan-powered <strong>VAV</strong> control diagram.<br />
V max<br />
V max
<strong>air</strong>flow rate will affect <strong>the</strong> design pressure required<br />
by <strong>the</strong> supply <strong>air</strong> fan, provided <strong>the</strong> box is in <strong>the</strong><br />
“critical path” or “index run,” which is <strong>the</strong> <strong>air</strong>flow<br />
path that has <strong>the</strong> highest overall pressure drop.<br />
Assuming this to be <strong>the</strong> case (more on this later),<br />
<strong>the</strong> greater <strong>the</strong> pressure drop across <strong>the</strong> box, <strong>the</strong><br />
greater <strong>the</strong> fan power. <strong>VAV</strong> boxes with smaller <strong>inlet</strong>s<br />
will have higher pressure drops and, hence,<br />
will result in higher fan energy.<br />
<strong>VAV</strong> box pressure drops can be expressed in<br />
terms <strong>of</strong> both static pressure drop and total pressure<br />
drop, which are related by Equation 1:<br />
∆TP<br />
= ∆SP<br />
+ ∆VP<br />
⎡<br />
⎛ v ⎞<br />
= ∆SP<br />
+ ⎢ in<br />
⎜ ⎟<br />
⎢<br />
⎣<br />
⎝ 4005 ⎠<br />
(1)<br />
⎡<br />
⎛ 4Q<br />
= ∆SP<br />
+ ⎢⎜<br />
⎢<br />
⎣<br />
⎝ 4005πD<br />
2<br />
2<br />
⎛ v ⎞<br />
⎤<br />
− out<br />
⎜ ⎟ ⎥<br />
⎝ 4005 ⎠ ⎥<br />
⎦<br />
⎞<br />
⎟<br />
⎠<br />
2<br />
⎛<br />
− ⎜<br />
⎝<br />
2 4005<br />
2<br />
Q ⎞<br />
⎤<br />
⎟ ⎥<br />
WH ⎠ ⎥<br />
⎦<br />
Incremental LCC<br />
$/1,000 ft2 Incremental LCC<br />
$/1,000 ft2 where<br />
∆TP is <strong>the</strong> total pressure drop<br />
∆SP is <strong>the</strong> static pressure drop<br />
∆VP is <strong>the</strong> velocity pressure drop<br />
v in and v out are <strong>the</strong> <strong>inlet</strong> and outlet velocities<br />
Q is <strong>the</strong> <strong>air</strong>flow rate<br />
D is <strong>the</strong> box <strong>inlet</strong> diameter<br />
W and H are <strong>the</strong> inside (clear) width and height <strong>of</strong> <strong>the</strong><br />
box outlet (outside dimensions less insulation thickness)<br />
The static pressure drop across standard commercial <strong>VAV</strong><br />
boxes is always lower than <strong>the</strong> total pressure drop since <strong>the</strong><br />
velocity at <strong>the</strong> box <strong>inlet</strong> is much higher than <strong>the</strong> outlet velocity,<br />
resulting in static pressure regain. But <strong>the</strong> total pressure<br />
drop is <strong>the</strong> true indicator <strong>of</strong> <strong>the</strong> fan energy required to<br />
deliver <strong>the</strong> design <strong>air</strong>flow through <strong>the</strong> box since <strong>the</strong> fan has<br />
to generate both <strong>the</strong> pressure and velocity at <strong>the</strong> box <strong>inlet</strong>.<br />
Therefore total pressure drop, not static pressure drop, should<br />
be used to evaluate and select <strong>VAV</strong> boxes. Using static pressure<br />
drop can be misleading since <strong>VAV</strong> boxes from different<br />
manufacturers may have different outlet dimensions, and,<br />
hence, different outlet velocity pressures. Unfortunately,<br />
most <strong>VAV</strong> box manufacturers do not list total pressure drop<br />
in catalogs. If not, it can be calculated using Equation 1.<br />
Simulations<br />
The previous discussion established <strong>the</strong> fundamentals <strong>of</strong><br />
how <strong>VAV</strong> box selection affects energy usage. To calculate <strong>the</strong><br />
magnitude <strong>of</strong> <strong>the</strong> impact, a prototypical Oakland, Calif. <strong>of</strong>fice<br />
building was simulated using <strong>the</strong> DOE-2.2 computer<br />
program. Local utility rates were modeled with resulting<br />
blended rates on <strong>the</strong> order <strong>of</strong> $0.13/kWh and $0.59/<strong>the</strong>rm.<br />
$60<br />
$40<br />
$20<br />
$0<br />
0.3 in. 0.4 in. 0.5 in. 0.6 in. 0.7 in. 0.8 in.<br />
Design Box Total Pressure<br />
Figure 4: Incremental life-cycle cost for VRH system as a function <strong>of</strong><br />
<strong>VAV</strong> box total pressure drop.<br />
$80<br />
$60<br />
$40<br />
$20<br />
$0<br />
VRH System<br />
FPV System<br />
0.3 in. 0.4 in. 0.5 in. 0.6 in. 0.7 in. 0.8 in.<br />
Design Box Total Pressure<br />
Figure 5: Incremental life-cycle cost for FPV system as a function <strong>of</strong> <strong>VAV</strong><br />
box total pressure drop.<br />
<strong>VAV</strong> systems with <strong>variable</strong> speed supply fans were modeled<br />
using <strong>the</strong> two <strong>VAV</strong> box types shown in Figures 2 and 3. For FPV<br />
boxes, V min was set to <strong>the</strong> larger <strong>of</strong> 0.15 cfm/ft 2 (0.8 L/s per m 2 )<br />
and <strong>the</strong> lowest box setpoint (see sidebar), which varies by box<br />
<strong>inlet</strong> <strong>size</strong>. V min was set to 30% for VRH boxes. First costs were<br />
determined by averaging contractor costs for <strong>VAV</strong> boxes from<br />
two popular manufacturers and adding a 25% contractor<br />
markup. Installation costs were assumed to be <strong>the</strong> same for all<br />
boxes. The cost differences for <strong>inlet</strong> reducers and discharge<br />
plenums were ignored, mainly because <strong>the</strong>re was no easy way<br />
to account for <strong>the</strong>m. Life-cycle costs were calculated over a<br />
15-year life using a discount rate <strong>of</strong> 8% and 0% escalation<br />
rates for both electricity and gas.<br />
Results<br />
The incremental life-cycle cost impact <strong>of</strong> <strong>VAV</strong> boxes <strong>size</strong>d for<br />
0.3 in. w.g. to 0.8 in. w.g. (75 Pa to 200 Pa) ∆TP at design <strong>air</strong>flow<br />
rates are shown in Figures 4 and 5 for VRH and FPV systems,<br />
respectively. The results indicate that for optimum life cycles<br />
costs, VRH boxes should be <strong>size</strong>d for 0.5 in. w.g. to 0.6 in. w.g.<br />
(125 Pa to 150 Pa) total pressure drop while FPV systems should<br />
be <strong>size</strong>d for 0.6 in. w.g. to 0.7 in. w.g. (150 Pa to 175 Pa) total<br />
pressure drop. However, LCC differences among <strong>the</strong> options and<br />
systems are quite small, only a few cents per square foot per year.<br />
This is because first costs favor smaller boxes while energy<br />
costs favor bigger boxes, and both effects are small. Energy<br />
savings are small because <strong>the</strong> design pressure drop only occurs<br />
at peak conditions; pressure drop and fan energy drop quickly<br />
(nearly with <strong>the</strong> square and cube <strong>of</strong> flow, respectively) at partload<br />
conditions. Life-cycle costs for FPV systems favor smaller<br />
32 ASHRAE Journal <strong>ashrae</strong>.org March 2004
oxes than VRH systems because sizing<br />
affects <strong>the</strong> minimum <strong>air</strong>flow<br />
setpoint as well as pressure drop, so<br />
reheat energy increases when boxes<br />
are over<strong>size</strong>d.<br />
To test <strong>the</strong> sensitivity <strong>of</strong> modeling<br />
assumptions, parametric runs<br />
were made with varying sizing assumptions<br />
(undersizing and<br />
oversizing), controller minimum<br />
setpoint, wea<strong>the</strong>r, occupancy<br />
schedule, internal loads, supply <strong>air</strong><br />
temperature, utility rates, and window<br />
area. In all cases, <strong>the</strong> LCC optimum<br />
pressure drops were very<br />
similar to those shown in Figures 4<br />
and 5.<br />
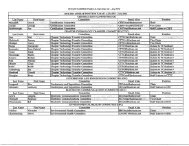
Table 1 shows performance data<br />
for a particular <strong>VAV</strong> box manufacturer based on total pressure<br />
drops <strong>of</strong> 0.5 in. w.g. and 0.6 in. w.g. (125 Pa and 150 Pa),<br />
including <strong>the</strong> pressure drop across a hot water reheat coil. At<br />
<strong>the</strong>se total pressure drops, noise is not likely to be an issue<br />
for this particular line <strong>of</strong> <strong>VAV</strong> boxes for most applications, as<br />
indicated by <strong>the</strong> NC levels from radiated noise predicted by<br />
<strong>the</strong> selection s<strong>of</strong>tware. For o<strong>the</strong>r manufacturers, higher design<br />
pressure drops, and for noise sensitive applications, this<br />
may not be <strong>the</strong> case.<br />
Sizing <strong>of</strong> Non-Critical Zones<br />
As noted previously, box pressure drop only affects fan<br />
energy if <strong>the</strong> box is in <strong>the</strong> “critical path,” <strong>the</strong> <strong>air</strong>flow path<br />
requiring <strong>the</strong> most fan pressure. Arguably <strong>the</strong>n, <strong>the</strong> sizing<br />
criteria suggested by Figures 4 and 5 apply only to <strong>the</strong>se<br />
zones, while <strong>VAV</strong> boxes closer to <strong>the</strong> fan hydraulically, where<br />
excess pressure is available, could be <strong>size</strong>d for a greater<br />
pressure drop. However, we recommend that a consistent<br />
pressure drop sizing criterion be used for all boxes regardless<br />
<strong>of</strong> location for following reasons.<br />
First and foremost, it is much simpler. Designers would<br />
not have to determine where boxes are located along <strong>the</strong><br />
duct mains before sizing <strong>the</strong>m. Automated sizing programs<br />
or spreadsheets could <strong>the</strong>n be used much more easily.<br />
“Undersizing” boxes to absorb excess pressure is limited<br />
by noise constraints. As pressure drop increases, noise generation<br />
increases.<br />
Energy codes 3,5 require that static pressure setpoints used<br />
for fan capacity control be reset to satisfy <strong>the</strong> box requiring<br />
<strong>the</strong> most static pressure, and as loads shift throughout <strong>the</strong><br />
day and year <strong>the</strong> most demanding box will change.<br />
Figures 6, 7, and 8 are images <strong>of</strong> <strong>VAV</strong> box zone demand at<br />
different times <strong>of</strong> day for an <strong>of</strong>fice building in Sacramento,<br />
Calif. All three images are taken on <strong>the</strong> same day, Aug. 5,<br />
2002. At 7 a.m., Zone 14 on <strong>the</strong> sou<strong>the</strong>ast corner <strong>of</strong> <strong>the</strong> build-<br />
Total Pressure Drop = 0.5 in. w.g. Total Pressure Drop = 0.6 in. w.g.<br />
Inlet Outlet Outlet<br />
Size Width Height<br />
Static Velocity<br />
(in.) (in.) (in.)<br />
Pressure pressure Max<br />
Drop (in. drop (in. cfm<br />
Static Velocity<br />
Radiated Pressure Pressure<br />
NC Drop (in. Drop (in.<br />
Max<br />
cfm<br />
Radiated<br />
NC<br />
w.g.)* w.g.)<br />
w.g.)* w.g.)<br />
4 12 8 0.08 0.42 230 24 * * * *<br />
5 12 8 0.15 0.35 333 24 0.18 0.41 360 24<br />
6 12 8 0.24 0.25 425 24 0.29 0.31 470 25<br />
7 12 10 0.25 0.25 580 23 0.30 0.30 640 24<br />
8 12 10 0.33 0.17 715 23 0.36 0.24 790 24<br />
9 14 13 0.27 0.23 930 20 0.32 0.28 1,030 23<br />
10 14 13 0.32 0.18 1,100 23 0.38 0.22 1,210 25<br />
12 16 15 0.32 0.17 1,560 23 0.39 0.21 1,720 24<br />
14 20 18 0.31 0.19 2,130 22 0.37 0.23 2,350 23<br />
16 24 18 0.32 0.18 2,730 25 0.39 0.21 3,010 26<br />
* For <strong>the</strong> 4 in. <strong>inlet</strong> <strong>size</strong>, 230 cfm is <strong>the</strong> maximum rate allowed by <strong>the</strong> manufacturer's manufacturer’s selection<br />
program.<br />
Table 1: <strong>VAV</strong> reheat box maximum <strong>air</strong>flow rates.<br />
ing has <strong>the</strong> most demand. Later that morning at 9 a.m., Zone<br />
36 in <strong>the</strong> interior <strong>of</strong> <strong>the</strong> building experiences <strong>the</strong> most demand.<br />
At 5 p.m., <strong>the</strong> high demand has shifted to Zone 30 in<br />
<strong>the</strong> northwest corner. Throughout <strong>the</strong> period monitored (<strong>the</strong><br />
better part <strong>of</strong> a year), <strong>the</strong> peak zone changed throughout <strong>the</strong><br />
floor plate, including both interior and perimeter zones. Hence,<br />
<strong>the</strong> zone requiring <strong>the</strong> most static pressure could vary throughout<br />
<strong>the</strong> day. If fan static pressure is reset to meet <strong>the</strong> requirements<br />
<strong>of</strong> only <strong>the</strong> zone requiring <strong>the</strong> most pressure, and if<br />
boxes close to <strong>the</strong> fan are under<strong>size</strong>d to dissipate excess pressure<br />
that is available at design conditions, <strong>the</strong>n fan pressure<br />
and fan energy would increase when <strong>the</strong>se boxes become <strong>the</strong><br />
most demanding during <strong>of</strong>f-design conditions.<br />
Conclusions<br />
Life-cycle costs over a wide range <strong>of</strong> economic and operating<br />
assumptions were found to be minimized when VRH boxes<br />
(and o<strong>the</strong>r box types with high minimum <strong>volume</strong> setpoints)<br />
were <strong>size</strong>d for a maximum total pressure drop <strong>of</strong> 0.5 in. w.g. to<br />
0.6 in. w.g. (125 Pa to 150 Pa). Similarly, life-cycle costs for<br />
FPV boxes (and o<strong>the</strong>r box types with low minimum <strong>volume</strong><br />
setpoints) were minimized when boxes were <strong>size</strong>d for a maximum<br />
<strong>of</strong> 0.6 in. w.g. to 0.7 in. w.g. (150 Pa to 175 Pa) total<br />
pressure drop. It is important to note that <strong>the</strong>se sizing criteria<br />
apply to <strong>the</strong> total pressure drop, not <strong>the</strong> static pressure drop,<br />
across <strong>the</strong> box including reheat coils.<br />
Acknowledgments<br />
The research for this article was funded by a Public Interest<br />
Energy Research (PIER) grant from <strong>the</strong> California Energy Commission.<br />
The authors would like to acknowledge <strong>the</strong> input and<br />
work <strong>of</strong> o<strong>the</strong>r members <strong>of</strong> our research team, including Cathy<br />
Higgins <strong>of</strong> <strong>the</strong> New Buildings Institute, Mark Hydeman <strong>of</strong><br />
Taylor Engineering, and Erik Kolderup and Tianzhen Hong <strong>of</strong><br />
Eley Associates.<br />
March 2004 ASHRAE Journal 33
Damper<br />
% Open<br />
0%<br />
50%<br />
90%<br />
7<br />
30<br />
6<br />
28<br />
5<br />
23<br />
4 North<br />
29 27<br />
19<br />
8 31 26 25 24 22 21 20 3<br />
32<br />
18<br />
9<br />
33 34 37A 38 37B 39 16 17<br />
2<br />
35 36 15<br />
10 11 12 13 14, 85%<br />
1<br />
Figure 6: Site 3 <strong>VAV</strong> box demand (7 a.m., Aug. 5, 2002).<br />
Damper<br />
% Open<br />
0%<br />
50%<br />
90%<br />
8<br />
9<br />
35 36, 71% 15<br />
10 11 12 13 14<br />
Figure 7: Site 3 <strong>VAV</strong> box demand (9 a.m., Aug. 5, 2002).<br />
Damper<br />
% Open<br />
0%<br />
50%<br />
8<br />
32<br />
7<br />
30<br />
6<br />
28<br />
5<br />
23<br />
4<br />
29 27<br />
19<br />
31 26 25 24 22 21 20<br />
18<br />
37A<br />
2<br />
33 34 38 37B 39 16 17<br />
7<br />
30, 74%<br />
6<br />
28<br />
5<br />
23<br />
4<br />
29 27<br />
19<br />
31 26 25 24 22 21 20<br />
Figure 8: Site 3 <strong>VAV</strong> box demand (5 p.m., Aug. 5, 2002).<br />
North<br />
North<br />
90%<br />
9<br />
32<br />
33 34<br />
37A<br />
38 37B 39<br />
18<br />
16 17<br />
2<br />
10 11<br />
35<br />
12<br />
36<br />
13<br />
15<br />
14<br />
1<br />
References<br />
1. Hydeman, et al. 2003. Advanced Variable Air Volume System<br />
Design Guide, California Energy Commission, Sacramento,<br />
Calif., September. This guide was developed as a part <strong>of</strong> <strong>the</strong><br />
New Buildings Institute’s Public Interest Energy Research<br />
(PIER) Program for <strong>the</strong> California Energy Commission. Free<br />
copies <strong>of</strong> <strong>the</strong> guide are available at www.newbuildings.org/<br />
pier.<br />
2. 2001 ASHRAE Handbook—Fundamentals, Chapter 32.<br />
3. California Energy Commission. 2001. Title 24 Building<br />
Energy Efficiency Standards, California Code <strong>of</strong> Regulations,<br />
Part 6.<br />
4. Addendum 62n to ANSI/ASHRAE Standard 62-2001, Ventilation<br />
for Acceptable Indoor Air Quality.<br />
5. ANSI/ASHRAE/IESNA Standard 90.1-2001, Energy Standard<br />
for Buildings Except Low-Rise Residential Buildings.<br />
6. Bauman F.S., et al. 1995. Thermal Comfort with a Variable<br />
Air Volume (<strong>VAV</strong>) System. Center for Environmental Design<br />
Research, University <strong>of</strong> California, Berkeley.<br />
34 ASHRAE Journal<br />
3<br />
1<br />
3<br />
Determining<br />
Minimum<br />
Airflow Setpoint<br />
One limitation on <strong>the</strong> minimum <strong>air</strong>flow setpoint for<br />
<strong>the</strong> <strong>VAV</strong> box is <strong>the</strong> controllability <strong>of</strong> <strong>the</strong> box. <strong>VAV</strong> box<br />
manufacturers typically list a minimum recommended<br />
<strong>air</strong>flow setpoint for each box <strong>size</strong> and for each standard<br />
control option (e.g., pneumatic, analog electronic,<br />
and digital). However, <strong>the</strong> actual controllable minimum<br />
setpoint is usually much lower than <strong>the</strong> box<br />
manufacturer’s scheduled minimum when modern digital<br />
controls are used.<br />
The controllable minimum is a function <strong>of</strong> <strong>the</strong> design<br />
<strong>of</strong> <strong>the</strong> flow probe and <strong>the</strong> accuracy and precision<br />
<strong>of</strong> <strong>the</strong> digital conversion <strong>of</strong> <strong>the</strong> flow signal at <strong>the</strong> controller.<br />
The flow probe is installed in <strong>the</strong> <strong>VAV</strong> box <strong>inlet</strong> or<br />
outlet and provides an <strong>air</strong> pressure signal that is proportional<br />
to <strong>the</strong> velocity pressure <strong>of</strong> <strong>the</strong> <strong>air</strong>flow through<br />
<strong>the</strong> box. Flow probes, which are typically manufactured<br />
and factory installed in <strong>the</strong> <strong>VAV</strong> box by <strong>the</strong> box<br />
manufacturer, are designed to provide accurate signals<br />
even when <strong>inlet</strong> conditions are not ideal (e.g., an elbow<br />
close to <strong>the</strong> <strong>inlet</strong>) and to amplify <strong>the</strong> velocity<br />
pressure signal to improve low <strong>air</strong>flow measurement.<br />
The amplification factor varies significantly by <strong>VAV</strong><br />
box manufacturer and, to a lesser extent, by box <strong>size</strong>.<br />
The greater <strong>the</strong> amplification factor, <strong>the</strong> lower <strong>the</strong> controllable<br />
minimum. The <strong>VAV</strong> box manufacturer must<br />
balance this benefit with o<strong>the</strong>r design goals such as<br />
minimizing cost, pressure drop, and noise.<br />
The box controller must convert <strong>the</strong> velocity pressure<br />
signal from <strong>the</strong> probe to a control signal. To make<br />
this conversion, digital controls include a transducer<br />
to convert <strong>the</strong> velocity pressure signal to an analog<br />
electronic signal and an analog-to-digital (A/D) converter<br />
to convert <strong>the</strong> analog signal to “bits,” <strong>the</strong> digital<br />
information <strong>the</strong> controller can understand. For stable<br />
control around a setpoint, <strong>the</strong> controller must be able<br />
to sense changes to <strong>the</strong> velocity pressure that are not<br />
too abrupt. One controller manufacturer recommends<br />
a minimum setpoint equating to at least 14 bits for<br />
stable control.<br />
The steps to calculate <strong>the</strong> controllable minimum <strong>air</strong>flow<br />
rate (V m ) for a particular combination <strong>of</strong> <strong>VAV</strong> box<br />
and <strong>VAV</strong> box controller are as follows:<br />
1. Determine <strong>the</strong> velocity pressure sensor setpoint,
VPm in inches <strong>of</strong> water that equates to 14 bits. This will vary<br />
by manufacturer. For several manufacturers who were contacted,<br />
VPm can be as low as 0.004 in. w.g. (1 Pa). This will<br />
require a 10-bit (or higher) A/D converter and a 0 to 1 in. w.g.<br />
(0 to 250 Pa) or 0 to 1.5 in. w.g. (0 to 375 Pa) range transducer.<br />
Use <strong>of</strong> an 8-bit A/D converter or a transducer with a wider<br />
range can result in a stable control setpoint 0.01 in. w.g. (2.5<br />
Pa) or higher.<br />
2. Calculate <strong>the</strong> velocity pressure sensor amplification factor,<br />
F, from <strong>the</strong> manufacturers measured Q at 1 in. w.g. (250<br />
Pa) signal from <strong>the</strong> VP sensor as follows:<br />
2<br />
⎛ 4005A<br />
⎞<br />
F = ⎜ ⎟<br />
⎜ ⎟<br />
⎝ Q1in.<br />
⎠<br />
where A is <strong>the</strong> nominal duct area (ft 2 ), equal to:<br />
2<br />
24 ⎟ ⎛ D ⎞<br />
A = π⎜<br />
⎝ ⎠<br />
where D is <strong>the</strong> nominal duct diameter (in.).<br />
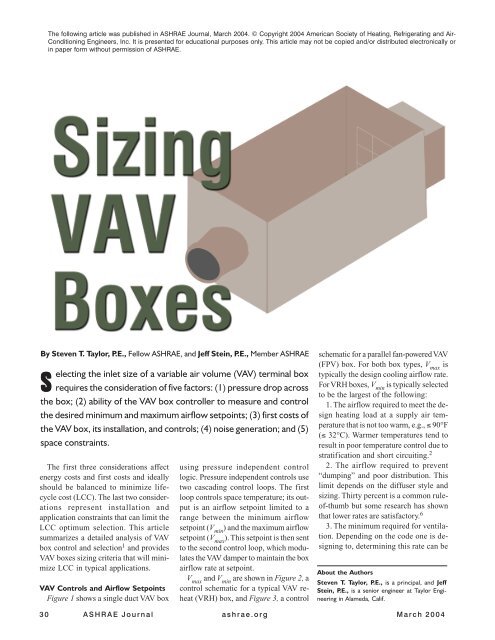
Figure 9 shows an example <strong>of</strong> a <strong>VAV</strong> box flow probe performance.<br />
The data on <strong>the</strong> right <strong>size</strong> <strong>of</strong> <strong>the</strong> graph are <strong>the</strong> <strong>air</strong>flow<br />
rates at 1 in. w.g. for various neck <strong>size</strong>s (shown on <strong>the</strong> left).<br />
For example using this figure, this manufacturer’s probe for<br />
an 8 in. (0.2 m) <strong>inlet</strong> box senses a 1 in. w.g. (250 Pa) signal at<br />
702 cfm (331 L/s).<br />
3. Calculate <strong>the</strong> minimum velocity v m for each <strong>VAV</strong> box<br />
<strong>size</strong> as:<br />
vm<br />
4005 =<br />
VP<br />
F<br />
where VP m is <strong>the</strong> magnified velocity pressure setpoint from<br />
Step 1.<br />
4. Calculate <strong>the</strong> minimum <strong>air</strong>flow setpoint allowed by <strong>the</strong><br />
controls (V m ) for each <strong>VAV</strong> box <strong>size</strong> as:<br />
Nominal Inlet<br />
Diameter, in.<br />
Area, ft 2<br />
m<br />
cfm at Q 1 in.<br />
Sensor Reading<br />
Amplification<br />
factor<br />
10,000<br />
1,000<br />
cfm<br />
100<br />
Inlet Size<br />
22 in.<br />
16 in.<br />
14 in.<br />
12 in.<br />
10 in.<br />
9 in.<br />
8 in.<br />
7 in.<br />
6 in.<br />
5 in.<br />
4 in.<br />
10<br />
0.01 0.1 1<br />
Flow Probe Velocity Pressure Signal (in. w.g.)<br />
7,000<br />
3,665<br />
2,806<br />
2,062<br />
1,432<br />
1,160<br />
916<br />
702<br />
515<br />
358<br />
229<br />
Figure 9: Sample <strong>VAV</strong> box <strong>inlet</strong> sensor performance chart,<br />
cfm vs. velocity pressure signal.<br />
Vm vm<br />
A =<br />
Table 2 shows <strong>the</strong> minimum <strong>air</strong>flow setpoint for <strong>the</strong> <strong>VAV</strong><br />
box probe depicted in Figure 9 with a controller capable <strong>of</strong> a<br />
velocity pressure setpoint <strong>of</strong> 0.004 in. w.g. (1 Pa) and 0.01 in.<br />
w.g. (2.5 Pa).<br />
Min. VP Sensor Reading =<br />
0.004 in. w.g.<br />
Minimum<br />
Velocity, fpm<br />
Minimum Flow,<br />
cfm<br />
Min. VP Sensor Reading =<br />
0.01 in. w.g.<br />
Minimum<br />
Velocity, fpm<br />
cfm at 1 in. Signal<br />
Minimum Flow,<br />
cfm<br />
D A F vm Vm vm Vm 4 0.087 229 2.33 166 14 263 23<br />
5 0.136 358 2.33 166 23 263 36<br />
6 0.196 515 2.33 166 33 263 52<br />
7 0.267 702 2.33 166 44 263 70<br />
8 0.349 916 2.33 166 58 263 92<br />
9 0.442 1,160 2.33 166 73 263 116<br />
10 0.545 1,432 2.33 166 91 263 143<br />
12 0.785 2,062 2.33 166 130 263 206<br />
14 1.069 2,806 2.33 166 177 263 281<br />
16 1.396 3,665 2.33 166 232 263 367<br />
22 2.64 7000 2.28 168 443 265 700<br />
Table 2: Sample calculation <strong>of</strong> box minimum flow.