student dropout analysis with application of data mining methods
student dropout analysis with application of data mining methods
student dropout analysis with application of data mining methods

You also want an ePaper? Increase the reach of your titles
YUMPU automatically turns print PDFs into web optimized ePapers that Google loves.
Management, Vol. 15, 2010, 1, pp. 31-46<br />
M. Jadrić, Ž. Garača, M. Ćukušić: Student <strong>dropout</strong> <strong>analysis</strong> <strong>with</strong> <strong>application</strong> <strong>of</strong> <strong>data</strong> <strong>mining</strong>…<br />
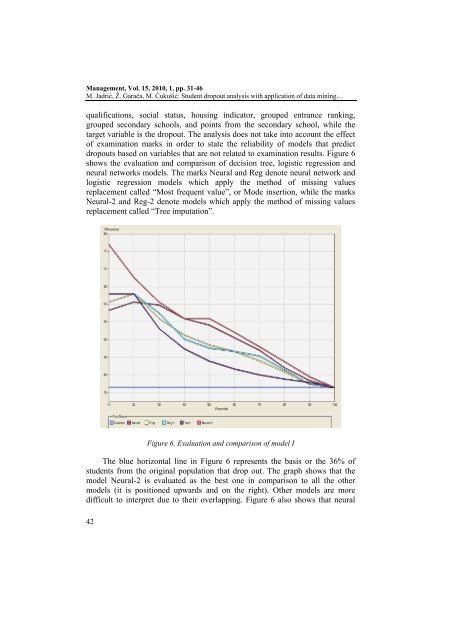
qualifications, social status, housing indicator, grouped entrance ranking,<br />
grouped secondary schools, and points from the secondary school, while the<br />
target variable is the <strong>dropout</strong>. The <strong>analysis</strong> does not take into account the effect<br />
<strong>of</strong> examination marks in order to state the reliability <strong>of</strong> models that predict<br />
<strong>dropout</strong>s based on variables that are not related to examination results. Figure 6<br />
shows the evaluation and comparison <strong>of</strong> decision tree, logistic regression and<br />
neural networks models. The marks Neural and Reg denote neural network and<br />
logistic regression models which apply the method <strong>of</strong> missing values<br />
replacement called “Most frequent value”, or Mode insertion, while the marks<br />
Neural-2 and Reg-2 denote models which apply the method <strong>of</strong> missing values<br />
replacement called “Tree imputation”.<br />
42<br />
Figure 6. Evaluation and comparison <strong>of</strong> model I<br />
The blue horizontal line in Figure 6 represents the basis or the 36% <strong>of</strong><br />
<strong>student</strong>s from the original population that drop out. The graph shows that the<br />
model Neural-2 is evaluated as the best one in comparison to all the other<br />
models (it is positioned upwards and on the right). Other models are more<br />
difficult to interpret due to their overlapping. Figure 6 also shows that neural