student dropout analysis with application of data mining methods
student dropout analysis with application of data mining methods
student dropout analysis with application of data mining methods

Create successful ePaper yourself
Turn your PDF publications into a flip-book with our unique Google optimized e-Paper software.
STUDENT DROPOUT ANALYSIS WITH APPLICATION OF<br />
DATA MINING METHODS<br />
Mario Jadrić *<br />
Željko Garača **<br />
Maja Ćukušić ***<br />
Received: 23. 10. 2010 Preliminary communication<br />
Accepted: 30. 03. 2010 UDC 65.012.34:378<br />
One <strong>of</strong> the indicators <strong>of</strong> potential problems in the higher education system may be<br />
a large number <strong>of</strong> <strong>student</strong> <strong>dropout</strong>s in the junior years. An <strong>analysis</strong> <strong>of</strong> the existing<br />
transaction <strong>data</strong> provides the information on <strong>student</strong>s that will allow the definition<br />
<strong>of</strong> the key processes that have to be adapted in order to enhance the efficiency <strong>of</strong><br />
studying. To understand better the problem <strong>of</strong> <strong>dropout</strong>s, the <strong>data</strong> are processed by<br />
the <strong>application</strong> <strong>of</strong> <strong>data</strong> <strong>mining</strong> <strong>methods</strong>: logistic regression, decision trees and<br />
neural networks. The models are built according to the SEMMA methodology and<br />
then compared to select the one which best predicts the <strong>student</strong> <strong>dropout</strong>. This<br />
paper concentrates primarily to the <strong>application</strong> <strong>of</strong> the <strong>data</strong> <strong>mining</strong> method in area<br />
<strong>of</strong> higher education, in which such <strong>methods</strong> have not been applied yet. In addition,<br />
a model, useful for strategic planning <strong>of</strong> additional mechanisms to improve the<br />
efficiency <strong>of</strong> studying, is also suggested.<br />
1. INTRODUCTION<br />
Higher education is the essential element <strong>of</strong> knowledge based economy:<br />
universities are nowadays the most important source <strong>of</strong> basic research and are<br />
therefore crucial for the development <strong>of</strong> new technologies (Enders, 2001;<br />
Garača, 2007). By analysing the relation between higher education and society<br />
in Central, Southern, and Eastern Europe, numerous experts in higher education<br />
* Mario Jadrić, BSc, Faculty <strong>of</strong> Economics Split, Matice hrvatske 31, 21000 Split, Croatia,<br />
Phone: +385 21 430 739, E-mail: jadric@efst.hr<br />
** Željko Garača, PhD, Faculty <strong>of</strong> Economics Split, Matice hrvatske 31, 21000 Split, Croatia,<br />
Phone: +385 21 430 654, E-mail: garaca@efst.hr<br />
*** Maja Ćukušić, MSc, Faculty <strong>of</strong> Economics Split, Matice hrvatske 31, 21000 Split, Croatia,<br />
Phone: +385 21 430 758, E-mail: mcukusic@efst.hr<br />
31
Management, Vol. 15, 2010, 1, pp. 31-46<br />
M. Jadrić, Ž. Garača, M. Ćukušić: Student <strong>dropout</strong> <strong>analysis</strong> <strong>with</strong> <strong>application</strong> <strong>of</strong> <strong>data</strong> <strong>mining</strong>…<br />
(13 <strong>of</strong> them in Pausits and Pellert, 2007) call for revision <strong>of</strong> the higher<br />
education system, especially in terms <strong>of</strong> institution management strategy.<br />
Due to an increasing number <strong>of</strong> <strong>student</strong>s and institutions, higher education<br />
institutions (HEIs) are becoming increasingly oriented to performances and<br />
their measurement and are accordingly setting goals and developing strategies<br />
for their achievements (Al-Hawaj, Elali and Twizell, 2008; Deem, Hillyard and<br />
Reed, 2007; Pausits and Pellert, 2007). The interest for performance indicators<br />
in the higher education sector has become extremely high in Europe (GFME,<br />
2008; McKelvey and Holmén, 2009) and thus also in Croatia (NCVVO, 2009;<br />
Vašiček, Budimir and Letinić, 2007). The reason for this lies in the relevant<br />
political and social changes in the recent years (Orsingher, 2006; Al-Hawaj,<br />
Elali and Twizell, 2008; Knust and Hanft, 2009):<br />
32<br />
� In Europe, the government is progressively retreating from its position<br />
as university financier. Therefore, HEIs have to try and develop new<br />
ways <strong>of</strong> attracting <strong>student</strong>s and finance.<br />
� On the other hand, having allowed higher institutional autonomy for<br />
HEIs the government requires more transparency and responsibility<br />
from them.<br />
� The process is also affected by a number <strong>of</strong> external factors such as the<br />
labour market, changes in the European higher education, and increased<br />
relevance <strong>of</strong> research for the society as a whole.<br />
Consequently, it may be stated that the pronounced interest in the way <strong>of</strong><br />
HEI functioning is primarily due to the need for useful information for<br />
presumptive <strong>student</strong>s and their parents, the need for comparability <strong>of</strong><br />
institutions in terms <strong>of</strong> curricula and their performance, and justification <strong>of</strong><br />
government funds expended on higher education. Globalization in higher<br />
education entails increasing competition for <strong>student</strong>s, faculty and financial<br />
resources. The EU member countries are currently focused on the fast<br />
adjustment <strong>of</strong> their curricula and education processes (Knust and Hanft, 2009).<br />
This is, in turn, stimulating higher mobility <strong>of</strong> <strong>student</strong>s and instructors. The<br />
governments have to care about brain drain, research outcomes, higher<br />
education costs, and availability <strong>of</strong> education for all citizens, while financial<br />
resources play a significant role for almost any decision in higher education<br />
(Michael and Kretovics, 2005).<br />
In the light <strong>of</strong> these new challenges, quality assurance is for many HEIs the<br />
main tool <strong>of</strong> planning, management, and control. Transparency, responsibility,<br />
legitimacy, and comparability between various European qualifications are only
Management, Vol. 15, 2010, 1, pp. 31-46<br />
M. Jadrić, Ž. Garača, M. Ćukušić: Student <strong>dropout</strong> <strong>analysis</strong> <strong>with</strong> <strong>application</strong> <strong>of</strong> <strong>data</strong> <strong>mining</strong>…<br />
some <strong>of</strong> the quality assurance process outcomes (Orsingher, 2006; Al-Hawaj,<br />
Elali and Twizell, 2008; Knust and Hanft, 2009). In some countries, quality<br />
assurance is the internal responsibility <strong>of</strong> each HEI based on the internal<br />
evaluation <strong>of</strong> its program, while in some other countries quality assurance<br />
implies external evaluation and accreditation (Deem, Hillyard and Reed, 2007).<br />
An indicator <strong>of</strong> potential weaknesses in the higher education system may<br />
be a large number <strong>of</strong> <strong>dropout</strong>s in the first years <strong>of</strong> studies. The strategic goal <strong>of</strong><br />
HEIs should therefore be planning, management and control <strong>of</strong> education<br />
processes <strong>with</strong> the purpose <strong>of</strong> improving the efficiency <strong>of</strong> studying. The <strong>dropout</strong><br />
trends have to be recognized and the causes (course, previous knowledge,<br />
assessment) isolated. Also, the typical <strong>dropout</strong> <strong>student</strong> pr<strong>of</strong>ile is to be<br />
determined in order to plan the number <strong>of</strong> potential <strong>student</strong>s in lifelong learning<br />
programs or those that need additional motivation (Vranić, Pintar and Skočir,<br />
2007). It is possible to follow the <strong>dropout</strong> trend throughout several years in<br />
order to check the effectiveness <strong>of</strong> corrective activities.<br />
The Faculty <strong>of</strong> Economics in Split is the second largest higher education<br />
institution in the field <strong>of</strong> economics in Croatia. Its operation involves all<br />
education levels from undergraduate, graduate, and postgraduate university<br />
programs to occupational college programs. An ever increasing competition, the<br />
requirements <strong>of</strong> the Ministry <strong>of</strong> Education, Science and Sport, and the imminent<br />
accession <strong>of</strong> Croatia to the EU position this institution <strong>with</strong>in a new framework.<br />
By analysing the existing transaction <strong>data</strong> on <strong>student</strong>s, the aim is to collect<br />
additional information and define the crucial processes that have to be adjusted<br />
for the purpose <strong>of</strong> improving studying efficiency.<br />
The paper is structured as follows: research settings are presented in the<br />
second section <strong>with</strong> <strong>data</strong> extraction and transformation procedures and research<br />
methodology given as separate subsections; third section states research<br />
findings while fourth section concludes the paper.<br />
2. RESEARCH SETTINGS<br />
Modern information systems collect daily large quantities <strong>of</strong> various <strong>data</strong><br />
from different domains and sources <strong>of</strong> various forms and contents. In practice,<br />
there is a need for <strong>methods</strong>, techniques, and tools that can search vast <strong>data</strong><br />
quantities, recognize patterns and present them on the level <strong>of</strong> concrete reports.<br />
In such complex requirements, the classic analytical approach is not sufficient<br />
as it is difficult to set a general mathematical model. A wide range <strong>of</strong> tools for<br />
33
Management, Vol. 15, 2010, 1, pp. 31-46<br />
M. Jadrić, Ž. Garača, M. Ćukušić: Student <strong>dropout</strong> <strong>analysis</strong> <strong>with</strong> <strong>application</strong> <strong>of</strong> <strong>data</strong> <strong>mining</strong>…<br />
collecting, storing, analysing and visualising <strong>data</strong> is defined as business<br />
intelligence (Michalewicz, Schmidt, Michalewicz and Chiriac, 2007).<br />
To comprehend better the <strong>student</strong> <strong>dropout</strong>, statistical <strong>data</strong> processing will<br />
be performed and some <strong>data</strong> <strong>mining</strong> <strong>methods</strong> will be applied. In the first<br />
segment, graphs will be used to present the basic information on the structure <strong>of</strong><br />
<strong>student</strong>s and obtain directions for a detailed <strong>analysis</strong> <strong>of</strong> <strong>dropout</strong>s. In the second<br />
segment, the <strong>analysis</strong> will be carried out by use <strong>of</strong> logistic regression, decision<br />
trees, and neural networks. Models will be built according to the SEMMA<br />
methodology and compared to select the one which best predicts the <strong>student</strong><br />
<strong>dropout</strong>.<br />
For pre-processing, the SQL language is used to perform a query over<br />
Sybase <strong>data</strong>base, while particular <strong>data</strong> grouping are carried out in Micros<strong>of</strong>t<br />
Office Excel 2003. SPSS 13.0 is used for designing clustered bar graphs, while<br />
<strong>data</strong> <strong>mining</strong> is conducted in SAS 9.1 Enterprise Miner. The s<strong>of</strong>tware choice is<br />
SAS, which in the area <strong>of</strong> business intelligence dominates in advanced<br />
analytical solutions.<br />
34<br />
2.1. Data extraction and transformation<br />
Transaction <strong>data</strong> on <strong>student</strong>s are collected through the Faculty <strong>of</strong><br />
Economics Information System (ISEF) <strong>with</strong>in the autonomous subsystem<br />
ISEF_SS (Student service). ISEF stores <strong>data</strong> in the Sybase <strong>data</strong>base. There are<br />
two <strong>data</strong>bases: the central <strong>data</strong>base and the replicated <strong>data</strong>base for the web.<br />
Updating <strong>of</strong> the replicated <strong>data</strong>base is carried out when required, while the<br />
essential <strong>data</strong>, such as marks, are updated immediately. The system is based on<br />
the desktop and web components. The desktop section integrates all functions,<br />
while the web section is used <strong>with</strong>in the system MojEFST (MyEFST), which<br />
contains personalized information for each <strong>student</strong> and instructor. Currently,<br />
there is no <strong>data</strong> warehouse, but it will be introduced in the near future to<br />
improve the reporting system and allow creation <strong>of</strong> ad-hoc reports. For web<br />
reporting, the replicated <strong>data</strong>base is used while other reports are created from<br />
the central <strong>data</strong>base. SQL and procedural programming are used for reporting at<br />
the moment.<br />
To perform the <strong>analysis</strong>, the crucial tables in the <strong>data</strong>base are STUDENT –<br />
the basic <strong>data</strong> on the <strong>student</strong>, UPISGO – <strong>data</strong> on the enrolled years, UPISPR –<br />
<strong>data</strong> on the courses enrolled in an academic year, and ISPIT – <strong>data</strong> on<br />
examinations. For this <strong>analysis</strong>, the following attributes are separated from the<br />
<strong>data</strong>base: ID, Generation, Sex, Date <strong>of</strong> Birth, Status, Study Program¸ Points
Management, Vol. 15, 2010, 1, pp. 31-46<br />
M. Jadrić, Ž. Garača, M. Ćukušić: Student <strong>dropout</strong> <strong>analysis</strong> <strong>with</strong> <strong>application</strong> <strong>of</strong> <strong>data</strong> <strong>mining</strong>…<br />
obtained from the secondary school, Enrolment Rank, Father Qualifications,<br />
Mother Qualifications, Social Status, Housing Indicator, Secondary School,<br />
Last year <strong>of</strong> study, and Last year <strong>of</strong> enrolment. Besides these <strong>data</strong> collected at<br />
the enrolment, the <strong>analysis</strong> also includes attributes referring to the studying<br />
process. The number <strong>of</strong> exam takings, signature, and marks are selected for the<br />
following courses: Introduction to Economics, Information Technologies,<br />
Mathematics, Statistics, Mathematics in Economics, Microeconomics 1,<br />
Accounting, and Statistical Analysis. The <strong>analysis</strong> is carried out on the sample<br />
<strong>of</strong> 715 <strong>student</strong>s.<br />
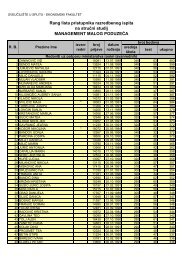
Students are grouped into categories in terms <strong>of</strong> their rank at the enrolment<br />
and the school they attended. Based on the performed <strong>analysis</strong> in SPSS, graphs<br />
are selected which in the best way describe the structure <strong>of</strong> <strong>student</strong>s and its<br />
correlation <strong>with</strong> the <strong>dropout</strong>. Table 1 shows grouped secondary schools.<br />
According to the stated categories, Table 1 allows the interpretation <strong>of</strong> Figure 1<br />
which presents the <strong>student</strong> <strong>dropout</strong>s in terms <strong>of</strong> the grouped schools. It is<br />
obvious that after the first and the second year <strong>of</strong> study, most <strong>dropout</strong>s occur in<br />
category 3, i.e. <strong>student</strong>s that have attended vocational schools (except<br />
commercial schools).<br />
Table 1. Grouped secondary schools<br />
It is assumed that after the first year <strong>student</strong>s drop out <strong>of</strong> their own free will<br />
(due to different reasons), while the <strong>student</strong>s dropping out after the second year<br />
mostly give up due to the exam failure. Voluntary <strong>dropout</strong> after the first year is<br />
lowest for the <strong>student</strong>s that have attended commercial schools away from Split.<br />
Such <strong>student</strong>s are more motivated because they have come to Split mostly<br />
because <strong>of</strong> their studies. The graph shows that after the first year the <strong>student</strong>s<br />
who have attended commercial schools drop out less than the <strong>student</strong>s who have<br />
attended high schools. This relation changes after the second year <strong>of</strong> study when<br />
more <strong>student</strong>s who have attended commercial schools drop out due to the failure<br />
to pass the exams.<br />
35
Management, Vol. 15, 2010, 1, pp. 31-46<br />
M. Jadrić, Ž. Garača, M. Ćukušić: Student <strong>dropout</strong> <strong>analysis</strong> <strong>with</strong> <strong>application</strong> <strong>of</strong> <strong>data</strong> <strong>mining</strong>…<br />
36<br />
Figure 1. Students grouped by schools and their <strong>dropout</strong><br />
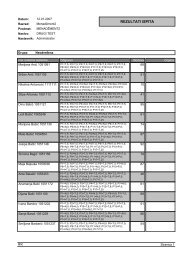
Students are also grouped in categories according to their rating obtained at<br />
the entrance examination. The way in which the grouping is conducted is shown<br />
in Table 2, while the distribution <strong>of</strong> <strong>student</strong>s grouped in terms <strong>of</strong> entrance<br />
ranking and their <strong>dropout</strong> is illustrated in Figure 2.<br />
Table 2. Grouping in terms <strong>of</strong> entrance examination rank<br />
Figure 2 confirms the thesis that <strong>student</strong>s who are better ranked at the<br />
entrance examination drop out less. Figures 1 and 2 show the correlation <strong>of</strong> the<br />
entrance examination rank, the secondary school attended and the <strong>dropout</strong>.<br />
When setting the goals <strong>of</strong> <strong>analysis</strong>, it was stressed that the <strong>dropout</strong> causes have<br />
to be isolated. Therefore, other elements also have to be investigated that could
Management, Vol. 15, 2010, 1, pp. 31-46<br />
M. Jadrić, Ž. Garača, M. Ćukušić: Student <strong>dropout</strong> <strong>analysis</strong> <strong>with</strong> <strong>application</strong> <strong>of</strong> <strong>data</strong> <strong>mining</strong>…<br />
affect the <strong>dropout</strong>. It is assumed that in addition to the previous knowledge,<br />
success achieved in particular courses affects the <strong>dropout</strong> to the greatest extent.<br />
Figure 2. Students grouped in terms <strong>of</strong> entrance ranking and their <strong>dropout</strong><br />
To investigate the <strong>dropout</strong> predictors and create the best possible models,<br />
the <strong>data</strong> <strong>mining</strong> <strong>methods</strong> will be used.<br />
2.2. Research methodology<br />
A number <strong>of</strong> analytical <strong>methods</strong> are used for <strong>data</strong> <strong>mining</strong>. The standard<br />
types include regression (normal regression for prediction, logistic regression<br />
for classification), neural networks and decision trees (Olson and Delen, 2008).<br />
Different <strong>data</strong> <strong>mining</strong> methodologies show that the set <strong>of</strong> activities performed<br />
by the analyst can be presented as a series <strong>of</strong> logical steps or tasks. SEMMA<br />
(Sample, Explore, Modify, Model, Assess) was developed by the SAS Institute<br />
which is also the producer <strong>of</strong> the <strong>data</strong> <strong>mining</strong> platform that uses the same<br />
methodology - SAS Enterprise Miner (SAS Institute, 2004; Matignon, 2007).<br />
37
Management, Vol. 15, 2010, 1, pp. 31-46<br />
M. Jadrić, Ž. Garača, M. Ćukušić: Student <strong>dropout</strong> <strong>analysis</strong> <strong>with</strong> <strong>application</strong> <strong>of</strong> <strong>data</strong> <strong>mining</strong>…<br />
The acronym SEMMA signifies: Sampling, Exploring, Modifying, Modelling<br />
and Assessment. Starting <strong>with</strong> the statistically representative <strong>data</strong> sample,<br />
SEMMA allows the <strong>application</strong> <strong>of</strong> statistical and visualisation techniques,<br />
selection and transformation <strong>of</strong> most significant predictor variables, modelling<br />
<strong>of</strong> variables to predict output, and eventually confirmation <strong>of</strong> model credibility.<br />
To create classification models <strong>of</strong> neural networks, decision trees and<br />
logistic regression, it is necessary to follow the steps <strong>of</strong> SEMMA methodology.<br />
The model, developed in SAS Enterprise Miner, based on SEMMA<br />
methodology, is illustrated by Figure 3.<br />
38<br />
Figure 3. Model developed in SAS Enterprise miner based on SEMMA methodology<br />
First, the input <strong>data</strong> are imported from the excel <strong>data</strong>base and selected<br />
attributes that are analysed in more detail. The <strong>dropout</strong> attribute is marked as the<br />
target variable that can assume two conditions: 1 for the <strong>student</strong>s who drop out<br />
and 2 for the <strong>student</strong>s who do not. The selected input variables are all those that<br />
are mentioned in the section on <strong>data</strong> extraction. In the Sample step, besides<br />
defining the role <strong>of</strong> variables in the model, it is also necessary to define one <strong>of</strong><br />
the measuring scales (nominal, ordinal, interval). This step also allows the
Management, Vol. 15, 2010, 1, pp. 31-46<br />
M. Jadrić, Ž. Garača, M. Ćukušić: Student <strong>dropout</strong> <strong>analysis</strong> <strong>with</strong> <strong>application</strong> <strong>of</strong> <strong>data</strong> <strong>mining</strong>…<br />
testing <strong>of</strong> distribution for each variable. For example, Figure 4 shows the<br />
distribution <strong>of</strong> <strong>student</strong>s for the target variable “<strong>dropout</strong>”. The possibility to<br />
explore descriptive statistics is also available so that the percentage <strong>of</strong> missing<br />
values can be determined; and for the interval variables, it is possible to<br />
determine the minimal, maximal, and medium values, standard deviation, etc.<br />
1 2<br />
Figure 4. Distribution <strong>of</strong> <strong>student</strong>s for the target variable <strong>dropout</strong><br />
Enterprise Miner in the Data partition node samples the input <strong>data</strong> and<br />
distributes them into training, validation and testing <strong>data</strong> (SAS Institute, 2003).<br />
The chosen method is Simple Random, in which each observation has the same<br />
possibility to be sampled.<br />
In the step Explore, the node Insight is included. According to the settings<br />
for this <strong>analysis</strong> node, the sample size is 2000, and if it is less than that as in this<br />
case, the entire set <strong>of</strong> <strong>data</strong> is included in the <strong>analysis</strong>. In this example, 286 rows<br />
are selected for training, or 40% <strong>of</strong> the entire <strong>data</strong> set. This node <strong>of</strong>fers<br />
numerous possibilities <strong>of</strong> <strong>data</strong> visualisation. From the step Modify, according to<br />
the SEMMA methodology, two Replacement nodes are inserted to explore the<br />
effect <strong>of</strong> various <strong>data</strong> replacement <strong>methods</strong> on the logistic regression and neural<br />
networks models. In the upper node Replacement in Figure 3, the missing<br />
values replacement method is selected by Mode, or the most frequent values,<br />
while in the lower node, the selected method is Tree replacement which adjusts<br />
replacement values by using the decision tree.<br />
39
Management, Vol. 15, 2010, 1, pp. 31-46<br />
M. Jadrić, Ž. Garača, M. Ćukušić: Student <strong>dropout</strong> <strong>analysis</strong> <strong>with</strong> <strong>application</strong> <strong>of</strong> <strong>data</strong> <strong>mining</strong>…<br />
Decision trees are a highly flexible modelling technique. For instance, to<br />
build regression models and neural networks models, the missing values have to<br />
be inserted into training <strong>data</strong> while decision trees can be built even <strong>with</strong> missing<br />
values. Decision trees are intended for the classification <strong>of</strong> attributes regarding<br />
the given target variable (Panian and Klepac, 2003). Decision trees are<br />
attractive because they <strong>of</strong>fer, in comparison to neural networks, <strong>data</strong> models in<br />
readable, comprehensible form – in fact, in the form <strong>of</strong> rules. They are used not<br />
only for classification but also for prediction (Gamberger and Šmuc, 2001).<br />
Logistic regression is an <strong>analysis</strong> <strong>of</strong> asymmetric relations between two<br />
variable sets <strong>of</strong> which one has the predictor status and the other criterion status<br />
(Halmi, 2003). The dependent variable is dichotomous and marked by values 0<br />
and 1, while the independent variables in logistic regression may be categorical<br />
or continuous (Hair, Anderson and Babin, 2009).<br />
Neural networks behave very well in more complex classification<br />
problems. Their disadvantage, in comparison to simpler <strong>methods</strong>, is the<br />
relatively slow and demanding process <strong>of</strong> model “learning” (optimization <strong>of</strong><br />
weight factors) (Gamberger and Šmuc, 2001). Neural networks are a powerful<br />
tool in trend prognostics and predictions based on historical <strong>data</strong>. In <strong>data</strong><br />
<strong>mining</strong>, neural networks are <strong>of</strong>ten combined <strong>with</strong> other <strong>methods</strong> because if used<br />
alone, they can hardly guarantee a good interpretation <strong>of</strong> results (Panian and<br />
Klepac, 2003).<br />
40<br />
3. RESEARCH FINDINGS<br />
Application <strong>of</strong> basic statistical <strong>methods</strong> is used to study the <strong>student</strong><br />
population. It is found that women drop out comparatively less than men, that<br />
<strong>student</strong>s who have attended high schools drop out less in comparison to those<br />
who have attended other schools, and that <strong>student</strong>s <strong>with</strong> better entrance ranking<br />
drop out less. To carry out a more detailed <strong>dropout</strong> <strong>analysis</strong> and separate the<br />
attributes which have the highest effect, decision trees are used.<br />
The decision tree in Figure 5 shows that in the training sample, 98 <strong>student</strong>s<br />
or 34.3% drop out, while 188 <strong>student</strong>s or 65.7% continue their studies after the<br />
second year. Of the 98 that drop out, 79 have a failing mark in Mathematics.<br />
Nineteen <strong>student</strong>s drop out due to other reasons: seven <strong>of</strong> them due to the<br />
failing mark in Statistics, even though they have a pass in Mathematics. Twelve<br />
<strong>student</strong>s drop out even though they have a pass both in Mathematics and<br />
Statistics. Eight <strong>of</strong> them drop out because their mark in Introduction to
Management, Vol. 15, 2010, 1, pp. 31-46<br />
M. Jadrić, Ž. Garača, M. Ćukušić: Student <strong>dropout</strong> <strong>analysis</strong> <strong>with</strong> <strong>application</strong> <strong>of</strong> <strong>data</strong> <strong>mining</strong>…<br />
Economics is 2 (sufficient) or lower, while in four <strong>student</strong>s, this mark is higher<br />
than 2.<br />
Figure 5. Analysis by decision tree<br />
When including courses as input variables, only first semester courses are<br />
taken into account. In this way, the prediction model is obtained based on the<br />
<strong>student</strong>s’ previous knowledge and their performance in the very beginning <strong>of</strong><br />
study. Such a model is more usable as it provides timely prediction on the<br />
number <strong>of</strong> <strong>dropout</strong>s and allows making decisions to improve the efficiency <strong>of</strong><br />
studying. Despite the stated advantages <strong>of</strong> decision trees, neural networks are<br />
reputed to be extremely flexible for predictive modelling. To determine which<br />
<strong>data</strong> <strong>mining</strong> model and which technique will provide the best results, model<br />
evaluation is carried out. Missing values are inserted for logistic regression and<br />
neural networks models to allow the <strong>analysis</strong> on the same quantity <strong>of</strong> <strong>data</strong>. The<br />
reason for this is that in regression and neural networks such values are omitted,<br />
while in decision trees they are taken into account.<br />
In the process <strong>of</strong> building different models, the number <strong>of</strong> variables is<br />
varied to achieve model reliability as high as possible. Eleven input variables<br />
are chosen: ID, sex, status, study program, father’s qualifications, mother’s<br />
41
Management, Vol. 15, 2010, 1, pp. 31-46<br />
M. Jadrić, Ž. Garača, M. Ćukušić: Student <strong>dropout</strong> <strong>analysis</strong> <strong>with</strong> <strong>application</strong> <strong>of</strong> <strong>data</strong> <strong>mining</strong>…<br />
qualifications, social status, housing indicator, grouped entrance ranking,<br />
grouped secondary schools, and points from the secondary school, while the<br />
target variable is the <strong>dropout</strong>. The <strong>analysis</strong> does not take into account the effect<br />
<strong>of</strong> examination marks in order to state the reliability <strong>of</strong> models that predict<br />
<strong>dropout</strong>s based on variables that are not related to examination results. Figure 6<br />
shows the evaluation and comparison <strong>of</strong> decision tree, logistic regression and<br />
neural networks models. The marks Neural and Reg denote neural network and<br />
logistic regression models which apply the method <strong>of</strong> missing values<br />
replacement called “Most frequent value”, or Mode insertion, while the marks<br />
Neural-2 and Reg-2 denote models which apply the method <strong>of</strong> missing values<br />
replacement called “Tree imputation”.<br />
42<br />
Figure 6. Evaluation and comparison <strong>of</strong> model I<br />
The blue horizontal line in Figure 6 represents the basis or the 36% <strong>of</strong><br />
<strong>student</strong>s from the original population that drop out. The graph shows that the<br />
model Neural-2 is evaluated as the best one in comparison to all the other<br />
models (it is positioned upwards and on the right). Other models are more<br />
difficult to interpret due to their overlapping. Figure 6 also shows that neural
Management, Vol. 15, 2010, 1, pp. 31-46<br />
M. Jadrić, Ž. Garača, M. Ćukušić: Student <strong>dropout</strong> <strong>analysis</strong> <strong>with</strong> <strong>application</strong> <strong>of</strong> <strong>data</strong> <strong>mining</strong>…<br />
networks provide better results when using the missing values replacement<br />
method “Tree imputation” rather than “Most frequent value”. The graph can be<br />
read in the following way: the curve Neural-2 shows that in the top 10% model<br />
scoring, or in the first decile, there are approximately 77% <strong>of</strong> <strong>student</strong>s that will<br />
drop out. The neural network which has used the missing values replacement by<br />
“Most frequent value” in the first decile has about 56% <strong>of</strong> <strong>student</strong>s that will<br />
drop out. The higher the percentile, the results <strong>of</strong> all models are getting closer<br />
to each other and are finally equalized, predicting that 36% <strong>of</strong> the <strong>student</strong>s will<br />
drop out. In further <strong>analysis</strong>, the number <strong>of</strong> input variables is increased to<br />
include the effect <strong>of</strong> examination results to create models based on <strong>student</strong>s’<br />
previous knowledge and their achievements in the very beginning <strong>of</strong> their<br />
studies.<br />
From Figure 7, it is obvious that all the models are better adjusted in<br />
comparison to the models in Figure 6. The curve Neural-2, here, also provides<br />
the best results, but in the first top 30% <strong>of</strong> model scoring, the neural network<br />
and decision tree will provide the same results, i.e. 100% <strong>of</strong> <strong>student</strong>s that will<br />
drop out.<br />
Figure 7. Evaluation and comparison <strong>of</strong> model II<br />
43
Management, Vol. 15, 2010, 1, pp. 31-46<br />
M. Jadrić, Ž. Garača, M. Ćukušić: Student <strong>dropout</strong> <strong>analysis</strong> <strong>with</strong> <strong>application</strong> <strong>of</strong> <strong>data</strong> <strong>mining</strong>…<br />
44<br />
4. CONCLUSION<br />
This paper has explored the <strong>application</strong> <strong>of</strong> the <strong>data</strong> <strong>mining</strong> <strong>methods</strong> in<br />
higher education, where they are not usually applied. It is found out that this<br />
area abounds in unused <strong>data</strong> that, unfortunately, are not stored in an appropriate<br />
way. The <strong>analysis</strong> has separated the causes <strong>of</strong> <strong>student</strong>s’ <strong>dropout</strong> (e.g. previous<br />
knowledge, examination results). It has also determined the typical pr<strong>of</strong>ile <strong>of</strong><br />
the <strong>student</strong> inclined to drop out at the Faculty <strong>of</strong> Economics in Split. The<br />
obtained <strong>data</strong> should, in the earliest stage, be used to raise awareness on the<br />
possibilities and need to use the <strong>data</strong> <strong>mining</strong> models and <strong>methods</strong> at the<br />
institution in which this research has been carried out. The planned construction<br />
<strong>of</strong> <strong>data</strong> warehouse will allow support in strategic decisions and monitoring <strong>of</strong><br />
the <strong>dropout</strong> trend. All this will also support the Bologna process, which also<br />
aims at enhancing the efficiency <strong>of</strong> studying.<br />
The future research will be directed towards the design <strong>of</strong> an applicative<br />
solution to allow observation and classification <strong>of</strong> each <strong>student</strong> at the Faculty <strong>of</strong><br />
Economics in Split into a particular <strong>dropout</strong> category depending on his/her<br />
characteristics. Such a solution will consist <strong>of</strong> two basic segments: the first is<br />
the crisp module based on the examination results in the first semester, while<br />
the second is the fuzzy module based on certain attributes <strong>of</strong> <strong>student</strong>s’ previous<br />
knowledge. In this way, an example <strong>of</strong> the <strong>application</strong> <strong>of</strong> a hybrid business<br />
intelligence system will be provided that combines the classic conception <strong>of</strong><br />
expert systems and the conception based on fuzzy logic. Such a system may<br />
also have a practical <strong>application</strong> in decision-making support to the faculty<br />
administration in the early prediction <strong>of</strong> <strong>dropout</strong>s.<br />
REFERENCES<br />
1. Al-Hawaj, A. Y., Elali, W., Twizell, E. H. (Ed.) (2008): Higher Education<br />
in the Twenty-First Century: Issues and Challenges, Taylor & Francis<br />
Group, London<br />
2. Deem, R., Hillyard, S., Reed, M. (2007): Knowledge, Higher Education,<br />
and the New Managerialism: The Changing Management <strong>of</strong> UK<br />
Universities, Oxford University Press Inc., New York<br />
3. Enders, J. (Ed.) (2001): Academic Staff in Europe: Changing Contexts and<br />
Conditions, Greenwood Press, Westport<br />
4. Gamberger, D., Šmuc, T. (2001): Poslužitelj za analizu po<strong>data</strong>ka<br />
[http://dms.irb.hr]. Zagreb, Hrvatska: Institut Rudjer Bošković, Laboratorij<br />
za informacijske sustave.<br />
5. Garača, Ž. (2009): ERP sustavi, Ekonomski fakultet, Sveučilište u Splitu
Management, Vol. 15, 2010, 1, pp. 31-46<br />
M. Jadrić, Ž. Garača, M. Ćukušić: Student <strong>dropout</strong> <strong>analysis</strong> <strong>with</strong> <strong>application</strong> <strong>of</strong> <strong>data</strong> <strong>mining</strong>…<br />
6. GFME (2008): The Global Management Education Landscape: Shaping the<br />
future <strong>of</strong> business schools, Global Foundation for Management Education<br />
7. Hair, J., Anderson, R., Babin, B. (2009): Multivariate Data Analysis,<br />
Prentice Hall<br />
8. Halmi A. (2003): Multivarijantna analiza u društvenim znanostima, Alinea,<br />
Zagreb.<br />
9. Klepac, G., Mršić, L. (2006): Poslovna inteligencija kroz poslovne<br />
slučajeve, Lider press<br />
10. Knust, M., Hanft, A. (Ed.) (2009): Continuing Higher Education and<br />
Lifelong Learning: An International Comparative Study on Structures,<br />
Organisation and Provisions, Springer Science & Business Media,<br />
Heidelberg<br />
11. Matignon, R. (2007): Data Mining Using SAS Enterprise Miner TM, John<br />
Wiley & Sons, Inc., Hoboken, New Jersey<br />
12. McKelvey, M., Holmén, M. (Ed.) (2009): Learning to Compete in<br />
European Universities: From Social Institution to Knowledge Business,<br />
Edward Elgar Publishing, Inc., Massachusetts<br />
13. Michael, S. O., Kretovics, M. A. (Ed.) (2005): Financing Higher Education<br />
in a Global Market, Algora Publishing, New York<br />
14. Michalewicz, Z., Schmidt, M., Michalewicz, M., Chiriac, C. (2007):<br />
Adaptive Business Intelligence, Berlin Heidelberg, Springer-Verlag<br />
15. NCVVO (2009): Vodič za provedbu samovrjednovanja u osnovnim<br />
školama, Nacionalni centar za vanjsko vrednovanje obrazovanja, Zagreb<br />
16. Olson, D.L., Delen, D. (2008): Advanced Data Mining Techniques,<br />
Springer-Verlag, Berlin Heidelberg<br />
17. Orsingher, Ch. (Ed.) (2006): Assessing Quality in European Higher<br />
Education Institutions: Dissemination, Methods and Procedures, Physica-<br />
Verlag: Springer, Heidelberg<br />
18. Panian, Ž., Klepac, G. (2003): Poslovna inteligencija, Masmedia<br />
19. Pausits, A., Pellert, A. (2007): Higher Education Management and<br />
Development in Central, Southern and Eastern Europe, WAXMANN<br />
Verlag, Munster<br />
20. SAS Institute (2003): Data Mining Using SAS Enterprise Miner, A Case<br />
Study Approach, Second Edition, SAS Institute Inc., Cary<br />
21. SAS Institute (2004): Getting Started <strong>with</strong> SAS Enterprise Miner 4.3,<br />
Second Edition, SAS Institute Inc., Cary<br />
22. Vašiček, V., Budimir, V., Letinić, S. (2007): Pokazatelji uspješnosti u<br />
visokom obrazovanju, Privredna kretanja i ekonomska politika, 17 (110):<br />
str. 51 - 80.<br />
45
Management, Vol. 15, 2010, 1, pp. 31-46<br />
M. Jadrić, Ž. Garača, M. Ćukušić: Student <strong>dropout</strong> <strong>analysis</strong> <strong>with</strong> <strong>application</strong> <strong>of</strong> <strong>data</strong> <strong>mining</strong>…<br />
23. Vranić, M., Pintar, D., Skočir, Z. (2007): The use <strong>of</strong> <strong>data</strong> <strong>mining</strong> in<br />
education environment, Proceedings <strong>of</strong> the 9th International Conference on<br />
Telecommunications, ConTEL, Zagreb, Croatia, pp. 243-250<br />
46<br />
ANALIZA ODUSTAJANJA OD STUDIJA PRIMJENOM METODA<br />
RUDARENJA PODATAKA<br />
Sažetak<br />
Jedan od indikatora potencijalnih problema u visokoškolskom sustavu može biti velik<br />
broj studenata koji odustaju od studija na nižim godinama. Analiza postojećih<br />
transakcijskih po<strong>data</strong>ka pruža informacije o <strong>student</strong>ima, potrebne za definiranje ključnih<br />
procesa koje treba prilagoditi da bi se povećala učinkovitost studiranja. Radi boljeg<br />
razumijevanja problema odustajanja od studija, provedena je statistička obrada po<strong>data</strong>ka<br />
te su na podatke primijenjene neke od metoda rudarenja po<strong>data</strong>ka, i to: logistička<br />
regresija, stabla odlučivanja i neuralne mreže. Modeli su izrađeni prema SEMMA<br />
metodologiji, a zatim je izvršena usporedba i izbor modela koji najbolje predviđa<br />
odustajanje od studija. Ovaj se rad ponajprije koncentrira na istraživanje primjene<br />
metoda rudarenja po<strong>data</strong>ka na područje visokog obrazovanja, u okviru kojeg one do<br />
sada nisu primjenjivane. Nadalje, predlaže se i model koristan u strateškom planiranju<br />
dodatnih mehanizama za povećanje učinkovitosti studiranja.