Appendix I - Hazardous Materials Documentation - VTA
Appendix I - Hazardous Materials Documentation - VTA
Appendix I - Hazardous Materials Documentation - VTA

You also want an ePaper? Increase the reach of your titles
YUMPU automatically turns print PDFs into web optimized ePapers that Google loves.
<strong>Appendix</strong> I<br />
<strong>Hazardous</strong> <strong>Materials</strong> <strong>Documentation</strong>
<strong>Appendix</strong> I Index:<br />
1. Silicon Valley Rapid Transit Project Project-<br />
Wide Contaminant Management Plan,<br />
July 2008<br />
2. Site Management Plan for Former Ford<br />
Automobile Assembly Plant Formerly 1100<br />
South Main Street, Milpitas, California,<br />
March 1997<br />
3. Letter From California Regional Water Quality<br />
Control Board, April 16, 2001
SILICON VALLEY RAPID TRANSIT PROJECT<br />
PROJECT-WIDE<br />
Contaminant Management<br />
Plan<br />
Revision 0<br />
July 31, 2008<br />
Issued for Use
SANTA CLARA VALLEY TRANSPORTATION AUTHORITY (<strong>VTA</strong>)<br />
BART EXTENSION TO MILPITAS, SAN JOSE AND SANTA CLARA<br />
Contaminant Management Plan (CMP)<br />
Prepared by Earth Tech, Inc.<br />
July 2008
CONTAMINANT MANAGEMENT PLAN (CMP)<br />
101248 – July 2008 i<br />
TABLE OF CONTENTS<br />
Section Page<br />
1.0 INTRODUCTION..........................................................................................................................1<br />
1.1 Project Description .............................................................................................................1<br />
1.2 Project Areas Addressed.....................................................................................................9<br />
1.3 Purpose and Objectives.....................................................................................................10<br />
1.4 Contaminant Management Plan Organization ..................................................................10<br />
2.0 BACKGROUND ..........................................................................................................................11<br />
2.1 Physical Setting Description.............................................................................................11<br />
2.1.1 Geology.............................................................................................................11<br />
2.1.2 Hydrogeology....................................................................................................12<br />
2.1.3 Hydrology .........................................................................................................13<br />
2.2 Project Segments...............................................................................................................14<br />
2.2.1 Line Segment ....................................................................................................14<br />
2.2.2 Stations Segment...............................................................................................15<br />
2.2.3 Yard and Shops Segment ..................................................................................16<br />
2.2.4 Tunnel Segment ................................................................................................16<br />
2.3 Previous Investigations.....................................................................................................17<br />
2.3.1 Line Segment ....................................................................................................17<br />
2.3.2 Stations Segment...............................................................................................17<br />
2.3.3 Yard and Shops Segment ..................................................................................18<br />
2.4 Summary of Current Environmental Contamination ........................................................19<br />
2.4.1 Impacts to Soil and Ballast................................................................................19<br />
2.4.1.1 Line Segment.....................................................................................19<br />
2.4.1.2 Stations Segment ...............................................................................20<br />
2.4.1.3 Yard and Shops Segment...................................................................21<br />
2.4.2 Impacts to Groundwater....................................................................................22<br />
2.4.2.1 Line Segment.....................................................................................22<br />
2.4.2.2 Stations Segment ...............................................................................23<br />
2.4.2.3 Yard and Shops Segment...................................................................25<br />
2.4.3 Impacts to Building <strong>Materials</strong>...........................................................................25<br />
3.0 RISK-BASED EVALUATION OF CONTAMINANT LEVELS IN SOIL/BALLAST ........26<br />
3.1 Human Health Risk-Based Levels ....................................................................................26<br />
3.2 Assessment of Ecological Risk.........................................................................................26<br />
4.0 SOIL/BALLAST MITIGATION MEASURES ........................................................................27<br />
4.1 Soil/Ballast Characterization ............................................................................................27
TABLE OF CONTENTS (Cont.)<br />
Contaminant Management Plan, SVRT/BART Extension<br />
Section Page<br />
4.1.1 Sampling Strategy .............................................................................................27<br />
4.1.1.1 Preliminary Reconnaissance Characterization...................................27<br />
4.1.1.2 Hot Spot Characterization .................................................................28<br />
4.1.1.3 Discovery of Unknown Impact..........................................................28<br />
4.1.1.4 Waste Disposal Characterization.......................................................28<br />
4.1.2 Chemical Analysis Methods..............................................................................29<br />
4.1.3 Analysis of Data................................................................................................30<br />
4.1.3.1 Data Populations................................................................................30<br />
4.1.3.2 Upper Confidence Limit Calculations...............................................30<br />
4.1.3.3 Exposure Point Concentrations .........................................................33<br />
4.2 Soil/Ballast Reuse .............................................................................................................33<br />
4.2.1 Migration Potential Zones.................................................................................33<br />
4.2.2 Reuse Scenarios ................................................................................................33<br />
4.2.3 Reuse Scenario Selection Process .....................................................................34<br />
4.2.4 Screening Values...............................................................................................34<br />
4.2.4.1 Unrestricted Off-Site Reuse...............................................................35<br />
4.2.4.2 Unrestricted On-Site Reuse ...............................................................36<br />
4.2.4.3 Stations and Facilities........................................................................38<br />
4.2.4.4 Right-of-Way.....................................................................................40<br />
4.2.4.5 Encapsulation ....................................................................................40<br />
4.2.5 Reuse Procedures ..............................................................................................44<br />
4.2.5.1 Non-Encapsulated Material ...............................................................44<br />
4.2.5.2 Encapsulated Material .......................................................................47<br />
4.2.5.3 Material Reuse in an MPZ.................................................................48<br />
4.3 Soil/Ballast Transportation ...............................................................................................48<br />
4.3.1 Transportation Modes .......................................................................................48<br />
4.3.2 On-Site Transportation......................................................................................49<br />
4.3.3 Off-Site Transportation .....................................................................................50<br />
4.3.3.1 Potential Destinations........................................................................51<br />
4.3.3.2 Transportation Routes .......................................................................51<br />
4.3.4 Loading and Traffic Control Procedures...........................................................53<br />
4.3.5 Transportation Health and Safety......................................................................54<br />
4.3.6 Transportation Contingency Plan......................................................................54<br />
4.3.7 Transportation Record Keeping ........................................................................54<br />
4.4 Soil/Ballast Disposal.........................................................................................................55<br />
4.5 Soil/Ballast Stockpiling ....................................................................................................56<br />
4.5.1 Stockpile Locations...........................................................................................56<br />
4.5.2 Stockpile Location Security ..............................................................................57<br />
4.5.3 Unloading..........................................................................................................58<br />
4.5.4 Stockpiling Procedures......................................................................................58<br />
4.6 Air Monitoring..................................................................................................................60<br />
101248 – July 2008 ii
TABLE OF CONTENTS (Cont.)<br />
Contaminant Management Plan, SVRT/BART Extension<br />
Section Page<br />
4.6.1 Action Levels ....................................................................................................60<br />
4.6.1.1 Determination of Action Levels ........................................................60<br />
4.6.1.2 Estimation of Maximum Air Concentrations ....................................61<br />
4.6.2 Meteorological Monitoring ...............................................................................64<br />
4.6.3 Real-Time and Personal Air Monitoring...........................................................65<br />
4.6.3.1 Real-Time Air Monitoring.................................................................65<br />
4.6.3.2 Personal Air Sampling Equipment and Methods...............................65<br />
4.6.4 Site Perimeter Air Monitoring...........................................................................66<br />
4.6.4.1 Station Location Selection.................................................................66<br />
4.6.4.2 Ambient Air Monitoring Equipment and Methods ...........................67<br />
4.6.4.3 Background Determination................................................................67<br />
4.6.4.4 Monitoring Schedule .........................................................................68<br />
5.0 GROUNDWATER MITIGATION MEASURES.....................................................................69<br />
5.1 Groundwater Characterization ..........................................................................................69<br />
5.2 Groundwater Treatment and Discharge ............................................................................69<br />
6.0 BUILDING MATERIAL MITIGATION MEASURES...........................................................71<br />
6.1 Building Material Characterization...................................................................................71<br />
6.2 Building Material Abatement and Disposal......................................................................71<br />
7.0 REPORTING ...............................................................................................................................73<br />
7.1 Characterization Reports...................................................................................................73<br />
7.2 Segment-Specific Plans ....................................................................................................73<br />
7.3 CONTAMINANT MANAGEMENT <strong>Documentation</strong> .....................................................73<br />
8.0 REFERENCES.............................................................................................................................74<br />
101248 – July 2008 iii
101248 – July 2008 iv<br />
LIST OF TABLES<br />
Contaminant Management Plan, SVRT/BART Extension<br />
Table 1 Discrete Environmental Data Populations........................................................................... 31<br />
Table 2 Site Specific Soil/Ballast Reuse and Stockpile Criteria ...................................................... 36<br />
Table 3 Screening Values for Unrestricted Off-Site Reuse.............................................................. 37<br />
Table 4 Screening Values for Unrestricted On-Site Reuse............................................................... 39<br />
Table 5 Screening Values for Reuse in Stations and Facilities ........................................................ 42<br />
Table 6 Screening Values for Reuse in Right of Way...................................................................... 43<br />
Table 7 Screening Values for Reuse in Encapsulation..................................................................... 45<br />
Table 8 Permissible Exposure Limits (PELs) for COCs .................................................................. 61<br />
Table 9 Estimation of Expected Maximum Concentrations of COCs in Air ................................... 62<br />
Table 10 Action Levels ...................................................................................................................... 63<br />
Table 11 Action Level Summary........................................................................................................ 64<br />
Table 12 Personal Sampling............................................................................................................... 66<br />
LIST OF FIGURES<br />
Figure 1-1 BART Extension Alignment and Sections ............................................................................2<br />
Figure 1-2a Section 1 from Planned BART Warm Springs Station to Trade Zone Boulevard ................3<br />
Figure 1-2b Section 1 (cont’d) from Planned BART Warm Springs Station to Trade Zone Boulevard ..4<br />
Figure 1-3 Section 2 from Trade Zone Boulevard to Mabury Road .......................................................5<br />
Figure 1-4 Section 3 from Mabury Road to 19th Street..........................................................................6<br />
Figure 1-5 Section 4 from 19th Street to I-880 .......................................................................................7<br />
Figure 1-6 Section 5 from I-880 to Lafayette Street ...............................................................................8<br />
Figure 2 Soil Management Flow Chart..............................................................................................46<br />
APPENDICES<br />
<strong>Appendix</strong> A Prior Analytical Results and Quality Assurance/Quality Control Review<br />
<strong>Appendix</strong> B Human Health Risk Assessment<br />
<strong>Appendix</strong> C Ecological Risk Assessment<br />
<strong>Appendix</strong> D Method for Modifying ESLs for Metals<br />
Page
1.0 INTRODUCTION<br />
CONTAMINANT MANAGEMENT PLAN (CMP)<br />
The Santa Clara Valley Transportation Authority (<strong>VTA</strong>) and Bay Area Rapid Transit (BART) are planning<br />
the extension of the BART system from Fremont through Milpitas, San Jose and Santa Clara, California. The<br />
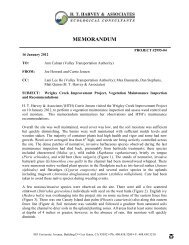
general location of this project is presented on Figure 1-1. Because of the extensive length of this project,<br />
additional sectional maps with more detail are provided as Figure 1-2a through Figure 1-6.<br />
The Contaminant Management Plan (CMP) addresses the management of potentially contaminated materials<br />
generated during construction activities, including soil, existing railroad ballast, groundwater from<br />
construction dewatering, and debris from building demolition. The CMP is intended for use during design and<br />
construction of the extension, after review, comment and approval by the California Regional Water Quality<br />
Control Board, San Francisco Bay Region (RWQCB) and the California Environmental Protection Agency<br />
Department of Toxic Substances Control (Cal EPA-DTSC).<br />
1.1 PROJECT DESCRIPTION<br />
<strong>VTA</strong> is responsible for the extension of the BART system through Silicon Valley for 16.3 miles, from<br />
Fremont to Santa Clara. This project is known as the Silicon Valley Rapid Transit (SVRT) project, or the<br />
BART SJX extension. The extension will connect the BART system at the Warm Springs Station (planned by<br />
BART under the BART Warm Springs extension [WSX] project) and extend just beyond the planned Santa<br />
Clara Station, as shown on Figure 1-1.<br />
The planned expansion of the BART system will have two parallel tracks over which passenger trains will<br />
travel. The tracks will be predominantly at-grade, though certain sections will be elevated (aerial), below<br />
grade in retained cuts, or below grade in tunnels. Six new BART stations are currently planned along the<br />
SVRT extension and include the following: the Montague/Capitol, Berryessa, Alum Rock, Downtown San<br />
Jose, Diridon/Arena, and Santa Clara Stations. One future station, South Calaveras Station, is optional. A<br />
maintenance facility for train cars and other equipment will be located adjacent to the Santa Clara Station on<br />
Figure 1-6.<br />
The significant differences between tracks, tunnels, stations, and maintenance facilities mean that different<br />
design and construction specialties are necessary. In order to retain the best design and construction teams for<br />
these different challenges, <strong>VTA</strong> has divided the 16.3-mile extension into five separate segments:<br />
101248 – July 2008 Page 1
NEWARK<br />
82<br />
237<br />
To San Francisco<br />
To San Francisco<br />
San Fancisco Bay<br />
National Wildlife Refuge<br />
SUNNYVALE<br />
J01-025 4/05<br />
El Camino Real<br />
Capitol Trains<br />
UPRR Alviso Line – ACE & Capitol Trains<br />
Tasman West LRT<br />
SANTA<br />
CLARA<br />
Kifer Rd<br />
Caltrain<br />
280<br />
Great America Pkwy<br />
Section 5<br />
Auto Mall Pkwy<br />
Auto Mall<br />
Paramount's<br />
Great America<br />
San Tomas Expwy<br />
To Oakland<br />
Alameda County<br />
UPRR Alviso Line – ACE & Capitol Trains<br />
101<br />
Grimmer Blvd<br />
Santa Clara County<br />
Central Expwy<br />
Great America<br />
Tail Track<br />
XXXX<br />
Santa Clara<br />
Santa Clara<br />
Guadalupe River<br />
Montague Expwy<br />
De La Cruz<br />
Santa Clara<br />
University<br />
880 880<br />
17<br />
To Santa Cruz<br />
To Pleasanton<br />
XXXXXX XXXX<br />
237<br />
San Jose<br />
International Airport<br />
Osgood Rd.<br />
880<br />
Warm Springs (Planned)<br />
880<br />
Dixon Landing Rd<br />
Tasman East LRT<br />
Tasman Blvd<br />
Trimble Rd<br />
Guadalupe LRT<br />
N 1st St<br />
SJIA<br />
People Mover<br />
The Alameda<br />
Mission Blvd<br />
Warm Springs Blvd.<br />
San Jose Diridon<br />
87<br />
Kato Rd<br />
Coleman Ave<br />
Abel St<br />
Montague Expwy<br />
Great Mall Pkwy<br />
Brokaw Rd<br />
FREMONT<br />
680<br />
880<br />
Civic<br />
Center<br />
XXXXXXXXXX<br />
280<br />
Arena<br />
Scott Creek Rd<br />
Great Mall<br />
Former SPRR - Now UPRR<br />
Section 4<br />
MILPITAS<br />
Hedding St<br />
Civic<br />
Center<br />
Trade Zone<br />
Blvd<br />
Old Oakland Rd<br />
Guadalupe LRT<br />
Jacklin Rd<br />
Calaveras Blvd<br />
Murphy Ave<br />
237<br />
South Calaveras<br />
(Future)<br />
Former UPRR - Now <strong>VTA</strong><br />
XXXXXXXXX<br />
Julian St<br />
Santa Clara St<br />
San Jose<br />
State Un.<br />
Landess Ave<br />
Montague/Capitol<br />
Market St.<br />
Diridon/Arena<br />
Caltrain<br />
680<br />
Hostetter Rd<br />
SAN JOSE<br />
Capitol Ave<br />
Mabury Rd<br />
Berryessa Rd<br />
Vasona LRT Capitol LRT<br />
87<br />
Tamien<br />
Legend 1:<br />
Proposed Altamont Commuter Express (ACE)<br />
Train Station<br />
Future BART Station Location<br />
Proposed BART Station<br />
BART Intermodal Transfer Center<br />
Existing & Future Key <strong>VTA</strong> Light Rail Transit<br />
(LRT) Stations<br />
Caltrain Station<br />
ACE or Caltrain Intermodal Transfer Center<br />
San Jose International Airport People Mover<br />
BART Extension to Warm Springs<br />
Berryessa<br />
Alum Rock<br />
Civic Plaza/SJSU<br />
Figure 1-1: BART Extension Alignment and Sections<br />
Section 1<br />
82<br />
Legend 2:<br />
680<br />
Story Rd<br />
Mckee Rd<br />
East Valley Corridor (Planned)<br />
101<br />
At-Grade (Surface/Ground Level)<br />
Retained Fill or Aerial<br />
Retained Cut (Trench)<br />
Downtown San Jose<br />
BART Tunnel<br />
XXXXXX Alignment or Station<br />
Design Option<br />
Proposed BART Operations &<br />
Maintenance Facility<br />
0<br />
Section 2<br />
Capitol Expwy<br />
To Morgan Hill<br />
NN<br />
1 mile<br />
Scale in Miles<br />
Alum Rock<br />
Ave<br />
Section 3<br />
Capitol Expwy<br />
East Valley LRT (Planned)<br />
Eastridge Mall
J01-025 4/05<br />
Section 1<br />
Cushing Pkwy.<br />
Coyote Creek<br />
S. Grimmer Blvd.<br />
Fremont Blvd.<br />
880<br />
Fremont Blvd.<br />
McCarthy Blvd.<br />
Bayside Pkwy.<br />
Gateway Blvd.<br />
Heath St.<br />
Fremont Blvd.<br />
Landing Pkwy.<br />
Kato Rd.<br />
FREMONT<br />
Coyote Creek<br />
W. Warren Av.<br />
Bayside Pkwy.<br />
Bayview Dr.<br />
Redwood Av.<br />
California Av.<br />
Abbott Av.<br />
Old Warm Springs Blvd.<br />
Lopes Ct.<br />
FREMONT<br />
Laekview Blvd.<br />
880<br />
Relocated<br />
Rail-Truck<br />
Transfer<br />
Facility<br />
End Warm Springs<br />
Extension<br />
Begin Silicon<br />
Valley Extension<br />
Laekview Blvd.<br />
ACFC+WD Channel F<br />
Penitencia Creek<br />
Kato Rd.<br />
Kato Rd.<br />
Line D<br />
Auburn St.<br />
Line C<br />
Existing<br />
Rail-Truck<br />
Transfer<br />
Facility<br />
Milmont Dr.<br />
Former SPRR - Now UPRR<br />
Dixon Landing Rd.<br />
San Andreas Dr.<br />
Pescadero St.<br />
Warm Springs Ct.<br />
Westinghouse Dr.<br />
Former UPRR - <strong>VTA</strong><br />
Hanson Ct.<br />
Warm Springs Blvd.<br />
Reliance Wy.<br />
Corporate Wy.<br />
E. Warren Av.<br />
Hackamor Ln.<br />
Pontiac Wy.<br />
Lippert Av.<br />
Mayten Wy.<br />
Washington Dr.<br />
Gable Com.<br />
Tonopah Dr.<br />
Arizona Av.<br />
Starlite Wy.<br />
Kato Rd. Scott Creek Rd.<br />
N. Milpitas Blvd.<br />
Wilson<br />
Wy.<br />
Midwick Dr.<br />
Warm Springs<br />
Mission Blvd.<br />
680<br />
Aqua Fria Creek<br />
Brown Rd.<br />
FREMONT<br />
Alameda<br />
Santa Clara<br />
MILPITAS<br />
Dixon Rd.<br />
Escuela<br />
Paseo Padre Pkwy.<br />
Toroges Creek<br />
S. Grimmer Blvd.<br />
E. Warren Av.<br />
680<br />
Calera Creek<br />
Jacklin Rd.<br />
Russell Ln.<br />
Mission Blvd.<br />
Scott Creek<br />
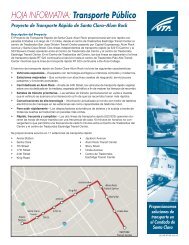
Figure 1-2a: Section 1 from<br />
Planned BART Warm Springs Station to Trade Zone Boulevard<br />
N. Hillview Dr.<br />
Aqua Caliente Creek<br />
0<br />
Legend:<br />
At-Grade<br />
(Surface/Ground Level)<br />
Retained Fill or Aerial<br />
Retained Cut (Trench)<br />
NN<br />
0.25 mile<br />
Scale in Miles
Alder Dr.<br />
Tasman Dr.<br />
Sycamore Dr.<br />
J01-025 4/05<br />
Bellew Dr.<br />
Section 1<br />
880<br />
Penitencia Creek<br />
Barber Ln.<br />
Starlite Dr.<br />
McCarthy Blvd.<br />
W. Capitol Av.<br />
G4<br />
Coyote Creek<br />
Oakland Rd. S. Main St.<br />
Ringwood Av.<br />
Heath St.<br />
Marylinn Dr.<br />
N. Abbott Av.<br />
Redwood Av.<br />
Abbott Av.<br />
Spencer Av.<br />
S. Abbott<br />
880<br />
Corning Av.<br />
FREMONT<br />
Penitencia Creek<br />
W. Calaveras Blvd.<br />
MILPITAS<br />
County Jail Farm<br />
W. Curtis<br />
Av.<br />
W. Capitol Av.<br />
Former SPRR - Now UPRR<br />
Fortune Dr.<br />
California Av.<br />
S. Abel St.<br />
SAN JOSE<br />
Hammond Wy.<br />
Trade Zone Blvd.<br />
Lundy Av.<br />
Alameda Co.<br />
McCandless Dr.<br />
Santa Clara Co.<br />
Dixon Landing Rd.<br />
Penitencia Creek<br />
Abel St.<br />
San Andreas Dr.<br />
Vasona St.<br />
Marylinn Dr.<br />
Main St.<br />
S. Main St.<br />
E. Curtis Av.<br />
Qume Dr.<br />
Berryessa St.<br />
Pescadero St.<br />
Railroad Av.<br />
Great Mall Dr.<br />
Great Mall Pkwy.<br />
Wrigley Ford Creek<br />
Great Mall<br />
of the<br />
Bay Area<br />
N. Capitol Av.<br />
Penitencia Channel<br />
Hanson Ct.<br />
Topaz St.<br />
Former UPRR - Now <strong>VTA</strong><br />
Piper Dr.<br />
N. Milpitas Blvd.<br />
Gilbraltar Dr.<br />
Wilson Wy.<br />
Washington Dr.<br />
Midwick Dr.<br />
Wrigley Ditch<br />
N. Milpitas Blvd.<br />
Berrryessa Creek<br />
N. Capitol Av.<br />
237<br />
S. Hillview Dr.<br />
Arizona Av.<br />
Escuela Pkwy.<br />
Los Coches St.<br />
Ames Av.<br />
Escuela<br />
S. Calaveras<br />
(Future Station)<br />
S. Milpitas Blvd.<br />
MILPITAS<br />
Montague Expwy.<br />
Dixon Rd.<br />
Yosemite Dr.<br />
Montague/Capitol<br />
Cropley Av.<br />
Scott Creek<br />
Jacklin Rd.<br />
Santa Rita Dr.<br />
Sinclair Rd.<br />
Piedmont Creek<br />
MILPITAS<br />
680<br />
Berryessa Creek<br />
Russell Ln.<br />
Dempsey Rd.<br />
Calera Creek<br />
N. Hillview Dr.<br />
Dempsey Rd.<br />
N. Hillview Dr.<br />
Capewood Ln.<br />
680<br />
Dempsey Rd.<br />
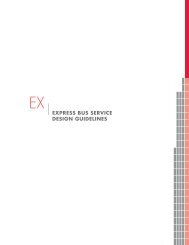
Figure 1-2b: Section 1 (continued) from<br />
Planned BART Warm Springs Station to Trade Zone Boulevard<br />
S. Park Victoria Dr.<br />
Morrill Av.<br />
N. Park Victoria Dr.<br />
E. Calaveras Blvd.<br />
Landess Av.<br />
0<br />
Legend:<br />
At-Grade<br />
(Surface/Ground Level)<br />
Retained Fill or Aerial<br />
Retained Cut (Trench)<br />
NN<br />
0.25 mile<br />
Scale in Miles
Coyote Creek<br />
E. Brokaw Rd<br />
Old Bayshore Hwy<br />
4th St<br />
J01-025 4/05<br />
Section 2<br />
880<br />
7th St<br />
880<br />
Penitencia Creek<br />
101<br />
Oakland Rd<br />
Brokaw Rd<br />
Former SPRR - Now UPRR<br />
10th St<br />
11th ST<br />
Oakland Rd<br />
G4<br />
S. Main St<br />
Ringwood Ave<br />
SAN JOSE<br />
E. Hedding Rd<br />
13Tth ST<br />
Commercial St<br />
MILPITAS<br />
Murphy Ave<br />
E. Taylor St.<br />
Lundy Ave<br />
Coyote Creek<br />
E Julian Rd<br />
Penitencia<br />
Trade Zone Blvd<br />
Former UPRR- Now <strong>VTA</strong><br />
Montague Expwy.<br />
Montague/Capitol<br />
Cropley Ave<br />
Hostetter Rd<br />
N Capitol Ave<br />
Berryessa<br />
Lower Silver Creek<br />
101<br />
Berryessa Rd<br />
N. King Rd<br />
680<br />
Alum Rock<br />
Trimble Rd<br />
SAN JOSE<br />
Alum Rock Ave<br />
Mabury Rd<br />
Figure 1-3: Section 2 from Trade Zone Boulevard to Mabury Road<br />
Upper Penitencia<br />
680<br />
Miguelita Creek<br />
McKee Rd<br />
130<br />
Silver Creek<br />
Berrryessa Creek<br />
SAN JOSE<br />
Legend:<br />
At-Grade<br />
(Surface/Ground Level)<br />
Retained Fill or Aerial<br />
Retained Cut (Trench)<br />
Alternate Downtown San Jose<br />
BART Tunnel Alignments<br />
0<br />
NN<br />
0.25 mile<br />
Scale in Miles
N. 4th St.<br />
J01-025 Fig 3.3-4 5/29/03<br />
N. 7th St.<br />
Former SPRR - Now UPRR<br />
E Julian St<br />
E. St. James St.<br />
E. Santa Clara St.<br />
N. 11th St.<br />
N. 10th St.<br />
Civic Plaza/SJSU<br />
San Jose State<br />
University<br />
E. San Fernando St.<br />
280<br />
E. Hedding Rd<br />
N. 13th St.<br />
E. San Carlos St.<br />
SAN JOSE<br />
Coyote Creek.<br />
E. Taylor St.<br />
E. San Antonio St.<br />
101<br />
Former UPRR - Now <strong>VTA</strong><br />
Roosevelt<br />
Community<br />
Center<br />
Berryessa Rd<br />
N.24th St.<br />
E. Antonio St.<br />
S.24th St.<br />
Coyote Creek<br />
MCLaughlin Av.<br />
Section 3<br />
Lower Silver Creek<br />
101<br />
Mabury Rd<br />
Alum Rock<br />
Berryessa<br />
N. King Rd<br />
McKee Rd<br />
Alum Rock Ave.<br />
Miguelita Creek<br />
E. San Antonio<br />
Legend:<br />
At-Grade<br />
(Surface/Ground Level)<br />
Retained Fill or Aerial<br />
Retained Cut (Trench)<br />
Alternate Downtown San Jose<br />
BART Tunnel Alignments<br />
Upper Penitenci a<br />
SAN JOSE<br />
Silver Creek<br />
Figure 1-4: Section 3 from Mabury Road to 19th Streets<br />
Section 3<br />
Story Rd<br />
0<br />
680<br />
NN<br />
0.25 mile<br />
Scale in Miles
SANTA<br />
CLARA<br />
Bellomy St<br />
Monore St<br />
Newhall St<br />
J01-025 4/05<br />
Bascom Ave<br />
Washington St<br />
Section 4<br />
Market St<br />
Lafayette St<br />
880<br />
Santa Clara<br />
Santa Clara<br />
University<br />
BART Operations and<br />
Maintenance Facility<br />
SAN JOSE<br />
82<br />
W. Hedding Ave<br />
Naglee Ave<br />
Park Ave<br />
Meridian St<br />
Race St<br />
Proposed SJIA People Mover<br />
Newhall St<br />
Lincoln Ave<br />
Los Gatos<br />
The Alameda<br />
82<br />
Coleman Ave<br />
W. Taylor St.<br />
Diridon/Arena<br />
Park Ave<br />
San Jose<br />
International Airport<br />
Stockton Ave<br />
Bird Ave<br />
Caltrain<br />
Caltrain<br />
Coleman Ave<br />
Caltrain<br />
The Alameda<br />
S. Montgomery St<br />
Autumn St<br />
Stockton Av.<br />
Market St.<br />
Arena<br />
W. San Carlos St.<br />
N. Market St.<br />
Julian St.<br />
Market St.<br />
E. San Fernando St.<br />
Former SPRR - Now UPRR<br />
E. St. James St.<br />
E. Santa Clara St.<br />
San Jose State<br />
University<br />
N. 11th St.<br />
N. 10th St.<br />
Civic Plaza/SJSU<br />
N. 13th St.<br />
E. San Carlos St.<br />
Roosevelt<br />
Community<br />
Center<br />
E. Taylor St.<br />
Coleman Av. E. Julian St.<br />
87<br />
Guadalupe River<br />
87<br />
Guadalupe River<br />
US Army<br />
San Jose Civic Center<br />
S. Park Ave<br />
Guadalupe LRT N 1st St<br />
880<br />
N 1st St<br />
82<br />
E. Taylor St<br />
N 4th St<br />
N 7th St<br />
101<br />
E. Julian St.<br />
SAN JOSE<br />
E. San Antonio St.<br />
Figure 1-5: Section 4 from 19th Streets to I-880<br />
SAN JOSE<br />
Coyote Creek.<br />
N.24th St.<br />
E. Antonio St.<br />
Former UPRR - Now <strong>VTA</strong><br />
280<br />
MCLaughlin Av.<br />
Mabury Rd.<br />
N.28th St.<br />
Lower Silver Creek<br />
101<br />
McKee Rd.<br />
Miguelita Creek<br />
Silver Creek<br />
Alum Rock<br />
Alum Rock Ave.<br />
E. San Antonio<br />
0<br />
Legend:<br />
At-Grade<br />
(Surface/Ground Level)<br />
Retained Fill or Aerial<br />
Retained Cut (Trench)<br />
Alternate Downtown San Jose<br />
BART Tunnel Alignments<br />
NN<br />
0.25 mile<br />
Scale in Miles
Section 5<br />
J01-025 4/05<br />
Homestead Rd.<br />
Saratoga Av<br />
San Thomas Expwy.<br />
N. Winchester Blvd<br />
Newhall St<br />
Bascom Ave<br />
SAN JOSE<br />
Market St<br />
Bellomy St<br />
El Camino Real<br />
Benton St<br />
Washington St<br />
Park Ave<br />
SANTA<br />
CLARA<br />
880<br />
Race St<br />
Lincoln St<br />
Monore St<br />
82<br />
Scott Blvd<br />
W. Hedding St.<br />
Naglee Ave<br />
The Alameda<br />
Diridon/Arena<br />
The Alameda<br />
82<br />
Civic<br />
Center<br />
Santa Clara<br />
Santa Clara<br />
University<br />
W. Taylor St<br />
Caltrain<br />
Lafayette St<br />
BART Operations and<br />
Maintenance Facility<br />
Lenzen Ave<br />
Stockton Ave<br />
Los Gatos Creek<br />
Newhall St<br />
Caltrain<br />
Coleman Ave<br />
Tail Track<br />
Brokaw Rd<br />
Coleman Ave<br />
E. St. James St<br />
Guadalupe River<br />
De La Cruz Blvd<br />
Proposed SJIA People Mover<br />
87<br />
N 1st St<br />
Walsh Av<br />
UPRR Alviso Line – ACE & Capitol Trains<br />
E. Julian St<br />
US Army<br />
San Jose<br />
International Airport<br />
San Jose Civic Center<br />
N 4th St<br />
E. Taylor St<br />
N 7th St<br />
Legend:<br />
At-Grade<br />
(Surface/Ground Level)<br />
Retained Fill or Aerial<br />
Retained Cut (Trench)<br />
Alternate Downtown San Jose<br />
BART Tunnel Alignments<br />
Figure 1-6: Section 5 from I-880 to Lafayette Street<br />
87<br />
Guadalupe<br />
Airport Pkwy<br />
Guadalupe LRT N 1st St<br />
SAN JOSE<br />
Former SPRR - Now UPRR<br />
0<br />
101<br />
NN<br />
0.25 mile<br />
Scale in Miles
Contaminant Management Plan, SVRT/BART Extension<br />
1. Line Segment: The Line Segment extends in a north-south alignment from the planned Warm Springs<br />
BART Station in Fremont along a former Union Pacific Railroad (UPRR) right-of-way (ROW)<br />
through Milpitas to the East Tunnel Portal in San Jose.<br />
2. Tunnel Segment: The Tunnel Segment extends in a general east-west alignment beginning at the East<br />
Tunnel Portal located at the southern limit of the Line Segment, extends towards the west as a<br />
subway under Santa Clara Street in downtown San Jose, and ends at the West Tunnel Portal near<br />
Newhall Street in San Jose.<br />
3. Yard and Shops Segment (Facilities Segment): The Yard and Shops Segment begins at the West<br />
Tunnel Portal and extends to the Project’s terminus near the existing Caltrain Station in the City of<br />
Santa Clara and will include a maintenance facility.<br />
4. Stations Segment: The Stations Segment includes project improvements, such as parking garages,<br />
access roads, and bus transit facilities, on the portions of the stations campuses not directly on the<br />
BART alignment.<br />
5. System Segment: The System Segment includes project improvements not provided by the other four<br />
project segments, and systems elements to be installed throughout the entire SVRT project.<br />
<strong>VTA</strong> has contracted separate design project teams for each of these segments and intends to contract separate<br />
construction contractors. Design of the station buildings are covered by the segment that they fall along. The<br />
distribution of station buildings among project segments are described in detail in the following sections.<br />
1.2 PROJECT AREAS ADDRESSED<br />
The SVRT project areas addressed in the CMP includes the Line Segment, the Stations Segment, Yard and<br />
Shops Segment (which includes the planned maintenance facility), and portions (cut-and-cover stations and<br />
retained cuts) of the Tunnel Segment. The twin-bored tunnels portion of the Tunnel Segment has been<br />
excluded from the CMP because: 1) the subsurface materials encountered while tunneling are expected to be<br />
uncontaminated due to their depth (approximately 25 to 50 feet below the groundwater table), and 2) the soil<br />
handling procedures will be dramatically different when removing the thoroughly mixed soil and groundwater<br />
generated while advancing the twin-bored tunnels. The tunnel design team will handle the appropriate<br />
precautions for managing contaminated materials, if any, encountered during the tunnel construction<br />
separately. The segments discussed in the CMP are described in greater detail in Section 2.<br />
101248 – July 2008 Page 9
Contaminant Management Plan, SVRT/BART Extension<br />
Based on preliminary investigations and prior uses of the properties, contaminants are known to be present in<br />
some of the materials that will be disturbed or encountered during project work, including soil, railroad<br />
ballast, groundwater and building materials.<br />
1.3 PURPOSE AND OBJECTIVES<br />
The purpose of the CMP is to present a consistent framework that the designers of the project can operate in<br />
designing and obtaining regulatory approval for specific construction activities within a project segment. This<br />
framework integrates the following key objectives of the CMP:<br />
• Identifying the various scenarios under which large volumes of soil and railroad ballast generated<br />
during construction can be safely reused;<br />
• Identifying maximum acceptable contaminant levels for each reuse scenario, by combining existing<br />
regulatory agency guidance with calculation of risk-based cleanup goals;<br />
• Identifying sampling and analysis, stockpiling, transportation, health and safety, and other procedures<br />
by which soil and ballast must be managed in order to meet safety, regulatory and other standards;<br />
• Defining how the groundwater that will be encountered during construction will be characterized,<br />
properly treated and discharged; and<br />
• Defining how building materials that will be encountered during construction will be characterized,<br />
handled and disposed.<br />
1.4 CONTAMINANT MANAGEMENT PLAN ORGANIZATION<br />
Section 1 presents a description of the project areas covered by the CMP, and the purpose and objectives of<br />
the CMP. Section 2 presents a detailed description of the project, with a separate description for each of the<br />
project segments, which will be designed and built separately. The calculation of risk-based levels for<br />
protection of human health and ecological receptors are presented in Section 3. Section 4 details the<br />
mitigation measures for soil and railroad ballast. Section 5 details the mitigation measures for groundwater as<br />
part of the dewatering activities, and Section 6 presents the mitigation measures for building materials.<br />
Section 7 discusses reporting requirements, and Section 8 lists reference documents.<br />
101248 – July 2008 Page 10
2.0 BACKGROUND<br />
Contaminant Management Plan, SVRT/BART Extension<br />
The following sections present a more detailed picture of the physical setting for the SVRT project, and<br />
include additional background regarding the SVRT project segments addressed in this CMP. Separate design<br />
and construction teams will work on each of the segments discussed below.<br />
Previous analytical data collected in investigations associated with the SVRT project, including a quality<br />
assurance/quality control review, are presented in <strong>Appendix</strong> A.<br />
2.1 PHYSICAL SETTING DESCRIPTION<br />
The geology, hydrogeology, and hydrology of the SVRT project are discussed below in the broad context of<br />
the South Bay region’s physical setting.<br />
2.1.1 Geology<br />
The SVRT project alignment is located in the Santa Clara Valley, a northwest trending valley separated by<br />
intervening ranges within the Coast Ranges geomorphic province of Northern California. The Santa Clara<br />
Valley is an alluvial basin located between the Santa Cruz Mountains to the southwest and the Diablo Range<br />
to the northeast. The valley is covered by alluvial fan, levee, and active stream channel deposits with marine<br />
estuary deposits along the San Francisco Bay (Bay) margins. These unconsolidated deposits cover Tertiary<br />
through Cretaceous age bedrock.<br />
The entire SVRT alignment will lie on alluvial deposits that are underlain, at depths much greater than would<br />
be encountered during construction, by Tertiary age and upper Cretaceous age marine sedimentary rocks and<br />
Cretaceous age Franciscan Complex bedrock. These older rocks appear at the surface in the ranges southwest<br />
and northeast of the SVRT alignment. The alluvium has been described as Holocene age alluvial fan deposits,<br />
fine-grained Holocene alluvial fan deposits, and Holocene alluvial fan levee deposits. These alluvial fan<br />
deposits consist of sand, gravel, silt, and clay. Fine-grained alluvial fan deposits occur on the flatter distal<br />
portions of fans and consist primarily of silt and clay-rich sediments with interbedded lobes of coarser sand<br />
and occasional gravel. The Holocene alluvial fan levee deposits consist of silt, sand, and clay.<br />
Near the north end of the alignment, the alluvial fan deposits grade into Holocene alluvial fan-estuarine<br />
complex deposits and Holocene Bay Mud. Holocene alluvial fan-estuarine complex deposits form where the<br />
distal zone of the fan and basin environments transition to the estuarine environment at the edge of San<br />
Francisco Bay between the Guadalupe River and Coyote Creek. These deposits are transitional from sand,<br />
silt, and clay of the alluvial environment to Bay Mud.<br />
101248 – July 2008 Page 11
Contaminant Management Plan, SVRT/BART Extension<br />
Artificial fill may be present over any of these Holocene age deposits along the SVRT alignment. Areas<br />
within the SVRT alignment with other soil conditions such as expandable or compressible soils will be<br />
identified by detailed geotechnical studies during the design phase of the project.<br />
2.1.2 Hydrogeology<br />
The alignment is located within two South Bay groundwater basins, the Niles Cone Basin and the Santa Clara<br />
Basin. The Niles Cone Basin is located in the northern portion of the SVRT alignment, in Alameda County,<br />
while the Santa Clara Basin is located in the southern portion of the SVRT alignment, in Santa Clara County.<br />
As specified in the regional Basin Plan, the current and potential uses of groundwater in the Niles Cone Basin<br />
are municipal and domestic supply, industrial process supply, industrial service water supply, and agricultural<br />
water supply. The Niles Cone Basin produces moderately low groundwater yields to wells. Groundwater is<br />
typically encountered within 50 feet of the ground surface and the flow is generally westward. Given the<br />
elevation of the SVRT alignment, groundwater depths on the order of 20 feet and under potentially confined<br />
conditions are anticipated. The Niles Cone Basin receives limited recharge from the Warm Springs Sub-basin<br />
and the Mission Uplands farther to the east. The construction of facilities for artificial recharge or diversion,<br />
in conjunction with the availability of imported water, has increased the safe yield of the Niles Cone Basin.<br />
Overall, groundwater quality in the Niles Cone Basin is good and generally meets the RWQCB’s groundwater<br />
quality objectives (RWQCB, 2001).<br />
In the Santa Clara Basin, groundwater is relatively shallow (10 to 50 feet) in the headwater area of the Santa<br />
Clara Basin. The groundwater depth increases to depths of 100 to 300 feet in the interior of the basin, and<br />
then decreases to zero approaching the Bay. In the downtown San Jose portion of the SVRT alignment,<br />
groundwater elevations between 13 and 21 feet below ground surface (bgs) are reported. From the Santa Clara<br />
County boundary north to Calaveras Boulevard, groundwater elevations are reported between 0 to 5 feet bgs.<br />
Between Calaveras Boulevard and Berryessa Creek, groundwater elevations reportedly range from 5 to 15<br />
feet bgs. Between Berryessa Creek and US 101, groundwater elevations reportedly range from 15 to 30 feet<br />
bgs, while between Lower Silver Creek and Coyote Creek, groundwater elevations reportedly range from 0 to<br />
5 feet bgs.<br />
Groundwater monitoring results in the Santa Clara Valley show that water quality is excellent to good for all<br />
major zones of the Santa Clara Basin. Drinking water standards are met at public water supply wells without<br />
the use of treatment methods, and contamination in general has not been detected. However, some limited<br />
101248 – July 2008 Page 12
Contaminant Management Plan, SVRT/BART Extension<br />
areas of the Santa Clara Basin contain concentrations of mineral salts, which adversely affect groundwater<br />
uses (<strong>VTA</strong>, 2004).<br />
2.1.3 Hydrology<br />
Westward flowing streams draining the foothills of the Diablo Range characterize the surface hydrology of<br />
eastern Fremont and Milpitas. Northward flowing streams draining the foothills of the Diablo Range and the<br />
Santa Clara Valley characterize the surface hydrology of eastern and southern San Jose. The lower reaches of<br />
many streams have been modified and constructed as storm drainage channels, designed to convey<br />
stormwater flow through the urbanized area. The project alignment crosses several major drainage lines in<br />
Alameda and Santa Clara counties.<br />
Creeks in the Alameda County portion of the SVRT alignment drain small watersheds and collect water from<br />
a limited (generally under 5 square miles), mostly urbanized area. These watercourses include Agua Caliente<br />
Creek, Agua Fria Creek, Toroges Creek, and Scott Creek. Most of these creeks have water only during the<br />
wet season. In general, the existing drainage structures within the SVRT alignment in Alameda County have<br />
been sized to effectively convey the stormwater flows of the 15-year stormwater runoff event, although the<br />
<strong>VTA</strong> plans to upgrade these facilities to convey a 100-year storm event without causing upstream flooding.<br />
The quality of surface water within the SVRT alignment in Alameda County has been degraded due to nonpoint<br />
source pollution.<br />
The principal drainage feature of the Santa Clara Basin is Coyote Creek, which originates in the Diablo<br />
Range, enters the Coyote Valley at its southeastern end, and flows northwesterly through the Coyote Valley<br />
and the Santa Clara Valley before entering San Francisco Bay. Other major drainages passing through the<br />
Santa Clara Basin and within the SVRT project area include the Guadalupe River and Los Gatos Creek, which<br />
originate in the Santa Cruz Mountains. Drainages entering the Santa Clara Valley from the east are generally<br />
smaller, and the largest are Upper and Lower Penitencia Creeks and Berryessa Creek. In Santa Clara County,<br />
most of the creek cross drainage structures along the SVRT project have been sized or are in the process of<br />
being resized for the 100-year flood event. A non-point source pollution study conducted in Santa Clara<br />
County by the RWQCB found that contaminant loads are directly proportional to stormwater runoff. The<br />
estimated annual pollutant loads are highly variable, depending on the volume of runoff. In addition, the<br />
erosion of sediments containing naturally occurring minerals is another source of contaminants (specifically<br />
metals) in stormwater runoff. As creeks carry eroded materials down from the Diablo Range, heavier coarser<br />
sediments are deposited first, while lighter and finer particles are carried further downstream towards the Bay.<br />
101248 – July 2008 Page 13
2.2 PROJECT SEGMENTS<br />
Contaminant Management Plan, SVRT/BART Extension<br />
As previously noted, the SVRT project has been divided into five segments for design and construction:<br />
• Line Segment<br />
• Tunnel Segment<br />
• Yard and Shops Segment<br />
• Stations Segment<br />
• Systems Segment<br />
This CMP is intended to cover the Line Segment, the Stations Segment, Yard and Shops Segment (which<br />
includes the planned maintenance facility), and portions (cut-and-cover stations and retained cuts) of the<br />
Tunnel Segment. These areas are discussed in further detail below.<br />
2.2.1 Line Segment<br />
The Line Segment of the SVRT project is a 9.8-mile section of track that will be located along the former<br />
UPRR ROW. The UPRR ROW was owned and operated by Western Pacific Railroad (WPRR) before it was<br />
purchased by UPRR. <strong>VTA</strong> has since purchased the alignment from UPRR.<br />
The Line Segment project will include the construction of twin tracks from the Warm Springs Station (to be<br />
constructed by BART) south to the retained cut leading to the portal for the tunnel. The Line Segment will be<br />
primarily built at-grade, though the preliminary design currently includes: aerial sections, two retained cuts,<br />
and new depressed roadways. The retained cuts currently planned include:<br />
• Retained cut for Montague Expressway and Trade Zone Boulevard, approximately 5,650 feet long<br />
and 20 to 24 feet deep; and<br />
• Retained cut for Hostetter Road, Lundy Avenue, and Sierra Road, approximately 5,100 feet long and<br />
30 to 35 feet deep.<br />
It should be noted that an aerial alternative replacing the retained cut for Montague Expressway and Trade<br />
Zone Boulevard is currently under consideration.<br />
The new depressed roadways include:<br />
• East Warren Avenue (to be designed and constructed by others);<br />
• Kato Road; and<br />
• Dixon Landing Road.<br />
For design purposes, the stations along the Line Segment are included as part of the Line Segment. These<br />
stations include:<br />
101248 – July 2008 Page 14
• The future South Calaveras Station in Milpitas;<br />
• The Montague/Capitol Station in Milpitas; and<br />
• The Berryessa Station in San Jose.<br />
Contaminant Management Plan, SVRT/BART Extension<br />
Parking areas, drop off areas, and other support facilities for the above stations were included in the Stations<br />
Segment.<br />
2.2.2 Stations Segment<br />
There are six planned BART stations and campuses and one future station. These include:<br />
• South Calaveras Station (Future): Planned as an at-grade station just south of Calaveras Blvd. This<br />
station will include an at-grade parking structure and encompass up to 22 acres.<br />
• Montague/Capitol Station and Campus: Planned as a below grade station (although an aerial<br />
alternative is currently under consideration). This station will include an at-grade parking structure<br />
and encompass up to 21 acres.<br />
• Berryessa Station and Campus: Planned as an aerial station. This station will include an at-grade<br />
parking structure and encompass up to 43 acres.<br />
• Alum Rock Station and Campus: Planned as a below grade station in San Jose, just south of East<br />
Julian Street at North 28 th Street. Includes an at-grade parking structure and support infrastructure on<br />
approximately 17 acres.<br />
• Downtown San Jose Station: Planned as a below grade station underneath East Santa Clara Street,<br />
between Second Street and Market Street in downtown San Jose, in an area approximately 1 acre in<br />
size.<br />
• Diridon/Arena Station and Campus: Planned as a below grade station just south of the HP Pavilion<br />
and east of the Diridon Caltrain station, in San Jose. The Diridon/Arena Station includes a parking<br />
structure and support infrastructure adjacent to and west of the HP Pavilion. The Diridon/Arena<br />
Station will cover approximately 9.5 acres.<br />
• Santa Clara Station and Campus: Planned as an at-grade station west of Coleman Avenue at Brokaw<br />
Road in Santa Clara. This station will include a parking structure and support infrastructure on<br />
approximately 12 acres.<br />
Three of these stations will be constructed by the cut-and-cover method: Alum Rock Station, Downtown San<br />
Jose Station, and Diridon/Arena Station. Cut-and-cover stations will require vertical excavation to the<br />
designed depth (often 50 to 75 feet below grade), connection to the twin bored tunnels, construction of the<br />
station, and backfilling so the overlying ground surface can be utilized. For Alum Rock and Diridon/Arena<br />
Station, the below grade stations will have parking structures located at-grade.<br />
As noted in Sections 2.2.1, 2.2.3, and 2.2.4, the actual stations along the Line Segment (future South<br />
Calaveras Station, Montague Station, and Berryessa Station), Yard and Shops Segment (Santa Clara Station),<br />
101248 – July 2008 Page 15
Contaminant Management Plan, SVRT/BART Extension<br />
and Tunnel Segment (Alum Rock Station, Downtown San Jose Station, and Diridon/Arena Station) will be<br />
included with those segments accordingly for design purposes.<br />
2.2.3 Yard and Shops Segment<br />
The Yard and Shops Segment includes a new BART maintenance and storage facility, the retained cut leading<br />
from the maintenance yard to the tunnel portal, and the Santa Clara Station. The maintenance and storage<br />
facility will be located on approximately 50 acres in the eastern portion of the UPRR Newhall Yard and will<br />
likely extend into the western portion of the former Food Machinery Corporation (FMC) manufacturing<br />
facility in San Jose and Santa Clara, including as an option extending into the former portion of the FMC<br />
facility at 333 Brokaw Road, which is now occupied by Fedex Corporation. As the terminus of the BART<br />
extension, this new facility will include single and double story buildings for maintenance, repair, and<br />
training, transfer tracks, a turntable, a yard control tower, and two parking areas. Construction of the BART<br />
maintenance and storage facility is anticipated to occur primarily at-grade. For design purposes, the Santa<br />
Clara Station will be included with the Yard and Shops Segment.<br />
2.2.4 Tunnel Segment<br />
The Tunnel Segment of the SVRT project, approximately a 5-mile section, extends in a general east-west<br />
alignment beginning at the retained cut leading to the East Tunnel Portal located at the southern limit of the<br />
Line Segment, extends towards the west as a subway under Santa Clara Street in downtown San Jose, and<br />
ends at the West Tunnel Portal near Newhall Street in San Jose. The Tunnel Segment consists of a twinbored<br />
tunnel, cut-and-cover subways at the ends of the tunnel, and a retained cut leading Line Segment to the<br />
portal for the tunnel.<br />
For design purposes, the stations along the Tunnel Segment are included as part of the Tunnel Segment. These<br />
stations include:<br />
• The Alum Rock Station in San Jose;<br />
• The Downtown San Jose Station; and<br />
• The Diridon/Arena Station in San Jose.<br />
Parking areas, drop off areas, and other support facilities for the stations were included in the Stations<br />
Segment.<br />
101248 – July 2008 Page 16
2.3 PREVIOUS INVESTIGATIONS<br />
2.3.1 Line Segment<br />
Contaminant Management Plan, SVRT/BART Extension<br />
There were two environmental investigations initiated by <strong>VTA</strong> and one by UPRR as part of the due diligence<br />
process for the acquisition of a portion of the UPRR Milpitas Corridor railroad alignment from UPRR by<br />
<strong>VTA</strong> for the SVRT project:<br />
• URS Corporation (URS) was retained by <strong>VTA</strong> to conduct a Phase I Environmental Site Assessment<br />
(ESA) to identify potential environmental concerns along a section of the UPRR alignment: from<br />
Paseo Padre Parkway in Fremont southward to the intersection of the railroad near Highway 87 in<br />
San Jose. URS conducted the Phase I ESA in the summer of 2001 and subsequently prepared four<br />
reports for four segments of the potential acquisition alignment. Typical of these report titles was<br />
Phase I Environmental Site Assessment, Silicon Valley Rapid Transit Corridor, Segment “A”,<br />
Milpitas and Fremont, CA; the report titles for Segments “B”, “C” and “D” were analogous. These<br />
reports were released on October 11, 2001.<br />
• Geomatrix Consultants, on behalf of UPRR, collected samples of shallow soil and ballast in July and<br />
August 2001. These samples were primarily analyzed for arsenic and lead, though selected samples<br />
were also analyzed for other metals and organic chemicals. The data collected during this<br />
investigation was released to <strong>VTA</strong> in a letter from Jacobs, Chase, Frick, Kleinkopf & Kelley, LLC,<br />
dated October 10, 2001.<br />
• Earth Tech conducted a Phase II environmental investigation within the potential sale area in late<br />
2001 and early 2002. The Phase II investigation was based on the results of the Phase I data by URS<br />
and site-specific analytical data collected by UPRR, as discussed above. Because UPRR had<br />
identified significant levels of arsenic and lead along the alignment, this investigation focused on<br />
evaluating site arsenic and lead levels. However, a large number of chemical analyses were also<br />
performed for other metals and organic chemicals. The results of this investigation were presented in<br />
the report UPRR Alignment Investigation Data for BART extension to San Jose,<br />
Fremont/Milpitas/San Jose, CA, dated March 29, 2002.<br />
Following acquisition of the railroad alignment from UPRR, Earth Tech conducted additional hazardous<br />
materials investigation as part of the preliminary engineering design phase of the project to further<br />
characterize the Line Segment alignment. The investigation was conducted between July and October 2004. A<br />
draft of the Line Segment <strong>Hazardous</strong> <strong>Materials</strong> Characterization report was issued in March 2005.<br />
2.3.2 Stations Segment<br />
With the exception of the portions of the three stations (future South Calaveras Station, Montague/Capital<br />
Station, and Berryessa Station) that fall within the former UPRR right-of-way under the Line Segment, there<br />
have been no previous environmental investigations performed on behalf of <strong>VTA</strong> at any of the stations and<br />
corresponding campus areas. However, investigations are in the planning stages and are expected to occur<br />
during the final design phase.<br />
101248 – July 2008 Page 17
2.3.3 Yard and Shops Segment<br />
UPRR Newhall Yard<br />
Contaminant Management Plan, SVRT/BART Extension<br />
There were two environmental investigations initiated by <strong>VTA</strong> as part of the due diligence process for the<br />
acquisition of land from the UPRR Newhall Yard for the SVRT project:<br />
• Earth Tech was retained by <strong>VTA</strong> to conduct a Phase I Environmental Site Assessment (ESA) to<br />
identify potential environmental concerns within UPRR Newhall Yard. Earth Tech conducted the<br />
Phase I ESA in July and August 2002 and subsequently prepared the combined report Phase I<br />
Environmental Site Assessment and Phase II Investigation Work Plan for the Newhall Yard, San<br />
Jose/Santa Clara, California (Phase I ESA and Phase II Work Plan), released in draft in September<br />
2002 and finalized in February 2003.<br />
• Earth Tech conducted a Phase II environmental investigation within the potential sale area in the<br />
UPRR Newhall Yard. The investigation was performed in two phases:<br />
FMC Facility<br />
1) In December 2002, Earth Tech focused its evaluation on the eastern portion of the yard<br />
where there were no tracks and investigated the western portion of the yard (containing<br />
numerous sets of tracks for railroad car storage) by collecting a total of forty-six soil samples<br />
from twenty-one locations. This investigation was described in the Earth Tech report Draft<br />
Phase II Investigation Data Summary Report for UPRR Newhall Yard, San Jose/Santa<br />
Clara, California, dated February 2003; and<br />
2) In June 2003, Earth Tech primarily focused on the western portion of the yard and collected<br />
an additional 26 soil samples from nine locations. This investigation was described in the<br />
Earth Tech report Draft Additional Investigation Data Summary Report for UPRR Newhall<br />
Yard, San Jose/Santa Clara, California, dated July 2003.<br />
In addition to the environmental investigations presented above for the UPRR Newhall Yard, environmental<br />
investigations and corrective actions have been ongoing at the adjacent former FMC facility site since 1996.<br />
The facility investigations and corrective actions have been focused on the following three site addresses:<br />
• 333 West Brokaw Road, which was the northernmost section of the facility immediately north of<br />
Brokaw Road. <strong>VTA</strong> plans for this area to be included in the Santa Clara Station, as an option. This<br />
area is now occupied by FedEx Corporation;<br />
• 328 West Brokaw Road, which was the portion of the facility immediately south of Brokaw Road.<br />
<strong>VTA</strong> plans for this area to be included in the Santa Clara Station, as an option; and<br />
• 1125 Coleman Avenue, which comprised the remainder and largest portion of the facility.<br />
Soil and groundwater beneath the former FMC facility is impacted with petroleum hydrocarbons, metals, and<br />
volatile organic compounds (VOCs). The primary chemicals of concern are trichloroethylene (TCE) and<br />
tetrachloroethylene (PCE) in groundwater.<br />
101248 – July 2008 Page 18
Contaminant Management Plan, SVRT/BART Extension<br />
Groundwater extraction and monitoring at the 333 and 328 West Brokaw portions are under RWQCB<br />
oversight. Based on groundwater monitoring data and estimates of groundwater flow directions, there is a<br />
potential for the TCE plume beneath the former FMC facility to extend beneath the UPRR Newhall Yard.<br />
Remediation and monitoring at the 1125 Coleman Avenue portion has been under DTSC oversight. As of<br />
April 2005, two groundwater treatment systems are in operation at the 1125 Coleman Avenue portion.<br />
2.4 SUMMARY OF CURRENT ENVIRONMENTAL CONTAMINATION<br />
The prior characterization efforts described above have identified current environmental contamination, or the<br />
reasonable potential of contamination, in soil, ballast, groundwater, and building materials which will be<br />
demolished during project construction. Arsenic and lead in soil and/or ballast and VOCs in groundwater<br />
appear to be the main contaminants that may be encountered. Other media, such as surface water bodies, do<br />
not appear likely to have been impacted by existing contaminants.<br />
2.4.1 Impacts to Soil and Ballast<br />
2.4.1.1 Line Segment<br />
Geomatrix and Earth Tech have conducted several investigations (between 2001 and 2004) designed to<br />
evaluate the environmental issues related with the soil and ballast along the Line Segment of the proposed<br />
SVRT alignment. The results from the investigations indicate no apparent significant impacts in soil or<br />
ballast associated with polychlorinated biphenyls (PCBs), VOCs, semivolatile organic compounds (SVOCs),<br />
or petroleum hydrocarbons. However, significant arsenic and lead contamination in the ballast material is<br />
present along much of the SVRT alignment. The primary source of arsenic appears to be the metals refining<br />
slag used as ballast for track maintenance from about 1960 to 1983, and potential secondary sources may have<br />
included use of herbicides and insecticides. The occurrence of the elevated lead concentrations appears to be<br />
attributed to aerially-distributed automobile exhaust emissions and lead-acid batteries used to power signals<br />
near railroad crossings. Overall, arsenic appears to be the primary metal impacting soil and ballast along the<br />
Line Segment.<br />
The data collected by Geomatrix and Earth Tech indicates that the shallow soil beneath the ballast (0 to 3 feet<br />
bgs) contains sufficient total and extractable arsenic to require the material be handled as a California<br />
Regulated Waste if disposal is considered. Data on deeper soil samples (3 feet to greater than 20 feet bgs)<br />
indicates that arsenic concentrations are not sufficient to classify the material as a California Regulated Waste<br />
for disposal purposes.<br />
101248 – July 2008 Page 19
2.4.1.2 Stations Segment<br />
Contaminant Management Plan, SVRT/BART Extension<br />
As described in Sections 2.2.1, 2.2.3, and 2.3.4, the design of the actual stations will reside with the segment<br />
that they fall along (such as the Line Segment, Tunnel Segment, or Yard and Shop Segment). However, for<br />
ease of reference, impacts to soil and ballast are summarized below for each station and/or corresponding<br />
campus. With the exception of the portions of the three stations (future South Calaveras Station,<br />
Montague/Capital Station, and Berryessa Station) that fall within the former UPRR right-of-way under the<br />
Line Segment, there have been no previous environmental investigations performed on behalf of <strong>VTA</strong> at any<br />
of the stations and corresponding campus areas. However, investigations are in the planning stages and are<br />
expected to occur during the final design phase. The information provided below is generally based on<br />
database searches summarized in the Final Environmental Impact Report (Final EIR) prepared by <strong>VTA</strong>, or as<br />
otherwise indicated.<br />
Future South Calaveras Station, Montague/Capitol Station and Campus, and Berryessa Station and Campus<br />
The most significant hazardous materials at these station and campus areas are believed to be the impacted<br />
soil and ballast along the former UPRR tracks within the Line Segment, as described in Section 2.4.1.1. Based<br />
on the prior investigations within the former UPRR ROW, there are significant levels of arsenic and lead in<br />
soil and ballast along the former UPRR right-of-way, including the portion that passes through the station<br />
campuses.<br />
Alum Rock Station and Campus<br />
The database search summarized in the Final EIR identified a number of sites with hazardous materials<br />
releases on or near the Alum Rock Station campus. Most of these sites involve petroleum hydrocarbons such<br />
as gasoline or diesel releases from underground fuel storage tanks into soil and/or groundwater. At least three<br />
of these sites are located on the station campus. Although these sites have obtained regulatory agency case<br />
closure, this does not imply that no contamination from these sites will be encountered during construction.<br />
The sites include the following:<br />
• Monarch Truck Center, a truck rental, leasing and repair company at 195 North 30th Street. Monarch<br />
Truck Center released moderate levels of petroleum hydrocarbons to soil and groundwater.<br />
• Mission Concrete Products, at 125 North 30th Street (partially the location of the future transit<br />
oriented development), which released moderate levels of petroleum hydrocarbons to soil and<br />
groundwater.<br />
• Security Contractor Services, at 170 North 28th Street (partially the location of the future transit<br />
oriented development), which released petroleum hydrocarbons to soil.<br />
101248 – July 2008 Page 20
Downtown San Jose Station and Campus<br />
Contaminant Management Plan, SVRT/BART Extension<br />
The database search summarized in the Final EIR identified a number of sites with hazardous materials<br />
releases near the Downtown San Jose Station campus. Most of these sites involve petroleum hydrocarbons<br />
such as gasoline or diesel releases from underground storage tanks into soil and/or groundwater. Among these<br />
sites are 80 South Market Street, 101 San Fernando, 211 West Santa Clara Street, 95 Almaden Avenue, and<br />
70 Almaden Avenue. Such impacts to soil may be encountered during station excavation.<br />
Diridon Station and Campus<br />
The database search summarized in the Final EIR identified a number of sites with hazardous materials<br />
releases near the Diridon Station and Campus. Most of the sites involve petroleum hydrocarbons releases into<br />
soil and/or groundwater. In addition, an encapsulated area beneath the planned North Parking Structure for<br />
the Diridon Station contains soil impacted with polynuclear aromatic hydrocarbons (PAHs) that resulted from<br />
a manufactured gas plant that operated in the late 1800s to early 1900s. Some of the impacted soils were<br />
encapsulated in place and others were relocated from their original positions during construction of the HP<br />
Pavilion. A deed restriction is in place in order to prevent land uses inconsistent with the residual<br />
contaminants beneath the encapsulation.<br />
Santa Clara Station and Campus<br />
The database search summarized in the Final EIR identified a number of sites with hazardous materials<br />
releases on or near the Santa Clara Station and Campus. Most of these sites involve petroleum hydrocarbons<br />
such as gasoline or diesel releases from underground storage tanks into soil and/or groundwater. In addition,<br />
chlorinated solvents including TCE and PCE, which originated from the FMC Corporation facilities, are also<br />
present in soil and groundwater in the vicinity of the station and campus, particularly to the south of Brokaw<br />
Road.<br />
2.4.1.3 Yard and Shops Segment<br />
Investigations were conducted by Earth Tech on behalf of <strong>VTA</strong> in December 2002 and June 2003 to evaluate<br />
soil and ballast conditions at the UPRR Newhall Yard facility, as described in Section 2.3.3. The<br />
investigations primarily focused on the evaluation of potential impacts from metals and petroleum<br />
hydrocarbons, while a limited number of samples were also analyzed for pesticides, PCBs, VOCs, and<br />
SVOCs. The results from the investigations did not identify significant impacts in soils or ballast from<br />
pesticides, PCBs, VOCs, or SVOCs. However, the results from the investigations did identify significant<br />
impacts to soil and ballast by lead and total petroleum hydrocarbons, particularly total petroleum<br />
101248 – July 2008 Page 21
Contaminant Management Plan, SVRT/BART Extension<br />
hydrocarbons within the motor oil range (TPH-MO). Additionally, a large stockpile of soil was identified as<br />
containing relatively high levels of chromium.<br />
The lead and petroleum hydrocarbon results from these investigations can be summarized as follows:<br />
• The shallow soil beneath the ballast (0 to 3 feet bgs) contains sufficient total and extractable lead to<br />
require the material be handled as a California Regulated Waste if disposal is considered.<br />
• One shallow soil sample contained a lead level high enough for the soil to be classified as a Resource<br />
Conservation and Recovery Act (RCRA) hazardous waste.<br />
• Data on deeper soil samples (3 to greater than 20 feet bgs) indicates that lead concentrations are not<br />
sufficient to require classification of the soil as a RCRA hazardous waste or California (non-RCRA)<br />
hazardous waste.<br />
• TPH-MO was found in approximately half of the shallow (up to a depth of 2 feet) soil samples at<br />
concentrations exceeding 100 mg/kg, up to a level of 25,000 mg/kg.<br />
• Significant concentrations of TPH-MO were not detected in soil samples collected from depths of 5<br />
feet or greater.<br />
2.4.2 Impacts to Groundwater<br />
2.4.2.1 Line Segment<br />
Investigations of groundwater quality have been focused where retained cuts, depressed crossroads, and deep<br />
foundation footings are proposed and dewatering may be required. Depth to groundwater along the SVRT<br />
alignment is approximately 15 to 20 feet bgs, which may locally occur under confined or semi-confined<br />
conditions.<br />
Based on the investigations described in Section 2.3.1, groundwater removed during dewatering activities is<br />
not expected to be contaminated with dissolved metals, although total metals levels (including metals in<br />
suspended solids) may be significant in some locations. In some locations, the groundwater is expected to be<br />
contaminated with organic chemicals from off-site sources. These locations include:<br />
• Just north of Montague Expressway, where groundwater is impacted by a chlorinated solvent plume<br />
commonly referred to as the Jones Chemical plume, and groundwater treatment system piping passes<br />
under the UPRR tracks. This plume includes chlorinated solvents at concentrations generally below<br />
200 micrograms per liter (µg/L);<br />
• Just north of Montague Expressway, where groundwater on the adjacent Great Mall (formerly the<br />
Ford Automobile Assembly Plant) property is impacted with residual petroleum hydrocarbons. Note<br />
that the Jones Chemical Plume also extends onto this property; and<br />
• The Kato Road underpass area, where groundwater is impacted by the Scott Creek Business Park<br />
chlorinated solvent and diesel plume, where levels are generally below 100 µg/L.<br />
101248 – July 2008 Page 22
Contaminant Management Plan, SVRT/BART Extension<br />
Relatively low concentrations of other organic chemicals, such as dissolved petroleum hydrocarbons like<br />
gasoline, have also been found in groundwater from a number of investigation locations along the alignment.<br />
Consequently, preparation for groundwater containing relatively low contaminant levels is appropriate along<br />
most if not all of the alignment.<br />
2.4.2.2 Stations Segment<br />
As described in Sections 2.2.1, 2.2.3, and 2.3.4, the design of the actual stations will reside with the segment<br />
that they fall along (such as the Line Segment, Tunnel Segment, or Yard and Shop Segment). However, for<br />
ease of reference, impacts to groundwater are summarized below for each station and/or corresponding<br />
campus. With the exception of the portions of the three stations (future South Calaveras Station,<br />
Montague/Capital Station, and Berryessa Station) that fall within the former UPRR right-of-way under the<br />
Line Segment, there have been no previous environmental investigations performed on behalf of <strong>VTA</strong> at any<br />
of the stations and corresponding campus areas. However, investigations are in the planning stages and are<br />
expected to occur during the final design phase. The information provided below is generally based on<br />
database searches summarized in the Final EIR prepared by <strong>VTA</strong>, or as otherwise indicated.<br />
Montague/Capitol Station and Campus<br />
The database search summarized in the Final EIR identified a number of sites with hazardous material<br />
releases on or near the Montague/Capitol Station campus. Most of these sites involve petroleum hydrocarbons<br />
such as gasoline or diesel releases from underground storage tanks into soil and/or groundwater. In addition,<br />
the following two sites involve chlorinated solvent releases:<br />
• Jones Chemical, at 985 Montague Expressway, which released moderate levels of chlorinated VOCs<br />
to groundwater. These chlorinated VOCs have migrated to the groundwater along the SVRT ROW<br />
just to the north of the Montague/Capitol Station campus, and preliminary indications are that they<br />
may also be encountered during dewatering for station construction.<br />
• North American Transformer, at 1200 Piper Drive, which also released moderate levels of<br />
chlorinated VOCs to groundwater. These chlorinated VOCs have likely mixed with groundwater<br />
containing VOCs from Jones Chemical.<br />
Berryessa Station and Campus<br />
The database search summarized in the Final EIR did not identify any sites with hazardous material releases<br />
on the Berryessa Station campus. However, sites were identified to involve petroleum hydrocarbons such as<br />
gasoline or diesel releases from underground storage tanks into soil and/or groundwater. The nearest of these<br />
sites include 796 North King Road, 697 Lenfest Road, and 681 Lenfest Road.<br />
101248 – July 2008 Page 23
Alum Rock Station and Campus<br />
Contaminant Management Plan, SVRT/BART Extension<br />
Petroleum hydrocarbon release sites, located within the bounds of the Alum Rock Station and campus (as<br />
discussed in Section 2.4.1.2), may have the potential to affect site groundwater quality. Groundwater from<br />
dewatering, possibly generated during foundation construction, may be contaminated. Preliminary<br />
information suggests that dewatering may generate water containing primarily TPH, including constituents<br />
such as benzene.<br />
Downtown San Jose Station and Campus<br />
The database search summarized in the Final EIR identified a number of sites with hazardous material<br />
releases near the Downtown San Jose Station and campus. These sites involve petroleum hydrocarbons such<br />
as gasoline or diesel releases from underground storage tanks into soil and/or groundwater. Among these sites<br />
are 80 South Market Street, 101 San Fernando, 211 West Santa Clara Street, 95 Almaden Avenue, and 70<br />
Almaden Avenue. Preliminary information suggests that dewatering will generate water containing primarily<br />
petroleum hydrocarbons, including constituents such as benzene.<br />
Diridon Station and Campus<br />
Based on documents in the public record prepared by RUST Environment & Infrastructure, Inc. (RUST), a<br />
predecessor company of Earth Tech, the shallow groundwater beneath the San Jose Arena Block 5A parking<br />
lot is contaminated with petroleum hydrocarbons, specifically gasoline, diesel, and their constituents. RUST<br />
performed investigations and installed a remediation system at this location. The source of the contamination<br />
is believed to be former underground fuel storage tanks that were removed from the site. After excavation and<br />
disposal of TPH-impacted soil, a combined air-sparging and vapor extraction system operated for twelve<br />
months, followed by quarterly and semi-annual groundwater monitoring. Groundwater quality data from 1998<br />
showed that significant contaminant levels remained in the shallow groundwater, with benzene levels up to<br />
13,000 µg/L, methyl tertiary-butyl ether (MTBE) levels up to 860 µg/L, and TPH-G levels up to 76,000 µg/L.<br />
Request for site closure under a deed restriction was made by the City of San Jose in March 2002.<br />
Santa Clara Station and Campus<br />
The database search summarized in the Final EIR identified sites with hazardous material releases on or near<br />
the Santa Clara Station and Campus. Most of these sites involve petroleum hydrocarbons such as gasoline or<br />
diesel releases from underground storage tanks into soil and/or groundwater. In addition, chlorinated solvents<br />
including TCE and PCE, which originated from the FMC Corporation facilities, are also present in soil and<br />
groundwater in the vicinity of the station and campus, particularly to the south of Brokaw Road. A<br />
101248 – July 2008 Page 24
Contaminant Management Plan, SVRT/BART Extension<br />
groundwater extraction and treatment system, located at 328 Brokaw Road, treats groundwater extracted from<br />
both the former 333 and 328 Brokaw Road FMC sites. Note that the 333 Brokaw Road site is now occupied<br />
by Fedex Corporation. Groundwater monitoring reports for the former Brokaw Road FMC sites are currently<br />
submitted to the RWQCB on a semiannual basis.<br />
2.4.2.3 Yard and Shops Segment<br />
Investigations were conducted by Earth Tech on behalf of <strong>VTA</strong> in December 2002 and July 2003 to evaluate<br />
potential impacts to groundwater at the UPRR Newhall Yard facility, as described in Section 2.3.3. Limited<br />
(only six) grab groundwater samples were collected and analyzed for metals and organic chemicals. The<br />
investigation results indicated the following for the groundwater:<br />
• Dissolved metals (antimony and selenium) were detected above their respective California primary<br />
maximum contaminant levels (MCLs).<br />
• Dissolved lead was not detected above method reporting limits.<br />
• Total concentrations (including contributions from sediments) of several metals, including antimony,<br />
chromium, nickel, selenium, and thallium, were detected in site groundwater, emphasizing the<br />
importance of thorough removal of suspended solids prior to any dewatering discharge.<br />
• Chlorinated solvents, such as 1,2-dichloroethene (1,2-DCE) and vinyl chloride, were found in two<br />
grab groundwater samples and exceeded their California primary MCLs. These chlorinated solvents<br />
appear to represent residual groundwater contamination from a solvent plume that originated at the<br />
adjacent former FMC Corporation site.<br />
• Petroleum hydrocarbons were not detected in any of the six grab groundwater samples. However,<br />
sufficient groundwater samples were not obtained within the 420 Brokaw Road portion of the UPRR<br />
Newhall Yard to perform diesel and motor oil range analyses on groundwater. A sheen of petroleum<br />
hydrocarbons was observed on surface water from a rainfall event within this area.<br />
2.4.3 Impacts to Building <strong>Materials</strong><br />
Several buildings and structures reside at the planned locations of the station campus areas, maintenance yard,<br />
and northernmost area of the Line Segment, where the tracks are planned to be shifted from the existing<br />
SVRT ROW to the east. Since there have been no previous hazardous materials surveys for these buildings or<br />
structures performed on behalf of <strong>VTA</strong>, appropriate building materials characterization must be conducted<br />
prior to demolition, as described in Section 6. During demolition of buildings, potential hazardous and<br />
contaminated building materials encountered may include asbestos-containing materials, lead-based paints,<br />
PCB-containing light ballasts, mercury vapor lamps, and/or wood, concrete, or sheetrock contaminated from<br />
previous chemical use, storage, and/or handling. Additionally, chemicals from prior use, such as pesticides,<br />
may be present during demolition of buildings.<br />
101248 – July 2008 Page 25
Contaminant Management Plan, SVRT/BART Extension<br />
3.0 RISK-BASED EVALUATION OF CONTAMINANT LEVELS IN SOIL/BALLAST<br />
This section presents an evaluation of the risks associated with exposure to site contamination during and<br />
after construction of the SVRT project. The evaluation includes both the calculation of human health riskbased<br />
levels and an assessment of ecological risk to determine appropriate soil and ballast management<br />
procedures.<br />
3.1 HUMAN HEALTH RISK-BASED LEVELS<br />
The calculation of acceptable human health risk-based levels for the various exposure scenarios is presented<br />
in <strong>Appendix</strong> B. The human health risk-based levels calculated in <strong>Appendix</strong> B are the Site-Specific Risk<br />
Assessment (SSRA) results used in Section 4.2 to help determine criteria for appropriate material reuse. The<br />
calculation of human health risk-based levels generally follows the guidance in Risk Assessment Guidance for<br />
Superfund, Volume 1, Part A (U.S. EPA, 1989).<br />
3.2 ASSESSMENT OF ECOLOGICAL RISK<br />
A screening level assessment of ecological risk for the SVRT project is presented in <strong>Appendix</strong> C. The<br />
screening level ecological risk assessment (ERA) generally follows the guidance in the Ecological Risk<br />
Assessment Guidance for Superfund: Process for Designing and Conducting Ecological Risk Assessment -<br />
Interim Final (U.S. EPA, 1997). The screening ERA integrates the detailed site-specific ecological evaluation<br />
results presented in the Final EIR (<strong>VTA</strong>, 2004), including the selection of the identified special status species<br />
(rare, threatened or endangered species as listed by state or federal agencies) potentially present within the<br />
project area as the key ecological receptors.<br />
The screening ERA presented in <strong>Appendix</strong> C concludes that additional measures to protect potential<br />
ecological receptors are not needed in most areas covered by the project Migration Potential Zones (MPZ).<br />
For surface water protection, MPZs are within 50 feet of surface water features (Section 4.2.1). Based on the<br />
relatively flat land surface in these areas, this distance will provide a reasonable buffer between ecological<br />
receptors and significant contaminant exposure.<br />
101248 – July 2008 Page 26
4.0 SOIL/BALLAST MITIGATION MEASURES<br />
Contaminant Management Plan, SVRT/BART Extension<br />
A wide variety of protective measures will be employed for both soil and railroad ballast encountered during<br />
project construction phase. These will include environmental characterization of the material, constraints on<br />
material transportation and stockpiling, restriction of reuse of the material to defined specific reuse scenarios,<br />
and air monitoring requirements. These mitigation measures are described further below.<br />
4.1 SOIL/BALLAST CHARACTERIZATION<br />
Soil and ballast that will be excavated or disturbed during project construction phase will be characterized<br />
through sampling, chemical analysis, and statistical analysis of the resulting data. The characterization process<br />
is detailed in the following sections.<br />
4.1.1 Sampling Strategy<br />
Soil and ballast that will be excavated or disturbed during the project construction phase will undergo<br />
preliminary characterization (sampling and chemical analysis) during the project design phase. In addition,<br />
there will be further soil and ballast characterization during the project construction phase. Reasons for<br />
additional characterization during project construction phase could include waste characterization, or the<br />
discovery and characterization of a previously unknown hot spot or unknown impact. In certain<br />
circumstances, characterization of potential hot spots may be included in project design and/or construction<br />
phases. All field characterization work will be performed in accordance with appropriate health and safety<br />
standards, including Title 29 Code of Federal Regulations (CFR) 1910.120, <strong>Hazardous</strong> Waste Operations and<br />
Emergency Response. The sampling strategy is detailed in the following sections.<br />
4.1.1.1 Preliminary Reconnaissance Characterization<br />
Each segment-specific design team will perform preliminary characterization of that segment. These activities<br />
will be conducted in the preliminary or final design phases based on availability of site access agreements and<br />
other project requirements. Either of two general approaches to preliminary reconnaissance characterization<br />
will be used, depending on the physical situation:<br />
• in-situ reconnaissance characterization of soil/ballast by sampling at a minimum frequency of once<br />
every 1,000 feet along the SVRT project rail alignment within the area of the proposed construction.<br />
Sampling will occur at depths within specific stratigraphic intervals such that representative samples<br />
are collected throughout the construction depth interval; or<br />
• in-situ reconnaissance characterization of soil by sampling at a minimum frequency of once every<br />
two acres for areas (such as at stations) within the project area but not along the rail alignment.<br />
101248 – July 2008 Page 27
4.1.1.2 Hot Spot Characterization<br />
Contaminant Management Plan, SVRT/BART Extension<br />
The preliminary reconnaissance characterization may identify certain samples with unexpectedly high<br />
contaminant concentrations. The unexpectedly high concentration samples may indicate an area represented<br />
by either a single sample or a relatively small number of samples. When these concentrations threaten to<br />
adversely affect the final design and/or construction, these results will be considered a potential indicator of a<br />
“hot spot”. In such circumstances, additional sampling and analysis will be performed to further characterize<br />
the hot spot.<br />
The approach to additional sampling and analysis will be dependent on the specific concentrations and<br />
relative locations of the unexpectedly high concentration samples. “Step-out” sampling will continue until the<br />
extent is defined to the limits of proposed construction. Hot spot characterization may be performed during<br />
either the final engineering design or the construction phases of the project.<br />
Once the vertical and horizontal extent of the hot spot is defined, this material will be removed during the<br />
construction phase. Hot spot material will be managed in accordance with the guidance provided herein,<br />
though handled separately from the surrounding excavated soils or ballast.<br />
4.1.1.3 Discovery of Unknown Impact<br />
Care will be taken during construction activities to note any stained, discolored, or odorous soils. If such soils<br />
are encountered, work will be stopped and the environmental engineer or geologist will be consulted. In the<br />
case of discolored soils, if the engineer or geologist decides that there is significant cause, the soil will be<br />
sampled for TPH-d (or any other suspected contaminant). In the case of strong odors or visual indications, the<br />
soil will be sampled for TPH-g, TPH-d, volatile organic compounds (VOCs), and/or SVOCs. No further work<br />
will be conducted with the impacted soil until analytical results have been received and reviewed, and either<br />
the soil has been found not to contain hazardous substances or engineering controls have been implemented to<br />
protect worker health and safety. During characterization, site control measures will be implemented to<br />
minimize exposure to potential hazardous substances.<br />
4.1.1.4 Waste Disposal Characterization<br />
Soil and ballast that contain chemical constituents at levels that are above the corresponding reuse<br />
concentrations (see Section 4.2) will be properly disposed off-site. Other material may also be disposed offsite<br />
at <strong>VTA</strong>’s discretion, such as soil that is not appropriate for reuse due to geotechnical or other<br />
characteristics, or excess material. As part of this process, all material to be disposed off-site will be<br />
characterized for final disposition while still on-site.<br />
101248 – July 2008 Page 28
Contaminant Management Plan, SVRT/BART Extension<br />
Waste disposal sampling may be performed in one of two ways, depending on the disposal facility<br />
requirements:<br />
• in-situ reconnaissance testing of soil/ballast by sampling within the area of the proposed construction<br />
area at the minimum frequency required by the disposal facility. Sampling will occur at depths within<br />
specific stratigraphic intervals such that representative samples are collected throughout the<br />
construction depth interval; or<br />
• collection of four-point composite samples from excavated and stockpiled soil/ballast. Samples will<br />
be collected at the minimum frequency required by the disposal facility, which is expected to be one<br />
four-point composite sample for every 1,000 cubic yards (cy) of stockpiled material.<br />
Waste disposal characterization will include additional chemical analyses, with the specific analyses and<br />
frequencies dependent on the requirements of the off-site disposal facilities under consideration. Waste<br />
disposal characterization will not be completed during design because of limitations by disposal facilities on<br />
the time period data is representative of the waste. Material will be characterized as waste in accordance with<br />
applicable sections of 40 CFR and Title 22 California Code of Regulations (CCR).<br />
4.1.2 Chemical Analysis Methods<br />
Soil/ballast samples will be submitted to a California state-certified analytical laboratory for analysis for<br />
selected analytes. The specific analytes for each sample will depend on the location of the sample and the<br />
previously-identified use history of the location, or according to requirements of the off-site disposal facility,<br />
if characterization is being done for waste disposal. Separate project segments may have substantially<br />
different target analytes, because of the substantial differences in each segment as discussed in Section 2. As a<br />
result, each segment can be divided into discrete sections, herein termed “data populations” and further<br />
described in Section 4.1.3.1. However, for consistency, each data population will have at least one chemical<br />
analysis performed for each of the following:<br />
• California Assessment Manual (CAM) 17 metals (including lead and arsenic) using U.S. EPA<br />
SW-846 Test Method 6000/7000;<br />
• Volatile organic compounds (VOCs) using U.S. EPA SW-846 Test Method 8260B;<br />
• Semi-volatile organic compounds (SVOCs) including polynuclear aromatic hydrocarbons (PAHs)<br />
using U.S. EPA SW-846 Test Method 8270C;<br />
• Organochlorine pesticides and PCBs using U.S. EPA SW-846 Test Method 8081/8082;<br />
• Total petroleum hydrocarbons as gasoline with distinction (if VOCs are not analyzed separately) for<br />
gasoline constituents benzene, toluene, ethylbenzene, xylenes and methyl t-butyl ether<br />
(TPH-g/BTEX/MTBE) using U.S. EPA SW-846 Test Method 8015M/8020; and<br />
101248 – July 2008 Page 29
Contaminant Management Plan, SVRT/BART Extension<br />
• Total petroleum hydrocarbons as diesel and/or motor oil (TPH-d/TPH-mo) using U.S. EPA SW-846<br />
Test Method 8015M.<br />
4.1.3 Analysis of Data<br />
The data generated during the characterization efforts described above will undergo statistical analysis to<br />
determine its representative contaminant concentrations. First, available data from all prior characterization<br />
efforts will be divided into discrete data populations based on the location and depth of the sample data. Then,<br />
a detailed evaluation of data from each data population will be conducted to determine representative<br />
exposure point concentrations (EPCs) for each contaminant. For chemicals where there are sufficient data (at<br />
least 10 analytical results for locations within a data population), this evaluation will include statistical<br />
analysis to determine the 95 percent upper confidence limits (UCL) of the data. For chemicals with less than<br />
10 results in a data population, the highest analytical result within the data population will be designated the<br />
EPC for that chemical and data population.<br />
4.1.3.1 Data Populations<br />
Each discrete data population will represent a specific project area, different than other areas of the project<br />
alignment due to its location, depth, prior land usage, and/or EPC for the data population. Given the amount<br />
of information available, some of the data populations have been divided into sub-populations which will be<br />
evaluated separately. A preliminary listing of the different data populations, including sub-populations, is<br />
presented in Table 1.<br />
Note that the designers for specific project segments may further subdivide these data populations, depending<br />
on the results of characterization.<br />
4.1.3.2 Upper Confidence Limit Calculations<br />
The standard bootstrap method as performed by the U.S. EPA program ProUCL will be used to calculate 95<br />
percent UCLs where chemical data populations are sufficient. For chemicals with less than 10 results in a data<br />
population, the highest analytical result within the data population will be designated the EPC for that<br />
chemical and data population.<br />
A bootstrap method uses computer-intensive Monte Carlo resampling techniques to resample a population<br />
data set at least a thousand times to form new data sets (called bootstrap samples), thereby arriving at an<br />
estimate of the mean for each resampling. The Upper confidence limit (UCL) of the mean is calculated from<br />
the standard errors of the bootstrap samples. A major advantage of the bootstrap UCL calculation method is<br />
101248 – July 2008 Page 30
Contaminant Management Plan, SVRT/BART Extension<br />
that a specific population distribution function does not have to be assumed, so errors associated with an<br />
incorrect assumption regarding the population distribution function are avoided.<br />
Population<br />
Designation<br />
Table 1 - Discrete Environmental Data Populations<br />
Description of Data Population<br />
SVRT Stations Bounding<br />
the Population<br />
1 Line Segment - Top 4 Feet, Within 12 Feet of UPRR Track Centerline<br />
1A Subpopulation 1A 45+00 148+00<br />
1B Subpopulation 1B 148+00 253+55<br />
1C Subpopulation 1C 253+55 270+00<br />
1D Subpopulation 1D 270+00 288+00<br />
1E Subpopulation 1E 288+00 340+00<br />
1F Subpopulation 1F 340+00 356+00<br />
1G Subpopulation 1G 356+00 431+00<br />
1H Subpopulation 1H 431+00 447+00<br />
1I Subpopulation 1I 447+00 562+00<br />
2 Line Segment - Top 4 Feet, 12 Feet or More from UPRR Track Centerline<br />
2A Subpopulation 2A 45+00 168+80<br />
2B Subpopulation 2B 168+80 418+00<br />
2C Subpopulation 2C 418+00 562+00<br />
3 Kato Road Underpass<br />
3A More Than 4 Feet bgs, Within ROW 166+50 169+00<br />
3B All Depths, The Perpendicular Excavation Outside ROW 166+50 169+00<br />
4 Dixon Landing Underpass<br />
4A More Than 4 Feet bgs, Within ROW 191+00 192+50<br />
4B All Depths, The Perpendicular Excavation Outside ROW 191+00 192+50<br />
5 Berryessa Creek Culvert<br />
5A More Than 4 Feet bgs, Within ROW 245+00 247+50<br />
5B All Depths, The Perpendicular Excavation Outside ROW 245+00 247+50<br />
6 Retained Cut for Montague and Trade Zone<br />
6A 4' to 12' bgs, Within ROW 358+00 414+50<br />
6B More than 12 Feet bgs, Within ROW 358+00 414+50<br />
7 Retained Cut for Hostetter and Lundy, 4' to 35' bgs, Within ROW 448+00 499+00<br />
8 Retained Cut at End of Line Segment, 4' to 25' bgs, within ROW 559+00 562+00<br />
9 Relocation of UPRR Main Rail Line<br />
10 Montague/Capitol Station Parking/Support Areas<br />
11 Berryessa Station Parking/Support Areas<br />
12 Alum Rock Station Cut and Cover Area<br />
13 Alum Rock Station Parking Structure Area<br />
14 Downtown San Jose Station Cut and Cover Area<br />
15 Diridon/Arena Station Cut and Cover Area<br />
16 Diridon/Arena Station North ("Arena") Parking Area<br />
17 Santa Clara Station Parking/Support Areas<br />
18 Maintenance Facility - City of San Jose Section<br />
19 Maintenance Facility - City of Santa Clara Section<br />
20 Future Calaveras Station Parking/Support Areas<br />
101248 – July 2008 Page 31
Contaminant Management Plan, SVRT/BART Extension<br />
The Lognormal Distribution in Environmental Applications (U.S. EPA Office of Research and Development<br />
and U.S. EPA Office of Solid Waste and Emergency Response, EPA/600/R-97/006, December 1997)<br />
recommends that the bootstrap method or one of the other nonparametric methods be used to calculate the<br />
UCL if there is evidence of a mixture of two or more sub-populations or outlier data points are suspected.<br />
Such situations are expected to be encountered when statistically analyzing the data populations for the SVRT<br />
project, given the sub-populations of contaminated and uncontaminated material. In addition, the inaccurate<br />
estimates of the UCL that can result from small data population from small data population sizes (under 30<br />
samples) and moderately skewed distributions can be minimized by using a bootstrap method.<br />
The Draft Risk Assessment Guidance for Superfund Volume 3 Part A – Process for Conducting Probabilistic<br />
Risk Assessment (U.S. EPA Office of Solid Waste and Emergency Response, EPA 000-0-99-000, December<br />
1999) notes that “there are three main advantages of using bootstrap techniques to characterize uncertainty.<br />
These advantages are as follows:<br />
1. The methodology can estimate the standard error of a statistic for which an equation of standard error<br />
is either extremely complex or non-existent;<br />
2. The methodology can estimate the standard error from the sample set itself without fitting it to a<br />
parametric distribution (in other words, the methods do no relay on the sample set or the underlying<br />
data population conforming to any particular distribution – thus they are referred to as non-parametric<br />
methods); and<br />
3. The methods are relatively easy to implement on a computer.<br />
In Use of the Bootstrap Method in Calculating the Concentration Term for Estimating Risks at Contaminated<br />
Sites (Technical Memorandum 01-004, January 2, 2003), the Alaska Department of Environmental<br />
Conservation notes that “bootstrap methods have been shown to perform substantially better, sometimes<br />
orders of magnitude better, in estimating the UCL of the mean from positively skewed data sets than the H<br />
statistic method” which is typically used for lognormal data.<br />
Statisticians have developed a number of bootstrap methods to calculate UCLs. The standard bootstrap<br />
approach is the most common and is the bootstrap method proposed herein. For instance, the standard<br />
bootstrap approach is typically used to calculate the 95 percent UCL of lead levels under the Caltrans variance<br />
covering aerially deposited lead.<br />
The program ProUCL Version 3.0 (U.S. EPA, Technical Support Center for Monitoring and Site<br />
Characterization, April 2004) includes standard bootstrap approach among its many UCL calculation tools.<br />
101248 – July 2008 Page 32
Contaminant Management Plan, SVRT/BART Extension<br />
The default value of the number of bootstrap samples created by bootstrap runs is 2,000. <strong>VTA</strong> will use this<br />
default value.<br />
For the purposes of statistical analysis and UCL calculation, additional hot spot characterization results (see<br />
Section 4.1.1.2) will not be included in the data population in which a potential hot spot is located. This is<br />
because the inclusion of this additional analytical data from a potential hot spot is equivalent to including a<br />
non-representative subpopulation which will skew the results of the overall data population. However, if the<br />
step out samples do not indicate a distinct second data population, the original sample will be included in the<br />
decision-making process.<br />
4.1.3.3 Exposure Point Concentrations<br />
According to Supplemental Guidance to RAGS: Calculating the Concentration Term (U.S. EPA Office of<br />
Solid Waste and Emergency Response, Publication 9285.7-081, May 1992), if the 95 percent UCL exceeds<br />
the maximum detected concentration, the maximum detected value should be used as the EPC. Consequently,<br />
the EPC for each data population used by <strong>VTA</strong> will be one of the following values:<br />
• the 95 percent UCL of the mean, as calculated by the standard bootstrap method;<br />
• the maximum detected concentration when the calculated 95 percent UCL is greater than the<br />
maximum detected concentration; or<br />
• the maximum detected concentration when the 95 percent UCL cannot be calculated because the data<br />
population contains less than 10 data points.<br />
4.2 SOIL/BALLAST REUSE<br />
After the soil and ballast is adequately characterized for design purposes, the segment-specific designer will<br />
classify soil for potential reuse during construction. This section includes restrictive guidance on the reuse of<br />
soil and ballast, as described below.<br />
4.2.1 Migration Potential Zones<br />
A Migration Potential Zone (MPZ) is defined within the project boundary as an area within 50 feet of creeks,<br />
surface water or other aquatic habitat, or within 5 feet of groundwater. Potential uses for soil and ballast are<br />
severely limited within a MPZ, as described below.<br />
4.2.2 Reuse Scenarios<br />
The SVRT project will use the following five soil and railroad ballast reuse scenarios. These five reuse<br />
scenarios are listed below, in the order of lowest to highest acceptable reuse concentrations:<br />
101248 – July 2008 Page 33
Contaminant Management Plan, SVRT/BART Extension<br />
• Unrestricted Off-site Reuse, in which soil and ballast excavated from the project can be reused in any<br />
off-site situation without restriction, including residential uses, or near a stream or shallow<br />
groundwater.<br />
• Unrestricted On-site Reuse, in which soil and ballast excavated from the project can be reused in any<br />
on-site area. This includes areas within a MPZ.<br />
• Stations and Facilities, in which soil and ballast excavated from the project can be reused in areas<br />
where there is anticipated to be relatively frequent potential exposure, like stations and maintenance<br />
facilities, but not within a MPZ.<br />
• Right-of-Way, in which soil and ballast excavated from the project can be reused in areas where there<br />
is anticipated to be relative infrequent potential exposure, like along the BART tracks and right-ofway,<br />
but not within a MPZ or areas which are part of a riparian fringe habitat.<br />
• Encapsulation, in which soil and ballast excavated from the project can be reused under barriers or<br />
other structures (and covered on all exposed sides by clean material). Encapsulations will not be<br />
placed within a MPZ or areas which are part of a riparian fringe habitat.<br />
Soil and ballast that contains chemical constituents at levels greater than the acceptable reuse concentrations<br />
for any of these five reuse scenarios will be disposed of off-site at an appropriate disposal facility in<br />
accordance with Section 4.4.<br />
4.2.3 Reuse Scenario Selection Process<br />
This section describes the process of classifying soil and ballast into one of the reuse scenarios listed in<br />
Section 4.2.2. In order to be eligible for a reuse scenario, a data population (Section 4.1.3.1) will have to meet<br />
the most restrictive of the reuse criteria for that scenario, as listed in subsequent sections. The reuse criteria<br />
are a combination of two types of values: 1) the site-specific risk assessment (SSRA) values for that chemical<br />
and exposure scenario (from Section 3), and 2) the screening values from existing regulatory agency<br />
guidance. For each reuse scenario, both SSRAs and regulatory agency screening values are developed<br />
specifically for that chemical and exposure scenario.<br />
In order to determine the reuse scenario in which a data population should be classified, the designer for each<br />
project segment will compare the EPCs (either 95 percent UCLs or maximum values, as described in Section<br />
4.1.3.3) to the SSRAs values and the screening values derived herein. Whichever is the least restrictive reuse<br />
scenario for which the data population satisfies all the requirements will be the classification received by that<br />
data population.<br />
4.2.4 Screening Values<br />
Screening values were obtained from a variety of sources, particularly existing regulatory agency screening<br />
values. Depending on the various exposure scenarios, separate screening values were selected for different<br />
101248 – July 2008 Page 34
Contaminant Management Plan, SVRT/BART Extension<br />
reuse scenarios in order to protect potential human and ecological receptors. The sources of screening values<br />
were as follows:<br />
• Site-Specific Risk Assessment (SSRA) results, derived as described in Section 3.<br />
• RWQCB's Environmental Screening Levels (ESLs) (February 2005) for soil less than 3 meters below<br />
ground surface and ground water is a current or potential source of drinking water. Depending on the<br />
reuse scenario, values for either Residential or Commercial/Industrial land use scenarios were used.<br />
When available, values for both human health and groundwater protection (soil leaching) were used.<br />
• US EPA, Region 9, Preliminary Remediation Goals (PRGs) (October 2004) for Residential Soil and<br />
Industrial Soil.<br />
• Ten times the Soluble Threshold Limit Concentration (STLC), which would indicate that the soil<br />
might be characterized as hazardous waste, per 22 CCR Section 66261.<br />
• RWQCB’s Staff Report “Ambient Concentrations of Toxic Chemicals in San Francisco Bay<br />
Sediments” (May 1998) listings of Effects Range Low (ER-L) values, in order to protect ecological<br />
receptors.<br />
• National Oceanic and Atmospheric Administration (NOAA), Screening Quick Reference Table<br />
(SQuiRT) Sediment Threshold Effects Levels (TELs) (using more conservative of marine or<br />
freshwater). If unavailable, then the lowest of ARCs (Assessment and Remediation of Contaminated<br />
Sediments Program) or Apparent Effects Threshold (AET) levels are used in order to protect<br />
potential ecological receptors.<br />
If background is higher than an appropriate screening value, then the background value is used for the<br />
ultimate reuse criteria. Background concentrations of arsenic in the Bay Area are known to be above most<br />
health-based risk values; however, a background arsenic value has not been definitively determined for the<br />
South San Francisco Bay Area. For the purposes of this CMP, an interim background value for arsenic of 5.5<br />
mg/kg is used (Scott, 1991).<br />
Details regarding the specific screening values used for each reuse scenario are presented below. The resultant<br />
screening values for each chemical and exposure scenario have been consolidated into Table 2.<br />
4.2.4.1 Unrestricted Off-Site Reuse<br />
Under the Unrestricted Off-Site Reuse Scenario, material must meet acceptable standards for “clean soil,”<br />
which could be used as import fill at any off-site destination. It has been assumed that the soil will not be used<br />
at off-site aquatic areas and that soil intended for such use would be subject to additional screening by the end<br />
user.<br />
101248 – July 2008 Page 35
Chemical of Concern<br />
Contaminant Management Plan, SVRT/BART Extension<br />
Table 2 - Site Specific Soil/Ballast Reuse and Stockpile Criteria<br />
The Unrestricted Off-Site Reuse Scenario is modeled by a residential scenario. Unrestricted Off-Site Reuse<br />
screening values are either background levels or the most conservative of the following:<br />
• SSRA values calculated for the residential exposure scenario, in <strong>Appendix</strong> B;<br />
• RWQCB ESLs for Human Health, Residential land use;<br />
• RWQCB ESLs for Groundwater Protection, Residential land use;<br />
• US EPA Region 9 Residential PRGs;<br />
• Ten times the STLC;<br />
• RWQCB Sediment ER-Ls; and<br />
• NOAA SquiRT values.<br />
Screening Value<br />
for Unrestricted<br />
Off-site Reuse<br />
(mg/kg)<br />
Screening levels for each chemical under the Unrestricted Off-site Reuse Scenario are listed in Table 3 by<br />
source, as well as the selected resulting screening value for each chemical.<br />
4.2.4.2 Unrestricted On-Site Reuse<br />
Screening Value<br />
for Unrestricted<br />
On-site Reuse<br />
(mg/kg)<br />
Screening Value<br />
for Reuse in<br />
Stations and<br />
Facilities (mg/kg)<br />
Screening Value<br />
for Reuse in<br />
Right-of-Way<br />
(mg/kg)<br />
Screening Value<br />
for Reuse in<br />
Encapsulation<br />
(mg/kg)<br />
Use Permitted in MPZ ? Yes Yes No No No<br />
Arsenic 5.5 5.5 5.5 21.8 830<br />
Lead 30.24 30.24 646 262 262<br />
TPH-Gasoline 100 100 100 100 N/A<br />
TPH-Diesel (middle distillates) 100 100 100 100 N/A<br />
TPH-Oil (residual fuels) 500 1,000 1,000 1,000 N/A<br />
DDT 0.00158 0.00158 4.3 4.3 277<br />
DDE 0.00158 0.00158 4.3 4.3 277<br />
Notes:<br />
All concentrations are in mg/kg unless otherwise noted.<br />
Screening values listed here are a summary of the Resulting Screening Values selected in the following tables.<br />
N/A : Not Applicable<br />
Under the Unrestricted On-Site Reuse Scenario, material must meet acceptable standards for “clean soil,”<br />
which could be used as fill on-site, including within the MPZ. The Unrestricted On-Site Reuse Scenario is<br />
modeled by two exposure scenarios, plus additional protection for ecological receptors that might be impacted<br />
101248 – July 2008 Page 36
SSRA for<br />
Residential<br />
Exposure<br />
Scenario<br />
(<strong>Appendix</strong> B)<br />
Resulting<br />
Ecological<br />
Screening<br />
Value<br />
(<strong>Appendix</strong> C)<br />
RWQCB ESL<br />
for Human<br />
Health:<br />
Residential,<br />
Shallow Soil,<br />
Drinking Water<br />
Resource a<br />
RWQCB ESL for<br />
Groundwater<br />
Protection:<br />
Residential, Shallow<br />
Soil, Drinking<br />
Water Resource a<br />
US EPA Region<br />
9 Residential<br />
PRG b<br />
Contaminant Management Plan, SVRT/BART Extension<br />
Ten Times the<br />
Title 22 CCR<br />
STLC<br />
<strong>Hazardous</strong><br />
Waste<br />
Standard<br />
(mg/kg) c *<br />
Title 22 CCR<br />
TTLC<br />
<strong>Hazardous</strong><br />
Waste<br />
Standards<br />
(mg/kg) c<br />
Background<br />
Value **<br />
Resulting<br />
Screening Value<br />
(mg/kg)<br />
Arsenic 0.21 5.9 5.5 N/A 0.39 1<br />
50 500 5.5 d<br />
5.5<br />
Lead 213 30.24 255 N/A 150 2<br />
50 1,000 16.1 d<br />
30.24<br />
TPH-Gasoline N/A 100 500 100 N/A N/A N/A 0.0 100<br />
TPH-Diesel (middle distillates) N/A 100 500 100 N/A N/A N/A 0.0 100<br />
TPH-Oil (residual fuels) N/A 1,000 500 1,000 N/A N/A N/A 0.0 500<br />
DDT 1.63 0.00158 1.7 4.3 1.7 1.0 1.0 0.0 0.00158<br />
DDE 1.63 0.00158 1.7 1,100 1.7 1.0 1.0 0.0 0.00158<br />
Notes:<br />
Chemical of Concern<br />
Arsenic SSRA is derived using the OEHHA oral slope factor and 20% bioavailability<br />
Table 3 - Screening Values for Unrestricted Off-Site Reuse<br />
All concentrations are in mg/kg unless otherwise noted. CCR California Code of Regulations<br />
1<br />
Arsenic PRG is the cancer endpoint. DDT Dichlorodiphenyltrichloroethane<br />
2<br />
Lead "CAL-Modified PRG", non-standard method applied. DDE Dichlorodiphenyldichloroethene<br />
ESL Environmental Screening Level<br />
ER-L Effects Range - Low<br />
a<br />
San Francisco Bay RWQCB, 2003. July 2003 Update to Environmental Screening Levels<br />
mg/kg Milligrams per Kilogram<br />
Technical Document . July 21.<br />
N/A Not Applicable<br />
b<br />
EPA, 2002. EPA Region 9 PRGs Table . October 1. Edited February 2003. PRG Preliminary Remediation Goal<br />
c<br />
California Code of Regulations, Title 22, Section 66261. RWQCB Regional Water Quality Control Board<br />
d<br />
Christina M. Scott, 1991. Background Metal Concentrations in Soils in Northern Santa Clara<br />
SSRA Site-Specific Risk Assessment<br />
County, California . December.<br />
STLC Soluble Threshold Limit Concentration<br />
TPH Total Petroleum Hydrocarbons<br />
TTLC Total Threshold Limit Concentration<br />
* : Includes the ten-fold dilution factor during STLC tests.<br />
** : A screening value below the background value will cause the Resulting Screening Value to<br />
be set to background.<br />
US EPA United States Environmental Protection Agency<br />
101248 – July 2008 Page 37
Contaminant Management Plan, SVRT/BART Extension<br />
by releases to the MPZ. The two exposure scenarios are a standard industrial exposure scenario to model onsite<br />
workers and passengers, and a residential scenario to model off-site residents’ exposure to dust disturbed<br />
by trains passing over the reused material. SSRA values for both of these exposure scenarios will be included<br />
in the screening value selection.<br />
Unrestricted On-Site Reuse screening values are either background levels or the most conservative of the<br />
following:<br />
• SSRA values calculated for the standard industrial exposure scenario;<br />
• SSRA values calculated for off-site residents’ exposure to dust disturbed by trains passing over the<br />
reused material;<br />
• RWQCB ESLs for Human Health, Commercial/Industrial land use;<br />
• RWQCB ESLs for Groundwater Protection, Commercial/Industrial land use;<br />
• US EPA Region 9 Industrial PRGs;<br />
• Ten times the STLC;<br />
• RWQCB Sediment ER-Ls; and<br />
• NOAA SquiRT values.<br />
Screening levels for each chemical under the Unrestricted On-site Reuse Scenario are listed in Table 4 by<br />
source, as well as the selected resulting screening value for each chemical.<br />
4.2.4.3 Stations and Facilities<br />
Under the Stations and Facilities Scenario, material must meet acceptable standards for reuse in relatively<br />
high exposure frequency areas, such as stations and maintenance facilities, but not within the MPZ. The<br />
Stations and Facilities Scenario is modeled by two exposure scenarios, a standard industrial exposure scenario<br />
to model on-site workers and passengers, and a residential scenario to model off-site residents’ exposure to<br />
dust disturbed by trains passing over the reused material. SSRA values for both of these exposure scenarios<br />
will be include in the screening value selection.<br />
Stations and Facilities Scenario screening values are either background levels or the most conservative of the<br />
following:<br />
• SSRA values calculated for the standard industrial exposure scenario;<br />
• SSRA values calculated for off-site residents’ exposure to dust disturbed by trains passing over the<br />
reused material;<br />
101248 – July 2008 Page 38
Chemical of<br />
Concern<br />
SSRAs for<br />
Standard<br />
Industrial<br />
Exposure<br />
Scenario<br />
(<strong>Appendix</strong> B)<br />
SSRAs for<br />
Off-Site<br />
Residents'<br />
Exposure to<br />
Dust<br />
(<strong>Appendix</strong> B)<br />
Resulting<br />
Ecological<br />
Screening<br />
Value<br />
(<strong>Appendix</strong> C)<br />
RWQCB ESLs for<br />
Human Health:<br />
Commercial/Industrial,<br />
Shallow Soil, and<br />
Drinking Water<br />
Resource a<br />
RWQCB ESLs for<br />
Groundwater<br />
Protection:<br />
Commercial/Indus-trial,<br />
Shallow Soil, and<br />
Drinking Water<br />
Resource a<br />
US EPA<br />
Region 9<br />
Industrial<br />
PRGs b<br />
Contaminant Management Plan, SVRT/BART Extension<br />
Ten Times the<br />
Title 22 CCR<br />
STLC<br />
<strong>Hazardous</strong><br />
Waste Standard<br />
(mg/kg) c *<br />
Title 22 CCR<br />
TTLC<br />
<strong>Hazardous</strong><br />
Waste<br />
Standards<br />
(mg/kg) c<br />
Background<br />
Value **<br />
Resulting<br />
Screening<br />
Value<br />
(mg/kg)<br />
Arsenic 8.7 181 5.9 5.5 N/A 1.6 1<br />
50 500 5.5 d<br />
5.5<br />
Lead 646 100,000 30.24 750 N/A 750 2<br />
50 1,000 16.1 d<br />
30.24<br />
TPH-Gasoline N/A N/A 100 5,800 100 N/A N/A N/A 0.0 100<br />
TPH-Diesel N/A N/A 100 5,800 100 N/A N/A N/A 0.0 100<br />
TPH-Oil N/A N/A 1,000 5,800 1,000 N/A N/A N/A 0.0 1,000<br />
DDT 77.9 5,033 0.00158 7.0 4.3 7.0 1.0 1.0 0.0 0.00158<br />
DDE 77.9 5,033 0.00158 7.0 1,100 7.0 1.0 1.0 0.0 0.00158<br />
Notes:<br />
Arsenic SSRA is derived using the OEHHA oral slope factor and 20% bioavailability<br />
CCR California Code of Regulations<br />
All concentrations are in mg/kg unless otherwise noted. DDT Dichlorodiphenyltrichloroethane<br />
1<br />
Arsenic PRG is the cancer endpoint. DDE Dichlorodiphenyldichloroethene<br />
2<br />
Lead "CAL-Modified PRG", non-standard method applied. ESL Environmental Screening Level<br />
ER-L Effects Range - Low<br />
mg/kg Milligrams per Kilogram<br />
a<br />
San Francisco Bay RWQCB, 2003. July 2003 Update to<br />
N/A Not Applicable<br />
Environmental Screening Levels Technical Document . July 21.<br />
PRG Preliminary Remediation Goal<br />
b<br />
EPA, 2002. EPA Region 9 PRGs Table . October 1. Edited February 2003. RWQCB Regional Water Quality Control Board<br />
c<br />
California Code of Regulations, Title 22, Section 66261. SSRA Site-Specific Risk Assessment<br />
d Christina M. Scott, 1991. Background Metal Concentrations in Soils<br />
in Northern Santa Clara County, California . December.<br />
Table 4 - Screening Values for Unrestricted On-Site Reuse<br />
STLC Soluble Threshold Limit Concentration<br />
TPH Total Petroleum Hydrocarbons<br />
TTLC Total Threshold Limit Concentration<br />
* : Includes the ten-fold dilution factor during STLC tests. US EPA United States Environmental Protection Agency<br />
101248 – July 2008 Page 39
• RWQCB ESLs for Human Health, Commercial/Industrial land use;<br />
Contaminant Management Plan, SVRT/BART Extension<br />
• RWQCB ESLs for Groundwater Protection, Commercial/Industrial land use;<br />
• US EPA Region 9 Industrial PRGs; and<br />
• Ten times the STLC.<br />
Screening levels for each chemical under the Stations and Facilities Scenario are listed in Table 5 by source,<br />
as well as the selected resulting screening value for each chemical.<br />
4.2.4.4 Right-of-Way<br />
Under the Right-of-Way Scenario, material must meet acceptable standards for reuse where relatively low<br />
exposure frequency is anticipated (such as maintenance of rail road right-of-ways), but not within the MPZ or<br />
areas which are part of a riparian fringe habitat. The Right-of-Way Scenario is modeled by two exposure<br />
scenarios, a reduced exposure frequency industrial exposure scenario to model on-site workers and<br />
passengers, and a residential scenario to model off-site residents’ exposure to dust disturbed by trains passing<br />
over the reused material. SSRA values for both of these exposure scenarios will be included in the screening<br />
value selection.<br />
Right-of-Way Scenario screening levels are either background levels or the most conservative of the<br />
following:<br />
• SSRA values calculated for the reduced exposure frequency industrial exposure scenario;<br />
• SSRA values calculated for off-site residents’ exposure to dust disturbed by trains passing over the<br />
reused material;<br />
• RWQCB ESLs for Human Health, Commercial/Industrial land use;<br />
• RWQCB ESLs for Groundwater Protection, Commercial/Industrial land use;<br />
• US EPA Region 9 Industrial PRGs; and<br />
• Ten times the STLC.<br />
Screening levels for each chemical under the Right-of-Way Scenario are listed in Table 6 by source, as well<br />
as the selected resulting screening value.<br />
4.2.4.5 Encapsulation<br />
Under the Encapsulation Scenario, material may be reused on-site under barriers or other structures (and<br />
covered on all exposed sides by at least a 6-inch thickness of clean material), though these will not be placed<br />
within the MPZ or areas which are part of a riparian fringe habitat. The Encapsulation Scenario is modeled by<br />
construction exposure scenario, as post-construction exposures will be negligible due to the construction of<br />
101248 – July 2008 Page 40
the encapsulation.<br />
Contaminant Management Plan, SVRT/BART Extension<br />
101248 – July 2008 Page 41
SSRAs for<br />
SSRAs for Off-<br />
Standard<br />
Site Residents'<br />
Industrial<br />
Exposure to<br />
Exposure<br />
Dust (<strong>Appendix</strong><br />
Scenario<br />
B)<br />
(<strong>Appendix</strong> B)<br />
RWQCB ESLs for Human<br />
Health:<br />
Commercial/Industrial,<br />
Shallow Soil, and Drinking<br />
Water Resource a<br />
RWQCB ESLs for<br />
Groundwater Protection:<br />
Commercial/Industrial,<br />
Shallow Soil, and Drinking<br />
Water Resource a<br />
US EPA<br />
Region 9<br />
Industrial<br />
PRGs b<br />
Contaminant Management Plan, SVRT/BART Extension<br />
Ten Times the<br />
Title 22 CCR<br />
STLC<br />
<strong>Hazardous</strong><br />
Waste Standard<br />
(mg/kg) c *<br />
Title 22 CCR<br />
TTLC<br />
<strong>Hazardous</strong><br />
Waste<br />
Standards<br />
(mg/kg) c<br />
Background<br />
Value **<br />
Arsenic 8.7 181 5.5 N/A 1.6 1<br />
50 500 5.5 d<br />
5.5<br />
Lead 646 100,000 750 N/A 750 2<br />
50 1,000 16.1 d<br />
646<br />
TPH-Gasoline N/A N/A 5,800 100 N/A N/A N/A 0.0 100<br />
TPH-Diesel N/A N/A 5,800 100 N/A N/A N/A 0.0 100<br />
TPH-Oil N/A N/A 5,800 1,000 N/A N/A N/A 0.0 1,000<br />
DDT 77.9 5,033 7.0 4.3 7.0 1.0 1.0 0.0 4.3<br />
DDE 77.9 5,033 7.0 4.3 7.0 1.0 1.0 0.0 4.3<br />
Notes:<br />
Chemical of<br />
Concern<br />
Table 5 - Screening Values for Reuse in Stations and Facilities<br />
Arsenic SSRA is derived using the OEHHA oral slope factor and 20% bioavailability<br />
CCR California Code of Regulations<br />
All concentrations are in mg/kg unless otherwise noted. DDT Dichlorodiphenyltrichloroethane<br />
1<br />
Arsenic PRG is the cancer endpoint. DDE Dichlorodiphenyldichloroethene<br />
2<br />
Lead "CAL-Modified PRG", non-standard method applied. ESL Environmental Screening Level<br />
mg/kg Milligrams per Kilogram<br />
mg/l Milligrams per Liter<br />
a<br />
San Francisco Bay RWQCB, 2003. July 2003 Update to Environmental Screening Levels<br />
N/A Not Applicable<br />
Technical Document . July 21.<br />
PRG Preliminary Remediation Goal<br />
b<br />
EPA, 2002. EPA Region 9 PRGs Table . October 1. Edited February 2003. RWQCB Regional Water Quality Control Board<br />
c<br />
California Code of Regulations, Title 22, Section 66261. SSRA Site-Specific Risk Assessment<br />
d<br />
Christina M. Scott, 1991. Background Metal Concentrations in Soils in Northern Santa<br />
STLC Soluble Threshold Limit Concentration<br />
Clara County, California . December.<br />
TPH Total Petroleum Hydrocarbons<br />
TTLC Total Threshold Limit Concentration<br />
* : Detection of an analyte at greater than this level will result in further testing, not necessarily<br />
rejection for this reuse. Includes the ten-fold dilution factor during STLC tests.<br />
US EPA United States Environmental Protection Agency<br />
101248 – July 2008 Page 42<br />
Resulting<br />
Screening<br />
Value<br />
(mg/kg)
SSRAs for<br />
SSRAs for Off-<br />
Reduced Industrial<br />
Site Residents'<br />
Exposure<br />
Exposure to<br />
Frequency<br />
Dust (<strong>Appendix</strong><br />
Exposure Scenario<br />
B)<br />
(<strong>Appendix</strong> B)<br />
SSRAs for<br />
Construction<br />
Exposure<br />
Scenario<br />
(<strong>Appendix</strong> B)<br />
RWQCB ESLs for<br />
Groundwater Protection:<br />
Commercial/Industrial,<br />
Shallow Soil, and Drinking<br />
Water Resource a<br />
Ten Times the<br />
Title 22 CCR<br />
STLC<br />
<strong>Hazardous</strong><br />
Waste<br />
Standard<br />
(mg/kg) c *<br />
Contaminant Management Plan, SVRT/BART Extension<br />
Title 22 CCR<br />
TTLC<br />
<strong>Hazardous</strong><br />
Waste<br />
Standards<br />
(mg/kg) c<br />
Background<br />
Value **<br />
Resulting<br />
Screening<br />
Value<br />
(mg/kg)<br />
Arsenic 21.8 181 830*** N/A 50 500 5.5 d<br />
21.8<br />
Lead 1615 100,000 262 N/A 50 1,000 16.1 d<br />
262<br />
TPH-Gasoline N/A N/A N/A 100 N/A N/A 0.0 100<br />
TPH-Diesel N/A N/A N/A 100 N/A N/A 0.0 100<br />
TPH-Oil N/A N/A N/A 1,000 N/A N/A 0.0 1,000<br />
DDT 195 5,033 277*** 4.3 1.0 1.0 0.0 4.3<br />
DDE 195 5,033 277*** 4.3 1.0 1.0 0.0 4.3<br />
Notes:<br />
Chemical of<br />
Concern<br />
Arsenic SSRA is derived using the OEHHA oral slope factor and 35% bioavailability<br />
Table 6 - Screening Values for Reuse in Right of Way<br />
All concentrations are in mg/kg unless otherwise noted. CCR California Code of Regulations<br />
1<br />
Arsenic PRG is the cancer endpoint. DDT Dichlorodiphenyltrichloroethane<br />
2<br />
Lead "CAL-Modified PRG", non-standard method applied. DDE Dichlorodiphenyldichloroethene<br />
ESL Environmental Screening Level<br />
mg/kg Milligrams per Kilogram<br />
a<br />
San Francisco Bay RWQCB, 2003. July 2003 Update to Environmental Screening<br />
mg/L Milligrams per Liter<br />
Levels Technical Document . July 21.<br />
N/A Not Applicable<br />
b<br />
EPA, 2002. EPA Region 9 PRGs Table . October 1. Edited February 2003. PRG Preliminary Remediation Goal<br />
c<br />
California Code of Regulations, Title 22, Section 66261. RWQCB Regional Water Quality Control Board<br />
d<br />
Christina M. Scott, 1991. Background Metal Concentrations in Soils in Northern Santa Clara County, California . SSRA Site-Specific Risk Assessment<br />
December.<br />
STLC Soluble Threshold Limit Concentration<br />
TPH Total Petroleum Hydrocarbons<br />
* : Detection of an analyte at greater than this level will result in further testing, not necessarily rejection for this reuse. TTLC Total Threshold Limit Concentration<br />
Includes the ten-fold dilution factor during STLC tests.<br />
US EPA United States Environmental Protection Agency<br />
101248 – July 2008 Page 43
Contaminant Management Plan, SVRT/BART Extension<br />
Encapsulation Scenario screening levels are either background levels or the following:<br />
• SSRAs calculated for the construction exposure scenario.<br />
Screening levels for each chemical under the Encapsulation Scenario are listed in Table 7 by source, as well<br />
as the selected resulting screening value for each chemical.<br />
4.2.5 Reuse Procedures<br />
As noted above, soil and ballast which is classified as acceptable for a less restrictive reuse scenario will be<br />
eligible for reuse in a more restrictive reuse scenario. For instance, soil classified as acceptable for<br />
Unrestricted On-site Reuse will be considered acceptable for reuse in a Stations and Facilities setting. To<br />
facilitate implementation of the reuse procedures, a Soil Management Flow Chart has been provided as<br />
Figure 2.<br />
In addition, reuse of soil will conform to accepted best management practices (BMPs) and will not be used in<br />
such a way that it may present potential ecological or human health risks. These considerations include, but<br />
are not limited to, the following:<br />
• The potential for migration of soil, ballast or their constituent contaminants as the result of storm<br />
water runoff;<br />
• The potential for movement of soil or ballast material off-site, either as airborne dust or by tracking<br />
the material off-site with construction equipment; and<br />
• The potential for migration of contaminants to groundwater or surface waters.<br />
More conservative practices based on BMPs or ecological and human health risk considerations will<br />
supercede the reuse classification criteria summarized in Table 2.<br />
4.2.5.1 Non-Encapsulated Material<br />
This section describes the reuse of soil and ballast material which will not be encapsulated, but will be reused<br />
under the Unrestricted On-Site Reuse, Stations and Facilities, and Right-of-Way scenarios. Procedures for<br />
reuse of these classifications of material are described below.<br />
The reuse process will start with the project designers identifying a situation in which additional material is<br />
needed to construct the SVRT project as designed. The need for additional material might result from<br />
insufficient material or improper material characteristics, such as geotechnical parameters. Needs for<br />
additional material to achieve the design elevations may include uses such as the following:<br />
101248 – July 2008 Page 44
Contaminant Management Plan, SVRT/BART Extension<br />
Table 7 - Screening Values for Reuse in Encapsulation<br />
SSRAs for<br />
Construction<br />
Exposure Scenario<br />
(<strong>Appendix</strong> B)<br />
Twenty Times the 40<br />
CFR TCLP <strong>Hazardous</strong><br />
Waste Standards<br />
Resulting<br />
Screening Value<br />
(mg/kg)<br />
(mg/kg) a Background<br />
Value **<br />
Arsenic 830 ***<br />
*<br />
100 5.5 d<br />
830<br />
Lead 262 100 16.1 d<br />
Chemical of Concern<br />
262<br />
TPH-Gasoline N/A N/A 0.0 N/A<br />
TPH-Diesel (middle distillates) N/A N/A 0.0 N/A<br />
TPH-Oil (residual fuels) N/A N/A 0.0 N/A<br />
DDT 277*** N/A 0.0 277<br />
DDE 277*** N/A 0.0 277<br />
Notes:<br />
All concentrations are in mg/kg unless otherwise noted.<br />
CFR Code of Federal Regulations<br />
DDT Dichlorodiphenyltrichloroethane<br />
DDE Dichlorodiphenyldichloroethene<br />
mg/kg Milligrams per Kilogram<br />
N/A Not Applicable<br />
PCB Polychlorinated Biphenyl<br />
PCE Tetrachloroethylene<br />
SSRA Site-Specific Risk Assessment<br />
TCE Trichloroethylene<br />
TCLP Toxicity Characteristic Leaching Procedure<br />
TPH Total Petroleum Hydrocarbons<br />
a : Based on 40 Code of Federal Regulations, Part 261.<br />
* : Detection of an analyte at greater than this level will result in further testing, not necessarily rejection for this reuse. Includes the<br />
twenty-fold dilution factor during TCLP tests.<br />
** : A screening value below the background value will cause the Resulting Screening Value to be set to background.<br />
*** : Value is for noncancer assessment in accordance with October 1 DTSC comments.<br />
101248 – July 2008 Page 45
Contaminant Management Plan, SVRT/BART Extension<br />
• to raise the track elevations in an area, such as to meet BART grade requirements or to reduce the<br />
risks of flooding;<br />
• to fill a depression between the two parallel sets of BART tracks,<br />
• to construct replacement UPRR tracks;<br />
• to provide retained fill beneath ramps at parking structures;<br />
• to provide retained fill under approaches to an aerial structure, such as near Berryessa Station; and/or<br />
• to serve as landscaping at stations.<br />
A material will be considered for reuse when it has qualities, including reuse classification and geotechnical<br />
parameters, which are appropriate for the considered location and type of reuse. Where possible, material<br />
from elsewhere on the SVRT project site will be reused instead of importing new material.<br />
If a material is selected for reuse, it will be transported to the reuse location in accordance with Section 4.3.<br />
At the reuse location, the material will be unloaded, amended as necessary such as through moisture<br />
conditioning, and placed for reuse. Placement will include air monitoring in accordance with Section 4.6<br />
(unless reuse is unrestricted) and compaction with heavy equipment.<br />
4.2.5.2 Encapsulated Material<br />
Procedures are described below for reuse of appropriately classified soil and ballast material that will be<br />
encapsulated in accordance with the Encapsulation reuse scenario.<br />
Situations in which encapsulated material could be used are almost the same as those listed in Section 4.2.5.1<br />
for non-encapsulated material, except that it will not be used for landscaping. Where a material available for<br />
reuse has qualities, including reuse classification and geotechnical parameters, which are appropriate for<br />
encapsulation at a particular location, it will be considered for encapsulation in that situation. Where possible,<br />
material from elsewhere on the SVRT project site will be encapsulated instead of exporting that material and<br />
importing new material.<br />
If a material is selected for encapsulation, it will be transported to the encapsulation location in accordance<br />
with Section 4.3. At the encapsulation location, the material to be reused will be unloaded and amended as<br />
necessary such as through moisture conditioning. Until it is placed in the encapsulation, the material will be<br />
stockpiled in accordance with Section 4.5. Once placed in the encapsulation, the material will be compacted<br />
with heavy equipment and covered with an impermeable layer. The encapsulation will be design and<br />
constructed so it is covered on all exposed sides by at least a 6-inch thickness of clean material. During the<br />
encapsulation, air in the area will be monitored in accordance with Section 4.6.<br />
101248 – July 2008 Page 47
Contaminant Management Plan, SVRT/BART Extension<br />
As-built drawings will be prepared for each encapsulation to document that the encapsulations are properly<br />
prepared.<br />
4.2.5.3 Material Reuse in an MPZ<br />
One element of the reuse strategy presented in this CMP is additional restrictions on soil reuse within 5 feet or<br />
of the groundwater table or 50 within of surface waters, as described in Section 4.2.1. If, for example,<br />
groundwater is shallower than 5 feet, then that portion of the site is designated a MPZ, and soil is not<br />
permitted to be reused if it contains chemicals of concern (COCs) at concentrations that exceed the<br />
recommended reuse concentration. This concentration will be based on the RWQCB ESLs (see Section 4.2.4)<br />
to protect either groundwater for drinking purposes or surface water to protect aquatic wildlife, as appropriate.<br />
Material reuse will depend on the concentrations of both organic compounds and metals. Whereas the ESLs<br />
for organic compounds are available and applicable, it is important to note that the ESLs for metals differ<br />
from those for organic compounds in that no provision was made to account for the solubility of each metal<br />
and the subsequent reduction in concentration as the metal infiltrates from the soil solution into the<br />
groundwater. To account for these factors, the ESLs for metals must be modified by a site-specific dilution<br />
attenuation factor (DAF). The method used for this modification involves a site-specific and chemicalspecific<br />
soil/water partition coefficient (Kd) and groundwater velocity. Although RWQCB intended on<br />
incorporating DAFs into their ESLs, this could not be done for metals because a Kd cannot be estimated for<br />
metals as it can for organic chemicals, and thus the ESLs for metals lack the DAFs to convert them to sitespecific<br />
values. For this reason, a site-specific DAF will be estimated for the metal reuse values proposed for<br />
this project. Since this is laborious process, this will only be done for the metals and for the necessary<br />
situations as they arise. The methodology is presented in <strong>Appendix</strong> D and includes an example for arsenic<br />
using site-specific data from the Line Segment.<br />
4.3 SOIL/BALLAST TRANSPORTATION<br />
This section describes the on-site and off-site transportation modes. Also, included in this section are<br />
transportation procedures that are designed to minimize potential health, safety, and environmental risks<br />
resulting from the transportation of soil and ballast.<br />
4.3.1 Transportation Modes<br />
Both on-site transportation and off-site transportation may be performed using either trucks or railcars.<br />
Material to be transported by truck will be loaded into end-dump trucks or transfer trailer trucks with a<br />
101248 – July 2008 Page 48
Contaminant Management Plan, SVRT/BART Extension<br />
capacity up to 16 cy (combined). Material to be delivered by rail will be loaded into UPRR railcars with a<br />
100-ton capacity. All loads will be covered and contained on all sides.<br />
4.3.2 On-Site Transportation<br />
Much of the soil and ballast material excavated during SVRT project construction will be stockpiled or reused<br />
on a different area of the project site. Material to be stockpiled will be hauled to one of the designated<br />
stockpile locations listed in Section 4.5.1, while material to be reused will be hauled to the appropriate on-site<br />
reuse locations.<br />
On-site transportation is defined as the shipment of material from one portion of the project site to another,<br />
without crossing the borders of the property owned by <strong>VTA</strong>, or by only crossing a road dividing property<br />
owned by <strong>VTA</strong> and/or temporary construction easements for the project. On-site transportation will be used<br />
exclusively, except under the following conditions:<br />
• The material has been characterized sufficiently for waste classification purposes and determined not<br />
to be a hazardous waste;<br />
• The material is a waste being properly shipped for off-site disposal; and<br />
• The material has been sufficiently characterized for reuse and is being transported under a variance to<br />
a physically continuous portion of the project (which may be divided by a public right-of-way), as<br />
described below.<br />
Consequently, the transportation of excavated material along public streets, highways, or freeways is<br />
prohibited unless the material has been properly characterized.<br />
On-site transportation of material will occur primarily in two main areas where large portions of the project<br />
site are physically continuous and will be under <strong>VTA</strong> ownership; the Tunnel Segment separates these two<br />
areas. To the east of the Tunnel Segment, one area of continuous property includes:<br />
• The Line Segment along the former UPRR alignment, currently owned by <strong>VTA</strong>;<br />
• The Montague/Capitol and Berryessa Station campuses, because the property <strong>VTA</strong> will purchase for<br />
these stations will be physically continuous with the Line Segment; and<br />
• Other adjacent properties which will be purchased by <strong>VTA</strong> in order to widen the ROW or to install<br />
support facilities such as traction power substations.<br />
To the west of the Tunnel Segment, the second area of continuous property includes:<br />
• The Maintenance Facility to be located on part of UPRR’s Newhall Yard, currently owned by <strong>VTA</strong>;<br />
• The rail line ROW connecting to the Maintenance Facility, to be purchased by <strong>VTA</strong>; and<br />
101248 – July 2008 Page 49
Contaminant Management Plan, SVRT/BART Extension<br />
• The Santa Clara Station campus. The property <strong>VTA</strong> will purchase to construct this station will be<br />
physically continuous with the Maintenance Facility.<br />
On-site transportation will involve loading the material into trucks or railcars and covered with plastic, metal<br />
or other solid containment on all sides. Trucks or railcars will be appropriately sized to minimize the number<br />
of loads or trips. When trucks will be used, generally there will be a fleet of trucks making round trips. When<br />
railcars are used, a train of 5 to 9 railcars will travel along existing tracks simultaneously.<br />
For each shipment of impacted material, documentation will include the information included in Section<br />
4.3.7.<br />
Specific hazardous waste transport requirements will be used only when the material would be considered to<br />
be hazardous waste, or potentially as hazardous waste. In these cases, the specific hazardous waste transport<br />
requirements will include submittal of proof of valid hauler registration, the use of appropriate vehicular<br />
placards, and related hazardous waste or hazardous materials transportation requirements detailed in federal,<br />
state or local rules and regulations.<br />
Should off-haul of soil classified as waste be required, the material will be transported in accordance with the<br />
requirements presented in Section 4.3.3.<br />
4.3.3 Off-Site Transportation<br />
Off-site transportation is defined as the shipment of material in a manner which involves crossing the borders<br />
of the property owned by <strong>VTA</strong> and requires travel along a public or private right-of-way. Off-site<br />
transportation will occur when a material is being properly shipped for off-site disposal or under a variance<br />
for consolidation or reuse. In some cases, off-site transportation may also be used to transfer material from<br />
one discontinuous portion of the project area to another, if the material has been characterized sufficiently for<br />
waste classification purposes and determined not to be a hazardous waste.<br />
Whatever the purpose, off-site transportation of waste materials will be conducted in accordance with all<br />
federal, state, and local statutes, regulations, and ordinances, including the following:<br />
• 40 CFR Parts 261 to 265;<br />
• 29 CFR Part 1910.120;<br />
• 49 CFR Parts 100 to 199;<br />
• California Health and Safety Code, Chapter 6.5, Articles 6, 6.5 and 8;<br />
• California Vehicle Code Section 2402.1;<br />
101248 – July 2008 Page 50
• CCR Title 22, Division 4.5, Chapter 12, Article 5;<br />
• CCR Title 22, Division 4.5, Chapter 13, Articles 1-5; and<br />
• CCR Title 8 Section 5192.<br />
Contaminant Management Plan, SVRT/BART Extension<br />
For each shipment of impacted material, documentation will include the information included in Section<br />
4.3.7.<br />
4.3.3.1 Potential Destinations<br />
The destination for material being transported from one portion of the site to another via an off-site route will<br />
be an appropriate stockpile area or reuse area. To comply with federal and state law, hazardous or potentially<br />
hazardous wastes will not be transported from one portion of the site to another via an off-site route, unless<br />
done so under an appropriate variance approved by DTSC or under other special conditions granted by DTSC<br />
for transportation of such material.<br />
Wastes being properly shipped for off-site disposal may have a variety of destinations. Most hazardous wastes<br />
(RCRA hazardous or non-RCRA hazardous), will be shipped via railcar to the RCRA-permitted East Carbon<br />
Development Corporation (ECDC) Solid Waste Disposal Facility in East Carbon City, Utah. Other hazardous<br />
wastes may be shipped via truck to facilities such as the RCRA-permitted Kettleman Hills Facility, owned by<br />
Chemical Waste Management (CWM), in Kettleman City, California. Wastes classified as non-hazardous<br />
wastes may be delivered to facilities such as:<br />
• Altamont Landfill in Livermore (Waste Management);<br />
• Vasco Road Facility in Livermore (Republic Services);<br />
• Forward Landfill in Manteca (Allied Waste); and<br />
• Newby Island Landfill in Milpitas (Allied Waste).<br />
As long as the waste is accepted for disposal by the selected destination facilities and the requirements<br />
described in this CMP are met, the project construction contractors will choose the specific destination<br />
facilities, pending approval of the facility by <strong>VTA</strong>.<br />
4.3.3.2 Transportation Routes<br />
After railcars leave the site, railcar travel routes to the ECDC facility will be determined by rail transport<br />
provider. For the Line Segment portion of the SVRT project, UPRR will be solely responsible for the safe<br />
transport of impacted materials along their railroad tracks to the ECDC facility. For other portions of the<br />
SVRT project, such as Yard and Shops Segment that includes a planned maintenance facility at the former<br />
101248 – July 2008 Page 51
Contaminant Management Plan, SVRT/BART Extension<br />
UPRR Newhall Yard, there may be another rail transport provider, depending on selection by <strong>VTA</strong> and/or the<br />
earthwork contractor.<br />
Trucks will only enter or exit the site from specified points. Based on the Final EIR, these locations will be at<br />
East Warren Avenue (Fremont), at Kato Road (Fremont), at Dixon Landing Road (Milpitas), at Montague<br />
Expressway (Milpitas), at Hostetter Road (San Jose), at Berryessa Road (San Jose), at East Julian<br />
Street/McKee Road (San Jose), at 3 rd /4 th Streets/Notre Dame Street/St. James Street (San Jose), at<br />
Autumn/Montgomery Streets (San Jose), and at Hedding Street/Coleman Avenue (San Jose). The more<br />
detailed project design in the future may expand this list of trucking starting points.<br />
Routes for trucks carrying material between one portion of the site and another will enter or exit from the<br />
specified starting points. Permissible truck routes between the specified starting points will be detailed in the<br />
plans and specifications that will govern construction. These routes will be determined by <strong>VTA</strong> after<br />
discussion with local city officials and other interested parties, such as community organizations.<br />
Similarly, local routes from these specified starting points to freeways will be determined by <strong>VTA</strong> after<br />
discussion with local city officials and other interested parties. Trucks will enter one of three freeways,<br />
Highway 101, Interstate 680 and/or Interstate 880, depending on their starting point within the project<br />
alignment. Once on a freeway, trucks carrying material for off-site disposal will follow one of the routes<br />
described below:<br />
• Transportation Route to Kettleman Hills Facility in Kettleman City, California: Trucks entering<br />
the freeway on Interstate 880 or Interstate 680 will turn onto Highway 101 south, and follow<br />
Highway 101 until connecting to eastbound Highway 152 in Gilroy. From there, they will follow<br />
Highway 152 east to Interstate 5, then go south on Interstate 5 towards Kettleman City. In Kettleman<br />
City, the trucks will take State Route 41 westbound, turning on Old Skyline Road and finally into the<br />
CWM disposal facility.<br />
• Transportation Route to Altamont Facility in Livermore, California: Trucks entering the<br />
freeway on Highway 101 will turn onto Interstate 880 north, and follow Interstate 880 to the Mission<br />
Boulevard exit. They will then take Mission Boulevard east to Interstate 680. From there, they will<br />
follow Interstate 680 north to Interstate 280, and Interstate 280 east to the Greenville Road/Altamont<br />
Pass exit. Trucks will then proceed approximately 3.5 miles up Altamont Pass Road to the disposal<br />
facility.<br />
• Transportation Route to Vasco Road Facility in Livermore, California: Trucks entering the<br />
freeway on Highway 101 will turn onto Interstate 880 north, and follow Interstate 880 to the Mission<br />
101248 – July 2008 Page 52
Contaminant Management Plan, SVRT/BART Extension<br />
Boulevard exit. They will then take Mission Boulevard east to Interstate 680. From there, they will<br />
follow Interstate 680 north to Interstate 280, and Interstate 280 east to the Vasco Road exit. Trucks<br />
will then proceed approximately 3.5 miles up Altamont Pass Road to the disposal facility. Trucks will<br />
proceed approximately 2.5 miles north on Vasco Road to the disposal facility.<br />
• Transportation Route to Forward Landfill in Manteca, California: Trucks entering the freeway<br />
on Highway 101 will turn onto Interstate 880 north, and follow Interstate 880 to the Mission<br />
Boulevard exit. They will then take Mission Boulevard east to Interstate 680. From there, they will<br />
follow Interstate 680 north to Interstate 280, Interstate 280 east to Interstate 205, and Interstate 205<br />
east to Interstate 5. Trucks will then proceed north on Interstate 5 until reaching the Roth Road exit,<br />
take Roth Road east to Airport Way, and Airport Way north to French Camp Road. Finally, trucks<br />
will follow French Camp Road east to South Austin Road, and South Austin Road north<br />
approximately 2 miles to the disposal facility.<br />
• Transportation Route to Newby Island Landfill in Milpitas, California: Trucks will make their<br />
way to the Dixon Landing Road exit of Interstate 880. Depending on the starting location of the<br />
truck, this may entail driving either north or south on Interstate 880. Trucks will exit at the Dixon<br />
Landing Road exit and proceed approximately 0.1 miles west to the disposal facility.<br />
4.3.4 Loading and Traffic Control Procedures<br />
Railcars: Loading of material into railcars will involve scooping into the stockpile using a front-end loader<br />
and loading the soil directly into the railcars. Only stockpiled and characterized material is expected to be<br />
loaded into railcars. Dust control measures, including spraying of water, will be performed as<br />
necessary during the loading operation. All railcars will leave the site under UPRR’s proven railroad<br />
traffic control procedures, and therefore, no additional traffic control procedures will be required while<br />
shipping material by railcar.<br />
Trucks: Loading and traffic control procedures for trucks are more detailed. Material will be loaded into<br />
transport trucks using an excavator, backhoe or front-end loader. Dust control measures, including spraying of<br />
water, will be performed as necessary during the loading operation. After loading, trucks will proceed to a<br />
truck decontamination zone where contaminated soil will be removed from the trucks by scraping and<br />
brushing the tires, and where all soil loads will be tarped. The scraped spoils will be combined with excavated<br />
contaminated soils and stored for disposal.<br />
Traffic control while shipping material off-site via truck will depend mainly on site conditions encountered at<br />
101248 – July 2008 Page 53
Contaminant Management Plan, SVRT/BART Extension<br />
the time of transportation. Conditions will vary with the specified departure point and the time of day.<br />
Flagmen will be utilized as necessary to ensure safe and regulated flow of disposal trucks, machinery,<br />
vehicles, and pedestrian traffic. This is expected to involve adherence to traffic control plans pre-approved by<br />
the local city governments.<br />
4.3.5 Transportation Health and Safety<br />
All workers transporting contaminated and hazardous materials must be properly trained in hazardous waste<br />
operations in accordance with 29 CFR Part 1910.120 and 8 CCR Section 5192. Specifically, all transporters<br />
must have 40 hours of off-site training and 8 hours of annual refresher training.<br />
4.3.6 Transportation Contingency Plan<br />
In the event of an emergency or situation of imminent hazard, the Site Safety Officer will dial 911. However,<br />
the following is a list of emergency service organizations in the order of notification:<br />
• Fire Department/Police Department/Ambulance Services - 911; and<br />
• California Highway Patrol - 911 or (510) 450-3821 or (707) 648-5550.<br />
The following emergency response organizations may be called if necessary:<br />
• TSCA Hotline - (800) 424-9065;<br />
• National Response Center - (800) 424-8802;<br />
• Poison Control Center - (800) 962-1253; and<br />
• Cal/OSHA - (415) 557-1677.<br />
Within 24 hours, if an unauthorized spill or discharge of contaminated soils or water occurs, the Site Safety<br />
Officer must notify the following organizations:<br />
• RWQCB (Vince Christian) - (510) 622-2336;<br />
• DTSC (Lynn Nakashima) - (510) 540-3839;<br />
• <strong>VTA</strong> (Wes Toy) - (408) 321-5835; and<br />
• The construction contractor, with contact person to be determined.<br />
4.3.7 Transportation Record Keeping<br />
Daily field notes will be kept by the Contractor’s project manager or designee. For each shipment of impacted<br />
material, documentation in the daily log will include:<br />
101248 – July 2008 Page 54
• Source location of the soil;<br />
• Reuse classification of the soil, if characterized;<br />
• Date and time of loading for each truck or railcar;<br />
Contaminant Management Plan, SVRT/BART Extension<br />
• Transport company and unique truck/railcar identifier (e.g., truck license plate number or railcar<br />
number);<br />
• Approximate volume of each truck or railcar load; and<br />
• Destination of the soil.<br />
For each shipment to another on-site location, documentation in the daily log will also include:<br />
• Date of unloading.<br />
For each shipment to an off-site location, documentation retained by the contractor will also include:<br />
• Load-specific shipping papers (e.g., bill of lading, non-hazardous waste manifest or hazardous waste<br />
manifest).<br />
For each shipment of hazardous waste to an off-site facility, documentation retained by the contractor will<br />
include:<br />
• A Uniform <strong>Hazardous</strong> Waste Manifest (U.S. EPA Form 8700-22 DHS 8022A), completed in full in<br />
accordance with the hazardous waste classification assigned to the material on the disposal facility’s<br />
waste profile. Prior to shipment, the Uniform <strong>Hazardous</strong> Waste Manifest will be signed by a <strong>VTA</strong><br />
representative (as the Generator) and the driver for the licensed transporter. Upon arrival at the<br />
disposal facility, the manifest for the load will be signed by a representative of the disposal facility.<br />
Each party will mail the proper copies of the form to the DTSC in order to allow proper “cradle-tograve”<br />
tracking of the hazardous waste shipment.<br />
4.4 SOIL/BALLAST DISPOSAL<br />
Soil which contains chemical constituents at levels greater than acceptable for all of the reuse scenarios<br />
described in Section 4.2.3 will be disposed of off-site at an appropriate disposal facility. Some soil acceptable<br />
for reuse may also be disposed off-site after characterization, depending volume constraints to on-site reuse.<br />
Off-site soil disposal will be in accordance with all appropriate federal, state and local regulations, including<br />
the Uniform <strong>Hazardous</strong> Waste Manifest standards detailed in Section 4.3.7.<br />
Prior to disposal, waste will be classified for proper disposal in accordance with appropriate regulations (e.g.,<br />
22 CCR 66261). Analytical results supporting the waste classification documentation will be provided to the<br />
disposal facility, and the disposal facility will confirm that they are legally allowed to accept the specific<br />
waste through issuance of a Waste Profile.<br />
101248 – July 2008 Page 55
Contaminant Management Plan, SVRT/BART Extension<br />
Separate disposal facilities will be used for different types of contaminants and different classifications of<br />
waste, such as clean fill, designated waste, California (non-RCRA) hazardous waste, and RCRA hazardous<br />
waste. Appropriate disposal facilities include all appropriately licensed facilities, including those listed in<br />
Section 4.3.3.1, pending ultimate approval by <strong>VTA</strong>.<br />
4.5 SOIL/BALLAST STOCKPILING<br />
Due to physical space limitations, the sequencing of work, the proximity of sensitive receptors, and/or the net<br />
balance of the fill/cut of a given segment, material from a project area may be removed from and transported<br />
to a stockpile location within the project boundary while awaiting either reuse or off-site disposal. Stockpile<br />
locations are listed in Section 4.5.1. If the material has not been adequately characterized, or has been shown<br />
to contain chemicals of concern such that it is not suitable for unrestricted reuse, the material will be handled<br />
using the procedures in this section.<br />
Limitations on stockpiling are discussed in the following subsections. These limitations are not intended to<br />
apply in the following circumstances:<br />
• Material which has been adequately characterized and found suitable for unrestricted on-site or offsite<br />
reuse, which may be placed in any portion of the project site acceptable to <strong>VTA</strong>.<br />
• Imported clean fill material.<br />
• Smaller volumes of soil or ballast approved for reuse which are temporarily placed beside their reuse<br />
location. Note that this is considered part of the fill process, instead of stockpiling.<br />
• Small, temporary windrows associated with grading or utility work within the immediate vicinity of<br />
an excavation or work area. Note that these are considered part of the grading or trenching activity,<br />
instead of stockpiling.<br />
4.5.1 Stockpile Locations<br />
<strong>VTA</strong> has identified a number of locations within the project site for construction staging, as identified on<br />
Final EIR page 4.19-33. These areas may also be used for the stockpiling of relatively large volumes of soil<br />
and ballast. Six areas linked by the former UP rail corridor, allowing on-site transportation (see Section 4.3.2)<br />
between these stockpile areas, are as follows:<br />
• Six acres south of East Warren Avenue, east of the rail corridor.<br />
• Two acres between Railroad Court and the rail corridor south of the Abel Street overcrossing.<br />
• Four acres adjoining the rail corridor south of the Abel Street overcrossing.<br />
• Eighteen acres which will house the Montague / Capitol Station campus, on either side of the rail<br />
corridor south of Montague Expressway.<br />
101248 – July 2008 Page 56
Contaminant Management Plan, SVRT/BART Extension<br />
• Seventeen acres which will house the Berryessa Station campus, on either side of the rail corridor<br />
north of Mabury Road.<br />
• Nineteen acres which will house the Alum Rock Station campus, west of Highway 101 and south of<br />
East Julian Street.<br />
<strong>VTA</strong> has also identified three potential stockpile areas along the tunnel segment in downtown San Jose, each<br />
of which might become an entrance to an underground station. As these areas are not linked by rail corridors,<br />
the distance over which on-site transportation can be conducted at these areas will be severely reduced:<br />
• Two-plus acres northwest of 5 th and East Santa Clara Streets.<br />
• 0.72 acres northeast and southwest of the intersection of Market and East Santa Clara Streets.<br />
• Five acres south of West Santa Clara Street, on either side of Montgomery Street.<br />
Finally, <strong>VTA</strong> has identified two potential large-scale stockpile areas near the Maintenance Facility and the<br />
Santa Clara Station which are connected by the UPRR rail corridor. On-site transportation between these<br />
locations is feasible:<br />
• Thirteen acres on either side of Interstate 880, east of the rail corridor.<br />
• Nine acres on the east side of the rail corridor, north of Brokaw Road.<br />
Furthermore, additional large-scale soil/ballast storage sites may be needed during construction. If additional<br />
storage sites prove necessary, <strong>VTA</strong> will work with the RWQCB and DTSC at that time to determine the<br />
related storage issues for these sites.<br />
In addition, a number of smaller storage sites adjacent to reuse locations may be used temporarily to store<br />
material prior to its reuse.<br />
4.5.2 Stockpile Location Security<br />
The soil/ballast stockpiling locations will be fenced to discourage public access. Chain link fencing will be<br />
used along the portions of the site facing public streets, while either chain link fencing or plastic snow fencing<br />
will be used as needed along the currently open site boundaries adjacent to private properties. Fencing will<br />
not extend across the active rail safety envelope.<br />
Signs prohibiting trespassing will be posted at public entrance points and in areas such as the rail safety<br />
envelope where fencing is not feasible. The signs will contain the name and number to contact in the event of<br />
an emergency, a representative of the construction contractor firm.<br />
101248 – July 2008 Page 57
4.5.3 Unloading<br />
Contaminant Management Plan, SVRT/BART Extension<br />
As discussed in Section 4.3.2, on-site transportation of material will be via trucks or railcars.<br />
End dump trucks with a capacity up to 16 cy (combined) will be the typical truck used to bring material to the<br />
stockpile sites. Fleets of trucks will circulate along defined haul roads between the loading site and the<br />
stockpile area. Loading and decontamination of these trucks will be as detailed in Section 4.3.4. Once in the<br />
stockpile area, the end dump trucks will drop their loads. Soil and ballast will be cleared from the operating<br />
envelope and stockpiled by bulldozers or similar equipment operated by the <strong>VTA</strong> construction contractor(s).<br />
When railcars are used to transport material, they will be in a worktrain generally consisting of 5 to 9 railcars<br />
with 100 ton capacity operated by a UPRR employee. The railcars will be either standard gondolas or<br />
rotary-dump gondolas. Material will be unloaded directly from the worktrain at the stockpile site. A tracked<br />
excavator and/or car-topper (backhoe) will be used to unload standard gondolas, while the rotary-dump<br />
gondolas will unload using their built-in rotary mechanism. Soil and ballast will be cleared from the operating<br />
envelope and stockpiled by bulldozers or similar equipment operated by UPRR and/or the <strong>VTA</strong> construction<br />
contractor.<br />
4.5.4 Stockpiling Procedures<br />
One key procedure during stockpiling is that material from separate data populations not be mixed unless the<br />
material has been fully characterized and shown to be equivalent for the purposes of reuse or disposal.<br />
A second key procedure is that a stockpile record keeping system will be used for all stockpiled material. The<br />
stockpile record keeping system will include:<br />
• the designated data population for the material;<br />
• the reuse classification of that data population;<br />
• the approximate quantity (volume) of the material;<br />
• documentation that the material belongs to the stated data population, in the form of material<br />
transport records (from the transportation record keeping system described in Section 4.3.7) for all<br />
shipments placed in the stockpile;<br />
• any possible previous temporary stockpile locations for the material; and<br />
• the ultimate reuse or disposal location, based on the characterization results.<br />
For stockpiled material intended for off-site disposal, the stockpile record keeping system will also include<br />
the sampling and analytical results for samples used to profile the material for off-site disposal.<br />
101248 – July 2008 Page 58
Additional stockpiling procedures include the following:<br />
Contaminant Management Plan, SVRT/BART Extension<br />
• Stockpile erosion and run-on/runoff will be managed using standard BMPs to avoid migration of<br />
sediment into the storm drains or surface waters.<br />
• The soil will be stockpiled in a manner that facilitates the segregation of 1,000 cy subsections.<br />
• A silt fence will be constructed around the perimeter of the stockpile area to mitigate migration of<br />
sediment into the storm drains or surface waters.<br />
• Saturated soils, if any, will first be placed on 10-mil plastic sheeting.<br />
• A commercial, non-petroleum-based dust palliative or hydroseeding will be applied to stockpiles<br />
within 30 days of placement to minimize the migration of airborne dust.<br />
• Soils classified as appropriate for the Right-of-Way Reuse Scenario or the Encapsulation Reuse<br />
Scenario or classified as waste for disposal will be covered with 10-mil plastic sheeting. Sheeting will<br />
be anchored to prevent removal by the wind.<br />
• After receipt of sample results, separate stockpiles may be consolidated into larger piles consistent<br />
with potential reuse criteria and space constraints.<br />
• The dimensions of any single soil stockpile will be not greater than 1,000 feet long by 50 feet wide<br />
and 15 feet high.<br />
Waste soil containing constituents at levels that would classify it as a California (non--RCRA) hazardous<br />
waste shall be stored in accordance with California Health and Safety Code section 25123.3(b)(4)(B) as<br />
follows:<br />
1. The stockpiled soil will not contain free liquids.<br />
2. The soil will be placed on 20-mil high-density polyethylene (HDPE) that is supported by a<br />
foundation.<br />
3. <strong>VTA</strong> and its earthwork contractor(s) will provide controls for windblown dispersion and precipitation<br />
runoff and run-on, consistent with BMPs and any RWQCB storm water permit requirements.<br />
4. The stockpile site will be inspected weekly and after storms to ensure that the controls for windblown<br />
dispersion and precipitation runoff and run-on are functioning properly.<br />
5. Following final stockpile removal, <strong>VTA</strong> will inspect the non-RCRA hazardous soil stockpile sites for<br />
residual contamination and remediate as necessary.<br />
6. The non-RCRA hazardous soil will be removed from the site within 90 days of stockpile completion<br />
and disposed of at an appropriate disposal facility.<br />
Waste soil containing constituents at levels that would classify it as a RCRA hazardous waste shall be stored<br />
in accordance with the CFR. The DTSC and RWQCB will be notified and the waste will be managed in<br />
accordance with CFR requirements.<br />
101248 – July 2008 Page 59
4.6 AIR MONITORING<br />
Contaminant Management Plan, SVRT/BART Extension<br />
Track realignment, station construction, retained cut construction and related construction activities at the site<br />
have the potential to expose site workers and the public within the surrounding community to chemicals of<br />
concern (COCs) via airborne contamination. Exposures are possible via two pathways, the volatilization of<br />
contaminants into ambient air and the movement of airborne dust containing contaminants. An air quality<br />
monitoring program will be implemented during the excavation activities, particularly in the areas where<br />
potential elevated concentrations of COCs have been detected to ensure that work practices are not creating an<br />
unacceptable health risk to construction workers and public. The air monitoring program details action levels<br />
for total particulates that require respiratory protection, implementation of engineering controls, and<br />
ultimately work stoppage. The air monitoring program will include collecting the following information:<br />
• Real-time air data to determine if modifications to engineering control practices and/or personal<br />
protective equipment (PPE) are necessary for a safe on-site working environment, and to prevent<br />
potential off-site migration of COCs;<br />
• Personal monitoring data and ambient concentrations of potential lead (Pb) and arsenic (As)<br />
contaminated particulates prior to and concurrent with site excavation activities. Measured pollutant<br />
concentrations will be compared to established action levels (in Section 4.6.1) to verify that site<br />
workers will not be exposed to these COCs at unacceptable levels. These data can also be used to<br />
adjust PPE, as appropriate; and<br />
• Air samples at site fence-line ambient air quality monitoring stations to verify that COCs will not<br />
migrate off-site during the excavation activities.<br />
In the areas of potential presence of hazardous waste, site workers will wear Level C PPE during the initial<br />
phases of the excavation activities, including coveralls, boots, gloves, and respiratory protection with<br />
cartridges that filter those COCs detected in the soil in specific excavation areas. The respiratory protection<br />
will continue until sufficient personal air monitoring data is available to verify that the applied engineering<br />
controls are providing adequate protection.<br />
4.6.1 Action Levels<br />
This section summarizes the air action levels for the project, and provides a comparison of these levels against<br />
levels of COCs that are anticipated to occur in the air during the excavation activities.<br />
4.6.1.1 Determination of Action Levels<br />
Permissible exposure limits (PELs) for arsenic and lead for site workers have been provided in Table 8 below<br />
in terms of particulates for comparison against the mini-RAM data, as well as chemical concentrations for<br />
comparison against the personal air monitoring and perimeter air monitoring data.<br />
101248 – July 2008 Page 60
Contaminant Management Plan, SVRT/BART Extension<br />
Table 8 - Permissible Exposure Limits (PELs) for COCs<br />
Analyte<br />
Permissible Exposure Limit<br />
(mg/m 3 )<br />
Arsenic 0.01<br />
Lead 0.05<br />
TPH does not have a published PEL. Air monitoring for TPH will be using mini-RAM particulate monitoring<br />
for nuisance dust.<br />
4.6.1.2 Estimation of Maximum Air Concentrations<br />
The following discusses maximum air concentrations of COCs expected at the site, and action levels for realtime<br />
particulate monitoring and chemical specific laboratory analysis.<br />
Real-Time Particulate Monitoring<br />
The California Department of Occupational Safety and Hazard Assessment (Cal-OSHA) has set a limit of 10<br />
milligrams per cubic meter (mg/m 3 ) for nuisance particulate dust in areas where workers may be exposed. At<br />
levels above this limit, PPE is necessary to prevent unacceptable exposure. If this concentration of<br />
particulates is detected, engineering controls (dust suppression using water or soil stabilizers or delayed work)<br />
will be implemented to reduce particulate concentrations and site workers will be required to use PPE until<br />
dust levels can be reduced. Note that work may continue in the work areas with levels above 10 mg/m 3 if<br />
appropriate PPE can prevent unacceptable exposures.<br />
The DTSC has established a limit of 50 micrograms per cubic meter (µg/m 3 ) above background<br />
concentrations for off-site dust emissions during excavation-type activities in the San Francisco Bay Area.<br />
No site work can continue if this limit is exceeded regardless of the PPE used by the on-site workers. If<br />
particulate concentrations are detected at 50 µg/m 3 (or more) above background concentrations at the property<br />
boundaries, additional engineering controls will be implemented to further reduce dust concentrations (e.g.,<br />
increasing dust control water usage). Work will stop if engineering controls cannot suppress dust emissions<br />
below the limit set by DTSC.<br />
101248 – July 2008 Page 61
Maximum Anticipated Concentration of COCs in Air<br />
Contaminant Management Plan, SVRT/BART Extension<br />
In addition to overall particulate concentrations, a second factor to be considered is the individual<br />
concentrations of COCs that may be present in the particulates. The equation below was used to estimate the<br />
maximum potential concentrations of COCs in air that may occur at the site during excavation activities. This<br />
equation was taken from the Preliminary Endangerment Assessment Guidance Manual, State of California<br />
Environmental Protection Agency, Department of Toxic Substances Control, June 1999, Figure 2.8.<br />
Where:<br />
Equation 1: = ( C × F )<br />
CA = Estimated Concentration in the Air (mg/m 3 )<br />
CS = Concentration in the Soil (mg/kg)<br />
F = 5x10 -8 – DTSC Factor (kg/m 3 )<br />
C A S<br />
The DTSC factor combines two simplifying and conservative assumptions;<br />
• Ambient air particulates are equal to the National Ambient Air Quality Standard for the annual<br />
average respirable portion (PM10) of suspended particulate matter present at a concentration of<br />
50 µg/m 3 (0.05 mg/m 3 )<br />
• 100% of the particulates have the same contaminant concentration (non-VOC only) as the maximum<br />
soil value.<br />
Table 9 lists the maximum concentrations of each COC expected to occur in the air during excavation<br />
activities. The maximum anticipated air concentrations are calculated for both the site perimeter areas<br />
(F=50 µg/m 3 in Equation 1) and for work areas (F=10 mg/m 3 in Equation 1).<br />
Constituent<br />
Table 9: Estimation of Expected Maximum Concentrations of COCs in Air<br />
CS<br />
Maximum<br />
Concentration<br />
in Soil<br />
(mg/kg)<br />
CA<br />
Estimated Maximum<br />
Concentration in Air<br />
at Dust Level of 50 µg/m 3<br />
(mg/m 3 )<br />
CA<br />
Estimated Maximum<br />
Concentration in Air<br />
at Dust Level of 10<br />
mg/m 3<br />
(mg/m 3 )<br />
Arsenic 730 3.7E-05 7.3E-03<br />
Lead 2900 1.5E-04 2.94E-02<br />
101248 – July 2008 Page 62
Real-Time Particulate Monitoring Action Levels<br />
Contaminant Management Plan, SVRT/BART Extension<br />
The real-time monitoring action levels (ALc) are presented in Table 10 and are based on Equation 2 below.<br />
The ALc estimates the COC concentrations in the air at which PELs will be reached or exceeded. As<br />
discussed earlier, characterization of the COC concentrations in the soil at the site has been extensive.<br />
Therefore, it is assumed that the maximum concentrations in the soil at the site are known and it is<br />
conservative to use the maximum concentration detected in soil to represent average site concentrations for<br />
the health and safety purposes.<br />
Constituent<br />
CA<br />
Estimated Maximum<br />
Concentration in Air<br />
at Dust Level of 10 m 3<br />
(mg/m 3 )<br />
Table 10: Action Levels<br />
Permissible<br />
Exposure Levels<br />
(mg/m 3 )<br />
ALC<br />
Real-Time Monitoring<br />
Action Level for Total<br />
Particulates in Air<br />
(mg/m 3 )<br />
Arsenic 730 0.01 274<br />
Lead 2900 0.05 17.2<br />
Where:<br />
Equation 2:<br />
⎛<br />
⎞<br />
⎜<br />
⎟<br />
⎜ PEL ⎟<br />
ALc<br />
=<br />
⎜<br />
⎛ C ⎟<br />
S ⎞<br />
⎜ ⎜ ⎟ ⎟<br />
⎝ ⎝1,<br />
000,<br />
000 ⎠ ⎠<br />
ALC = Calculated Action Level (mg/m 3 )<br />
PEL = Permissible Exposure Limit (mg/m 3 )<br />
CS = Estimated Maximum Concentration in Soil (mg/kg)<br />
Maximum expected air concentrations that are based on the 10 mg/m 3 concentration for on-site nuisance dust<br />
will be used for comparison against permissible exposure levels (PELs). The PELs are taken from Table<br />
AC-1, Permissible Exposure Limits For Chemical Contaminants, California OSHA.<br />
The estimated ALC levels presented in Table 10 indicate that the safe levels for individual site COCs are<br />
greater than the OSHA nuisance limit of 10 mg/m 3 . These data suggest that, provided the real-time particulate<br />
levels remain below the OSHA nuisance limit, individual chemical action levels in air will not be exceeded.<br />
In each case, the estimated maximum concentrations of COCs in the air (CA in Table 9) are below the<br />
individual constituent PELs under the 10 mg/m 3 particulate concentration conditions for both work areas and<br />
site perimeter areas. This calculation indicates that estimated maximum concentrations of COCs are not<br />
101248 – July 2008 Page 63
Contaminant Management Plan, SVRT/BART Extension<br />
expected to exceed safe levels in the work areas or at the site perimeter during the excavation activities. Both<br />
site perimeter and personal air monitoring are included in this plan as conservative measures to document site<br />
conditions during the excavation activities, and to ensure no unacceptable exposures occur.<br />
Table 11 below summarizes the action levels that will be used during the excavation project that will be<br />
monitored with real time measuring equipment (such as a mini-RAM) and the subsequent actions to be taken.<br />
Table 11: Action Level Summary<br />
Analyte Action Level Action<br />
Particulate at site worker<br />
breathing zone<br />
(as measured by a mini-Ram or<br />
other direct read instrument)<br />
Total particulate perimeter<br />
concentrations 50µg/m 3 above<br />
background concentrations<br />
(as measured by a mini-Ram or<br />
other direct read instrument and<br />
calculated as the difference<br />
between the downwind reading<br />
and the upwind reading)<br />
4.6.2 Meteorological Monitoring<br />
10 mg/m 3<br />
50 µg/m 3<br />
PPE (including respirators) will<br />
be required and engineering<br />
controls will be increased<br />
Work will stop until engineering<br />
controls are sufficient to bring<br />
the measured concentration<br />
below the action level.<br />
Meteorological data will be collected on-site starting one week before excavation activities commence. The<br />
parameters that will be collected include wind speed and wind direction. These data will be collected through<br />
the use of a meteorological tower and data logger that will be erected at a height that is suitable for the<br />
excavation at the site. Measurements will be taken hourly and logged to the data logger. These data will be<br />
used to refine the present understanding of wind direction at the site. Wind speeds will be periodically<br />
reviewed during the day to assess whether the wind is blowing greater than 25 miles per hour (mph). Wind<br />
speed in excess of 25 mph may trigger immediate modification of work practices if there is a potential to<br />
release dust into the air.<br />
Wind roses generated from the collected meteorological data will allow the determination of “downwind” and<br />
“upwind” samples. Upwind samples will be assumed to represent background conditions, and downwind<br />
samples will be assumed to identify and quantify the migration of COCs at the site.<br />
101248 – July 2008 Page 64
4.6.3 Real-Time and Personal Air Monitoring<br />
Contaminant Management Plan, SVRT/BART Extension<br />
The primary purpose of the real-time and personal air monitoring is to ensure worker health and safety.<br />
During excavation, personal air monitoring will be conducted on a minimum of two personnel. Air sampling<br />
and analysis will be completed for the specific COCs detected in the soil in each remedial area.<br />
4.6.3.1 Real-Time Air Monitoring<br />
The mini-RAM data will be used to verify in real-time that particulate levels remain below particulate<br />
chemical action levels (ALC) in worker areas. Real-time air measurements will be collected every one-half<br />
hour in active work areas. The ceiling limit for donning PPE prior to continuing work is 10 mg/m 3 .<br />
The mini-RAM will also be used to collect real-time data at the site perimeter on a regular basis to determine<br />
particulate levels. At a minimum, mini-RAM measurements will be collected at one-hour increments along<br />
the site perimeter in the areas of active soil disturbance. If the 50 µg/m 3 ceiling limit is exceeded at the site<br />
perimeter, work will be stopped immediately and additional engineering controls will be implemented to<br />
control off-site dust emissions. If engineering controls are not capable of controlling emissions to acceptable<br />
levels, work will stop in these areas until conditions are favorable to resume excavation activities.<br />
In some cases, engineering controls such as water spray may not be capable of maintaining dust levels below<br />
action levels in all work areas, but may be able to maintain perimeter dust levels below the 50 µg/m 3 limit for<br />
off-site emissions due to sufficient dispersion and dilution between excavation areas and the site perimeter. In<br />
this case, excavation work may continue, as long as proper PPE (such as full-face respirators and particulate<br />
filters) will be used to prevent unacceptable exposures. Modifications to PPE will be used as a last resort<br />
after all engineering control methods have been implemented. In addition, prior to implementing additional<br />
PPE requirements, <strong>VTA</strong> and its contractor(s) will evaluate whether stopping work in these areas is<br />
appropriate.<br />
4.6.3.2 Personal Air Sampling Equipment and Methods<br />
Personal air sampling will be performed through the use of personal air sampling pumps used in conjunction<br />
with various sampling media. A calibrated personal sample pump of a known flow rate is usually worn on the<br />
belt. The pump is connected to the sampling media by plastic tubing. The media (filter cassettes, adsorbent<br />
tubes, etc.) is usually placed on the lapel of the shirt or in the shirt pocket, and should be six to nine inches<br />
away from the nose and mouth. This arrangement can then draw samples from the individuals breathing<br />
zone.<br />
101248 – July 2008 Page 65
Contaminant Management Plan, SVRT/BART Extension<br />
Sampling for arsenic and lead will be performed using one SKC Filter Cassette (part no. 225-3-01 or<br />
equivalent). This is a Mixed Cellulose Ester (MCE) filter that can be used to simultaneously sample the two<br />
different metals.<br />
Table 12 below summarizes the personal air sampling to be performed at the site. The laboratory analyses<br />
will be performed a California-certified laboratory. These analyses are expected to take no longer than five<br />
working days (rush analysis).<br />
Table 12: Personal Sampling<br />
Analyte Sampling Equipment Analytical Methods Method Detection Limits<br />
Arsenic and Lead MCE Filter Cassette NMAM 7300 0.005 mg/m 3<br />
Table 12 also presents the minimum detection limit for the proposed analytical method. The detection limit is<br />
well below the action levels listed in Table 9, and will provide sufficiently accurate information for<br />
comparison against the action levels.<br />
4.6.4 Site Perimeter Air Monitoring<br />
The purpose of the site perimeter air monitoring is to monitor and record the levels of COCs in dust at the site<br />
perimeter, and to prevent the off-site migration of significant levels of COCs. There will be three ambient air<br />
monitoring locations around the boundary of the specific excavation area. Each monitoring site will include a<br />
high volume Polyurethane Foam (PUF) sampler with a quartz filter.<br />
4.6.4.1 Station Location Selection<br />
Ambient air monitors will be placed at three locations at the site boundary. Locations of monitoring station<br />
will be determined by assessing where the most sensitive receptors are relative to the site, and where site<br />
excavation activities are expected to occur, as well as the probable prevailing wind direction.<br />
The following summarizes the rationale for each perimeter air sampling location:<br />
• Sampler No. 1 – Provides monitoring in anticipated up-wind direction.<br />
• Sampler No. 2 and No.3- Provides monitoring in anticipated down-wind direction from the<br />
excavation area, and data between areas of excavation activities and potential off-site receptors.<br />
101248 – July 2008 Page 66
4.6.4.2 Ambient Air Monitoring Equipment and Methods<br />
Contaminant Management Plan, SVRT/BART Extension<br />
Daily ambient air sampling will be performed for arsenic and lead using a high volume Polyurethane Foam<br />
(PUF) sampler. The PUF sampler is a High Volume Polyurethane Foam (PUF) Sampling, and consists<br />
primarily of a particulate filter, and a PUF cartridge mounted in the sampler head. The head sits on a high<br />
volume air pump that can draw air through the sample head, filter and PUF sample, at a rate of 100 to 250<br />
liters per minute (L/min). The following equipment will be used:<br />
• Quartz filter – SKC product number 225-1821 or equivalent. Diameter is 102 mm and can be used in<br />
temperatures up to 1000 C.<br />
• High Volume PUF Tube – SKC product number 226-131 or equivalent, 75 mm.<br />
• Sample Head – SKC product number 228-510 or equivalent.<br />
• High Volume Air Sampler – SKC product number 228-250 or equivalent, 120 V, 60 Hz, capable of<br />
flows between 100 and 250 L/min.<br />
The PUF sampler draws the ambient air through a filter that collects the airborne particulate matter. The air<br />
stream then passes through the quartz filter, where arsenic and lead in particulate form will be collected.<br />
Analysis for these metals will be performed using Inductive Coupled Plasma (ICP) Spectrography or<br />
equivalent method performed by a California-certified laboratory. The laboratory will receive the entire PUF<br />
sample from the field. A small “punch” approximately 38 mm in diameter will be taken out of the quartz<br />
filter for use in the ICP analysis. The lab will use NIOSH Manual of Analytical Methods (NMAM) Test<br />
Method 7300, “Elements by ICP,” or an equivalent method to analyze the metals (with detection limits on the<br />
order of nanograms per m 3 ).<br />
4.6.4.3 Background Determination<br />
During the week prior to work beginning at the site, air sampling will be conducted to establish baseline<br />
conditions. The baseline sampling will be performed for 3 days prior to the commencing of excavation. On<br />
each day of baseline sampling, the upwind PUF sampler will be operated for a minimum of 8 hours. A<br />
reasonable average of the results of the baseline sampling will be assumed to represent background levels of<br />
COCs in ambient air. Any concentrations measured in excess of the upwind background concentrations will<br />
be assumed to have resulted from the soil excavation activities. Due to variability in weekly ambient<br />
concentrations, baseline data will be used in cases where upwind concentrations are not adequate due to<br />
anomalous conditions at the site or for additional characterization of the measured upwind concentrations.<br />
101248 – July 2008 Page 67
4.6.4.4 Monitoring Schedule<br />
Contaminant Management Plan, SVRT/BART Extension<br />
Site perimeter air monitoring will commence the week prior to the start of excavation activities. After<br />
excavation activities commence, site perimeter air monitoring will be conducted every day during the first<br />
week of soil excavation and grading. Once the analytical data has been received and reviewed, the<br />
monitoring schedule may be altered to a less frequent period if the analytical results show that all measured<br />
concentrations of COCs are reasonably below PELs (ie, less than 50% of the PELs). Daily ambient sampling<br />
times will coincide with excavation activities, which are presently estimated to occur between 7:00 A.M. and<br />
8:00 P.M. If excavation activities cease for the remainder of the day at times earlier that 8:00 P.M., then<br />
ambient sampling may also be stopped for that day.<br />
101248 – July 2008 Page 68
5.0 GROUNDWATER MITIGATION MEASURES<br />
Contaminant Management Plan, SVRT/BART Extension<br />
Dewatering of the shallow groundwater zone (approximately 20 and 30 feet bgs) will be required during<br />
excavation activities, but not limited to the following: along retained cuts, at below grade stations, and at<br />
support structures for aerial sections. The earthwork contractor will conduct dewatering activities within the<br />
excavation limits either by utilizing a well-based dewatering system and/or by pumping from the excavation<br />
using trash pumps in low spots. Before initiating construction activities, the earthwork contractor will conduct<br />
a preliminary estimate of the volume of groundwater that needs to be extracted for a specific construction<br />
activity and will determine the appropriate dewatering method.<br />
It is anticipated that the groundwater encountered during excavation activities will contain contaminants that<br />
will require remediation prior to discharge in order to meet requirements of relevant discharge permits. Based<br />
on available analytical data for the project corridor, groundwater containing metals (arsenic, lead, selenium,<br />
and chromium), chlorinated solvents (including PCE and TCE), and/or total petroleum hydrocarbons may be<br />
present in planned excavation areas along the project corridor, as described in Section 2.4.2.<br />
Additional details on groundwater characterization and groundwater treatment and discharge, including<br />
relevant requirements, are provided below.<br />
5.1 GROUNDWATER CHARACTERIZATION<br />
The mobility and lateral variation of groundwater contamination will not allow the anticipated dewatering<br />
mechanisms to adequately segregate clean groundwater from contaminated groundwater. Therefore, all<br />
extracted groundwater should be considered as potentially impacted and thus will require characterization to<br />
determine the appropriate treatment requirements for discharge/disposal. Groundwater characterization will<br />
be performed in accordance with the discharge permit requirements or off-site facility acceptance<br />
requirements, depending on the method selected for discharge (see Section 5.2 below).<br />
5.2 GROUNDWATER TREATMENT AND DISCHARGE<br />
All water removed during dewatering activities will be collected and managed for disposal in compliance with<br />
requirements of governmental permits when required. The earthwork contractor, with all the necessary<br />
permits, will manage water removed from on-site work areas. Typically, groundwater extracted during<br />
dewatering is handled as follows:<br />
• Discharge to the local sanitary sewer system;<br />
• Discharge to the storm drain system; and/or<br />
• Contained and disposed at an appropriately permitted off-site facility.<br />
101248 – July 2008 Page 69
Contaminant Management Plan, SVRT/BART Extension<br />
Aboveground treatment of the extracted groundwater, such as by gravity sedimentation followed with<br />
activated carbon adsorption using granular activated carbon (GAC) vessels will be performed prior to<br />
discharge. Removal of metals may be required based on permit conditions, dewatering rates, and<br />
concentrations of metals encountered during the dewatering.<br />
Discharge of treated dewatering groundwater to the local sanitary sewer system will be regulated either by the<br />
Union Sanitary District in the City of Fremont or by the San Jose/Santa Clara Water Pollution Control Plant<br />
for the Cities of Milpitas, San Jose, and Santa Clara.<br />
Discharge of treated dewatering groundwater to the storm drain system is regulated by the RWQCB, under a<br />
National Pollutant Discharge Elimination System (NPDES) general permit. <strong>VTA</strong> anticipates discharge under<br />
Order No. R2-2004-0055, for the discharge of extracted and treated groundwater. The Contractor will apply<br />
for the NPDES permit from the RWQCB. The earthwork contractor will also meet the substantive<br />
requirements for discharge of storm water runoff associated with construction activity. This includes the<br />
preparation of a Storm Water Pollution Prevention Plan with associated BMPs, as described in Section 7 of<br />
the Standard Specifications, City of San Jose Department of Public Works, July 1992, and substantive<br />
requirements of NPDES permit Order No. R2-2004-0055. Regular system sampling and reporting is required<br />
under any NPDES permit. Solids and spent carbon generated from the dewatering system must be handled<br />
and disposed of in accordance with appropriate and relevant state and federal regulations. The earthwork<br />
contractor will be responsible for system operation, maintenance, sampling and reporting as required by the<br />
NPDES permit.<br />
101248 – July 2008 Page 70
6.0 BUILDING MATERIAL MITIGATION MEASURES<br />
Contaminant Management Plan, SVRT/BART Extension<br />
During the demolition of buildings and structures on the SVRT project property in preparation for<br />
construction activities, the demolition debris may contain hazardous materials, such as asbestos-containing<br />
materials, lead-based paints, PCB-containing light ballasts, mercury vapor lamps, and/or wood, concrete, or<br />
sheetrock contaminated from chemical use, storage, and/or handling. Additionally, chemicals from prior use,<br />
such as pesticides, may be present during demolition of buildings.<br />
6.1 BUILDING MATERIAL CHARACTERIZATION<br />
Prior to demolition, a hazardous materials building survey shall be conducted by the demolition contractor to<br />
identify the presence of hazardous and contaminated materials to be disturbed and/or removed during<br />
demolition activities. Only qualified demolition contractor(s) or subcontractor personnel shall perform the<br />
survey. Inspection for asbestos-containing materials will be performed by a Cal/OSHA Certified Asbestos<br />
Consultant, while inspection for lead hazards will be conducted by personnel certified and licensed by the<br />
State of California under lead certification requirements (as defined by Title 17, California Code of<br />
Regulations Section 35001 et seq.).<br />
If hazardous materials are identified during the building survey, sampling and profiling analyses will be<br />
required for waste disposal. California state-certified laboratories shall perform all the analyses.<br />
6.2 BUILDING MATERIAL ABATEMENT AND DISPOSAL<br />
If hazardous building materials (including remaining chemicals that will be removed during demolition) are<br />
identified during the hazardous building materials survey, a site-specific <strong>Hazardous</strong> <strong>Materials</strong> Management<br />
Plan (HMMP) shall be prepared. The HMMP shall include the following items:<br />
1. Overall scope and schedule of all hazardous materials management, including but not limited to:<br />
a. Description of all hazardous materials work to be performed or managed, as well as intended<br />
control procedures.<br />
b. Schedule of all hazardous materials work.<br />
c. Description of personal protective equipment and methods as well as intended compliance<br />
monitoring.<br />
2. Name, phone number, pager number of demolition contractor(s)’s designated <strong>Hazardous</strong> <strong>Materials</strong><br />
Supervisor, who shall be a qualified person directly responsible under the contractor(s) having the<br />
101248 – July 2008 Page 71
Contaminant Management Plan, SVRT/BART Extension<br />
necessary training to be knowledgeable in the identification, control, and management of the<br />
hazardous materials on-site.<br />
3. Name, address, and phone number of the demolition contractor’s landfill.<br />
<strong>Hazardous</strong> and contaminated materials and hazardous waste shall be handled according to the applicable laws<br />
and regulations in effect at the time of disturbance, transport or disposal of said hazardous materials or waste<br />
and requirements of the Contract Documents. In the event of conflict, the more stringent requirement shall<br />
apply.<br />
101248 – July 2008 Page 72
7.0 REPORTING<br />
Contaminant Management Plan, SVRT/BART Extension<br />
Proper recordkeeping and reporting will be used throughout the project. Reports will be required or prepared<br />
from the three major aspects described.<br />
7.1 CHARACTERIZATION REPORTS<br />
All of the characterization data generated during the project, such as from the soil/ballast characterization<br />
described in Section 4.1, will be documented. A characterization summary report will be prepared for each<br />
phase of hazardous materials characterization.<br />
7.2 SEGMENT-SPECIFIC PLANS<br />
For each of the project segments described in Section 1.2, the segment-specific design team will prepare a<br />
SVRT project design integrating the specific soil/ballast reuse plans or mitigation measures, building<br />
materials mitigation measures, and groundwater mitigation measures. Each of these designs will include<br />
specific requirements regarding what data populations of soil/ballast are acceptable for reuse for which<br />
purposes in what locations. The reuse design will be based on the methodology described in this CMP.<br />
7.3 CONTAMINANT MANAGEMENT DOCUMENTATION<br />
Upon completion of the mitigation measures integrated into the SVRT design, each of the segment-specific<br />
teams will prepare a report documenting the construction process. The documentation is expected to provide<br />
regulatory agencies with sufficient detail to confirm that the mitigation measures detailed in the segmentspecific<br />
plans were completed.<br />
101248 – July 2008 Page 73
8.0 REFERENCES<br />
Contaminant Management Plan, SVRT/BART Extension<br />
Alaska Department of Environmental Conservation, 2003. Technical Memorandum 01-004. Use of the<br />
Bootstrap Method in Calculating the Concentration Term for Estimating Risks at Contaminated<br />
Sites. January 2.<br />
Department of Toxic Substances Control, State of California Environmental Protection Agency, 1999.<br />
Preliminary Endangerment Assessment Guidance Manual (Second Printing). June.<br />
Environmental Resources Management, 2002. Peninsula Corridor Joint Powers Board, Soil Management<br />
Plan, Caltrain North and South CTX Projects. December 16.<br />
Earth Tech, 2002. UPRR Alignment Investigation Data for BART Extension to San Jose,<br />
Fremont/Milpitas/San Jose, California. March 29.<br />
_______, 2003a. Phase I Environmental Site Assessment and Phase II Investigation Work Plan for UPRR<br />
Newhall Yard, San Jose/Santa Clara, California. February 6.<br />
_______, 2003b. Draft Phase II Investigation Data Summary Report for UPRR Newhall Yard, San<br />
Jose/Santa Clara, California. February 11.<br />
_______, 2003c. Draft Additional Investigation Data Summary Report for UPRR Newhall Yard, San<br />
Jose/Santa Clara, California. July 25.<br />
_______, 2003d. Draft Construction and Costs Impacts Summary for UPPR Newhall Yard in San Jose/Santa<br />
Clara, California (Draft Impacts Summary Report). August 8.<br />
_______, 2004. Draft Technical Memorandum, Significant Environmental Impacts on the Seven Station<br />
Campus Areas, Santa Clara Valley Transportation Authority (<strong>VTA</strong>), BART Extension to Milpitas, San<br />
Jose, and Santa Clara. August 16.<br />
_______, 2005. Draft Silicon Valley Rapid Transit Project, Line Segment <strong>Hazardous</strong> <strong>Materials</strong><br />
Characterization. March 25.<br />
Jacobs, Chase, Frick Kleinkopf & Kelly, LLC. 2001. Environmental Documents for WP Milpitas Line,<br />
Prepared by: Geomatrix, 2101 Webster Street, 12th Floor, Oakland, CA 94612, Date: October 8,<br />
2001. October 10.<br />
National Oceanographic and Atmospheric Administration (NOAA) Coastal Protection and Restoration<br />
Division (Buchman, M.F.), 1999. Screening Quick Reference Tables (SQuiRTs) NOAA HAZMAT<br />
Report 99-1, Seattle, WA. September.<br />
San Francisco Bay Regional Water Quality Control Board. 2001. A Comprehensive Groundwater Protection<br />
Evaluation for South San Francisco Bay Basins. December.<br />
_______, 2005. February 2005 Update to Environmental Screening Levels (“ESLs”) Technical Document.<br />
February 18.<br />
Santa Clara Valley Transportation Authority (<strong>VTA</strong>). 2004. Silicon Valley Rapid Transit Corridor - BART<br />
Extension to Milpitas, San Jose and Santa Clara, Final Environmental Impact Report. November.<br />
Scott, Christina M. 1991. Background Metals Concentrations in Soils in Northern Santa Clara County,<br />
California. December.<br />
United States Environmental Protection Agency, 1989. Risk Assessment Guidance for Superfund (RAGS),<br />
Volume 1, Human Health Evaluation Manual (Part A). December.<br />
101248 – July 2008 Page 74
8.0 REFERENCES (cont.)<br />
Contaminant Management Plan, SVRT/BART Extension<br />
_______, 1992. Supplemental Guidance to RAGS: Calculating the Concentration Term, Publication 9285.7-<br />
081. May.<br />
_______, 1997. Ecological Risk Assessment Guidance for Superfund: Process for Designing and Conducting<br />
Ecological Risk Assessments – Interim Final. July.<br />
_______, 1997. The Lognormal Distribution in Environmental Applications. December.<br />
_______, 1999. Risk Assessment Guidance for Superfund Volume 3 Part A – Process for Conducting<br />
Probabilistic Risk Assessment. December.<br />
U.S. EPA, Technical Support Center for Monitoring and Site Characterization, 2004. ProUCL Version 3.0.<br />
April.<br />
U.S. EPA, Region 9, 2004. Preliminary Remediation Goals. October.<br />
URS Corporation. 2001, Phase I Environmental Site Assessment, Silicon Valley Rapid Transit Corridor,<br />
Segment “A”, Milpitas and Fremont, CA. October 11.<br />
_______, 2001. Phase I Environmental Site Assessment, Silicon Valley Rapid Transit Corridor, Segment<br />
“B”, Milpitas and Fremont, CA. October 11.<br />
_______, Phase I Environmental Site Assessment, Silicon Valley Rapid Transit Corridor, Segment “C”,<br />
Milpitas and Fremont, CA. October 11.<br />
_______, Phase I Environmental Site Assessment, Silicon Valley Rapid Transit Corridor, Segment “D”, San<br />
Jose, CA. October 11.<br />
101248 – July 2008 Page 75
101248 – July 2008 i<br />
Prior Analytical Results and Quality Assurance/Quality Control Review<br />
Contaminant Management Plan, SVRT/BART Extension<br />
APPENDIX A<br />
LIST OF TABLES<br />
Table A-1 Quality Control Review for Samples Collected by Geomatrix for Union Pacific Railroad -<br />
Metals<br />
Table A-2 Quality Control Review for Samples collected by Geomatrix for Union Pacific Railroad -<br />
Organics<br />
Table A-3 Quality Control Review for Samples Collected by Earth Tech for <strong>VTA</strong> during ROW<br />
Acquisition - Metals<br />
Table A-4 Quality Control Review for Samples Collected by Earth Tech for <strong>VTA</strong> during ROW<br />
Acquisition - Organics<br />
Table A-5 Quality Control Review for Samples Collected by Earth Tech from UPRR Newhall Yard<br />
– Metals<br />
Table A-6 Quality Control Review for Samples Collected by Earth Tech from UPRR Newhall Yard<br />
- Organics
Location Depth (feet below ground surface)<br />
Sample Information<br />
Number<br />
Station<br />
Sample<br />
Collection<br />
Date Approx.<br />
Total Arsenic (mg/kg)<br />
Laboratory Analyses and Qualifiers<br />
Qualifier for Total Arsenic<br />
Total Lead (mg/kg)<br />
Qualifier for Total Lead<br />
WET for As, Pb, and/or Cu (mg/L)<br />
TCLP for As and/or Pb (mg/L)<br />
CAM 17 Metals (mg/kg)<br />
Table A-1 Quality Control Review for Samples Collected by Geomatrix for Union Pacific Railroad - Metals<br />
Qualifier for Other Than Total<br />
Arsenic or Total Lead<br />
Quality Control Batch Number<br />
(Sample Daily Group)<br />
Chain of Custody Complete<br />
Metals Holding Time<br />
Sample Information<br />
Total Arsenic (mg/kg)<br />
Qualifier for Total Arsenic<br />
Total Lead (mg/kg)<br />
surface)<br />
ground<br />
Number<br />
below (feet<br />
Station<br />
Sample<br />
Collection<br />
Location Depth<br />
Date Approx.<br />
Data from Investigation Along SJX/Line Segment<br />
Laboratory Analyses and Qualifiers<br />
SS-061 0.5 07/24/01 148+20 3.2 8.7 x<br />
Qualifier for Total Lead<br />
WET for As, Pb, and/or Cu (mg/L)<br />
TCLP for As and/or Pb (mg/L)<br />
CAM 17 Metals (mg/kg)<br />
Table A-1 Quality Control Review for Samples Collected by Geomatrix for Union Pacific Railroad - Metals<br />
Qualifier for Other Than Total<br />
Arsenic or Total Lead<br />
Quality Control Batch Number<br />
(Sample Daily Group)<br />
Chain of Custody Complete<br />
Metals Holding Time<br />
Sample Information<br />
Total Arsenic (mg/kg)<br />
Qualifier for Total Arsenic<br />
Total Lead (mg/kg)<br />
surface)<br />
ground<br />
Number<br />
below (feet<br />
Station<br />
Sample<br />
Collection<br />
Location Depth<br />
Date Approx.<br />
Data from Investigation Along SJX/Line Segment<br />
Laboratory Analyses and Qualifiers<br />
Qualifier for Total Lead<br />
WET for As, Pb, and/or Cu (mg/L)<br />
TCLP for As and/or Pb (mg/L)<br />
CAM 17 Metals (mg/kg)<br />
Table A-1 Quality Control Review for Samples Collected by Geomatrix for Union Pacific Railroad - Metals<br />
Qualifier for Other Than Total<br />
Arsenic or Total Lead<br />
Quality Control Batch Number<br />
(Sample Daily Group)<br />
Chain of Custody Complete<br />
Metals Holding Time<br />
Sample Information Laboratory Analyses and Qualifiers<br />
surface)<br />
ground below (feet<br />
Sample<br />
ID Depth<br />
Sample Collection Date<br />
Approx. Station Number<br />
VOCs (mg/kg)<br />
SS-053 0.50 07/24/01 108+30 na 4<br />
SVOCs (mg/kg)<br />
SS-053 0.50 07/24/01 108+30 na ND 5<br />
TPH-G (mg/kg)<br />
MTBE + BTEX (mg/kg)<br />
TPH-D (mg/kg)<br />
TEPH (mg/kg)<br />
na na na 2.6 16<br />
na na na na<br />
SS-053 1.50 07/24/01 108+30 na na na na 1.8 14<br />
SS-053 1.50 07/24/01 108+30 ND na na na na na<br />
SS-053 1.50 07/24/01 108+30 na ND na na na na<br />
SS-096 0.50 07/26/01 319+50 na na na na ND ND<br />
SS-096 0.50 07/26/01 319+50 na ND na na na na<br />
SS-096 1.50 07/26/01 319+50 na na na na ND 16<br />
SS-096 1.50 07/26/01 319+50 na ND na na na na<br />
Notes:<br />
1<br />
LCS/LCSD = laboratory control spike/LCS duplicate<br />
2<br />
RPD = Relative Percent Difference<br />
3<br />
MS/MSD = matrix spike/MS duplicate<br />
4<br />
na = Not analyzed<br />
5<br />
ND = Not detected above laboratory limits<br />
TABLE A-2 Quality Control Review for Samples collected by Geomatrix for Union Pacific Railroad - Organics<br />
Qualifiers<br />
Quality Control Batch Number<br />
(Sample Daily Group)<br />
VOCs Holding Time<br />
VOCs Surrogate Spikes<br />
VOCs Method Blank<br />
VOCs LCS/LCSD 1 /RPD 2<br />
VOCs MS/MSD 3 /RPD<br />
TEPH Holding Time<br />
TEPH Surrogate Spike<br />
Evaluation of QC Data Acceptability<br />
TEPH Method Blank<br />
TEPH LCS/LCSD/RPD<br />
TEPH MS/MSD/RPD<br />
TPH-G Holding Time<br />
Entech<br />
DS4035A<br />
Entech<br />
-- -- -- -- -- OK OK OK OK OK -- -- -- -- -- OK OK OK OK OK -- -- -- -- --<br />
BS5025D<br />
Entech<br />
-- -- -- -- -- -- -- -- -- -- -- -- -- -- -- -- -- -- -- -- OK OK OK OK OK<br />
DS4035A<br />
Entech<br />
-- -- -- -- -- OK OK OK OK OK -- -- -- -- -- OK OK OK OK OK -- -- -- -- --<br />
SMS21097B OK OK OK OK OK<br />
Entech<br />
-- -- -- -- -- -- -- -- -- -- -- -- -- -- -- -- -- -- -- --<br />
BS5025D<br />
Entech<br />
-- -- -- -- -- -- -- -- -- -- -- -- -- -- -- -- -- -- -- -- OK OK OK OK OK<br />
DS4035C<br />
Entech<br />
-- -- -- -- -- OK OK OK OK -- -- -- -- -- -- -- -- -- -- -- -- -- -- -- --<br />
BS5025D<br />
Entech<br />
-- -- -- -- -- -- -- -- -- -- -- -- -- -- -- -- -- -- -- -- OK OK OK OK na<br />
DS4035C<br />
Entech<br />
-- -- -- -- -- OK OK OK OK -- -- -- -- -- -- -- -- -- -- -- -- -- -- -- --<br />
BS5025D -- -- -- -- -- -- -- -- -- -- -- -- -- -- -- -- -- -- -- -- OK OK OK OK na<br />
101248- QC Geomatrix Organics Data.xls - July 2008 Page 1 of 1<br />
TPH-G Surrogate Spike<br />
TPH-G Method Blank<br />
TPH-G LCS/LCSD/RPD<br />
TPH-G MS/MSD/RPD<br />
TPH-D Holding Time<br />
TPH-D Surrogate Spike<br />
TPH-D Method Blank<br />
TPH-D LCS/LCSD/RPD<br />
TPH-D MS/MSD/RPD<br />
SVOCs Holding Time<br />
SVOCs Surrogate Spike<br />
SVOCs Method Blank<br />
SVOCs LCS/LCSD/RPD<br />
SVOCs MS/MSD/RPD
Sample Information<br />
Location Depth (feet below ground surface)<br />
Number<br />
Station<br />
Sample<br />
Collection<br />
Date Approx.<br />
Total Arsenic (mg/kg)<br />
Qualifier for Total Arsenic<br />
Total Lead (mg/kg)<br />
Table A-3 Quality Control Review for Samples Collected by Earth Tech for <strong>VTA</strong> during ROW Acquisition - Metals<br />
Laboratory Analyses and Qualifiers<br />
Qualifier for Total Lead<br />
WET for As, Pb, and/or Cu<br />
(mg/L)<br />
Qualifier for WET As, Pb, and/or<br />
Cu<br />
TCLP for As and/or Pb (mg/L)<br />
Qualifier for TCLP As and/or Pb<br />
CAM 17 Metals (mg/kg)<br />
Investigation of Warm Springs Extension<br />
ETAN-01-1 1.5-2 2/17/02 22.08 14.79 Torrent ICP020213A1/15B1 OK OK OK OK OK OK OK<br />
ETAN-02-1 0.0-0.5 2/17/02 Torrent 020207007 OK na na na na na na<br />
ETAN-02-2 1.5-2 2/17/02 17.24 66.24 Torrent ICP020213A1/15B1 OK OK OK OK OK OK OK<br />
As: ND<br />
Pb: 0.112<br />
Crushed<br />
Gravel-<br />
Torrent ICP020123A1/B1<br />
As: 0.176<br />
ICP020128A1<br />
ETSS-01-1 0.5-1 1//08/02 ND 4.450 Pb: ND J-: Pb<br />
ICP020204A1 OK OK OK OK OK na na<br />
As: 14.07<br />
Torrent ICP020121A1/B1<br />
ETSS-01-2 1-1.5 1//08/02 323 8.64 Pb: 0.289<br />
ICP020128A1 OK OK OK OK OK na na<br />
ETSS-01-3 2-2.5 1//08/02 24.0 1.19 Torrent ICP020121A1/B1 OK OK OK OK OK na na<br />
As: 2.417<br />
Torrent ICP020121A1/B1<br />
ETSS-02-1 1-1.5 1//08/02 97.5 27.4 Pb: 1.419<br />
ICP020128A1 OK OK OK OK OK na na<br />
ETSS-02-2 2-2.5 1//08/02 4.07 4.99 Torrent ICP020109A2/B2 OK OK na na na na na<br />
As: 0.444<br />
Torrent ICP020123A1/B1<br />
ETSS-03-1 1-1.5 1/10/02 25.1 11.1 Pb: ND J-: Pb<br />
ICP020204A1 OK OK OK OK OK na na<br />
ETSS-03-2 1.5-2 1/10/02 99.5 6.19 Torrent ICP020121A1/B1 OK OK OK OK OK na na<br />
As: 2.682<br />
Torrent ICP020121A1/B1<br />
ETSS-04-1 1-1.5 1/10/02 87.7 26.5 Pb: ND J-: Pb<br />
ICP020204A1 OK OK OK OK OK na na<br />
ETSS-04-2 1.67-2 1/10/02 73.9 16.1 Torrent ICP020121A1/B1 OK OK OK OK OK na na<br />
SB-01-1 1.5-2 12/26/01 280+50 7.45 0.582 Torrent ICP020103A1/B1 OK OK OK OK OK na 4<br />
na<br />
SB-03-1 1.5-2 12/26/01 348+00 0.779 19.0 Torrent ICP020103A1/B1 OK OK OK OK OK na na<br />
SB-03-2 10-10.5 12/26/01 348+00 104 5.24 Torrent ICP020103A1/B1 OK OK OK OK OK na na<br />
SB-03-2 (WET) 10-10.5 12/26/01 348+00 As: ND 5 Pb: J- 6<br />
Pb: MS=56% vs.<br />
Torrent ICP020204 A1 OK OK OK OK 85%, biased low na na<br />
SB-03-3 20.5-21.5 12/26/01 348+00 ND 5.41 Torrent ICP020103A1/B1 OK OK OK OK OK na na<br />
SB-04-1 1.5-2 12/27/01 351+60 8.07 34.1 Torrent ICP020103A1/B1 OK OK OK OK OK na na<br />
SB-04-2 9.5-10 12/27/01 351+60 43.9 1.69 Torrent ICP020103A1/B1 OK OK OK OK OK na na<br />
SB-04-3 19.5-20 12/27/01 351+60 69.7 4.99 Torrent ICP020103A1/B1 OK OK OK OK OK na na<br />
SB-05-1 1.5-2 12/26/01 355+00 91.8 18.4 x Torrent ICP020103A1/B1 OK OK OK OK OK OK OK<br />
SB-05-2 15.5-16 12/26/01 355+00 88.6 10.0 x Torrent ICP020103A1/B1 OK OK OK OK OK<br />
Pb: MS=56% vs.<br />
OK OK<br />
SB-05-2 (WET) 15.5-16 12/26/01 355+00 As: ND Pb: J- Torrent ICP020204 A1 OK OK OK OK 85%, biased low na na<br />
Qualifier for Other Than Total<br />
Arsenic or Total Lead<br />
Quality Control Batch Number<br />
(Sample Daily Group)<br />
Evaluation of Quality Control (QC) Data Acceptability<br />
101248- Table A-3 QC 2002 Line Segment Metals Data.xls - July 2008 Page 1 of 9<br />
Chain of Custody Complete<br />
Metals Holding Time<br />
Sample Information<br />
Location Depth (feet below ground surface)<br />
Number<br />
Station<br />
Sample<br />
Collection<br />
Date Approx.<br />
Total Arsenic (mg/kg)<br />
Qualifier for Total Arsenic<br />
Total Lead (mg/kg)<br />
Table A-3 Quality Control Review for Samples Collected by Earth Tech for <strong>VTA</strong> during ROW Acquisition - Metals<br />
Laboratory Analyses and Qualifiers<br />
Qualifier for Total Lead<br />
WET for As, Pb, and/or Cu<br />
(mg/L)<br />
Qualifier for WET As, Pb, and/or<br />
Cu<br />
TCLP for As and/or Pb (mg/L)<br />
Qualifier for TCLP As and/or Pb<br />
CAM 17 Metals (mg/kg)<br />
Qualifier for Other Than Total<br />
Arsenic or Total Lead<br />
Quality Control Batch Number<br />
(Sample Daily Group)<br />
Evaluation of Quality Control (QC) Data Acceptability<br />
SB-06-1 1.5-2 12/27/01 357+55 92.8 5.58 Torrent ICP020103A1/B1 OK OK OK OK OK na na<br />
SB-06-2 10-10.5 12/27/01 357+55 ND 5.08 Torrent ICP020103A1/B1 OK OK OK OK OK na na<br />
SB-06-3 14-14.5 12/27/01 357+55 75.4 6.39 Torrent ICP020103A1/B1 OK OK OK OK OK na na<br />
SB-07-1 1.5-2 12/27/01 360+00 131 4.31 Torrent ICP020103A1/B1 OK OK OK OK OK na na<br />
SB-07-2 14.5-15 12/27/01 360+00 ND 3.91 Torrent ICP020103A1/B1 OK OK OK OK OK na na<br />
BAL-08-1 1-1.5 12/27/01 86.5 599 Torrent ICP020103A1/B1 OK OK OK OK OK na na<br />
As: 0.447<br />
Pb: MS=56% vs.<br />
BAL-08-1 (WET) 1-1.5 12/27/01<br />
Pb: 3.86 Pb: J- Torrent ICP020204 A1 OK OK OK OK 85%, biased low na na<br />
As: ND<br />
Pb: MS=56% vs.<br />
BAL-08-1 (TCLP) 1-1.5 12/27/01<br />
Pb: 0.972 Pb: J- Torrent ICP020204 A1 OK OK OK OK 85%, biased low na na<br />
SB-08-1 1.5-2 12/27/01 364+10 113 4.81 Torrent ICP020103A1/B1 OK OK OK OK OK na na<br />
SB-08-2 13.5-14 12/27/01 364+10 ND 6.10 Torrent ICP020103A1/B1 OK OK OK OK OK na na<br />
SB-08-3 16-16.5 12/27/01 364+10 ND 3.77 Torrent ICP020103A1/B1 OK OK OK OK OK na na<br />
SB-09-1 1.5-2 12/27/01 373+75 ND 6.28 Torrent ICP020103A1/B1 OK OK OK OK OK na na<br />
SB-09-2 17-17.5 12/27/01 373+75 ND 3.70 Torrent ICP020103A1/B1 OK OK OK OK OK na na<br />
SB-10-1 1.5-2 12/26/01 376+10 223 6.77 Torrent ICP020103A1/B1 OK OK OK OK OK na na<br />
SB-10-2 15.5-16 12/26/01 376+10 2.77 4.90 Torrent ICP020103A1/B1 OK OK OK OK OK na na<br />
SB-11-2 1.5-2 01/02/02 386+20 118 8.70 x Torrent ICP020109A1/B1 OK OK OK OK OK OK OK<br />
SB-11-3 5-5.5 01/02/02 386+20 141 6.77 Torrent ICP020109A1/B1 OK OK OK OK OK<br />
Pb: MS=56% vs.<br />
na na<br />
SB-11-3 (WET) 5-5.5 01/02/02 386+20 As: ND Pb: J- Torrent ICP020204 A1 OK OK OK OK 85%, biased low na na<br />
SB-11-4 18-18.5 01/02/02 386+20 173 5.95 Torrent ICP020116A1/B1 OK OK OK OK OK<br />
Pb: MS=56% vs.<br />
na na<br />
SB-11-4 (WET) 18-18.5 01/02/02 386+20 As: ND Pb: J- Torrent ICP020204 A1 OK OK OK OK 85%, biased low<br />
Pb: MS=56% vs.<br />
na na<br />
SB-11-4 (TCLP) 18-18.5 01/02/02 386+20 As: ND Pb: J- Torrent ICP020204 A1 OK OK OK OK 85%, biased low na na<br />
SB-12-1 1.5-2 12/28/01 404+95 104 29.10 Torrent ICP020103A1/B1 OK OK OK OK OK na na<br />
SB-12-2 10.5-11.5 12/28/01 404+95 112 4.85 Torrent ICP020116A1 OK OK OK OK OK<br />
Pb: MS=56% vs.<br />
na na<br />
SB-12-2 (WET) 10.5-11.5 12/28/01 404+95 As: ND Pb: J- Torrent ICP020204 A1 OK OK OK OK 85%, biased low na na<br />
SB-13-1 1.5-2 12/28/01 414+80 22.5 16.3 Torrent ICP020103A1/B1 OK OK OK OK OK na na<br />
SB-13-2 18-19 12/28/01 414+80 430 17.9 Torrent ICP020116A1/B1 OK OK OK OK OK<br />
Pb: MS=56% vs.<br />
na na<br />
SB-13-2 (WET) 18-19 12/28/01 414+80 As: ND Pb: J- Torrent ICP020204 A1 OK OK OK OK 85%, biased low na na<br />
101248- Table A-3 QC 2002 Line Segment Metals Data.xls - July 2008 Page 2 of 9<br />
Chain of Custody Complete<br />
Metals Holding Time<br />
Sample Information<br />
Location Depth (feet below ground surface)<br />
Sample<br />
Collection<br />
Date Approx. Station Number<br />
Total Arsenic (mg/kg)<br />
Qualifier for Total Arsenic<br />
Total Lead (mg/kg)<br />
Table A-3 Quality Control Review for Samples Collected by Earth Tech for <strong>VTA</strong> during ROW Acquisition - Metals<br />
Laboratory Analyses and Qualifiers<br />
Qualifier for Total Lead<br />
WET for As, Pb, and/or Cu<br />
(mg/L)<br />
Qualifier for WET As, Pb, and/or<br />
Cu<br />
TCLP for As and/or Pb (mg/L)<br />
Qualifier for TCLP As and/or Pb<br />
CAM 17 Metals (mg/kg)<br />
Qualifier for Other Than Total<br />
Arsenic or Total Lead<br />
Quality Control Batch Number<br />
(Sample Daily Group)<br />
Evaluation of Quality Control (QC) Data Acceptability<br />
SB-13-2 (TCLP) 18-19 12/28/01 414+80 As: ND Pb: J- Torrent ICP020204 A1 OK OK OK OK<br />
Pb: MS=56% vs.<br />
85%, biased low na na<br />
SB-14-2 1.5-2 01/02/02 422+75 80.6 6.16 x Torrent ICP020109A1/B1 OK OK OK OK OK OK OK<br />
SB-14-3 5-5.5 01/02/02 422+75 89.6 7.70 Torrent ICP020109A1/B1 OK OK OK OK OK<br />
Pb: MS=56% vs.<br />
na na<br />
SB-14-3 (WET) 5-5.5 01/02/02 422+75 As: ND Pb: J- Torrent ICP020204 A1 OK OK OK OK 85%, biased low na na<br />
SB-14-4 18-18.5 01/02/02 422+75 ND NV 7 5.86 NV NV NV NV Not Available NV NV NV NV NV NV NV Lab QC not available.<br />
SB-15-1 1.5-2 01/02/02 453+90 220 5.97 Torrent ICP020109A1/B1 OK OK OK OK OK na na<br />
SB-15-2 5-5.5 01/02/02 453+90 ND 6.61 Torrent ICP020109A1/B1 OK OK OK OK OK na na<br />
SB-16-1 1.5-2 01/02/02 466+30 ND 7.81 Torrent ICP020109A1/B1 OK OK OK OK OK na na<br />
SB-16-2 5-5.5 01/02/02 466+30 ND 2.31 Torrent ICP020109A1/B1 OK OK OK OK OK na na<br />
SB-17-1 1.5-2 01/03/02 476+15 ND 11.1 x Torrent ICP020109A1/B1 OK OK OK OK OK OK OK<br />
SB-17-2 5-5.5 01/03/02 476+15 ND 3.52 Torrent ICP020109A1/B1 OK OK OK OK OK na na<br />
SB-17-W01 -- 01/03/02 476+15 x Torrent ICP020109A2/B2 OK OK OK OK OK OK OK<br />
SB-18-1 1.5-2 01/03/02 485+90 ND 7.99 Torrent ICP020109A1/B1 OK OK OK OK OK na na<br />
SB-18-2 5-5.5 01/03/02 485+90 ND 6.16 Torrent ICP020109A1/B1 OK OK OK OK OK na na<br />
SB-19-1 1.5-2 01/03/02 493+40 31.5 6.70 Torrent ICP020109A1/B1 OK OK OK OK OK na na<br />
SB-19-2 5-5.5 01/03/02 493+40 151 10.7 Torrent ICP020109A1/B1 OK OK OK OK OK<br />
Pb: MS=56% vs.<br />
na na<br />
SB-19-2 (TCLP) 5-5.5 01/03/02 493+40 As: ND Pb: J- Torrent ICP020204 A1 OK OK OK OK 85%, biased low na na<br />
SB-20-1 1.5-2 01/03/02 498+55 129 6.57 Torrent ICP020109A1/B1 OK OK OK OK OK na na<br />
SB-20-2 5-5.5 01/03/02 498+55 116 6.55 Torrent ICP020109A1/B1 OK OK OK OK OK<br />
Pb: MS=56% vs.<br />
na na<br />
SB-20-2 (WET) 5-5.5 01/03/02 498+55 As: 0.311 Pb: J- Torrent ICP020204 A1 OK OK OK OK 85%, biased low na na<br />
SB-21-1 1.5-2 01/03/02 503+45 191 2.39 Torrent ICP020109A1/B1 OK OK OK OK OK na na<br />
SB-21-1 (TCLP) 1.5-2 01/03/02 503+45 As: 0.788 Torrent ICP020207 B1 OK OK OK OK OK na na<br />
SB-21-2 5-5.5 01/03/02 503+45 98.6 6.33 Torrent ICP020109A1/B1 OK OK OK OK OK na na<br />
SB-29-S1 4.5-5 01/31/02 364+10 56 NV 18 NV Entech SM8148 OK OK NV NV NV NV NV Lab QC not available.<br />
SB-29-S1 (WET) 4.5-5 01/31/02 364+10<br />
As: 1.8<br />
Pb: ND Entech WM8159B OK OK OK OK OK na na<br />
SB-29-S2 8.5-9 01/31/02 364+10 ND NV 9.4 NV Entech SM8148 OK OK NV NV NV NV NV Lab QC not available.<br />
SB-29-S2 (WET) 8.5-9 01/31/02 364+10<br />
As: 0.38<br />
Pb: ND Entech WM8159B OK OK OK OK OK na na<br />
101248- Table A-3 QC 2002 Line Segment Metals Data.xls - July 2008 Page 3 of 9<br />
Chain of Custody Complete<br />
Metals Holding Time<br />
Sample Information<br />
Total Arsenic (mg/kg)<br />
Qualifier for Total Arsenic<br />
Total Lead (mg/kg)<br />
Table A-3 Quality Control Review for Samples Collected by Earth Tech for <strong>VTA</strong> during ROW Acquisition - Metals<br />
Laboratory Analyses and Qualifiers<br />
Qualifier for Total Lead<br />
WET for As, Pb, and/or Cu<br />
(mg/L)<br />
Qualifier for WET As, Pb, and/or<br />
Cu<br />
TCLP for As and/or Pb (mg/L)<br />
Qualifier for TCLP As and/or Pb<br />
CAM 17 Metals (mg/kg)<br />
Qualifier for Other Than Total<br />
Arsenic or Total Lead<br />
Quality Control Batch Number<br />
(Sample Daily Group)<br />
Evaluation of Quality Control (QC) Data Acceptability<br />
surface)<br />
ground<br />
Number<br />
below (feet<br />
Station<br />
Depth<br />
Approx.<br />
Location<br />
Sample<br />
Collection<br />
Date Notes<br />
SB-29-S3 14-14.5 01/31/02 364+10 ND NV 6.1 NV Entech SM8148 OK OK NV NV NV NV NV Lab QC not available.<br />
SB-29-S3 (WET) 14-14.5 01/31/02 364+10<br />
As: ND<br />
Pb: ND Entech WM8159B OK OK OK OK OK na na<br />
SB-29-S4 18-18.5 01/31/02 364+10 ND NV 6.7 NV Entech SM8148 OK OK NV NV NV NV NV Lab QC not available.<br />
SB-29-S4 (WET) 18-18.5 01/31/02 364+10<br />
As: ND<br />
Pb: ND Entech WM8159B OK OK OK OK OK na na<br />
0.23 0.25<br />
SB-29-W01 -- 01/31/02 364+10 mg/L mg/L Entech WM8158 OK OK OK OK OK N/A 8<br />
N/A<br />
SB-29E 1.5-2 01/31/02 364+10 6.0 NV 68 NV Entech SM8148 OK OK NV NV NV NV NV Lab QC not available.<br />
SB-30-S1 1.5-2 01/31/02 393+90 40 NV Entech SM8148 OK OK NV NV NV NV NV Lab QC not available.<br />
SB-30-S1 (WET) 1.5-2 01/31/02 393+90<br />
As: 4.4<br />
Pb: ND Entech WM8159B OK OK OK OK OK na na<br />
SB-30-S2 5-5.5 01/31/02 393+90 ND NV Entech SM8148 OK OK NV NV NV NV NV Lab QC not available.<br />
SB-30-S3 10-10.5 01/31/02 393+90 11 NV Entech SM8148 OK OK NV NV NV NV NV Lab QC not available.<br />
SB-30-S3 (WET) 10-10.5 01/31/02 393+90<br />
As: 0.25<br />
Pb: ND Entech WM8159B OK OK OK OK OK na na<br />
SB-30-S4 15-15.5 01/31/02 393+90 9.3 NV Entech SM8148 OK OK NV NV NV NV NV Lab QC not available.<br />
SB-30-S5 21-21.5 01/31/02 393+90 ND NV Entech SM8148 OK OK NV NV NV NV NV Lab QC not available.<br />
SB-30-S5 (WET) 21-21.5 01/31/02 393+90<br />
As: ND<br />
Pb: ND Entech WM8159B OK OK OK OK OK na na<br />
SB-30-S5 (TCLP) 21-21.5 01/31/02 393+90<br />
As: ND<br />
Pb: ND NV Entech WM8153B NV NV NV NV NV Lab QC not available.<br />
SB-30-W01 -- 01/31/02<br />
0.032<br />
393+90 mg/L Entech WM8158 OK OK OK OK OK N/A N/A<br />
SB-30E 1.5-2 01/31/02 393+90 ND NV Entech SM8148 OK OK NV NV NV NV NV Lab QC not available.<br />
SB-30W 1.5-2 01/31/02 393+90 ND NV Entech SM8148 OK OK NV NV NV NV NV Lab QC not available.<br />
SB-31-S1 1.5-2 01/31/02 409+80 86.0 NV Entech SM8148 OK OK NV NV NV NV NV Lab QC not available.<br />
SB-31-S1 (WET) 1.5-2 01/31/02 409+80 As: 2.3 Entech WM8159B OK OK OK OK OK na na<br />
SB-31-S2 5-5.5 01/31/02 409+80 ND NV Entech SM8148 OK OK NV NV NV NV NV Lab QC not available.<br />
SB-31-S3 10-10.5 01/31/02 409+80 6.0 NV Entech SM8148 OK OK NV NV NV NV NV Lab QC not available.<br />
SB-31-S3 (WET) 10-10.5 01/31/02 409+80 As: 0.29 Entech WM8159B OK OK OK OK OK na na<br />
SB-31-S4 14-14.5 01/31/02 409+80 ND NV Entech SM8148 OK OK NV NV NV NV NV Lab QC not available.<br />
SB-31-S5 17-17.5 01/31/02 409+80 ND NV Entech SM8148 OK OK NV NV NV NV NV Lab QC not available.<br />
101248- Table A-3 QC 2002 Line Segment Metals Data.xls - July 2008 Page 4 of 9<br />
Chain of Custody Complete<br />
Metals Holding Time<br />
Sample Information<br />
Location Depth (feet below ground surface)<br />
Sample<br />
Collection<br />
Date Approx. Station Number<br />
Total Arsenic (mg/kg)<br />
Qualifier for Total Arsenic<br />
Total Lead (mg/kg)<br />
Table A-3 Quality Control Review for Samples Collected by Earth Tech for <strong>VTA</strong> during ROW Acquisition - Metals<br />
Laboratory Analyses and Qualifiers<br />
Qualifier for Total Lead<br />
WET for As, Pb, and/or Cu<br />
(mg/L)<br />
Qualifier for WET As, Pb, and/or<br />
Cu<br />
TCLP for As and/or Pb (mg/L)<br />
Qualifier for TCLP As and/or Pb<br />
CAM 17 Metals (mg/kg)<br />
Qualifier for Other Than Total<br />
Arsenic or Total Lead<br />
Quality Control Batch Number<br />
(Sample Daily Group)<br />
Evaluation of Quality Control (QC) Data Acceptability<br />
SB-31-S5 (WET) 17-17.5 01/31/02 409+80 As: 0.250 Entech WM8159B OK OK OK OK OK na na<br />
SB-31-S5 (TCLP) 17-17.5 01/31/02 409+80 As: ND NV Entech WM8153B OK OK NV NV NV NV NV Lab QC not available.<br />
SB-31-W01 -- 01/31/02<br />
0.28<br />
409+80 mg/L Entech WM8158 OK OK OK OK OK N/A N/A<br />
SB-31E 1.5-2 01/31/02 409+80 6.5 NV Entech SM8148 OK OK NV NV NV NV NV Lab QC not available.<br />
SB-31W 1.5-2 01/31/02 409+80 5.4 NV Entech SM8148 OK OK NV NV NV NV NV Lab QC not available.<br />
SB-32-S1 0.5-1 02/01/02 493+40 na NV naNV na NV naNV Entech SM8147B OK OK NV NV NV NV NV Only copper analyzed.<br />
SB-32-S2 4.5-5 02/01/02 493+40 na NV naNV na NV naNV Entech SM8147B OK OK NV NV NV NV NV Only copper analyzed.<br />
SB-32-S3 10-10.5 02/01/02 493+40 ND NV Entech SM8147B OK OK NV NV NV NV NV Lab QC not available.<br />
SB-32-S3 (WET) 10-10.5 02/01/02 493+40 As: ND Entech WM8159B OK OK OK OK OK na na<br />
SB-32-S3 (TCLP) 10-10.5 02/01/02 493+40 As: ND NV Entech WM8153B OK OK NV NV NV NV NV Lab QC not available.<br />
SB-32-S4 15-15.5 02/01/02 493+40 ND NV Entech SM8147B OK OK NV NV NV NV NV Lab QC not available.<br />
SB-32-S4 (WET) 15-15.5 02/01/02 493+40 As: ND Entech WM8159B OK OK OK OK OK na na<br />
SB-32-S5 20-20.5 02/01/02 493+40 ND NV Entech SM8147B OK OK NV NV NV NV NV Lab QC not available.<br />
SB-32-S5 (WET) 20-20.5 02/01/02 493+40<br />
0.49<br />
As: ND Entech WM8159B OK OK OK OK OK na na<br />
SB-32-W01 -- 02/01/02 493+40 mg/L Entech WM8158 OK OK OK OK OK N/A N/A<br />
SB-32E 1.5-2 02/01/02 493+40 5.1 NV Entech SM8147B OK OK NV NV NV NV NV Lab QC not available.<br />
SB-32W 1.5-2 02/01/02 493+40 5.0 NV Entech SM8147B OK OK NV NV NV NV NV Lab QC not available.<br />
SB-33-S1 1.5-2 02/01/02 503+45 na NV naNV na NV naNV Entech SM8147B OK OK NV NV NV NV NV Only copper analyzed.<br />
SB-33-S2 4.5-5 02/01/02 503+45 na NV naNV na NV naNV Entech SM8147B OK OK NV NV NV NV NV Only copper analyzed.<br />
SB-33-S3 10-10.5 02/01/02 503+45 ND NV Entech SM8147B OK OK NV NV NV NV NV Lab QC not available.<br />
SB-33-S3 (WET) 10-10.5 02/01/02 503+45 As: ND Entech WM8159B OK OK OK OK OK na na<br />
SB-33-S4 15-15.5 02/01/02 503+45 ND NV Entech SM8147B OK OK NV NV NV NV NV Lab QC not available.<br />
SB-33-S4 (WET) 15-15.5 02/01/02 503+45 As: ND Entech WM8159B OK OK OK OK OK na na<br />
SB-33-S4 (TCLP) 15-15.5 02/01/02 503+45 As: ND NV Entech WM8153B OK OK NV NV NV NV NV Lab QC not available.<br />
SB-33-S5 19-19.5 02/01/02 503+45 6.6 NV Entech SM8147B OK OK NV NV NV NV NV Lab QC not available.<br />
SB-33-S5 (WET) 19-19.5 02/01/02 503+45<br />
0.29<br />
As: ND Entech WM8159B OK OK OK OK OK na na<br />
SB-33-W01 -- 02/01/02 503+45 mg/L Entech WM8158 OK OK OK OK OK N/A N/A<br />
SB-33E 1.5-2 02/01/02 503+45 ND NV Entech SM8147B OK OK NV NV NV NV NV Lab QC not available.<br />
101248- Table A-3 QC 2002 Line Segment Metals Data.xls - July 2008 Page 5 of 9<br />
Chain of Custody Complete<br />
Metals Holding Time<br />
Sample Information<br />
Location Depth (feet below ground surface)<br />
Number<br />
Station<br />
Sample<br />
Collection<br />
Date Approx.<br />
Total Arsenic (mg/kg)<br />
Qualifier for Total Arsenic<br />
Total Lead (mg/kg)<br />
Table A-3 Quality Control Review for Samples Collected by Earth Tech for <strong>VTA</strong> during ROW Acquisition - Metals<br />
Laboratory Analyses and Qualifiers<br />
Qualifier for Total Lead<br />
WET for As, Pb, and/or Cu<br />
(mg/L)<br />
Qualifier for WET As, Pb, and/or<br />
Cu<br />
TCLP for As and/or Pb (mg/L)<br />
Qualifier for TCLP As and/or Pb<br />
CAM 17 Metals (mg/kg)<br />
Qualifier for Other Than Total<br />
Arsenic or Total Lead<br />
Quality Control Batch Number<br />
(Sample Daily Group)<br />
Evaluation of Quality Control (QC) Data Acceptability<br />
SB-33W 1.5-2 02/01/02 503+45 ND NV Entech SM8147B OK OK NV NV NV NV NV Lab QC not available.<br />
Investigation of Off-Ballast Concerns in Alameda County<br />
ETAN-03-S1 1.5-2 02/07/02 138+30 84.3 80.2 Torrent ICP0202 13A1/15B1 OK OK OK OK OK OK OK Pb: QC Bath # ICP 020219<br />
Investigation of Aerially Deposited Lead Concerns<br />
Sb: J-<br />
Sb: MS=59.3% vs. 64.0%<br />
MSD=53.0% vs. 64.0%<br />
(biased low)<br />
Ba: MS=59.8% vs. 75.0%<br />
MSD=60.2% vs. 75.0%<br />
ETAL-01-S1 0-0.5 01/23/02 167+00 15<br />
Ba: J- Entech SM8144 OK OK OK OK OK OK (biased low)<br />
Sb: MS=59.3% vs. 64.0%<br />
MSD=53.0% vs. 64.0%<br />
(biased low)<br />
Ba: MS=59.8% vs. 75.0%<br />
Sb: J-<br />
MSD=60.2% vs. 75.0%<br />
ETAL-01-S2 1-1.5 01/23/02 167+00 17<br />
Ba: J- Entech SM8144 OK OK OK OK OK OK (biased low)<br />
Sb: MS=59.3% vs. 64.0%<br />
MSD=53.0% vs. 64.0%<br />
(biased low)<br />
Ba: MS=59.8% vs. 75.0%<br />
Sb: J-<br />
MSD=60.2% vs. 75.0%<br />
ETAL-02-S1 0-0.5 01/23/02 168+00 26<br />
Ba: J- Entech SM8144 OK OK OK OK OK OK (biased low)<br />
Sb: MS=59.3% vs. 64.0%<br />
MSD=53.0% vs. 64.0%<br />
(biased low)<br />
Ba: MS=59.8% vs. 75.0%<br />
Sb: J-<br />
MSD=60.2% vs. 75.0%<br />
ETAL-02-S2 1-1.5 01/23/02 168+00 15<br />
Ba: J- Entech SM8144 OK OK OK OK OK OK (biased low)<br />
Sb: MS=59.3% vs. 64.0%<br />
MSD=53.0% vs. 64.0%<br />
(biased low)<br />
Ba: MS=59.8% vs. 75.0%<br />
Sb: J-<br />
MSD=60.2% vs. 75.0%<br />
ETAL-03-S1 0-0.5 01/23/02 519+50 55<br />
Ba: J- Entech SM8144 OK OK OK OK OK OK (biased low)<br />
101248- Table A-3 QC 2002 Line Segment Metals Data.xls - July 2008 Page 6 of 9<br />
Chain of Custody Complete<br />
Metals Holding Time<br />
Sample Information<br />
Location Depth (feet below ground surface)<br />
Sample<br />
Collection<br />
Date Approx. Station Number<br />
Total Arsenic (mg/kg)<br />
Qualifier for Total Arsenic<br />
Total Lead (mg/kg)<br />
ETAL-03-S2 1-1.5 01/23/02 519+50 56<br />
Table A-3 Quality Control Review for Samples Collected by Earth Tech for <strong>VTA</strong> during ROW Acquisition - Metals<br />
Laboratory Analyses and Qualifiers<br />
Qualifier for Total Lead<br />
WET for As, Pb, and/or Cu<br />
(mg/L)<br />
Qualifier for WET As, Pb, and/or<br />
Cu<br />
TCLP for As and/or Pb (mg/L)<br />
Qualifier for TCLP As and/or Pb<br />
CAM 17 Metals (mg/kg)<br />
Qualifier for Other Than Total<br />
Arsenic or Total Lead<br />
Quality Control Batch Number<br />
(Sample Daily Group)<br />
Evaluation of Quality Control (QC) Data Acceptability<br />
Chain of Custody Complete<br />
Metals Holding Time<br />
Sample Information<br />
Location Depth (feet below ground surface)<br />
Sample<br />
Collection<br />
Date Approx. Station Number<br />
Total Arsenic (mg/kg)<br />
Qualifier for Total Arsenic<br />
Total Lead (mg/kg)<br />
Table A-3 Quality Control Review for Samples Collected by Earth Tech for <strong>VTA</strong> during ROW Acquisition - Metals<br />
Laboratory Analyses and Qualifiers<br />
Qualifier for Total Lead<br />
WET for As, Pb, and/or Cu<br />
(mg/L)<br />
Qualifier for WET As, Pb, and/or<br />
Cu<br />
TCLP for As and/or Pb (mg/L)<br />
Qualifier for TCLP As and/or Pb<br />
CAM 17 Metals (mg/kg)<br />
Qualifier for Other Than Total<br />
Arsenic or Total Lead<br />
Quality Control Batch Number<br />
(Sample Daily Group)<br />
Evaluation of Quality Control (QC) Data Acceptability<br />
ETSS-09-1 0-0.5 01/11/02 266+50 4.00 14.9 Torrent ICP020125 A1 OK OK OK OK OK na na<br />
ETSS-09-2 1-1.5 01/11/02 266+50 8.72 54.1 Torrent ICP020125 A1 OK OK OK OK OK na na<br />
ETSS-09-2 (WET) 1-1.5 01/11/02 266+50<br />
Chain of Custody Complete<br />
Metals Holding Time<br />
Sample Information<br />
Total Arsenic (mg/kg)<br />
Qualifier for Total Arsenic<br />
Total Lead (mg/kg)<br />
Table A-3 Quality Control Review for Samples Collected by Earth Tech for <strong>VTA</strong> during ROW Acquisition - Metals<br />
Laboratory Analyses and Qualifiers<br />
Qualifier for Total Lead<br />
WET for As, Pb, and/or Cu<br />
(mg/L)<br />
Qualifier for WET As, Pb, and/or<br />
Cu<br />
TCLP for As and/or Pb (mg/L)<br />
Qualifier for TCLP As and/or Pb<br />
CAM 17 Metals (mg/kg)<br />
Qualifier for Other Than Total<br />
Arsenic or Total Lead<br />
Quality Control Batch Number<br />
(Sample Daily Group)<br />
Evaluation of Quality Control (QC) Data Acceptability<br />
surface)<br />
ground<br />
Number<br />
below (feet<br />
Station<br />
Depth<br />
Approx.<br />
Location<br />
ETSS-11-1 (s)<br />
Sample<br />
Collection<br />
Date<br />
As: 0.511<br />
Pb: MS=56% vs.<br />
(TCLP) 1-1.5 01/07/02 458+60<br />
Pb: 1.36 Pb: J- Torrent ICP020204 A1<br />
85%, biased low na na<br />
ETSS-11-2 2-2.5 01/07/02 458+60 ND 6.11 x Torrent ICP020117A1/B1 OK OK OK OK OK na na<br />
ETSS-12-1 1-1.5 01/08/02 545+55 258 30.0 x Torrent ICP020121A1/B1 OK OK OK OK OK na na<br />
ETSS-12-1 (WET) 1-1.5 01/08/02 545+55<br />
As: 5.14<br />
Pb: 0.828 Torrent ICP020128 A1 OK OK OK OK OK na na<br />
ETSS-12-2 2-2.5 01/08/02 545+55 ND 4.91 x Torrent ICP020121A1/B1 OK OK OK OK OK na na<br />
Notes:<br />
1LCS/LCSD<br />
= laboratory control spike/LCS duplicate<br />
2<br />
RPD = Relative Percent Difference<br />
3<br />
MS/MSD = matrix spike/MS duplicate<br />
4<br />
na = Not analyzed<br />
5<br />
ND = Not detected above laboratory limits<br />
6<br />
J- = Estimated, biased low<br />
7<br />
NV= Data not validated due to unrecoverable laboratory QC information. Data considered screening level for the purposes of this report.<br />
8 N/A = not applicable<br />
9 g = gravel<br />
10 s = sand<br />
101248- Table A-3 QC 2002 Line Segment Metals Data.xls - July 2008 Page 9 of 9<br />
Chain of Custody Complete<br />
Metals Holding Time<br />
Sample ID Depth (feet below ground surface)<br />
Sample Information<br />
Sample Collection Date<br />
Approx. Station Number<br />
Investigation of Warm Springs Extension<br />
ETAN-01-1 1.5-2 2/17/02<br />
VOCs (mg/kg)<br />
SVOCs (mg/kg)<br />
ETAN-02-1 0.0-0.5 2/17/02 x x J+: Pesticides<br />
ETAN-02-2 1.5-2 2/17/02<br />
ETSS-01-1 0.5-1 1//08/02<br />
ETSS-01-2 1-1.5 1//08/02 x<br />
ETSS-01-3 2-2.5 1//08/02<br />
ETSS-02-1 1-1.5 1//08/02<br />
ETSS-02-2 2-2.5 1//08/02<br />
ETSS-03-1 1-1.5 1/10/02<br />
ETSS-03-2 1.5-2 1/10/02<br />
ETSS-04-1 1-1.5 1/10/02<br />
ETSS-04-2 1.67-2 1/10/02<br />
Investigation of BART-Specific Concerns<br />
SB-01-1 1.5-2 12/26/01 280+50 x x<br />
SB-03-1 1.5-2 12/26/01 348+00 x x<br />
SB-03-2 10-10.5 12/26/01 348+00 x<br />
SB-03-3 20.5-21.5 12/26/01 348+00 x<br />
SB-04-1 1.5-2 12/27/01 351+60 x x<br />
SB-04-2 9.5-10 12/27/01 351+60 x<br />
SB-04-3 19.5-20 12/27/01 351+60 x<br />
TPH-G (mg/kg)<br />
Laboratory Analyses & Qualifiers<br />
MTBE + BTEX (mg/kg)<br />
TPH-D (mg/kg)<br />
TEPH (mg/kg)<br />
Organochlorine pesticides (mg/kg)<br />
PCBs (mg/kg)<br />
Organic Lead (mg/kg)<br />
TOC (mg/kg)<br />
Qualifiers<br />
Table A-4 Quality Control Review for Samples Collected by Earth Tech for <strong>VTA</strong> during ROW Acquisition - Organics<br />
Laboratory Project No./<br />
Order ID No.<br />
VOCs Holding Time<br />
VOCs Surrogate Spike<br />
VOCs Method Blank<br />
VOCs LCS/LCSD 1 /RPD 2<br />
VOCs MS/MSD 3 /RPD<br />
TEPH Holding Time<br />
TEPH Surrogate Spike<br />
Evaluation of Quality Control Data Acceptability<br />
TEPH Method Blank<br />
TEPH LCS/LCSD/RPD<br />
TPH-G Holding Time<br />
TPH-G Surrogate Spike<br />
Torrent<br />
020207007 na na na na na na na na na na na na na na na na na na na na na na na na na na na na na<br />
Torrent<br />
LC<br />
SD:<br />
Diel<br />
drin<br />
153<br />
%<br />
vs<br />
020207007<br />
130<br />
1297<br />
Torrent<br />
na na na na na na na na na na na na na na na na na OK OK OK % OK OK OK na na na na na<br />
020207007<br />
Torrent<br />
na na na na na na na na na na na na na na na na na na na na na na na na na na na na na<br />
020109017<br />
Torrent<br />
na na na na na na na na na na na na na na na na na na na na na na na na na na na na na<br />
020109017<br />
Torrent<br />
na na na na na OK OK OK OK na na na na na na na na na na na na na na na na na na na na<br />
020109017<br />
Torrent<br />
na na na na na na na na na na na na na na na na na na na na na na na na na na na na na<br />
020109017<br />
Torrent<br />
na na na na na na na na na na na na na na na na na na na na na na na na na na na na na<br />
020109017<br />
Torrent<br />
na na na na na na na na na na na na na na na na na na na na na na na na na na na na na<br />
020110020<br />
Torrent<br />
na na na na na na na na na na na na na na na na na na na na na na na na na na na na na<br />
020110020<br />
Torrent<br />
na na na na na na na na na na na na na na na na na na na na na na na na na na na na na<br />
020110020<br />
Torrent<br />
na na na na na na na na na na na na na na na na na na na na na na na na na na na na na<br />
020110020 na na na na na na na na na na na na na na na na na na na na na na na na na na na na na<br />
Torrent<br />
011227085 OK OK OK OK OK OK OK OK OK na 4<br />
Torrent<br />
na na na na na na na na na na na na na na na na na na na<br />
011227085<br />
Torrent<br />
OK OK OK OK OK OK OK OK OK na na na na na na na na na na na na na na na na na na na na<br />
011227085<br />
Torrent<br />
OK OK OK OK OK na na na na na na na na na na na na na na na na na na na na na na na na<br />
011227085<br />
Torrent<br />
OK OK OK OK OK na na na na na na na na na na na na na na na na na na na na na na na na<br />
011227085<br />
Torrent<br />
OK OK OK OK OK OK OK OK OK na na na na na na na na na na na na na na na na na na na na<br />
011227085<br />
Torrent<br />
OK OK OK OK OK na na na na na na na na na na na na na na na na na na na na na na na na<br />
011227085 OK OK OK OK OK na na na na na na na na na na na na na na na na na na na na na na na na<br />
101248- Table A-4 QC 2002 Line Segment Organics Data.xls - July 2008 Page 1 of 7<br />
TPH-G Method Blank<br />
TPH-G LCS/LCSD/RPD<br />
MTBE & BTEX Holding Time<br />
MTBE & BTEX Surrogate Spike<br />
MTBE & BTEX Method Blank<br />
MTBE & BTEX LCS/LCSD/RPD<br />
Organochlorine Pesticides Holding Time<br />
Organochlorine Pesticides Surrogate Spike<br />
Organochlorine Pesticides Method Blank<br />
Organochlorine Pesticides LCS/LCSD/RPD<br />
PCBs Holding Time<br />
PCBs Surrogate Spike<br />
PCBs Method Blank<br />
PCBs LCS/LCSD/RPD<br />
TOC Holding Time<br />
TOC Surrogate Spike<br />
TOC Method Blank<br />
TOC LCS/LCSD/RPD
Sample ID Depth (feet below ground surface)<br />
Sample Information<br />
Sample Collection Date<br />
SB-05-1 1.5-2 12/26/01 355+00 x x<br />
Approx. Station Number<br />
VOCs (mg/kg)<br />
SVOCs (mg/kg)<br />
TPH-G (mg/kg)<br />
Laboratory Analyses & Qualifiers<br />
SB-05-2 15.5-16 12/26/01 355+00 x x<br />
MTBE + BTEX (mg/kg)<br />
TPH-D (mg/kg)<br />
TEPH (mg/kg)<br />
Organochlorine pesticides (mg/kg)<br />
PCBs (mg/kg)<br />
Organic Lead (mg/kg)<br />
TOC (mg/kg)<br />
Qualifiers<br />
J 5 : TOC<br />
J- 6 : VOCs<br />
SB-06-1 1.5-2 12/27/01 357+55 x x J-: VOCs<br />
SB-06-2 10-10.5 12/27/01 357+55<br />
SB-06-3 14-14.5 12/27/01 357+55 x J+ 7 : VOCs<br />
SB-07-1 1.5-2 12/27/01 360+00 x x<br />
SB-07-2 14.5-15 12/27/01 360+00 x<br />
BAL-08-1 1-1.5 12/27/01 364+10<br />
SB-08-1 1.5-2 12/27/01 364+10 x x<br />
SB-08-2 13.5-14 12/27/01 364+10 x<br />
SB-08-3 16-16.5 12/27/01 364+10 x x<br />
SB-09-1 1.5-2 12/27/01 373+75 x x<br />
SB-09-2 17-17.5 12/27/01 373+75<br />
SB-10-1 1.5-2 12/26/01 376+10 x x<br />
SB-10-2 15.5-16 12/26/01 376+10<br />
SB-11-2 1.5-2 01/02/02 386+20 x x J-: VOCs<br />
SB-11-3 5-5.5 01/02/02 386+20<br />
SB-11-4 18-18.5 01/02/02 386+20 x x x J-: TPH-G<br />
SB-12-1 1.5-2 12/28/01 404+95 x x J-: VOCs<br />
Table A-4 Quality Control Review for Samples Collected by Earth Tech for <strong>VTA</strong> during ROW Acquisition - Organics<br />
Laboratory Project No./<br />
Order ID No.<br />
VOCs Holding Time<br />
VOCs Surrogate Spike<br />
VOCs Method Blank<br />
VOCs LCS/LCSD 1 /RPD 2<br />
VOCs MS/MSD 3 /RPD<br />
TEPH Holding Time<br />
TEPH Surrogate Spike<br />
Evaluation of Quality Control Data Acceptability<br />
TEPH Method Blank<br />
TEPH LCS/LCSD/RPD<br />
TPH-G Holding Time<br />
TPH-G Surrogate Spike<br />
Torrent<br />
011227085 OK OK OK OK OK OK OK OK OK na na na na na na na na na na na na na na na na na na na na<br />
Torrent<br />
011227085<br />
/-R1 OK<br />
4-BFB =55%<br />
vs. 65%<br />
(biased low) OK OK OK na na na na na na na na na na na na na na na na na na na na OK<br />
TPH-G Method Blank<br />
TPH-G LCS/LCSD/RPD<br />
MTBE & BTEX Holding Time<br />
MTBE & BTEX Surrogate Spike<br />
MTBE & BTEX Method Blank<br />
MTBE & BTEX LCS/LCSD/RPD<br />
Organochlorine Pesticides Holding Time<br />
Organochlorine Pesticides Surrogate Spike<br />
Organochlorine Pesticides Method Blank<br />
Organochlorine Pesticides LCS/LCSD/RPD<br />
PCBs Holding Time<br />
PCBs Surrogate Spike<br />
PCBs Method Blank<br />
PCBs LCS/LCSD/RPD<br />
TOC Holding Time<br />
TOC Surrogate Spike<br />
TOC Method Blank<br />
TOC LCS/LCSD/RPD<br />
unknown<br />
OK OK<br />
Torrent<br />
4-BFB =59%<br />
vs. 65%<br />
011227085<br />
Torrent<br />
OK (biased low) OK OK OK OK OK OK OK na na na na na na na na na na na na na na na na na na na na<br />
011227085 na na<br />
Dibromofluor<br />
omethane<br />
=139% vs.<br />
na na na na na na na na na na na na na na na na na na na na na na na na na na na<br />
Torrent<br />
135%<br />
011227085<br />
Torrent<br />
OK (biased high) OK OK OK na na na na na na na na na na na na na na na na na na na na na na na na<br />
011227085<br />
Torrent<br />
OK OK OK OK OK OK OK OK OK na na na na na na na na na na na na na na na na na na na na<br />
011227085<br />
Torrent<br />
OK OK OK OK OK na na na na na na na na na na na na na na na na na na na na na na na na<br />
011227085<br />
Torrent<br />
na na na na na na na na na na na na na na na na na na na na na na na na na na na na na<br />
011227085<br />
Torrent<br />
OK OK OK OK OK OK OK OK OK na na na na na na na na na na na na na na na na na na na na<br />
011227085<br />
Torrent<br />
OK OK OK OK OK na na na na na na na na na na na na na na na na na na na na na na na na<br />
01122708<br />
un-<br />
/-R1<br />
Torrent<br />
OK OK OK OK OK na na na na na na na na na na na na na na na na na na na na OK known OK OK<br />
011227085<br />
Torrent<br />
OK OK OK OK OK OK OK OK OK na na na na na na na na na na na na na na na na na na na na<br />
011227085<br />
Torrent<br />
na na na na na na na na na na na na na na na na na na na na na na na na na na na na na<br />
011227085<br />
Torrent<br />
OK OK OK OK OK OK OK OK OK na na na na na na na na na na na na na na na na na na na na<br />
011227085 na na na na na na na na na na na na na na na na na na na na na na na na na na na na na<br />
LCSD MSD<br />
1,1-DCE =62% 1,1-DCE =72%<br />
Torrent<br />
vs. 75% vs. 75%<br />
020103003<br />
Torrent<br />
OK OK OK (biased low) (biased low) OK OK OK OK na na na na na na na na na na na na na na na na na na na na<br />
020103003 na na na na na na na na na na na<br />
TFT =64%<br />
na na na na na na na na na na na na na na na na na na<br />
Torrent<br />
vs. 65%<br />
020103003R1 OK OK OK OK OK OK OK OK OK OK (biased low) OK OK na na na na na na na na na na na na na na na na<br />
LCSD MSD<br />
1,1-DCE =62% 1,1-DCE =72%<br />
Torrent<br />
vs. 75% vs. 75%<br />
020102001 OK OK OK (biased low) (biased low) OK OK OK OK na na na na na na na na na na na na na na na na na na na na<br />
101248- Table A-4 QC 2002 Line Segment Organics Data.xls - July 2008 Page 2 of 7
Sample ID Depth (feet below ground surface)<br />
Sample Information<br />
Sample Collection Date<br />
SB-12-2 10.5-11.5 12/28/01 404+95 x x x<br />
Approx. Station Number<br />
VOCs (mg/kg)<br />
SVOCs (mg/kg)<br />
TPH-G (mg/kg)<br />
Laboratory Analyses & Qualifiers<br />
SB-13-1 1.5-2 12/28/01 414+80 x x x x<br />
SB-13-2 18-19 12/28/01 414+80 x x x<br />
MTBE + BTEX (mg/kg)<br />
TPH-D (mg/kg)<br />
TEPH (mg/kg)<br />
Organochlorine pesticides (mg/kg)<br />
PCBs (mg/kg)<br />
Organic Lead (mg/kg)<br />
TOC (mg/kg)<br />
Qualifiers<br />
J-: VOCs,<br />
TEPH<br />
J-:<br />
Organochlorine<br />
Pesticides<br />
PCBs<br />
J: VOCs<br />
J-: TEPH,<br />
TPH-G<br />
SB-14-2 1.5-2 01/02/02 422+75 x x J-: VOCs<br />
SB-14-3 5-5.5 01/02/02 422+75<br />
SB-14-4 18-18.5 01/02/02 422+75 x x x<br />
J+: VOCs<br />
J-: TPH-G<br />
SB-15-1 1.5-2 01/02/02 453+90 x x J: VOCs<br />
SB-15-2 5-5.5 01/02/02 453+90<br />
SB-16-1 1.5-2 01/02/02 466+30 x x J-: VOCs<br />
SB-16-2 5-5.5 01/02/02 466+30<br />
SB-17-1 1.5-2 01/03/02 476+15 x x x x J-: VOCs<br />
SB-17-2 5-5.5 01/03/02 476+15<br />
SB-17-W01 -- 01/03/02 476+15 x x x x<br />
Table A-4 Quality Control Review for Samples Collected by Earth Tech for <strong>VTA</strong> during ROW Acquisition - Organics<br />
Laboratory Project No./<br />
Order ID No.<br />
Torrent<br />
020102001R1<br />
VOCs Holding Time<br />
VOCs Surrogate Spike<br />
VOCs Method Blank<br />
VOCs LCS/LCSD 1 /RPD 2<br />
VOCs MS/MSD 3 /RPD<br />
16 day<br />
(12/28<br />
- 1/13)<br />
vs.<br />
14 day OK OK OK OK<br />
TEPH Holding Time<br />
TEPH Surrogate Spike<br />
Evaluation of Quality Control Data Acceptability<br />
TEPH Method Blank<br />
TEPH LCS/LCSD/RPD<br />
TPH-G Holding Time<br />
TPH-G Surrogate Spike<br />
TPH-G Method Blank<br />
TPH-G LCS/LCSD/RPD<br />
MTBE & BTEX Holding Time<br />
MTBE & BTEX Surrogate Spike<br />
MTBE & BTEX Method Blank<br />
MTBE & BTEX LCS/LCSD/RPD<br />
Organochlorine Pesticides Holding Time<br />
15 day<br />
(12/28/01<br />
-1/11/02)<br />
vs.<br />
14 day OK OK OK OK OK OK OK na na na na na na na na na na na na na na na na<br />
16 day tetrachloro<br />
16 day tetrachloro<br />
(12/28/01--m-xylene<br />
(12/28/01--m-xylene<br />
1/12/02) =48%<br />
1/12/02) =48%<br />
Torrent<br />
vs. vs. 60%<br />
vs. vs. 60%<br />
020102001 OK OK OK OK OK OK OK OK OK na na na na na na na na 14 day (biased low) OK OK 14 day (biased low) OK OK na na na na<br />
16 day Dibromofluor<br />
15 day<br />
(12/28 omethane =<br />
(12/28/01<br />
-> 1/13) 161% vs.<br />
-1/11/02)<br />
TFT =60%<br />
Torrent vs. 135%<br />
vs.<br />
vs. 65%<br />
020102001R1 14 day (biased high) OK OK OK 14 day OK OK OK OK (biased low) OK OK na na na na na na na na na na na na na na na na<br />
LCSD MSD<br />
1,1-DCE =62% 1,1-DCE =72%<br />
Torrent<br />
vs. 75% vs. 75%<br />
020103003<br />
Torrent<br />
OK OK OK (biased low) (biased low) OK OK OK OK na na na na na na na na na na na na na na na na na na na na<br />
020103003 na na<br />
Dibromofluor<br />
omethane =<br />
na na na na na na na na na na na na na na na na na na na na na na na na na na na<br />
175% vs.<br />
TFT =46%<br />
Torrent<br />
135%<br />
vs. 65%<br />
020103003R1 OK (biased high)<br />
Dibromofluor<br />
OK OK OK OK OK OK OK OK (biased low) OK OK na na na na na na na na na na na na na na na na<br />
omethane = LCSD MSD<br />
147% vs. 1,1-DCE =62% 1,1-DCE =72%<br />
Torrent<br />
135% (biased vs. 75% vs. 75%<br />
020103003<br />
Torrent<br />
OK high) OK (biased low) (biased low) OK OK OK OK na na na na na na na na na na na na na na na na na na na na<br />
020103003 na na na na na na na na na na na na na na na na na na na na na na na na na na na na na<br />
LCSD MSD<br />
1,1-DCE =62% 1,1-DCE =72%<br />
Torrent<br />
vs. 75% vs. 75%<br />
020103003<br />
Torrent<br />
OK OK OK (biased low) (biased low) OK OK OK OK na na na na na na na na na na na na na na na na na na na na<br />
020103003 na na na na na na na na na na na na na na na na na na na na na na na na na na na na na<br />
LCSD MSD<br />
1,1-DCE =62% 1,1-DCE =72%<br />
Torrent<br />
vs. 75% vs. 75%<br />
020103004<br />
Torrent<br />
OK OK OK (biased low) (biased low) OK OK OK OK na na na na na na na na OK OK OK OK OK OK OK OK na na na na<br />
020103004<br />
Torrent<br />
na na na na na na na na na na na na na na na na na na na na na na na na na na na na na<br />
020103004 OK OK OK OK OK OK OK OK OK OK OK OK OK OK OK OK OK na na na na na na na na na na na na<br />
101248- Table A-4 QC 2002 Line Segment Organics Data.xls - July 2008 Page 3 of 7<br />
Organochlorine Pesticides Surrogate Spike<br />
Organochlorine Pesticides Method Blank<br />
Organochlorine Pesticides LCS/LCSD/RPD<br />
PCBs Holding Time<br />
PCBs Surrogate Spike<br />
PCBs Method Blank<br />
PCBs LCS/LCSD/RPD<br />
TOC Holding Time<br />
TOC Surrogate Spike<br />
TOC Method Blank<br />
TOC LCS/LCSD/RPD
Sample ID Depth (feet below ground surface)<br />
Sample Information<br />
Sample Collection Date<br />
Approx. Station Number<br />
VOCs (mg/kg)<br />
SVOCs (mg/kg)<br />
TPH-G (mg/kg)<br />
Laboratory Analyses & Qualifiers<br />
SB-18-1 1.5-2 01/03/02 485+90 x x J-: VOCs<br />
SB-18-2 5-5.5 01/03/02 485+90<br />
SB-19-1 1.5-2 01/03/02 493+40 x x J-: VOCs<br />
SB-19-2 5-5.5 01/03/02 493+40<br />
SB-20-1 1.5-2 01/03/02 498+55 x x J-: VOCs<br />
SB-20-2 5-5.5 01/03/02 498+55<br />
SB-21-1 1.5-2 01/03/02 503+45 x x J-: VOCs<br />
SB-21-2 5-5.5 01/03/02 503+45<br />
SB-29-S1 4.5-5 01/31/02 364+10<br />
SB-29-S2 8.5-9 01/31/02 364+10<br />
SB-29-S3 14-14.5 01/31/02 364+10 x<br />
SB-29-S4 18-18.5 01/31/02 364+10 x<br />
SB-29-W01 -- 01/31/02 364+10 x x<br />
SB-29E 1.5-2 01/31/02 364+10<br />
SB-30-S1 1.5-2 01/31/02 393+90<br />
SB-30-S2 5-5.5 01/31/02 393+90<br />
SB-30-S3 10-10.5 01/31/02 393+90<br />
SB-30-S4 15-15.5 01/31/02 393+90<br />
SB-30-S5 21-21.5 01/31/02 393+90 x x<br />
SB-30-W01 -- 01/31/02 393+90 x<br />
SB-30E 1.5-2 01/31/02 393+90<br />
MTBE + BTEX (mg/kg)<br />
TPH-D (mg/kg)<br />
TEPH (mg/kg)<br />
Organochlorine pesticides (mg/kg)<br />
PCBs (mg/kg)<br />
Organic Lead (mg/kg)<br />
TOC (mg/kg)<br />
Qualifiers<br />
Table A-4 Quality Control Review for Samples Collected by Earth Tech for <strong>VTA</strong> during ROW Acquisition - Organics<br />
Laboratory Project No./<br />
Order ID No.<br />
VOCs Holding Time<br />
VOCs Surrogate Spike<br />
VOCs Method Blank<br />
VOCs LCS/LCSD 1 /RPD 2<br />
VOCs MS/MSD 3 /RPD<br />
TEPH Holding Time<br />
TEPH Surrogate Spike<br />
Evaluation of Quality Control Data Acceptability<br />
TEPH Method Blank<br />
TEPH LCS/LCSD/RPD<br />
TPH-G Holding Time<br />
TPH-G Surrogate Spike<br />
LCSD MSD<br />
1,1-DCE =62% 1,1-DCE =72%<br />
Torrent<br />
vs. 75% vs. 75%<br />
020103004<br />
Torrent<br />
OK OK OK (biased low) (biased low) OK OK OK OK na na na na na na na na na na na na na na na na na na na na<br />
020103004 na na na na na na na na na na na na na na na na na na na na na na na na na na na na na<br />
LCSD MSD<br />
1,1-DCE =62% 1,1-DCE =72%<br />
Torrent<br />
vs. 75% vs. 75%<br />
020103004<br />
Torrent<br />
OK OK OK (biased low) (biased low) OK OK OK OK na na na na na na na na na na na na na na na na na na na na<br />
020103004<br />
Entech<br />
na na na na na na na na na na na na na na na na na na na na na na na na na na na na na<br />
28751<br />
Entech<br />
na na na na na na na na na na na na na na na na na na na na na na na na na na na na na<br />
28751<br />
Entech<br />
na na na na na na na na na na na na na na na na na na na na na na na na na na na na na<br />
28751<br />
Entech<br />
OK OK OK OK na na na na na na na na na na na na na na na na na na na na na na na na na<br />
28751<br />
Entech<br />
OK OK OK OK na na na na na na na na na na na na na na na na na na na na na na na na na<br />
28751<br />
Entech<br />
OK OK OK OK na OK OK OK OK na na na na na na na na na na na na na na na na na na na na<br />
28751<br />
Entech<br />
na na na na na na na na na na na na na na na na na na na na na na na na na na na na na<br />
28751<br />
Entech<br />
na na na na na na na na na na na na na na na na na na na na na na na na na na na na na<br />
28751<br />
Entech<br />
na na na na na na na na na na na na na na na na na na na na na na na na na na na na na<br />
28751<br />
Entech<br />
na na na na na na na na na na na na na na na na na na na na na na na na na na na na na<br />
28751<br />
Entech<br />
na na na na na na na na na na na na na na na na na na na na na na na na na na na na na<br />
28751<br />
Entech<br />
OK OK OK OK na OK OK OK OK na na na na na na na na na na na na na na na na na na na na<br />
28751<br />
Entech<br />
OK OK OK OK na na na na na na na na na na na na na na na na na na na na na na na na na<br />
28751 na na na na na na na na na na na na na na na na na na na na na na na na na na na na na<br />
101248- Table A-4 QC 2002 Line Segment Organics Data.xls - July 2008 Page 4 of 7<br />
TPH-G Method Blank<br />
TPH-G LCS/LCSD/RPD<br />
MTBE & BTEX Holding Time<br />
MTBE & BTEX Surrogate Spike<br />
MTBE & BTEX Method Blank<br />
MTBE & BTEX LCS/LCSD/RPD<br />
Organochlorine Pesticides Holding Time<br />
Organochlorine Pesticides Surrogate Spike<br />
Organochlorine Pesticides Method Blank<br />
Organochlorine Pesticides LCS/LCSD/RPD<br />
PCBs Holding Time<br />
PCBs Surrogate Spike<br />
PCBs Method Blank<br />
PCBs LCS/LCSD/RPD<br />
TOC Holding Time<br />
TOC Surrogate Spike<br />
TOC Method Blank<br />
TOC LCS/LCSD/RPD
Sample ID Depth (feet below ground surface)<br />
Sample Information<br />
Sample Collection Date<br />
Approx. Station Number<br />
SB-30W 1.5-2 01/31/02 393+90<br />
SB-31-S1 1.5-2 01/31/02 409+80<br />
SB-31-S2 5-5.5 01/31/02 409+80<br />
SB-31-S3 10-10.5 01/31/02 409+80<br />
SB-31-S4 14-14.5 01/31/02 409+80<br />
SB-31-S5 17-17.5 01/31/02 409+80 x x<br />
SB-31-W01 -- 01/31/02 409+80 x x<br />
SB-31E 1.5-2 01/31/02 409+80<br />
SB-31W 1.5-2 01/31/02 409+80<br />
SB-32-S1 0.5-1 02/01/02 493+40<br />
SB-32-S2 4.5-5 02/01/02 493+40<br />
SB-32-S3 10-10.5 02/01/02 493+40<br />
SB-32-S4 15-15.5 02/01/02 493+40<br />
SB-32-S5 20-20.5 02/01/02 493+40 x x<br />
SB-32-W01 -- 02/01/02 493+40 x x<br />
SB-32E 1.5-2 02/01/02 493+40<br />
SB-32W 1.5-2 02/01/02 493+40<br />
SB-33-S1 1.5-2 02/01/02 503+45<br />
SB-33-S2 4.5-5 02/01/02 503+45<br />
SB-33-S3 10-10.5 02/01/02 503+45<br />
SB-33-S4 15-15.5 02/01/02 503+45<br />
SB-33-S5 19-19.5 02/01/02 503+45 x x<br />
SB-33-W01 -- 02/01/02 503+45 x x<br />
SB-33E 1.5-2 02/01/02 503+45<br />
SB-33W 1.5-2 02/01/02 503+45<br />
VOCs (mg/kg)<br />
SVOCs (mg/kg)<br />
TPH-G (mg/kg)<br />
Laboratory Analyses & Qualifiers<br />
MTBE + BTEX (mg/kg)<br />
TPH-D (mg/kg)<br />
TEPH (mg/kg)<br />
Organochlorine pesticides (mg/kg)<br />
PCBs (mg/kg)<br />
Organic Lead (mg/kg)<br />
TOC (mg/kg)<br />
Qualifiers<br />
Table A-4 Quality Control Review for Samples Collected by Earth Tech for <strong>VTA</strong> during ROW Acquisition - Organics<br />
Laboratory Project No./<br />
Order ID No.<br />
VOCs Holding Time<br />
VOCs Surrogate Spike<br />
VOCs Method Blank<br />
VOCs LCS/LCSD 1 /RPD 2<br />
VOCs MS/MSD 3 /RPD<br />
TEPH Holding Time<br />
TEPH Surrogate Spike<br />
Evaluation of Quality Control Data Acceptability<br />
TEPH Method Blank<br />
TEPH LCS/LCSD/RPD<br />
TPH-G Holding Time<br />
TPH-G Surrogate Spike<br />
Entech<br />
28751<br />
Entech<br />
na na na na na na na na na na na na na na na na na na na na na na na na na na na na na<br />
28751<br />
Entech<br />
na na na na na na na na na na na na na na na na na na na na na na na na na na na na na<br />
28751<br />
Entech<br />
na na na na na na na na na na na na na na na na na na na na na na na na na na na na na<br />
28751<br />
Entech<br />
na na na na na na na na na na na na na na na na na na na na na na na na na na na na na<br />
28751<br />
Entech<br />
na na na na na na na na na na na na na na na na na na na na na na na na na na na na na<br />
28751<br />
Entech<br />
OK OK OK OK na OK OK OK OK na na na na na na na na na na na na na na na na na na na na<br />
28751<br />
Entech<br />
OK OK OK OK na OK OK OK OK na na na na na na na na na na na na na na na na na na na na<br />
28751<br />
Entech<br />
na na na na na na na na na na na na na na na na na na na na na na na na na na na na na<br />
28751<br />
Entech<br />
na na na na na na na na na na na na na na na na na na na na na na na na na na na na na<br />
28760<br />
Entech<br />
na na na na na na na na na na na na na na na na na na na na na na na na na na na na na<br />
28760<br />
Entech<br />
na na na na na na na na na na na na na na na na na na na na na na na na na na na na na<br />
28760<br />
Entech<br />
na na na na na na na na na na na na na na na na na na na na na na na na na na na na na<br />
28760<br />
Entech<br />
na na na na na na na na na na na na na na na na na na na na na na na na na na na na na<br />
28760<br />
Entech<br />
OK OK OK OK OK OK OK OK OK na na na na na na na na na na na na na na na na na na na na<br />
28760<br />
Entech<br />
OK OK OK OK OK OK OK OK OK na na na na na na na na na na na na na na na na na na na na<br />
28760<br />
Entech<br />
na na na na na na na na na na na na na na na na na na na na na na na na na na na na na<br />
28760<br />
Entech<br />
na na na na na na na na na na na na na na na na na na na na na na na na na na na na na<br />
28760<br />
Entech<br />
na na na na na na na na na na na na na na na na na na na na na na na na na na na na na<br />
28760<br />
Entech<br />
na na na na na na na na na na na na na na na na na na na na na na na na na na na na na<br />
28760<br />
Entech<br />
na na na na na na na na na na na na na na na na na na na na na na na na na na na na na<br />
28760<br />
Entech<br />
na na na na na na na na na na na na na na na na na na na na na na na na na na na na na<br />
28760<br />
Entech<br />
OK OK OK OK OK OK OK OK OK na na na na na na na na na na na na na na na na na na na na<br />
28760<br />
Entech<br />
OK OK OK OK OK OK OK OK OK na na na na na na na na na na na na na na na na na na na na<br />
28760<br />
Entech<br />
na na na na na na na na na na na na na na na na na na na na na na na na na na na na na<br />
28760 na na na na na na na na na na na na na na na na na na na na na na na na na na na na na<br />
101248- Table A-4 QC 2002 Line Segment Organics Data.xls - July 2008 Page 5 of 7<br />
TPH-G Method Blank<br />
TPH-G LCS/LCSD/RPD<br />
MTBE & BTEX Holding Time<br />
MTBE & BTEX Surrogate Spike<br />
MTBE & BTEX Method Blank<br />
MTBE & BTEX LCS/LCSD/RPD<br />
Organochlorine Pesticides Holding Time<br />
Organochlorine Pesticides Surrogate Spike<br />
Organochlorine Pesticides Method Blank<br />
Organochlorine Pesticides LCS/LCSD/RPD<br />
PCBs Holding Time<br />
PCBs Surrogate Spike<br />
PCBs Method Blank<br />
PCBs LCS/LCSD/RPD<br />
TOC Holding Time<br />
TOC Surrogate Spike<br />
TOC Method Blank<br />
TOC LCS/LCSD/RPD
Sample ID Depth (feet below ground surface)<br />
Sample Information<br />
Sample Collection Date<br />
Approx. Station Number<br />
VOCs (mg/kg)<br />
SVOCs (mg/kg)<br />
TPH-G (mg/kg)<br />
Investigation of Off-Ballast Concerns in Alameda County<br />
ETAN-03-S1 1.5-2 02/07/02 138+30<br />
Investigation of Aerially Deposited Lead Concerns<br />
ETAL-01-S1 0-0.5 01/23/02 167+00<br />
ETAL-01-S2 1-1.5 01/23/02 167+00<br />
ETAL-02-S1 0-0.5 01/23/02 168+00<br />
ETAL-02-S2 1-1.5 01/23/02 168+00<br />
ETAL-03-S1 0-0.5 01/23/02 519+50<br />
ETAL-03-S2 1-1.5 01/23/02 519+50<br />
Investigation of Ballast Concerns<br />
ETSS-05-1 1-1.5 01/10/02 65+80 x<br />
ETSS-05-2 2-2.5 01/10/02 65+80<br />
ETSS-06-1 1-1.5 01/10/02 105+70<br />
ETSS-06-2 2-2.5 01/10/02 105+70<br />
ETSS-07-1 1-1.5 01/10/02 138+00<br />
ETSS-07-2 2.5-3 01/10/02 138+00<br />
ETSS-08-1 0-0.5 01/11/02 228+65<br />
ETSS-08-2 1-1.5 01/11/02 228+65<br />
ETSS-08-3 2-2.5 01/11/02 228+65<br />
ETSS-09-1 0-0.5 01/11/02 266+50<br />
Laboratory Analyses & Qualifiers<br />
ETSS-09-2 1-1.5 01/11/02 266+50 x J: TEPH<br />
ETSS-09-3 2-2.5 01/11/02 266+50<br />
ETSS-10-1 0-0.5 01/11/02 311+20<br />
ETSS-10-2 1-1.5 01/11/02 311+20 x<br />
ETSS-10-3 2-2.5 01/11/02 311+20<br />
MTBE + BTEX (mg/kg)<br />
TPH-D (mg/kg)<br />
TEPH (mg/kg)<br />
Organochlorine pesticides (mg/kg)<br />
PCBs (mg/kg)<br />
Organic Lead (mg/kg)<br />
TOC (mg/kg)<br />
Qualifiers<br />
Table A-4 Quality Control Review for Samples Collected by Earth Tech for <strong>VTA</strong> during ROW Acquisition - Organics<br />
Laboratory Project No./<br />
Order ID No.<br />
VOCs Holding Time<br />
VOCs Surrogate Spike<br />
VOCs Method Blank<br />
VOCs LCS/LCSD 1 /RPD 2<br />
VOCs MS/MSD 3 /RPD<br />
TEPH Holding Time<br />
TEPH Surrogate Spike<br />
Evaluation of Quality Control Data Acceptability<br />
TEPH Method Blank<br />
TEPH LCS/LCSD/RPD<br />
TPH-G Holding Time<br />
TPH-G Surrogate Spike<br />
Torrent<br />
020207007 na na na na na na na na na na na na na na na na na na na na na na na na na na na na na<br />
Entech<br />
28622<br />
Entech<br />
na na na na na na na na na na na na na na na na na na na na na na na na na na na na na<br />
28622<br />
Entech<br />
na na na na na na na na na na na na na na na na na na na na na na na na na na na na na<br />
28622<br />
Entech<br />
na na na na na na na na na na na na na na na na na na na na na na na na na na na na na<br />
28622<br />
Entech<br />
na na na na na na na na na na na na na na na na na na na na na na na na na na na na na<br />
28622<br />
Entech<br />
na na na na na na na na na na na na na na na na na na na na na na na na na na na na na<br />
28622 na na na na na na na na na na na na na na na na na na na na na na na na na na na na na<br />
Torrent<br />
020110020<br />
Torrent<br />
na na na na na OK OK OK OK na na na na na na na na na na na na na na na na na na na na<br />
020110020<br />
Torrent<br />
na na na na na na na na na na na na na na na na na na na na na na na na na na na na na<br />
020110020<br />
Torrent<br />
na na na na na na na na na na na na na na na na na na na na na na na na na na na na na<br />
020110020<br />
Torrent<br />
na na na na na na na na na na na na na na na na na na na na na na na na na na na na na<br />
020110020<br />
Torrent<br />
na na na na na na na na na na na na na na na na na na na na na na na na na na na na na<br />
020110020<br />
Torrent<br />
na na na na na na na na na na na na na na na na na na na na na na na na na na na na na<br />
02011034<br />
Torrent<br />
na na na na na na na na na na na na na na na na na na na na na na na na na na na na na<br />
02011034<br />
Torrent<br />
na na na na na na na na na na na na na na na na na na na na na na na na na na na na na<br />
02011034<br />
Torrent<br />
na na na na na na na na na na na na na na na na na na na na na na na na na na na na na<br />
02011034 na na na na na na na<br />
Surrogate<br />
na na na na na na na na na na na na na na na na na na na na na na<br />
Torrent<br />
diluted<br />
02011034<br />
Torrent<br />
na na na na na OK out OK OK na na na na na na na na na na na na na na na na na na na na<br />
02011034<br />
Torrent<br />
na na na na na na na na na na na na na na na na na na na na na na na na na na na na na<br />
02011034<br />
Torrent<br />
na na na na na na na na na na na na na na na na na na na na na na na na na na na na na<br />
02011034<br />
Torrent<br />
na na na na na OK OK OK OK na na na na na na na na na na na na na na na na na na na na<br />
02011034 na na na na na na na na na na na na na na na na na na na na na na na na na na na na na<br />
101248- Table A-4 QC 2002 Line Segment Organics Data.xls - July 2008 Page 6 of 7<br />
TPH-G Method Blank<br />
TPH-G LCS/LCSD/RPD<br />
MTBE & BTEX Holding Time<br />
MTBE & BTEX Surrogate Spike<br />
MTBE & BTEX Method Blank<br />
MTBE & BTEX LCS/LCSD/RPD<br />
Organochlorine Pesticides Holding Time<br />
Organochlorine Pesticides Surrogate Spike<br />
Organochlorine Pesticides Method Blank<br />
Organochlorine Pesticides LCS/LCSD/RPD<br />
PCBs Holding Time<br />
PCBs Surrogate Spike<br />
PCBs Method Blank<br />
PCBs LCS/LCSD/RPD<br />
TOC Holding Time<br />
TOC Surrogate Spike<br />
TOC Method Blank<br />
TOC LCS/LCSD/RPD
Sample ID Depth (feet below ground surface)<br />
Sample Information<br />
Sample Collection Date<br />
Approx. Station Number<br />
ETSS-11-1 1-1.5 01/07/02 458+60<br />
ETSS-11-2 2-2.5 01/07/02 458+60<br />
ETSS-12-1 1-1.5 01/08/02 545+55 x<br />
ETSS-12-2 2-2.5 01/08/02 545+55<br />
VOCs (mg/kg)<br />
SVOCs (mg/kg)<br />
TPH-G (mg/kg)<br />
Notes:<br />
1LCS/LCSD<br />
= laboratory control spike/LCS duplicate<br />
2<br />
RPD = Relative Percent Difference<br />
3<br />
MS/MSD = matrix spike/MS duplicate<br />
4<br />
na = Not analyzed<br />
5<br />
J = Estimated<br />
6<br />
J- = Estimated, biased low<br />
7<br />
J+ = Estimated, biased high<br />
Laboratory Analyses & Qualifiers<br />
MTBE + BTEX (mg/kg)<br />
TPH-D (mg/kg)<br />
TEPH (mg/kg)<br />
Organochlorine pesticides (mg/kg)<br />
PCBs (mg/kg)<br />
Organic Lead (mg/kg)<br />
TOC (mg/kg)<br />
Qualifiers<br />
Table A-4 Quality Control Review for Samples Collected by Earth Tech for <strong>VTA</strong> during ROW Acquisition - Organics<br />
Laboratory Project No./<br />
Order ID No.<br />
VOCs Holding Time<br />
VOCs Surrogate Spike<br />
VOCs Method Blank<br />
VOCs LCS/LCSD 1 /RPD 2<br />
VOCs MS/MSD 3 /RPD<br />
TEPH Holding Time<br />
TEPH Surrogate Spike<br />
Evaluation of Quality Control Data Acceptability<br />
TEPH Method Blank<br />
TEPH LCS/LCSD/RPD<br />
TPH-G Holding Time<br />
TPH-G Surrogate Spike<br />
Torrent<br />
020108008<br />
Torrent<br />
na na na na na na na na na na na na na na na na na na na na na na na na na na na na na<br />
020108008<br />
Torrent<br />
na na na na na na na na na na na na na na na na na na na na na na na na na na na na na<br />
020109017<br />
Torrent<br />
na na na na na OK OK OK OK na na na na na na na na na na na na na na na na na na na na<br />
020109017 na na na na na na na na na na na na na na na na na na na na na na na na na na na na na<br />
101248- Table A-4 QC 2002 Line Segment Organics Data.xls - July 2008 Page 7 of 7<br />
TPH-G Method Blank<br />
TPH-G LCS/LCSD/RPD<br />
MTBE & BTEX Holding Time<br />
MTBE & BTEX Surrogate Spike<br />
MTBE & BTEX Method Blank<br />
MTBE & BTEX LCS/LCSD/RPD<br />
Organochlorine Pesticides Holding Time<br />
Organochlorine Pesticides Surrogate Spike<br />
Organochlorine Pesticides Method Blank<br />
Organochlorine Pesticides LCS/LCSD/RPD<br />
PCBs Holding Time<br />
PCBs Surrogate Spike<br />
PCBs Method Blank<br />
PCBs LCS/LCSD/RPD<br />
TOC Holding Time<br />
TOC Surrogate Spike<br />
TOC Method Blank<br />
TOC LCS/LCSD/RPD
Sample ID Depth (feet below ground surface)<br />
Sample Collection Date<br />
Apparent Population<br />
SB-1-0 0-0.5 12/17/02 57 -- 260 -- J+<br />
Total Arsenic (mg/kg)<br />
Total Arsenic/Dissolved Arsenic (mg/L)<br />
Qualifier for Total Arsenic<br />
Total Lead (mg/kg)<br />
Total Lead/Dissolved Lead (mg/L)<br />
Qualifier for Total Lead<br />
WET for As, Cd, Cr, Cu, Pb, and/or Se (mg/L)<br />
Qualifier for WET As, Ba, Cd, Cr, Pb, and/or Se<br />
TCLP for As, Ba, Cd, Cu, Pb and/or Se (mg/L)<br />
Qualifier for TCLP As, Ba, Cd, Cr, Pb and/or Se<br />
CAM 17 Metals<br />
As: 1.6<br />
Pb: 8.6 J-: Pb -- -- x<br />
Qualifier for Other Than<br />
Total Arsenic or Total Lead<br />
Dissolved Solids<br />
Suspended Solids<br />
J+: Hg<br />
J+: Se -- --<br />
Quality Control Batch Number<br />
(Sample Daily Group)<br />
Chain of Custody Complete<br />
Metals Holding Time<br />
Sample ID Depth (feet below ground surface)<br />
Sample Collection Date<br />
Apparent Population<br />
Total Arsenic (mg/kg)<br />
Total Arsenic/Dissolved Arsenic (mg/L)<br />
Qualifier for Total Arsenic<br />
Total Lead (mg/kg)<br />
Total Lead/Dissolved Lead (mg/L)<br />
Qualifier for Total Lead<br />
WET for As, Cd, Cr, Cu, Pb, and/or Se (mg/L)<br />
Table A-5 Quality Control Review for Samples Collected by Earth Tech from UPRR Newhall Yard - Metals<br />
Sample Information Laboratory Analyses and Qualifiers Evaluation of QC Data Acceptability<br />
SB-3-W1 -- 12/17/02 --<br />
Sample ID Depth (feet below ground surface)<br />
Sample Collection Date<br />
Apparent Population<br />
Total Arsenic (mg/kg)<br />
Total Arsenic/Dissolved Arsenic (mg/L)<br />
Qualifier for Total Arsenic<br />
Total Lead (mg/kg)<br />
Total Lead/Dissolved Lead (mg/L)<br />
Qualifier for Total Lead<br />
WET for As, Cd, Cr, Cu, Pb, and/or Se (mg/L)<br />
Table A-5 Quality Control Review for Samples Collected by Earth Tech from UPRR Newhall Yard - Metals<br />
Sample Information Laboratory Analyses and Qualifiers Evaluation of QC Data Acceptability<br />
SB-7-3.5 3.5-4 06/23/03 -- -- 2.1 -- J- -- -- -- -- -- --<br />
SB-7-5.0 5-5.5 06/23/03
Sample ID Depth (feet below ground surface)<br />
Sample Collection Date<br />
Apparent Population<br />
Total Arsenic (mg/kg)<br />
Total Arsenic/Dissolved Arsenic (mg/L)<br />
Qualifier for Total Arsenic<br />
Total Lead (mg/kg)<br />
Total Lead/Dissolved Lead (mg/L)<br />
Qualifier for Total Lead<br />
WET for As, Cd, Cr, Cu, Pb, and/or Se (mg/L)<br />
Table A-5 Quality Control Review for Samples Collected by Earth Tech from UPRR Newhall Yard - Metals<br />
Sample Information Laboratory Analyses and Qualifiers Evaluation of QC Data Acceptability<br />
SB-8-3.0 3-3.5 06/23/03 -- -- 5.1 -- J- -- -- -- -- -- -- --<br />
SB-8-5.0 5-5.5 06/23/03
Sample ID Depth (feet below ground surface)<br />
Sample Collection Date<br />
Apparent Population<br />
Total Arsenic (mg/kg)<br />
Total Arsenic/Dissolved Arsenic (mg/L)<br />
Qualifier for Total Arsenic<br />
Total Lead (mg/kg)<br />
Total Lead/Dissolved Lead (mg/L)<br />
Qualifier for Total Lead<br />
WET for As, Cd, Cr, Cu, Pb, and/or Se (mg/L)<br />
Table A-5 Quality Control Review for Samples Collected by Earth Tech from UPRR Newhall Yard - Metals<br />
Sample Information Laboratory Analyses and Qualifiers Evaluation of QC Data Acceptability<br />
SS-1-0.0 0.0-0.5 12/16/02 12 -- 640 -- J+ Pb: 1.2 J-: Pb -- -- x<br />
Qualifier for WET As, Ba, Cd, Cr, Pb, and/or Se<br />
TCLP for As, Ba, Cd, Cu, Pb and/or Se (mg/L)<br />
Qualifier for TCLP As, Ba, Cd, Cr, Pb and/or Se<br />
CAM 17 Metals<br />
Qualifier for Other Than<br />
Total Arsenic or Total Lead<br />
Dissolved Solids<br />
Suspended Solids<br />
J+: Hg<br />
J+: Se -- --<br />
SS-1-1.5 1.5-2 12/16/02 6.4 -- 90 -- Pb: ND J-: Pb -- -- -- -- --<br />
SS-2-0.0 0.0-0.5 12/16/02 1.9 -- 14 -- -- -- -- -- -- -- --<br />
SS-2-1.5 1.5-2 12/16/02
Sample ID Depth (feet below ground surface)<br />
Sample Collection Date<br />
Apparent Population<br />
Total Arsenic (mg/kg)<br />
Total Arsenic/Dissolved Arsenic (mg/L)<br />
Qualifier for Total Arsenic<br />
Total Lead (mg/kg)<br />
Total Lead/Dissolved Lead (mg/L)<br />
Qualifier for Total Lead<br />
WET for As, Cd, Cr, Cu, Pb, and/or Se (mg/L)<br />
Table A-5 Quality Control Review for Samples Collected by Earth Tech from UPRR Newhall Yard - Metals<br />
Sample Information Laboratory Analyses and Qualifiers Evaluation of QC Data Acceptability<br />
SS-6-0.0 0.0-0.5 12/16/02 3 -- 110 -- Pb: 46 J-: Pb -- -- -- -- --<br />
SS-6-1.5 1.5-2 12/16/02
Sample ID Depth (feet below ground surface)<br />
Sample Collection Date<br />
Apparent Population<br />
Total Arsenic (mg/kg)<br />
Total Arsenic/Dissolved Arsenic (mg/L)<br />
Qualifier for Total Arsenic<br />
Total Lead (mg/kg)<br />
Total Lead/Dissolved Lead (mg/L)<br />
Qualifier for Total Lead<br />
WET for As, Cd, Cr, Cu, Pb, and/or Se (mg/L)<br />
Table A-5 Quality Control Review for Samples Collected by Earth Tech from UPRR Newhall Yard - Metals<br />
Sample Information Laboratory Analyses and Qualifiers Evaluation of QC Data Acceptability<br />
SS-11-0.0 0.0-0.5 12/16/02
Sample ID Depth (feet below ground surface)<br />
Sample Collection Date<br />
Apparent Population<br />
Total Arsenic (mg/kg)<br />
Total Arsenic/Dissolved Arsenic (mg/L)<br />
Qualifier for Total Arsenic<br />
Total Lead (mg/kg)<br />
Total Lead/Dissolved Lead (mg/L)<br />
Qualifier for Total Lead<br />
WET for As, Cd, Cr, Cu, Pb, and/or Se (mg/L)<br />
Table A-5 Quality Control Review for Samples Collected by Earth Tech from UPRR Newhall Yard - Metals<br />
Sample Information Laboratory Analyses and Qualifiers Evaluation of QC Data Acceptability<br />
SS-16-0.0 0.0-0.5 06/24/03 -- -- 170 -- J- -- -- Pb: 0.12 -- -- --<br />
SS-16-1.5 1.5-2 06/24/03 -- -- 8.0 -- J- -- -- -- -- -- -- --<br />
SS-16-3.0 3-3.5 06/27/03 -- -- 11 -- J- -- -- -- -- -- -- --<br />
SS-17-0.0 0.0-0.5 06/24/03 -- -- 1,300 -- J- -- -- -- -- -- -- --<br />
SS-17-1.5 1.5-2 06/27/03 -- -- 85 -- J- Pb: 2.91 -- -- -- -- --<br />
SS-17-3.0 3-3.5 06/27/03 -- -- 5.2 -- J- -- -- -- -- -- -- --<br />
Qualifier for WET As, Ba, Cd, Cr, Pb, and/or Se<br />
TCLP for As, Ba, Cd, Cu, Pb and/or Se (mg/L)<br />
Qualifier for TCLP As, Ba, Cd, Cr, Pb and/or Se<br />
CAM 17 Metals<br />
Qualifier for Other Than<br />
Total Arsenic or Total Lead<br />
Dissolved Solids<br />
Suspended Solids<br />
Quality Control Batch Number<br />
(Sample Daily Group)<br />
Chain of Custody Complete<br />
Metals Holding Time<br />
Sample ID Depth (feet below ground surface)<br />
Sample Collection Date<br />
Apparent Population<br />
Total Arsenic (mg/kg)<br />
Total Arsenic/Dissolved Arsenic (mg/L)<br />
Qualifier for Total Arsenic<br />
Total Lead (mg/kg)<br />
Total Lead/Dissolved Lead (mg/L)<br />
Qualifier for Total Lead<br />
WET for As, Cd, Cr, Cu, Pb, and/or Se (mg/L)<br />
Table A-5 Quality Control Review for Samples Collected by Earth Tech from UPRR Newhall Yard - Metals<br />
Sample Information Laboratory Analyses and Qualifiers Evaluation of QC Data Acceptability<br />
SS-18-0.0 0.0-0.5 06/24/03
Sample ID Depth (feet below ground surface)<br />
Sample Collection Date<br />
Apparent Population<br />
Total Arsenic (mg/kg)<br />
Total Arsenic/Dissolved Arsenic (mg/L)<br />
Qualifier for Total Arsenic<br />
Total Lead (mg/kg)<br />
Total Lead/Dissolved Lead (mg/L)<br />
Qualifier for Total Lead<br />
WET for As, Cd, Cr, Cu, Pb, and/or Se (mg/L)<br />
Table A-5 Quality Control Review for Samples Collected by Earth Tech from UPRR Newhall Yard - Metals<br />
Sample Information Laboratory Analyses and Qualifiers Evaluation of QC Data Acceptability<br />
SS-19-1.5 1.5-2 06/24/03 -- -- 6.7 -- J- -- -- -- -- -- -- --<br />
SS-19-3.0 3-3.5 06/24/03 -- -- 4.5 -- J- -- -- -- -- -- -- --<br />
SS-20-0.0 0.0-0.5 06/24/03 -- -- 6,400 -- J- -- -- Pb: ND -- -- --<br />
SS-20-1.5 1.5-2 06/24/03 -- -- 190 -- J- Pb: 1.67 Pb: ND -- -- --<br />
SS-21-0.0 0.0-0.5 06/24/03
Sample ID Depth (feet below ground surface)<br />
Sample Collection Date<br />
Apparent Population<br />
Total Arsenic (mg/kg)<br />
Total Arsenic/Dissolved Arsenic (mg/L)<br />
Qualifier for Total Arsenic<br />
Total Lead (mg/kg)<br />
Total Lead/Dissolved Lead (mg/L)<br />
Qualifier for Total Lead<br />
WET for As, Cd, Cr, Cu, Pb, and/or Se (mg/L)<br />
Table A-5 Quality Control Review for Samples Collected by Earth Tech from UPRR Newhall Yard - Metals<br />
Sample Information Laboratory Analyses and Qualifiers Evaluation of QC Data Acceptability<br />
SS-21-1.5 1.5-2 06/24/03 -- -- 9.8 -- J- -- -- -- -- -- -- --<br />
SS-21-3.0 3-3.5 06/24/03 -- -- 8.5 -- J- -- -- -- -- -- -- --<br />
SS-22-0.0 0.0-0.5 06/23/03 -- -- 98 -- J- Pb: 3.42 -- -- -- -- --<br />
SS-22-1.5 1.5-2 06/23/03 -- -- 9.1 -- J- -- -- -- -- -- -- --<br />
Notes:<br />
1LCS/LCSD<br />
= laboratory control spike/LCS duplicate<br />
2<br />
RPD = Relative Percent Difference<br />
3<br />
MS/MSD = matrix spike/MS duplicate<br />
4<br />
ND = Not detected above laboratory limits<br />
5<br />
na = Not analyzed<br />
6<br />
J+ = Estimated, biased high<br />
7<br />
J- = Estimated, biased low<br />
Qualifier for WET As, Ba, Cd, Cr, Pb, and/or Se<br />
TCLP for As, Ba, Cd, Cu, Pb and/or Se (mg/L)<br />
Qualifier for TCLP As, Ba, Cd, Cr, Pb and/or Se<br />
CAM 17 Metals<br />
Qualifier for Other Than<br />
Total Arsenic or Total Lead<br />
Dissolved Solids<br />
Suspended Solids<br />
Quality Control Batch Number<br />
(Sample Daily Group)<br />
Chain of Custody Complete<br />
Metals Holding Time<br />
Sample ID Depth (feet below ground<br />
surface)<br />
Sample Collection Date<br />
Apparent Population<br />
VOCs<br />
SVOCs<br />
TPH-G<br />
MTBE + BTEX<br />
TPH-D<br />
TEPH<br />
Organochlorine pesticides<br />
PCBs<br />
Organic Lead<br />
PAH<br />
Qualifiers<br />
Laboratory Project No. / Order<br />
ID No.<br />
VOCs Holding Time<br />
SB-1-0 0-0.5 12/17/02 x x J+: TEPH Torrent 0212100 R761 na na na na na na na na na na OK OK<br />
SB-1-5 5-5.5 12/17/02 x x x J+: TEPH<br />
SB-1-19.5 19.5-20 12/17/02 x x x J+: TEPH<br />
SB-1-W1 -- 12/17/02 x x x x<br />
J+: TEPH<br />
J+: TPH-G<br />
VOCs Surrogate Spike<br />
VOCs Method Blank<br />
VOCs LCS/LCSD 1 /RPD 2<br />
VOCs MS/MSD 3 /RPD<br />
Torrent 0212100<br />
R721/R761 OK OK OK OK na na na na na na OK OK<br />
Torrent 0212100<br />
R721/R761 OK OK OK OK na na na na na na OK OK<br />
Torrent 0212100<br />
R701/R707/R762 OK OK OK OK na na na na na na OK OK<br />
SB-2-0 0-0.5 12/17/02 x x J+: TEPH Torrent 0212100 R761 na na na na na na na na na na OK<br />
SB-2-5 5-5.5 12/17/02 x x x<br />
SB-2-19 19-19.5 12/17/02 x x x<br />
SB-2-W1 -- 12/17/02 x x x x<br />
J+: TEPH<br />
J+: TPH-G<br />
J+: TEPH<br />
J+: TPH-G<br />
J+: TEPH<br />
J+: TPH-G<br />
Torrent 0212100<br />
R718/R761 na na na na na na na na na na OK OK<br />
Torrent 0212100<br />
R718/R761 na na na na na na na na na na OK OK<br />
Torrent 0212100<br />
R701/R707/R762 OK OK OK OK na na na na na na OK OK<br />
SB-3-0 0-0.5 12/17/02 x x J+: TEPH Torrent 0212100 R761 na na na na na na na na na na OK OK<br />
SB-3-7 7-7.5 12/17/02 x x x J+: TEPH<br />
SB-3-19 19-19.5 12/17/02 x x x x<br />
J+: TEPH<br />
J+: TPH-G<br />
Torrent 0212100<br />
R717/R761 na na na na na na na na na na OK OK<br />
Torrent 0212100<br />
R721/R717/R761 OK OK OK OK na na na na na na OK OK<br />
SVOCs Holding Time<br />
SVOCs Surrogate Spike<br />
SVOCs Method Blank<br />
SVOCs LCS/LCSD/RPD<br />
SVOCs MS/MSD/RPD<br />
TEPH Holding Time<br />
TEPH Surrogate Spike<br />
TEPH Method Blank<br />
TEPH LCS/LCSD/RPD<br />
TPH-G Holding Time<br />
TPH-G Surrogate Spike<br />
TPH-G Method Blank<br />
TPH-G LCS/LCSD/RPD<br />
MTBE & BTEX Holding Time<br />
MTBE & BTEX Surrogate<br />
Spike<br />
MTBE & BTEX Method Blank<br />
MTBE & BTEX<br />
LCS/LCSD/RPD<br />
Organochlorine Pesticides<br />
Holding Time<br />
TPH-D<br />
1.256 mg/kg<br />
vs ND OK na na na na na na na na na na na na na na na na na na na na R761- TEPH<br />
TPH-D<br />
1.256 mg/kg<br />
R721- VOCs<br />
vs ND OK na na na na na na na na na na na na na na na na na na na na R761- TEPH<br />
TPH-D<br />
1.256 mg/kg<br />
R721- VOCs<br />
vs ND OK na na na na na na na na na na na na na na na na na na na na R761- TEPH<br />
TPH-D<br />
0.037 mg/kg<br />
vs ND OK OK OK<br />
Organochlorine Pesticides<br />
Surrogate Spike<br />
Organochlorine Pesticides<br />
Method Blank<br />
TPH-G:<br />
14.58<br />
R701- VOCs<br />
ug/L vs<br />
R707- TPH-G<br />
ND OK na na na na na na na na na na na na na na na na R762- TEPH<br />
Pentacosa<br />
ne 206%<br />
vs 150% TPH-D<br />
biased 1.256 mg/kg<br />
high vs ND OK na na na na na na na na na na na na na na na na na na na na R761- TEPH<br />
TPH-D<br />
1.256 mg/kg<br />
vs ND OK OK OK<br />
TPH-D<br />
1.256 mg/kg<br />
vs ND OK OK<br />
Trifluorotoluene<br />
18.4% vs 65% biased<br />
low<br />
TPH-D:<br />
0.037 mg/L<br />
vs ND OK OK OK<br />
TPH-G:<br />
37.94<br />
ug/L vs<br />
R718- TPH-G<br />
ND OK na na na na na na na na na na na na na na na na R761- TEPH<br />
TPH-G:<br />
37.94<br />
ug/L vs<br />
R718- TPH-G<br />
ND OK na na na na na na na na na na na na na na na na R761- TEPH<br />
TPH-G:<br />
14.58<br />
R701- VOCs<br />
ug/L vs<br />
R707- TPH-G<br />
ND OK na na na na na na na na na na na na na na na na R762- TEPH<br />
TPH-D<br />
1.256 mg/kg<br />
vs ND OK na na na na na na na na na na na na na na na na na na na na R761- TEPH<br />
TPH-D<br />
1.256 mg/kg<br />
R717- TPH-G<br />
vs ND OK OK OK OK OK na na na na na na na na na na na na na na na na R761-TEPH<br />
TPH-D<br />
1.256 mg/kg<br />
vs ND OK OK<br />
Trifluorotoluene<br />
14.5% vs 65% biased<br />
low OK OK na na na na na na na na na na na na na na na na<br />
TPH-D:<br />
TPH-G:<br />
14.58<br />
R701- VOCs<br />
J+: TEPH Torrent 0212100<br />
0.037 mg/L<br />
ug/L vs<br />
R707- TPH-G<br />
SB-3-W1 -- 12/17/02 x x x x<br />
J+: TPH-G R701/R707/R762 OK OK OK OK na na na na na na OK OK vs ND OK OK OK<br />
ND OK na na na na na na na na na na na na na na na na R762- TEPH<br />
SB-4-0.5 0.5-1.0 12/17/02 x x Torrent 0212100 R760 na na na na na na na na na na OK OK OK OK na na na na na na na na na na na na na na na na na na na na R760- TEPH<br />
SB-4-5 5-5.5 12/17/02 x x x J+: TPH-G<br />
SB-4-19.5 19.5-20 12/17/02 x x x x<br />
SB-4-W1 -- 12/17/02 x x J+: TPH-G<br />
SB-5-0 0-0.5 12/17/02 x x x<br />
SB-5-4 4-4.5 12/17/02 x x x x<br />
SB-6-0.5 0.5-1 12/17/02 x x x J+: TEPH<br />
Table A-6 Quality Control Review for Samples Collected by Earth Tech from UPRR Newhall Yard - Organics<br />
Sample Information Lab. Analyses & Qualifiers Evaluation of QC Data Acceptability<br />
Torrent 0212100<br />
R771/R760 na na na na na na na na na na OK OK OK OK OK OK<br />
Organochlorine Pesticides<br />
LCS/LCSD/RPD<br />
PCBs Holding Time<br />
PCBs Surrogate Spike<br />
PCBs Method Blank<br />
PCBs LCS/LCSD/RPD<br />
PAH Holding Time<br />
PAH Surrogate Spike<br />
PAH Method Blank<br />
PAH LCS/LCSD/RPD<br />
Notes<br />
R721- VOCs<br />
R717- TPH-G<br />
R761- TEPH<br />
TPH-G:<br />
26.66<br />
ug/kg vs<br />
R771- TPH-G<br />
ND OK na na na na na na na na na na na na na na na na R760- TEPH<br />
Torrent 0212100<br />
R721/R717/R760 OK OK OK OK na na na na na na OK OK OK OK OK OK OK OK na na na na na na na na na na na na na na na na<br />
Torrent 0212100<br />
LCS TPH-G:<br />
144% vs 135%<br />
R701- VOCs<br />
R701/R716 OK OK OK OK na na na na na na na na na na OK OK OK biased high na na na na na na na na na na na na na na na na R716- TPH-G<br />
Torrent 0212100<br />
R760- TEPH<br />
R760/R776 na na na na na na na na na na OK OK OK OK na na na na na na na na na na na na na na na na OK OK OK OK R776- PAHs<br />
R717- TPH-G<br />
Torrent 0212100<br />
R760- TEPH<br />
R717/R760/R776 na na na na na na na na na na OK OK OK OK OK OK OK OK na na na na na na na na na na na na OK OK OK OK R776- PAHs<br />
Torrent 0212100<br />
R721/R761 OK OK OK OK na na na na na na OK OK<br />
R721- VOCs<br />
R717- TPH-G<br />
R760-TEPH<br />
TPH-D<br />
1.256 mg/kg<br />
R721- VOCs<br />
vs ND OK na na na na na na na na na na na na na na na na na na na na R761- TEPH<br />
101248 - Table A-6 QC Newhall Yard Organics.xls - July 2008 1 of 6
Sample Information Lab. Analyses & Qualifiers Evaluation of QC Data Acceptability<br />
Sample ID Depth (feet below ground<br />
surface)<br />
Sample Collection Date<br />
Apparent Population<br />
VOCs<br />
SVOCs<br />
TPH-G<br />
MTBE + BTEX<br />
TPH-D<br />
TEPH<br />
Organochlorine pesticides<br />
PCBs<br />
Organic Lead<br />
PAH<br />
SB-6-5 5-5.5 12/17/02 x x x x J+: TEPH<br />
Qualifiers<br />
Laboratory Project No. / Order<br />
ID No.<br />
VOCs Holding Time<br />
VOCs Surrogate Spike<br />
VOCs Method Blank<br />
VOCs LCS/LCSD 1 /RPD 2<br />
VOCs MS/MSD 3 /RPD<br />
Table A-6 Quality Control Review for Samples Collected by Earth Tech from UPRR Newhall Yard - Organics<br />
Torrent 0212100<br />
R721/R717/R761 OK OK OK OK na na na na na na OK OK<br />
SVOCs Holding Time<br />
SVOCs Surrogate Spike<br />
SVOCs Method Blank<br />
SVOCs LCS/LCSD/RPD<br />
SVOCs MS/MSD/RPD<br />
TEPH Holding Time<br />
TEPH Surrogate Spike<br />
TEPH Method Blank<br />
TEPH LCS/LCSD/RPD<br />
TPH-G Holding Time<br />
TPH-G Surrogate Spike<br />
TPH-G Method Blank<br />
TPH-G LCS/LCSD/RPD<br />
MTBE & BTEX Holding Time<br />
MTBE & BTEX Surrogate<br />
Spike<br />
MTBE & BTEX Method Blank<br />
MTBE & BTEX<br />
LCS/LCSD/RPD<br />
Organochlorine Pesticides<br />
Holding Time<br />
TPH-D<br />
R721- VOCs<br />
1.256 mg/kg<br />
R717- TPH-G<br />
vs ND OK OK OK OK OK na na na na na na na na na na na na na na na na R761-TEPH<br />
J+: TEPH Torrent 0212100<br />
SB-6-20.5 20.5-21 12/17/02 x x x x<br />
J+: TPH-G R721/R717/R761 OK OK OK OK na na na na na na OK OK vs ND OK OK low OK OK na na na na na na na na na na na na na na na na<br />
SB-7-0.0 0-0.5 06/23/03 x x Torrent 0306081 R1645 na na na na na na na na na na OK OK OK OK na na na na na na na na na na na na na na na na na na na na R1645- TEPH<br />
SB-7-3.5 3.5-4 06/23/03 x x Torrent 0306081 R1645 na na na na na na na na na na OK OK OK OK na na na na na na na na na na na na na na na na na na na na R1645- TEPH<br />
SB-7-5.0 5-5.5 06/23/03 x x Torrent 0306081 R1645 na na na na na na na na na na OK OK OK OK na na na na na na na na na na na na na na na na na na na na R1645- TEPH<br />
SB-7-24.5 24.5-25 06/23/03 x x x x J-: TPH-G<br />
TPH-D<br />
1.256 mg/kg<br />
Trifluorotoluene<br />
54.9% vs 65% biased<br />
Torrent 0306081<br />
R1651/R1638/R1645 OK OK OK OK OK na na na na na OK OK OK OK OK OK OK<br />
Organochlorine Pesticides<br />
Surrogate Spike<br />
Organochlorine Pesticides<br />
Method Blank<br />
Organochlorine Pesticides<br />
LCS/LCSD/RPD<br />
PCBs Holding Time<br />
PCBs Surrogate Spike<br />
PCBs Method Blank<br />
PCBs LCS/LCSD/RPD<br />
PAH Holding Time<br />
PAH Surrogate Spike<br />
PAH Method Blank<br />
PAH LCS/LCSD/RPD<br />
Notes<br />
R721- VOCs<br />
R717- TPH-G<br />
R761-TEPH<br />
MS: TPH-G<br />
52.2% vs 65%,<br />
R1651- VOCs<br />
MSD: TPH-G<br />
R1638- TPH-G<br />
41% vs 65% na na na na na na na na na na na na na na na na R1645- TEPH<br />
Torrent 0306081<br />
R1649- VOCs<br />
R1629- TPH-G<br />
SB-7-W1 -- 06/23/03 x x x x<br />
R1649/R1629/R1644 OK OK OK OK OK na na na na na OK OK OK OK OK OK OK OK na na na na na na na na na na na na na na na na R1644- TEPH<br />
SB-8-0.0 0-0.5 06/23/03 x x Torrent 0306081 R1645 na na na na na na na na na na OK OK OK OK na na na na na na na na na na na na na na na na na na na na R1645- TEPH<br />
SB-8-3.0 3-3.5 06/23/03 x x Torrent 0306081 R1645 na na na na na na na na na na OK OK OK OK na na na na na na na na na na na na na na na na na na na na R1645- TEPH<br />
SB-8-5.0 5-5.5 06/23/03 x x Torrent 0306081 R1645 na na na na na na na na na na OK OK OK OK na na na na na na na na na na na na na na na na na na na na R1645- TEPH<br />
SB-8-18.5 18.5-19 06/23/03 x x x x J-: TPH-G<br />
Torrent 0306081<br />
R1651/R1638/R1645 OK OK OK OK OK na na na na na OK OK OK OK OK OK OK<br />
MS: TPH-G<br />
52.2% vs 65%,<br />
MSD: TPH-G<br />
41% vs 65% na na na na na na na na na na na na na na na na<br />
Torrent 0306081<br />
R1649- VOCs<br />
R1629- TPH-G<br />
SB-8-W1 -- 06/23/03 x x x x<br />
R1649/R1629/R1644 OK OK OK OK OK na na na na na OK OK OK OK OK OK OK OK na na na na na na na na na na na na na na na na R1644- TEPH<br />
SS-1-0.0 0.0-0.5 12/16/02 x x Torrent 0212095 R760 na na na na na na na na na na OK OK OK OK na na na na na na na na na na na na na na na na na na na na R760- TEPH<br />
SS-1-1.5 1.5-2 12/16/02 x x Torrent 0212095 R760 na na na na na na na na na na OK OK OK OK na na na na na na na na na na na na na na na na na na na na R760- TEPH<br />
SS-2-0.0 0.0-0.5 12/16/02 x x Torrent 0212095 R760 na na na na na na na na na na OK OK OK OK na na na na na na na na na na na na na na na na na na na na R760- TEPH<br />
SS-2-1.5 1.5-2 12/16/02 x x Torrent 0212095 R760 na na na na na na na na na na OK OK OK OK na na na na na na na na na na na na na na na na na na na na R760- TEPH<br />
SS-3-0.0 0.0-0.5 12/16/02 x x J: TEPH Torrent 0212095 R724 na na na na na na na na na na OK OK<br />
SS-3-1.5 1.5-2 12/16/02 x x x x<br />
SS-4-0.0 0.0-0.5 12/16/02 x x x x<br />
J: TEPH<br />
J+: TPH-G<br />
J: TEPH<br />
J+: Pesticides<br />
J+: PCBs<br />
Torrent 0212095<br />
R766/R717/R724 na na na na na OK OK OK OK na OK OK<br />
Torrent 0212095<br />
R724/R722/R723 na na na na na na na na na na OK OK<br />
SS-4-1.5 1.5-2 12/16/02 x x J: TEPH Torrent 0212095 R724 na na na na na na na na na na OK OK<br />
SS-5-0.0 0.0-0.5 12/16/02 x x J: TEPH Torrent 0212095 R724 na na na na na na na na na na OK OK<br />
SS-5-1.5 1.5-2 12/16/02 x x x x J: TEPH<br />
Torrent 0212095<br />
R766/R717/R724 na na na na na OK OK OK OK na OK OK<br />
SS-6-0.0 0.0-0.5 12/16/02 x x J: TEPH Torrent 0212095 R724 na na na na na na na na na na OK OK<br />
R1651- VOCs<br />
R1638- TPH-G<br />
R1645- TEPH<br />
TPH-D LCS: TPH-D<br />
1.256 mg/kg 41.5% vs 50%<br />
vs ND biased low na na na na na na na na na na na na na na na na na na na na R724- TEPH<br />
TPH-D LCS: TPH-D<br />
1.256 mg/kg 41.5% vs 50%<br />
vs ND biased low OK<br />
Trifluorotoluene<br />
R766- SVOCs<br />
143% vs 135% biased<br />
R717- TPH-G<br />
high OK OK na na na na na na na na na na na na na na na na R724- TEPH<br />
TPH-D LCS: TPH-D<br />
1.256 mg/kg 41.5% vs 50%<br />
vs ND biased low na na na na na na na na OK OK OK<br />
4, 4'- DDT 658% vs<br />
130%, Aldrin 469%<br />
vs 130%, Dieldrin<br />
532% vs 130%,<br />
Endrin 556% vs<br />
130%, gamma-BHC<br />
546% vs 130%,<br />
Heptachlor 492% vs<br />
130% biased high,<br />
Surr:<br />
Decachlorobiphenyl<br />
507% vs 135%, Surr:<br />
Tetrachloro-m-xylene<br />
449% vs 135% biased<br />
high OK OK<br />
Aroclor<br />
1016<br />
0.0379 vs<br />
R724- TEPH<br />
0.0 biased<br />
R722- Pesticides<br />
high OK na na na na R723-PCBs<br />
TPH-D LCS: TPH-D<br />
1.256 mg/kg 41.5% vs 50%<br />
vs ND biased low na na na na na na na na na na na na na na na na na na na na R724- TEPH<br />
TPH-D LCS: TPH-D<br />
1.256 mg/kg 41.5% vs 50%<br />
vs ND biased low na na na na na na na na na na na na na na na na na na na na R724- TEPH<br />
TPH-D LCS: TPH-D<br />
R766- SVOCs<br />
1.256 mg/kg 41.5% vs 50%<br />
R717- TPH-G<br />
vs ND biased low OK OK OK OK na na na na na na na na na na na na na na na na R724- TEPH<br />
TPH-D LCS: TPH-D<br />
1.256 mg/kg 41.5% vs 50%<br />
vs ND biased low na na na na na na na na na na na na na na na na na na na na R724- TEPH<br />
101248 - Table A-6 QC Newhall Yard Organics.xls - July 2008 2 of 6
Sample Information Lab. Analyses & Qualifiers Evaluation of QC Data Acceptability<br />
Sample ID Depth (feet below ground<br />
surface)<br />
Sample Collection Date<br />
Apparent Population<br />
VOCs<br />
SVOCs<br />
TPH-G<br />
MTBE + BTEX<br />
TPH-D<br />
TEPH<br />
Organochlorine pesticides<br />
PCBs<br />
Organic Lead<br />
PAH<br />
SS-6-1.5 1.5-2 12/16/02 x x x J: TEPH<br />
Qualifiers<br />
Laboratory Project No. / Order<br />
ID No.<br />
VOCs Holding Time<br />
VOCs Surrogate Spike<br />
VOCs Method Blank<br />
VOCs LCS/LCSD 1 /RPD 2<br />
VOCs MS/MSD 3 /RPD<br />
Table A-6 Quality Control Review for Samples Collected by Earth Tech from UPRR Newhall Yard - Organics<br />
Torrent 0212095<br />
R717/R724 na na na na na na na na na na OK OK<br />
SS-7-0.0 0.0-0.5 12/16/02 x x J: TEPH Torrent 0212095 R724 na na na na na na na na na na OK OK<br />
SS-7-1.5 1.5-2 12/16/02 x x J: TEPH Torrent 0212095 R724 na na na na na na na na na na OK OK<br />
SVOCs Holding Time<br />
SVOCs Surrogate Spike<br />
SVOCs Method Blank<br />
SVOCs LCS/LCSD/RPD<br />
SVOCs MS/MSD/RPD<br />
TEPH Holding Time<br />
TEPH Surrogate Spike<br />
TEPH Method Blank<br />
TEPH LCS/LCSD/RPD<br />
TPH-G Holding Time<br />
TPH-G Surrogate Spike<br />
TPH-G Method Blank<br />
TPH-G LCS/LCSD/RPD<br />
MTBE & BTEX Holding Time<br />
MTBE & BTEX Surrogate<br />
Spike<br />
MTBE & BTEX Method Blank<br />
MTBE & BTEX<br />
LCS/LCSD/RPD<br />
Organochlorine Pesticides<br />
Holding Time<br />
TPH-D LCS: TPH-D<br />
1.256 mg/kg 41.5% vs 50%<br />
R717- TPH-G<br />
vs ND biased low OK OK OK OK na na na na na na na na na na na na na na na na R724- TEPH<br />
TPH-D LCS: TPH-D<br />
1.256 mg/kg 41.5% vs 50%<br />
vs ND biased low na na na na na na na na na na na na na na na na na na na na R724- TEPH<br />
TPH-D LCS: TPH-D<br />
1.256 mg/kg 41.5% vs 50%<br />
vs ND biased low na na na na na na na na na na na na na na na na na na na na R724- TEPH<br />
Pentacosa<br />
4, 4'- DDT 658% vs<br />
130%, Aldrin 469%<br />
vs 130%, Dieldrin<br />
532% vs 130%,<br />
Endrin 556% vs<br />
130%, gamma-BHC<br />
546% vs 130%,<br />
Heptachlor 492% vs<br />
130% biased high,<br />
Surr:<br />
Decachlorobiphenyl<br />
Aroclor<br />
ne 177%<br />
507% vs 135%, Surr:<br />
1016<br />
J: TEPH<br />
vs 150% TPH-D LCS: TPH-D<br />
Tetrachloro-m-<br />
Tetrachloro-m-xylene<br />
0.0379 vs<br />
R724- TEPH<br />
J: Pesticides Torrent 0212095<br />
biased 1.256 mg/kg 41.5% vs 50%<br />
xylene 24.0% vs<br />
449% vs 135% biased<br />
0.0 biased<br />
R722- Pesticides<br />
SS-8-0.0 0.0-0.5 12/16/02 x x x x J+: PCBs R724/R722/R723<br />
Torrent 0212095<br />
na na na na na na na na na na OK high vs ND biased low na na na na na na na na OK 65% biased low OK<br />
high OK OK high OK na na na na R723-PCBs<br />
R717- TPH-G<br />
SS-8-1.5 1.5-2 12/16/02 x x x<br />
R717/R760 na na na na na na na na na na OK OK OK OK OK OK OK OK na na na na na na na na na na na na na na na na R760- TPH-D<br />
SS-9-0.0 0.0-0.5 12/16/02 x x Torrent 0212095 R760 na na na na na na na na na na OK OK OK OK na na na na na na na na na na na na na na na na na na na na R760- TEPH<br />
TPH-D LCS: TPH-D Trifluorotoluene<br />
J: TEPH Torrent 0212095<br />
1.256 mg/kg 41.5% vs 50% 23.5% vs 65% biased<br />
R717- TPH-G<br />
SS-9-1.5 1.5-2 12/16/02 x x x<br />
J+: TPH-G R717/R724 na na na na na na na na na na OK OK vs ND biased low OK low OK OK na na na na na na na na na na na na na na na na R724- TEPH<br />
SS-10-C NA 12/16/02 Torrent 0212095 na na na na na na na na na na na na na na na na na na na na na na na na na na na na na na na na na na<br />
SS-10-RH x x x x x<br />
SS-10-RH x x x x x<br />
SS-10-RH x x x x x<br />
J: Pesticides<br />
J+: PCBs<br />
J: Pesticides<br />
J+: PCBs<br />
J: Pesticides<br />
J+: PCBs<br />
Torrent 0212095<br />
R766/R760/R722/R723 na na na na na OK OK OK OK na OK OK OK OK na na na na na na na na OK<br />
Torrent 0212095<br />
R766/R760/R722/R723 na na na na na OK OK OK OK na OK OK OK OK na na na na na na na na OK<br />
Torrent 0212095<br />
R766/R760/R722/R723 na na na na na OK OK OK OK na OK OK OK OK na na na na na na na na OK<br />
Organochlorine Pesticides<br />
Surrogate Spike<br />
Organochlorine Pesticides<br />
Method Blank<br />
Tetrachloro-mxylene<br />
36.0% vs<br />
65% biased low OK<br />
Tetrachloro-mxylene<br />
36.0% vs<br />
65% biased low OK<br />
Tetrachloro-mxylene<br />
36.0% vs<br />
65% biased low OK<br />
Organochlorine Pesticides<br />
LCS/LCSD/RPD<br />
PCBs Holding Time<br />
PCBs Surrogate Spike<br />
4, 4'- DDT 658% vs<br />
130%, Aldrin 469%<br />
vs 130%, Dieldrin<br />
532% vs 130%,<br />
Endrin 556% vs<br />
130%, gamma-BHC<br />
546% vs 130%,<br />
Heptachlor 492% vs<br />
130% biased high,<br />
Surr:<br />
Decachlorobiphenyl<br />
507% vs 135%, Surr:<br />
Tetrachloro-m-xylene<br />
449% vs 135% biased<br />
high OK OK<br />
4, 4'- DDT 658% vs<br />
130%, Aldrin 469%<br />
vs 130%, Dieldrin<br />
532% vs 130%,<br />
Endrin 556% vs<br />
130%, gamma-BHC<br />
546% vs 130%,<br />
Heptachlor 492% vs<br />
130% biased high,<br />
Surr:<br />
Decachlorobiphenyl<br />
507% vs 135%, Surr:<br />
Tetrachloro-m-xylene<br />
449% vs 135% biased<br />
high<br />
4, 4'- DDT 658% vs<br />
130%, Aldrin 469%<br />
vs 130%, Dieldrin<br />
532% vs 130%,<br />
Endrin 556% vs<br />
130%, gamma-BHC<br />
546% vs 130%,<br />
Heptachlor 492% vs<br />
130% biased high,<br />
Surr:<br />
Decachlorobiphenyl<br />
507% vs 135%, Surr:<br />
Tetrachloro-m-xylene<br />
449% vs 135% biased<br />
OK OK<br />
high OK OK<br />
PCBs Method Blank<br />
PCBs LCS/LCSD/RPD<br />
PAH Holding Time<br />
PAH Surrogate Spike<br />
PAH Method Blank<br />
PAH LCS/LCSD/RPD<br />
Notes<br />
Aroclor<br />
1016<br />
R766- SVOCs<br />
0.0379 vs<br />
R760- TEPH R722-<br />
0.0 biased<br />
Pesticides R723high<br />
OK na na na na PCBs<br />
Aroclor<br />
1016<br />
R766- SVOCs<br />
0.0379 vs<br />
R760- TEPH<br />
0.0 biased<br />
R722- Pesticides<br />
high OK na na na na R723- PCBs<br />
Aroclor<br />
1016<br />
R766- SVOCs<br />
0.0379 vs<br />
R760- TEPH R722-<br />
0.0 biased<br />
Pesticides R723high<br />
OK na na na na PCBs<br />
101248 - Table A-6 QC Newhall Yard Organics.xls - July 2008 3 of 6
Sample Information Lab. Analyses & Qualifiers Evaluation of QC Data Acceptability<br />
Sample ID Depth (feet below ground<br />
surface)<br />
Sample Collection Date<br />
Apparent Population<br />
VOCs<br />
SVOCs<br />
TPH-G<br />
MTBE + BTEX<br />
TPH-D<br />
TEPH<br />
Organochlorine pesticides<br />
PCBs<br />
Organic Lead<br />
PAH<br />
SS-10-RH x x x x x<br />
SS-11-0.0 0.0-0.5 12/16/02 x x x x<br />
Qualifiers<br />
J: Pesticides<br />
J+: PCBs<br />
J+: TEPH<br />
J: Pesticides<br />
J+: PCBs<br />
SS-11-1.5 1.5-2 12/16/02 x x x x J: TEPH<br />
Laboratory Project No. / Order<br />
ID No.<br />
VOCs Holding Time<br />
VOCs Surrogate Spike<br />
VOCs Method Blank<br />
VOCs LCS/LCSD 1 /RPD 2<br />
VOCs MS/MSD 3 /RPD<br />
Table A-6 Quality Control Review for Samples Collected by Earth Tech from UPRR Newhall Yard - Organics<br />
SVOCs Holding Time<br />
SVOCs Surrogate Spike<br />
SVOCs Method Blank<br />
SVOCs LCS/LCSD/RPD<br />
Torrent 0212095<br />
R766/R760/R722/R723 na na na na na OK OK OK OK na OK OK OK OK na na na na na na na na OK<br />
Torrent 0212095<br />
R760/722/R723 na na na na na na na na na na OK<br />
Torrent 0212095<br />
R766/R717/R724 na na na na na OK OK OK OK na OK OK<br />
SVOCs MS/MSD/RPD<br />
TEPH Holding Time<br />
TEPH Surrogate Spike<br />
TEPH Method Blank<br />
TEPH LCS/LCSD/RPD<br />
TPH-G Holding Time<br />
TPH-G Surrogate Spike<br />
Pentacosa<br />
ne 154%<br />
vs 150%<br />
biased<br />
high OK OK na na na na na na na na OK<br />
TPH-G Method Blank<br />
TPH-G LCS/LCSD/RPD<br />
MTBE & BTEX Holding Time<br />
MTBE & BTEX Surrogate<br />
Spike<br />
MTBE & BTEX Method Blank<br />
MTBE & BTEX<br />
LCS/LCSD/RPD<br />
Organochlorine Pesticides<br />
Holding Time<br />
Organochlorine Pesticides<br />
Surrogate Spike<br />
Organochlorine Pesticides<br />
Method Blank<br />
Tetrachloro-mxylene<br />
36.0% vs<br />
65% biased low OK<br />
Tetrachloro-mxylene<br />
34.2% vs<br />
65% biased low OK<br />
Organochlorine Pesticides<br />
LCS/LCSD/RPD<br />
PCBs Holding Time<br />
PCBs Surrogate Spike<br />
4, 4'- DDT 658% vs<br />
130%, Aldrin 469%<br />
vs 130%, Dieldrin<br />
532% vs 130%,<br />
Endrin 556% vs<br />
130%, gamma-BHC<br />
546% vs 130%,<br />
Heptachlor 492% vs<br />
130% biased high,<br />
Surr:<br />
Decachlorobiphenyl<br />
507% vs 135%, Surr:<br />
Tetrachloro-m-xylene<br />
449% vs 135% biased<br />
high OK OK<br />
4, 4'- DDT 658% vs<br />
130%, Aldrin 469%<br />
vs 130%, Dieldrin<br />
532% vs 130%,<br />
Endrin 556% vs<br />
130%, gamma-BHC<br />
546% vs 130%,<br />
Heptachlor 492% vs<br />
130% biased high,<br />
Surr:<br />
Decachlorobiphenyl<br />
507% vs 135%, Surr:<br />
Tetrachloro-m-xylene<br />
449% vs 135% biased<br />
high OK OK<br />
PCBs Method Blank<br />
PCBs LCS/LCSD/RPD<br />
PAH Holding Time<br />
PAH Surrogate Spike<br />
PAH Method Blank<br />
PAH LCS/LCSD/RPD<br />
Notes<br />
Aroclor<br />
1016<br />
R766- SVOCs<br />
0.0379 vs<br />
R760- TEPH R722-<br />
0.0 biased<br />
Pesticides R723high<br />
OK na na na na PCBs<br />
Aroclor<br />
1016<br />
0.0379 vs<br />
R760- TEPH R722-<br />
0.0 biased<br />
Pesticides R723high<br />
OK na na na na PCBs<br />
TPH-D LCS: TPH-D<br />
R766- SVOCs<br />
1.256 mg/kg 41.5% vs 50%<br />
R717- TPH-G R724vs<br />
ND biased low OK OK OK OK na na na na na na na na na na na na na na na na TEPH<br />
Pentacosa<br />
ne 19.5% TPH-D<br />
vs 50% 1.256 mg/kg<br />
SS-12-0.0 0.0-0.5 12/17/02 x x J+: TEPH Torrent 0212100 R761 na na na na na na na na na na OK biased low vs ND OK na na na na na na na na na na na na na na na na na na na na R761- TEPH<br />
SS-12-1.5 1.5-2 12/17/02 x x x x<br />
SS-13-0.0 0.0-0.5 12/17/02 x x x x<br />
J+: SVOCs<br />
J+: TEPH<br />
J+: TPH-G<br />
J+: TEPH<br />
J+: Pesticides<br />
J+: PCBs<br />
Torrent 0212100<br />
R776/R718/R761 na na na na na OK<br />
2,4,6-<br />
Tribromophenol<br />
149% vs 122%, 2-<br />
Fluorobiphenyl 136%<br />
vs 115%, 2-<br />
Fluorophenol 121%<br />
vs 144%,<br />
Nitrobenzene-d5<br />
140% vs 91%,<br />
Phenol-d6 147% vs<br />
91%, p-Terphenyld14<br />
195% vs 137%<br />
biased high OK OK na OK<br />
Torrent 0212100<br />
R761/R722/R723 na na na na na na na na na na OK OK<br />
SS-13.1.5 1.5-2 12/17/02 x x J+: TEPH Torrent 0212100 R761 na na na na na na na na na na OK OK<br />
Pentacosa<br />
ne 23.3%<br />
vs 50%<br />
biased<br />
high<br />
TPH-D<br />
1.256 mg/kg<br />
vs ND OK OK OK<br />
TPH-G:<br />
37.94<br />
R776- SVOCs<br />
ug/L vs<br />
R718- TPH-G<br />
ND OK na na na na na na na na na na na na na na na na R761- TEPH<br />
TPH-D<br />
1.256 mg/kg<br />
vs ND OK na na na na na na na na OK<br />
Decachlorobiph<br />
enyl 183% vs<br />
135% biased<br />
high OK<br />
LCS: 4,4'-DDT 658%<br />
vs 130%, Aldrin<br />
469% vs 130%,<br />
Diedrin 532% vs<br />
130%, Endrin 556%<br />
vs 130%, gamma-<br />
BHC 546% vs 130%,<br />
Heptachlor 492% vs<br />
130%, Surr:<br />
Decachlorobiphenyl<br />
507% vs 135%, Surr:<br />
Tetrachloro-m-xylene<br />
449% vs 135%<br />
LCSD: 4,4'-DDT<br />
134% vs 130% - RPD<br />
65.78 vs 30, Aldrin<br />
RPD 46.95 vs 30,<br />
Dieldrin RPD 53.24 vs<br />
30, Endrin RPD 55.55<br />
vs 30, gamma-BHC<br />
54.6 vs 30, Heptachlor<br />
49.24 vs 30 OK OK<br />
Aroclor<br />
1016:<br />
0.0379<br />
R761- TEPH<br />
mg/kg vs<br />
R722- Pesticides<br />
ND OK na na na na R723- PCBs<br />
TPH-D<br />
1.256 mg/kg<br />
vs ND OK na na na na na na na na na na na na na na na na na na na na R761- TEPH<br />
101248 - Table A-6 QC Newhall Yard Organics.xls - July 2008 4 of 6
Sample Information Lab. Analyses & Qualifiers Evaluation of QC Data Acceptability<br />
Sample ID Depth (feet below ground<br />
surface)<br />
Sample Collection Date<br />
Apparent Population<br />
VOCs<br />
SVOCs<br />
TPH-G<br />
MTBE + BTEX<br />
TPH-D<br />
TEPH<br />
Organochlorine pesticides<br />
PCBs<br />
Organic Lead<br />
PAH<br />
SS-14-0.0 0.0-0.5 12/17/02 x x x x<br />
SS-14-1.5 1.5-2 12/17/02 x x x x<br />
Qualifiers<br />
J+: TEPH<br />
J+: Pesticides<br />
J+: PCBs<br />
J+: TEPH<br />
J+: TPH-G<br />
Laboratory Project No. / Order<br />
ID No.<br />
VOCs Holding Time<br />
VOCs Surrogate Spike<br />
VOCs Method Blank<br />
VOCs LCS/LCSD 1 /RPD 2<br />
VOCs MS/MSD 3 /RPD<br />
Table A-6 Quality Control Review for Samples Collected by Earth Tech from UPRR Newhall Yard - Organics<br />
Torrent 0212100<br />
R761/R722/R723 na na na na na na na na na na OK OK<br />
Torrent 0212100<br />
R776/R718/R761 na na na na na OK OK OK OK na OK OK<br />
SS-15-0.0 0.0-0.5 12/17/02 x x J+: TEPH Torrent 0212100 R761 na na na na na na na na na na OK OK<br />
SVOCs Holding Time<br />
SVOCs Surrogate Spike<br />
SVOCs Method Blank<br />
SVOCs LCS/LCSD/RPD<br />
SVOCs MS/MSD/RPD<br />
TEPH Holding Time<br />
TEPH Surrogate Spike<br />
TEPH Method Blank<br />
TEPH LCS/LCSD/RPD<br />
TPH-G Holding Time<br />
TPH-G Surrogate Spike<br />
TPH-G Method Blank<br />
TPH-D<br />
1.256 mg/kg<br />
vs ND OK na na na na na na na na OK OK OK<br />
TPH-D<br />
1.256 mg/kg<br />
vs ND OK OK OK<br />
TPH-D<br />
1.256 mg/kg<br />
TPH-G LCS/LCSD/RPD<br />
MTBE & BTEX Holding Time<br />
MTBE & BTEX Surrogate<br />
Spike<br />
MTBE & BTEX Method Blank<br />
MTBE & BTEX<br />
LCS/LCSD/RPD<br />
Organochlorine Pesticides<br />
Holding Time<br />
Organochlorine Pesticides<br />
Surrogate Spike<br />
Organochlorine Pesticides<br />
Method Blank<br />
Organochlorine Pesticides<br />
LCS/LCSD/RPD<br />
PCBs Holding Time<br />
PCBs Surrogate Spike<br />
LCS: 4,4'-DDT 658%<br />
vs 130%, Aldrin<br />
469% vs 130%,<br />
Diedrin 532% vs<br />
130%, Endrin 556%<br />
vs 130%, gamma-<br />
BHC 546% vs 130%,<br />
Heptachlor 492% vs<br />
130%, Surr:<br />
Decachlorobiphenyl<br />
507% vs 135%, Surr:<br />
Tetrachloro-m-xylene<br />
449% vs 135%<br />
LCSD: 4,4'-DDT<br />
134% vs 130% - RPD<br />
65.78 vs 30, Aldrin<br />
RPD 46.95 vs 30,<br />
Dieldrin RPD 53.24 vs<br />
30, Endrin RPD 55.55<br />
vs 30, gamma-BHC<br />
54.6 vs 30, Heptachlor<br />
49.24 vs 30 OK OK<br />
PCBs Method Blank<br />
PCBs LCS/LCSD/RPD<br />
PAH Holding Time<br />
PAH Surrogate Spike<br />
PAH Method Blank<br />
PAH LCS/LCSD/RPD<br />
Notes<br />
Aroclor<br />
1016:<br />
0.0379<br />
R761- TEPH<br />
mg/kg vs<br />
R722- Pesticides<br />
ND OK na na na na R723- PCBs<br />
TPH-G:<br />
37.94<br />
R776- SVOCs<br />
ug/L vs<br />
R718- TPH-G<br />
ND OK na na na na na na na na na na na na na na na na R761- TEPH<br />
vs ND OK na na na na na na na na na na na na na na na na na na na na R761- TEPH<br />
TPH-D<br />
1.256 mg/kg<br />
vs ND OK OK OK<br />
J+: TEPH Torrent 0212100<br />
SS-15-1.5 1.5-2 12/17/02 x x x<br />
J+: TPH-G R718/R761 na na na na na na na na na na OK OK<br />
ND OK na na na na na na na na na na na na na na na na<br />
SS-16-0.0 0.0-0.5 06/24/03 Torrent 0306098 na na na na na na na na na na na na na na na na na na na na na na na na na na na na na na na na na na<br />
SS-16-1.5 1.5-2 06/24/03 Torrent 0306098 na na na na na na na na na na na na na na na na na na na na na na na na na na na na na na na na na na<br />
SS-16-3.0 3-3.5 06/27/03 Torrent 0306098 na na na na na na na na na na na na na na na na na na na na na na na na na na na na na na na na na na<br />
SS-17-0.0 0.0-0.5 06/24/03 Torrent 0306098 na na na na na na na na na na na na na na na na na na na na na na na na na na na na na na na na na na<br />
SS-17-1.5 1.5-2 06/27/03 Torrent 0306098 na na na na na na na na na na na na na na na na na na na na na na na na na na na na na na na na na na<br />
SS-17-3.0 3-3.5 06/27/03 Torrent 0306098 na na na na na na na na na na na na na na na na na na na na na na na na na na na na na na na na na na<br />
SS-18-0.0 0.0-0.5 06/24/03 x x x x<br />
SS-18-1.5 1.5-2 06/24/03 x x x x x<br />
SS-19-0.0 0.0-0.5 06/24/03 x x x x<br />
J: Pesticides<br />
J+: PCBs<br />
J: Pesticides<br />
J+: PCBs<br />
J: Pesticides<br />
J+: PCBs<br />
Torrent 0306091<br />
R1645/R1675/R1674 na na na na na na na na na na OK OK OK OK na na na na na na na na OK OK<br />
Torrent 0306091<br />
R1654/R1645/R1675/R16<br />
74 na na na na na na na na na na OK OK OK OK OK OK OK OK na na na na OK OK<br />
Torrent 0306091<br />
R1645/R1675/R1674 na na na na na na na na na na OK OK OK OK na na na na na na na na OK OK<br />
TPH-G:<br />
37.94<br />
ug/L vs<br />
4, 4'-DDT<br />
0.4476, Aldrin<br />
0.1226,<br />
Endosulfan II<br />
0.3792. gamma-<br />
BHC 0.7789<br />
ug/kg<br />
4, 4'-DDT<br />
0.4476, Aldrin<br />
0.1226,<br />
Endosulfan II<br />
0.3792. gamma-<br />
BHC 0.7789<br />
ug/kg<br />
4, 4'-DDT<br />
0.4476, Aldrin<br />
0.1226,<br />
Endosulfan II<br />
0.3792. gamma-<br />
BHC 0.7789<br />
ug/kg<br />
LCSD: Aldrin RPD,<br />
MS: 4,4'-DDT 21.9%<br />
vs 65%, MSD: 4,4'-<br />
DDT -47.4% vs 65% OK OK<br />
LCSD: Aldrin RPD,<br />
MS: 4,4'-DDT 21.9%<br />
vs 65%, MSD: 4,4'-<br />
DDT -47.4% vs 65% OK OK<br />
LCSD: Aldrin RPD,<br />
MS: 4,4'-DDT 21.9%<br />
vs 65%, MSD: 4,4'-<br />
DDT -47.4% vs 65% OK OK<br />
R718- TPH-G<br />
R761- TEPH<br />
Aroclor<br />
1260<br />
R1645- TEPH<br />
0.0095<br />
R1675- Pesticides<br />
mg/kg OK na na na na R1674- PCBs<br />
Aroclor<br />
R1654- TPH-G<br />
1260<br />
R1645- TEPH<br />
0.0095<br />
R1675- Pesticides<br />
mg/kg OK na na na na R1674- PCBs<br />
Aroclor<br />
1260<br />
R1645- TEPH<br />
0.0095<br />
R1675- Pesticides<br />
mg/kg OK na na na na R1674- PCBs<br />
4, 4'-DDT<br />
0.4476, Aldrin<br />
0.1226,<br />
Endosulfan II LCSD: Aldrin RPD,<br />
Aroclor<br />
R1654- TPH-G<br />
Torrent 0306091<br />
0.3792. gamma- MS: 4,4'-DDT 21.9%<br />
1260<br />
R1645- TEPH<br />
J: Pesticides R1654/R1645/R1675/R16<br />
BHC 0.7789 vs 65%, MSD: 4,4'-<br />
0.0095<br />
R1675- Pesticides<br />
SS-19-1.5 1.5-2 06/24/03 x x x x x J+: PCBs 74 na na na na na na na na na na OK OK OK OK OK OK OK OK na na na na OK OK<br />
ug/kg DDT -47.4% vs 65% OK OK mg/kg OK na na na na R1674- PCBs<br />
SS-19-3.0 3-3.5 06/24/03 Torrent 0306091 na na na na na na na na na na na na na na na na na na na na na na na na na na na na na na na na na na<br />
SS-20-0.0 0.0-0.5 06/24/03 x x x x<br />
J: Pesticides<br />
J+: PCBs<br />
Torrent 0306091<br />
R1645/R1675/R1674 na na na na na na na na na na OK OK OK OK OK OK OK OK na na na na OK OK<br />
4, 4'-DDT<br />
0.4476, Aldrin<br />
0.1226,<br />
Endosulfan II<br />
0.3792. gamma-<br />
BHC 0.7789<br />
ug/kg<br />
LCSD: Aldrin RPD,<br />
MS: 4,4'-DDT 21.9%<br />
vs 65%, MSD: 4,4'-<br />
DDT -47.4% vs 65% OK OK<br />
Aroclor<br />
1260<br />
R1645- TEPH<br />
0.0095<br />
R1675- Pesticides<br />
mg/kg OK na na na na R1674- PCBs<br />
101248 - Table A-6 QC Newhall Yard Organics.xls - July 2008 5 of 6
Sample Information Lab. Analyses & Qualifiers Evaluation of QC Data Acceptability<br />
Sample ID Depth (feet below ground<br />
surface)<br />
Sample Collection Date<br />
Apparent Population<br />
VOCs<br />
SVOCs<br />
TPH-G<br />
MTBE + BTEX<br />
TPH-D<br />
TEPH<br />
Organochlorine pesticides<br />
PCBs<br />
Organic Lead<br />
PAH<br />
SS-20-1.5 1.5-2 06/24/03 x x x x x<br />
SS-21-0.0 0.0-0.5 06/24/03 x x x x<br />
Qualifiers<br />
J: Pesticides<br />
J+: PCBs<br />
J: Pesticides<br />
J+: PCBs<br />
Laboratory Project No. / Order<br />
ID No.<br />
VOCs Holding Time<br />
VOCs Surrogate Spike<br />
VOCs Method Blank<br />
VOCs LCS/LCSD 1 /RPD 2<br />
VOCs MS/MSD 3 /RPD<br />
Table A-6 Quality Control Review for Samples Collected by Earth Tech from UPRR Newhall Yard - Organics<br />
SVOCs Holding Time<br />
SVOCs Surrogate Spike<br />
SVOCs Method Blank<br />
SVOCs LCS/LCSD/RPD<br />
Torrent 0306091<br />
R1654/R1645/R1675/R16<br />
74 na na na na na na na na na na OK OK OK OK OK OK OK OK na na na na OK OK<br />
Torrent 0306091<br />
R1645/R1675/R1674 na na na na na na na na na na OK OK OK OK na na na na na na na na OK OK<br />
SVOCs MS/MSD/RPD<br />
TEPH Holding Time<br />
TEPH Surrogate Spike<br />
TEPH Method Blank<br />
TEPH LCS/LCSD/RPD<br />
TPH-G Holding Time<br />
TPH-G Surrogate Spike<br />
TPH-G Method Blank<br />
TPH-G LCS/LCSD/RPD<br />
MTBE & BTEX Holding Time<br />
MTBE & BTEX Surrogate<br />
Spike<br />
MTBE & BTEX Method Blank<br />
MTBE & BTEX<br />
LCS/LCSD/RPD<br />
Organochlorine Pesticides<br />
Holding Time<br />
Organochlorine Pesticides<br />
Surrogate Spike<br />
Organochlorine Pesticides<br />
Method Blank<br />
4, 4'-DDT<br />
0.4476, Aldrin<br />
0.1226,<br />
Endosulfan II<br />
0.3792. gamma-<br />
BHC 0.7789<br />
ug/kg<br />
4, 4'-DDT<br />
0.4476, Aldrin<br />
0.1226,<br />
Endosulfan II<br />
0.3792. gamma-<br />
BHC 0.7789<br />
ug/kg<br />
Organochlorine Pesticides<br />
LCS/LCSD/RPD<br />
PCBs Holding Time<br />
PCBs Surrogate Spike<br />
LCSD: Aldrin RPD,<br />
MS: 4,4'-DDT 21.9%<br />
vs 65%, MSD: 4,4'-<br />
DDT -47.4% vs 65% OK OK<br />
LCSD: Aldrin RPD,<br />
MS: 4,4'-DDT 21.9%<br />
vs 65%, MSD: 4,4'-<br />
DDT -47.4% vs 65% OK OK<br />
PCBs Method Blank<br />
PCBs LCS/LCSD/RPD<br />
PAH Holding Time<br />
PAH Surrogate Spike<br />
PAH Method Blank<br />
PAH LCS/LCSD/RPD<br />
Notes<br />
Aroclor<br />
R1654- TPH-G<br />
1260<br />
R1645- TEPH<br />
0.0095<br />
R1675- Pesticides<br />
mg/kg OK na na na na R1674- PCBs<br />
Aroclor<br />
1260<br />
R1645- TEPH<br />
0.0095<br />
R1675- Pesticides<br />
mg/kg OK na na na na R1674- PCBs<br />
4, 4'-DDT<br />
0.4476, Aldrin<br />
0.1226,<br />
Endosulfan II LCSD: Aldrin RPD,<br />
Aroclor<br />
R1654- TPH-G<br />
Torrent 0306091<br />
0.3792. gamma- MS: 4,4'-DDT 21.9%<br />
1260<br />
R1645- TEPH<br />
J: Pesticides R1654/R1645/R1675/R16<br />
BHC 0.7789 vs 65%, MSD: 4,4'-<br />
0.0095<br />
R1675- Pesticides<br />
SS-21-1.5 1.5-2 06/24/03 x x x x x J+: PCBs 74 na na na na na na na na na na OK OK OK OK OK OK OK OK na na na na OK OK<br />
ug/kg DDT -47.4% vs 65% OK OK mg/kg OK na na na na R1674- PCBs<br />
SS-21-3.0 3-3.5 06/24/03 Torrent 0306091 na na na na na na na na na na na na na na na na na na na na na na na na na na na na na na nn na na na<br />
SS-22-0.0 0.0-0.5 06/23/03 x x x x<br />
J-: TEPH<br />
J: Pesticides<br />
J+: PCBs<br />
Torrent 0306081<br />
Pentacosa<br />
ne 43.3%<br />
vs 50%<br />
R1645/R1675/R1674 na na na na na na na na na na OK biased low OK OK na na na na na na na na OK OK<br />
J-: TPH-G Torrent 0306081<br />
J: Pesticides R1638/R1645/R1675/R16<br />
SS-22-1.5 1.5-2 06/23/03 x x x x x J+: PCBs 74 na na na na na na na na na na OK OK OK OK OK OK OK<br />
Notes:<br />
1LCS/LCSD<br />
= laboratory control spike/LCS duplicate BTEX = Benzene, Toluene, Ethylbenzene, and Xylenes<br />
2<br />
RPD = Relative Percent Difference MTBE = Methyl Tertiary Butyl Ether<br />
3<br />
MS/MSD = matrix spike/MS duplicate PAH = Polynuclear Aromatic Hydrocarbon<br />
4<br />
na = Not analyzed PCB = Polychlorinated Biphenyl<br />
5<br />
J- = Estimated, biased low SVOCs = Semivolatile Organic Compounds<br />
6<br />
R = Rejected TEPH = Total Extractable Petroleum Hydrocarbons<br />
7<br />
J = Estimated TPH-D = Total Petroleum Hydrocarbons as Diese<br />
8<br />
J+ = Estimated, biased high TPH-G = Total Petroleum Hydrocarbons as Gasoline<br />
VOCs = Volatile Organic Compounds<br />
MS: TPH-G<br />
52.2% vs 65%,<br />
MSD: TPH-G<br />
41% vs 65% na na na na OK OK<br />
4, 4'-DDT<br />
0.4476, Aldrin<br />
0.1226,<br />
Endosulfan II<br />
0.3792. gamma-<br />
BHC 0.7789<br />
ug/kg<br />
4, 4'-DDT<br />
0.4476, Aldrin<br />
0.1226,<br />
Endosulfan II<br />
0.3792. gamma-<br />
BHC 0.7789<br />
ug/kg<br />
LCSD: Aldrin RPD,<br />
MS: 4,4'-DDT 21.9%<br />
vs 65%, MSD: 4,4'-<br />
DDT -47.4% vs 65% OK OK<br />
LCSD: Aldrin RPD,<br />
MS: 4,4'-DDT 21.9%<br />
vs 65%, MSD: 4,4'-<br />
DDT -47.4% vs 65% OK OK<br />
Aroclor<br />
1260<br />
R1645- TEPH<br />
0.0095<br />
R1675- Pesticides<br />
mg/kg OK na na na na R1674- PCBs<br />
Aroclor<br />
R1638- TPH-G<br />
1260<br />
R1645- TEPH<br />
0.0095<br />
R1675- Pesticides<br />
mg/kg OK na na na na R1674- PCBs<br />
101248 - Table A-6 QC Newhall Yard Organics.xls - July 2008 6 of 6
101248 – <strong>Appendix</strong> B – July 2008 i<br />
TABLE OF CONTENTS<br />
Human Health Risk Assessment<br />
Contaminant Management Plan, SVRT/BART Extension<br />
Section Page<br />
1.0 INTRODUCTION ......................................................................................................................... 1<br />
1.1 Site Location and Description............................................................................................. 1<br />
1.2 Site Characterization...........................................................................................................2<br />
2.0 EXPOSURE ASSESSMENT ........................................................................................................ 3<br />
2.1 Exposure Setting................................................................................................................. 3<br />
2.2 Potentially Exposed Populations and Pathways of Exposure ............................................. 4<br />
2.2.1 Reuse Scenario 1................................................................................................. 4<br />
2.2.2 Reuse Scenario 2................................................................................................. 4<br />
2.2.3 Reuse Scenario 3................................................................................................. 5<br />
2.2.4 Reuse Scenario 4................................................................................................. 5<br />
2.2.5 Reuse Scenario 5................................................................................................. 5<br />
2.3 Selection of Chemicals of Potential Concern ..................................................................... 6<br />
3.0 TOXICITY ASSESSMENT.......................................................................................................... 7<br />
3.1 Toxicity Values................................................................................................................... 7<br />
3.1.1 Toxicity Values for Non-carcinogens ................................................................. 7<br />
3.1.2 Toxicity Values for Carcinogens......................................................................... 9<br />
3.2 Availability of Toxicity Values ........................................................................................ 11<br />
4.0 CALCULATION OF HUMAN HEALTH RISK-BASED REUSE<br />
CONCENTRATIONS ................................................................................................................. 12<br />
4.1 Noncancer Risk-Based Concentrations for Chemicals in Soil/Fill................................... 12<br />
4.2 Cancer Risk-Based Concentrations for Chemicals in Soil/Fill......................................... 14<br />
4.3 Concentrations for Lead in Soil/Fill ................................................................................. 16<br />
4.4 Exposure Parameters......................................................................................................... 18<br />
4.5 Arsenic Bioavailability ..................................................................................................... 22<br />
5.0 RESULTS ..................................................................................................................................... 23<br />
6.0 UNCERTAINTY.......................................................................................................................... 26<br />
6.1 Uncertainties in Exposure Assessment ............................................................................. 26<br />
6.2 Uncertainties in Toxicity Assessment............................................................................... 27<br />
6.3 Uncertainty Conclusion .................................................................................................... 28<br />
7.0 REFERENCES............................................................................................................................. 29<br />
ATTACHMENTS<br />
B-1 Risk-Based Calculations for Reuse Scenarios
101248 – <strong>Appendix</strong> B – July 2008 ii<br />
LIST OF TABLES<br />
Human Health Risk Assessment<br />
Contaminant Management Plan, SVRT/BART Extension<br />
Table B-1 Toxicity Criteria....................................................................................................................... 8<br />
Table B-2 Exposure Parameters.............................................................................................................. 19<br />
Table B-3 Summary of Site-Specific Reuse Values ............................................................................... 24<br />
Table B-4 Summary of Lead Reuse Values............................................................................................ 25<br />
Page
101248 – <strong>Appendix</strong> B – July 2008 iii<br />
LIST OF ABBREVIATIONS AND ACRONYMS<br />
Human Health Risk Assessment<br />
Contaminant Management Plan, SVRT/BART Extension<br />
BART Bay Area Rapid Transit<br />
CERCLA Comprehensive Environmental Response, Compensation and Liability Act<br />
CMP Contaminant Management Plan<br />
COPC chemicals of potential concern<br />
CSF cancer slope factor<br />
DTSC Department of Toxic Substance and Control<br />
HI Hazard Index<br />
HQ Hazard Quotient<br />
HHRA human health risk assessment<br />
kg kilogram<br />
LOAEL low adverse effect level<br />
mg/d milligrams per day<br />
mg/m 3 milligrams per cubic meter<br />
mg/kg milligrams per kilogram<br />
mg/kg-day milligrams per kilogram per day<br />
m 3 /day cubic meter per day<br />
mg/day milligrams per day<br />
mg/kg milligrams per kilogram<br />
ND not detected<br />
NE not established<br />
NOAEL no adverse effect level<br />
OEHHA Office of Environmental Health Hazard Assessment<br />
PAH polyaromatic hydrocarbon<br />
PEF particulate emission factor<br />
RfC reference concentration<br />
RfD reference dose<br />
RWQCB Regional Water Control Board<br />
TPH total petroleum hydrocarbons<br />
UF uncertainty factor<br />
U.S. EPA United States Environmental Protection Agency<br />
VF volatilization factor<br />
VOC volatile organic compound<br />
<strong>VTA</strong> Santa Clara Valley Transportation Authority<br />
WOE weight of evidence<br />
µg/l micrograms per liter<br />
µg/m 3 micrograms per cubic meter<br />
mg/m 3 milligrams per cubic meter<br />
mg/kg-day milligrams per kilogram per day<br />
m 3 /day cubic meter per day
1.0 INTRODUCTION<br />
Human Health Risk Assessment<br />
Contaminant Management Plan, SVRT/BART Extension<br />
The purpose of this assessment is to develop criteria for the reuse of excavated soil which will be<br />
disturbed during construction operations to extent the Bay Area Rapid Transit (BART) system from<br />
Fremont into Silicon Valley, and link up with public transportation from the Santa Clara Valley<br />
Transportation Authority (<strong>VTA</strong>). Soil excavation will occur along the rail lines, rail right-of-way, and<br />
with the construction of related facilities such as stations and maintenance areas. The criteria developed<br />
in this report are designed to be protective of human health and the environment, and will be used to<br />
guide where and how the excavated soil can be reused, both on- and off-site. These criteria will be<br />
used in the Contaminant Management Plan (CMP), along with other criteria developed by State and<br />
Federal agencies, to select final chemical-specific criteria for the various reuse options specified in the<br />
CMP.<br />
1.1 SITE LOCATION AND DESCRIPTION<br />
The <strong>VTA</strong> is responsible for the extension of the BART system through Silicon Valley for 16.3 miles,<br />
from Fremont to Santa Clara. This project is known as the Silicon Valley Rapid Transit (SVRT)<br />
project, or the BART SJX extension. Segments of the project include the following:<br />
• Line Segment: The Line Segment extends approximately 9.8 miles in a north-south alignment<br />
from the planned Warm Springs BART Station in Fremont through Milpitas to the East Tunnel<br />
Portal in San Jose. The track will be located along a former Union Pacific Railroad (UPRR)<br />
alignment. The UPRR alignment was owned and operated by Western Pacific Railroad (WPRR)<br />
before it was purchased by UPRR. <strong>VTA</strong> has since purchased the alignment from UPRR<br />
• Tunnel Segment: The Tunnel Segment extends in a general east-west alignment beginning at the<br />
East Tunnel Portal located at the southern limit of the Line Segment, extends towards the west<br />
as a subway under Santa Clara Street in downtown San Jose, and ends at the West Tunnel<br />
Portal near Newhall Street in San Jose.<br />
• Yard and Shops Segment (Facilities Segment): The Yard and Shops Segment begins at the<br />
West Tunnel Portal and extends to the Project’s terminus near the existing Caltrain Station in<br />
the City of Santa Clara and will include a maintenance facility.<br />
• Stations Segment: The Stations Segment includes project improvements, such as parking<br />
garages, access roads, and bus transit facilities, on the portions of the stations campuses not<br />
directly on the BART alignment.<br />
101248 – <strong>Appendix</strong> B – July 2008 Page 1
1.2 SITE CHARACTERIZATION<br />
Human Health Risk Assessment<br />
Contaminant Management Plan, SVRT/BART Extension<br />
Soil along the right-of-way and proposed locations for stations and maintenance facilities have<br />
undergone extensive chemical characterization. The results of these investigations have been reported<br />
primarily in the following documents:<br />
• Jacobs, Chase, Frick Kleinkopf & Kelly, LLC. 2001. Environmental Documents for WP<br />
Milpitas Line, Prepared by: Geomatrix, 2101 Webster Street, 12 th Floor, Oakland, CA 94612,<br />
Date: October 8, 2001.<br />
• Earth Tech, 2002. UPRR Alignment Investigation Data for BART Extension to San Jose,<br />
Fremont/Milpitas/San Jose, California. March 29.<br />
• Earth Tech, 2003a. Draft Phase II Investigation Data Summary Report for UPRR Newhall<br />
Yard, San Jose/Santa Clara, California. February 11.<br />
• Earth Tech, 2003b. Draft Additional Investigation Data Summary Report for UPRR Newhall<br />
Yard, San Jose/Santa Clara, California. July 25.<br />
• Earth Tech, 2004. Silicon Valley Rapid Transit Project, Draft Line Segment <strong>Hazardous</strong><br />
<strong>Materials</strong> Characterization Report. March 18.<br />
A summary of the chemicals tested and detected at the site is presented in <strong>Appendix</strong> A of the CMP.<br />
Briefly, all of the California Assessment Manual (CAM) 17 metals were detected at least once in soil<br />
sampled to characterize the site. While this assessment will develop health-based reuse levels of all the<br />
metals, the general distribution and detected levels suggest that the only metals likely to be of concern<br />
at this site are arsenic and lead. Both volatile and semivolatile organic chemicals have also been tested<br />
in site soil. The most frequently detected organic compounds are total petroleum hydrocarbons (TPH).<br />
In general, however, only the higher-boiling point fraction of TPH (i.e., motor oil) was detected.<br />
Lighter petroleum hydrocarbon constituents (i.e., ethylbenzene, toluene and xylenes) were detected<br />
only in one sample, and polyaromatic hydrocarbons were not detected. The agricultural pesticides<br />
DDE and DDT were the most frequently detected organic chemicals at the site, and were detected in<br />
about 6 percent of the samples. Other pesticides (i.e., alpha and gamma chlordane, endrin aldehyde,<br />
dieldrin and toxaphene) were detected in only one or two samples. Similarly, polychlorinated biphenyls<br />
(PCBs) were tested from various locations, and were only detected (as Aroclor 1260) in a few samples<br />
collected from the Newhall Yard portion of the site.<br />
101248 – <strong>Appendix</strong> B – July 2008 Page 2
2.0 EXPOSURE ASSESSMENT<br />
Human Health Risk Assessment<br />
Contaminant Management Plan, SVRT/BART Extension<br />
The proposed project is expected to involve excavation activities that are anticipated to move relatively<br />
large quantities of soil. Based on the results of the chemical characterization described above, the reuse<br />
of that soil may result in exposure of personnel involved in the construction as well as post-construction<br />
workers, and visitors (e.g., commuters) to the constructed facilities to chemicals detected in soil. In<br />
addition, if site soil is exported off-site, exposure to surface or subsurface soil may occur to off-site<br />
receptors.<br />
The presence of streams along the proposed right-of-way raises the possibility that site soil may be<br />
disturbed during construction operations and be transported into freshwater bodies, and perhaps<br />
downstream into the San Francisco Bay. Criteria to protect fresh and marine water have been<br />
developed by several agencies. For this reason, such criteria are not developed specifically for the<br />
CMP as they are for the protection of human health. The CMP specifies that these criteria be<br />
considered at locations on the project site where freshwater or marine habitats may be impacted by<br />
project activities. Similarly, if excavation and subsequent encapsulation requires site soil to be buried<br />
within 5 feet of the groundwater table, the CMP specifies or provides the procedures used to specify<br />
what levels of chemicals are necessary so that potential leaching will not impact underlying<br />
groundwater to levels in excess of drinking water standards.<br />
2.1 EXPOSURE SETTING<br />
Although project options are currently being evaluated to select the exact route and height the rail line<br />
will take, it is certain where the extension will start, and what sort of activities it will entail. The <strong>VTA</strong><br />
portion of the BART extension will begin at the planned Warm Springs Station, and proceed into San<br />
Jose and Santa Clara. The activities will involve excavation and construction to develop rail lines,<br />
stations and a maintenance facility. Following construction, activities will include right-of-way and rail<br />
car maintenance, and the occasional or routine visits to stations by travelers and commuters.<br />
Currently, the land is used for a variety of purposes. Much of the land in the line segment portion of<br />
the site is railroad right-of-way. Some of the right-of-way is located in an open, rural setting, though<br />
most is located in an urban setting. The urban portion of the BART line is located primarily in areas<br />
with a history of commercial and light industrial land use, as are the planned locations for the BART<br />
stations. However, some portions of the BART extension pass through residential neighborhoods<br />
101248 – <strong>Appendix</strong> B – July 2008 Page 3
Human Health Risk Assessment<br />
Contaminant Management Plan, SVRT/BART Extension<br />
adjacent to the UPRR tracks. The planned location of the maintenance facility is a 50-acre area in<br />
Union Pacific’s Newhall Yard, near the Santa Clara Station.<br />
2.2 POTENTIALLY EXPOSED POPULATIONS AND PATHWAYS OF EXPOSURE<br />
Based on the planned development of the site discussed above, it is reasonable to anticipate that soil<br />
excavated during the project will be suitable for some reuse scenarios, but not for others. The potential<br />
impact to the health of the receptors associated with the various types of activities anticipated for the<br />
project is the most important of the criteria for deciding how excavated soil can be reused. These<br />
activities, and the receptors associated with them, constitute the basis for the reuse scenarios anticipated<br />
for this project. These scenarios will be used to identify the exposure parameters necessary to calculate<br />
risk-based concentrations for the chemicals of concern to protect the receptors for each reuse scenario.<br />
The reuse scenarios are described below.<br />
2.2.1 Reuse Scenario 1<br />
This scenario allows for soil to be used anywhere either on-site or off-site without restriction as to<br />
where or how the soil is used. For example, this soil could be used as fill on a site that may be<br />
developed for residential or for industrial use. Therefore, the most restrictive potential scenario,<br />
residential use, was used to develop these criteria.<br />
The potential exposure pathways used to assess the residential scenario are consistent with those<br />
recommended in the Preliminary Endangerment Assessment Guidance Manual (DTSC, 1999). These<br />
pathways assume that hypothetical residents will be exposed to chemicals in site soil via ingestion,<br />
dermal contact, inhalation of nonvolatile chemicals in fugitive dust and volatile chemicals in air.<br />
2.2.2 Reuse Scenario 2<br />
This scenario allows for soil to be used for any of the activities likely to occur on-site. These uses are<br />
best described using a hypothetical industrial exposure scenario. An industrial setting may include<br />
routine post-construction use of either station or maintenance facilities. For example, this reuse<br />
scenario also pertains to routine commuter use after construction of the station facilities. Commuters<br />
are included in this scenario because they are expected to be exposed to a lesser degree than industrial<br />
users as they are anticipated to be at a station for only a relatively short time compared to workers.<br />
Thus, a risk-based concentration developed to be protective of industrial receptors will also be<br />
protective of commuters.<br />
101248 – <strong>Appendix</strong> B – July 2008 Page 4
Human Health Risk Assessment<br />
Contaminant Management Plan, SVRT/BART Extension<br />
The potential exposure pathways used to assess the industrial scenario are consistent with those<br />
recommended in the Risk Assessment Guidance for Superfund, Volume 1, Part A (U.S. EPA, 1989).<br />
These pathways assume that hypothetical receptors engaged in an industrial setting will be exposed to<br />
chemicals in site soil via incidental ingestion, dermal contact, inhalation of nonvolatile chemicals in<br />
fugitive dust and volatile chemicals in air.<br />
2.2.3 Reuse Scenario 3<br />
This scenario allows for soil to be placed along the railroad right-of-way, and assumes that workers<br />
engaged in routine inspection and occasional maintenance of the right-of-way will come in contact with<br />
it. The exposure assumptions used to represent this scenario are similar to those used for the industrial<br />
scenario described in Reuse Scenario 2, above. However, the major difference is the frequency of<br />
exposure assumed for the right-of-way worker is significantly less than either a commuter or a facility<br />
worker. This is consistent with the expectation that a right-of-way worker will travel to all parts of the<br />
right-of-way, and thus be exposed to any one segment for a relatively short period of time.<br />
2.2.4 Reuse Scenario 4<br />
This scenario allows for soil to be placed below the final grade as part of the construction operations.<br />
Following placement, the soil will be covered in such a way as be essentially isolated from further<br />
routine contact. Thus, the exposure assumed for the purpose of calculating a risk-based reuse level will<br />
consist of the contact anticipated as part of the placement operations during construction.<br />
The potential exposure pathways used to assess the construction scenario are essentially the same as<br />
those used for the industrial scenario, but differ in the values used for some of the exposure parameters<br />
such as exposure frequency, duration, and dust generation rates.<br />
2.2.5 Reuse Scenario 5<br />
This scenario allows for soil to be placed on the surface anywhere on site and protect against chemicals<br />
in that soil from being transported as fugitive dust generated by passing trains, and adversely impacting<br />
the health of off-site, down-wind receptors. Although it is not practical to tailor this scenario to<br />
specific receptors, the most health-protective approach is to assume the most restrictive case, which<br />
would be downwind residential receptors. The approach generally follows that used for the residential<br />
receptors described in Scenario 1, with the difference being that only the inhalation pathway is<br />
evaluated in this scenario. The risk-based reuse concentrations developed for this scenario are expected<br />
101248 – <strong>Appendix</strong> B – July 2008 Page 5
Human Health Risk Assessment<br />
Contaminant Management Plan, SVRT/BART Extension<br />
to be applicable to several of the reuse scenarios described above. For this reason, instead of being a<br />
separate reuse scenario, levels develop using this scenario will be included among the various criteria<br />
for selecting the final values for reuse scenarios 1, 2, and 3.<br />
2.3 SELECTION OF CHEMICALS OF POTENTIAL CONCERN<br />
A risk-based reuse concentration will be developed for most of the chemicals detected in the<br />
characterizations studies discussed in Section 1.2, and for every reuse scenario described in Section<br />
2.3. The metals magnesium, sodium, potassium, and calcium are essential nutrients and, as such, are<br />
not considered chemicals of potential concern (COPCs) for HHRA purposes. In addition, risk-based<br />
criteria will not be developed for combinations of chemicals such as total petroleum hydrocarbons or<br />
diesel fuel because toxicity criteria are not available for such compounds. Instead, these compounds<br />
will be represented by specific chemicals which are components of petroleum hydrocarbons (e.g.,<br />
benzene).<br />
Following the development of the risk-based reuse concentrations, the concentrations detected at the site<br />
will be compared to the most stringent risk-based levels. Only the COPCs whose maximum<br />
concentrations exceed these levels will be carried forward in the Contaminant Management Plan as<br />
chemicals of concern.<br />
101248 – <strong>Appendix</strong> B – July 2008 Page 6
3.0 TOXICITY ASSESSMENT<br />
Human Health Risk Assessment<br />
Contaminant Management Plan, SVRT/BART Extension<br />
In the context of a regulatory risk assessment, toxicity of a COPC is expressed in terms its non-<br />
carcinogenic and carcinogenic potentials; each of which is defined by numerical toxicity values used to<br />
quantify risk. The following toxicity assessment provides those values selected for use in the risk<br />
assessment, as well as a general description of toxicity value derivation.<br />
3.1 TOXICITY VALUES<br />
The non-carcinogenic and carcinogenic toxicity values used in this risk assessment are presented in<br />
Table B-1. The values presented in Table B-1 are from the California Environmental Protection Office<br />
of Environmental Health Hazard Assessment (OEHHA). Two OEHHA sources were used. The<br />
primary source is the Toxicity Criteria Database (www.oehha.ca.gov/risk/ChemicalDB/index.asp). A<br />
secondary source is the Air – Chronic RELs, (www.oehha.ca.gov/air/chronic_rels/AllChrels.html). If<br />
toxicity values from OEHHA were not available, the toxicity values were provided by the following<br />
alternative sources:<br />
• Risk Assessment Information System (U,S, EPA, 2005).<br />
• U.S. EPA Region 9 Preliminary Remediation Goal Table (U.S. EPA, 2004)<br />
It should be noted that OEHHA provides toxicity criteria only for the hexavalent form of chromium.<br />
Since the activities along the right-of-way and proposed facility locations do not include those that are<br />
associated with this form, it was assumed that the chromium detected at this site as “total chromium” is<br />
not in the hexavalent form, and thus the OEHHA criteria were not used for this assessment. However,<br />
as a protective measure, the oral cancer criterion for “total chromium” used by the U.S. EPA Region 9<br />
was used for this assessment. This criterion is derived by assuming that one-sixth of the total<br />
chromium detected at a site is in the hexavalent form. Since this assumption is likely to over-estimate<br />
the calculated risk, use of this criterion is considered protective of human health.<br />
3.1.1 Toxicity Values for Non-carcinogens<br />
Non-carcinogenic toxicity values are presented as reference doses (RfDs). Oral RfDs (expressed in<br />
units of milligrams per kilogram per day [mg/kg-day]) have been developed to evaluate the potential for<br />
101248 – <strong>Appendix</strong> B – July 2008 Page 7
Table B-1 - Toxicity Criteria<br />
Human Health Risk Assessment<br />
Contaminant Management Plan, SVRT/BART Extension<br />
CSFo CSFi RfDo RfDi<br />
Metals<br />
Arsenic 9.45E+00 1.20E+01 3.00E-04 8.6E-06<br />
Barium NA NA 7.00E-02 (1) 1.4E-04 (1)<br />
Beryllium NA 8.40E+00 2.00E-03 5.7E-06 (1)<br />
Cadmium NA 1.50E+01 5.00E-04 5.7E-06<br />
Chromium NA 4.20E+01 (1) 1.50E+00 NA<br />
Cobalt NA NA 2.00E-02 (2) 5.7E-06 (2)<br />
Copper NA NA 4.00E-02 (2) NA<br />
Mercury NA NA 3.00E-04 2.6E-05<br />
Molybdenum NA NA 5.00E-03 (1) NA<br />
Nickel NA 9.10E-01 5.00E-02 1.4E-05<br />
Selenium NA NA 5.00E-03 (1) 5.7E-03<br />
Silver NA NA 5.00E-03 (1) NA<br />
Thallium NA NA 6.60E-05 (1) NA<br />
Vanadium NA NA 1.00E-03 (2) NA<br />
Zinc NA NA 3.00E-01 (1) NA<br />
SVOCs<br />
Aroclor 1260 5.00E+00 2.00E+00 2.0E-05 (1) 2.00E-05 (2)<br />
Pesticides<br />
p,p'-DDE 3.40E-01 3.40E-01 5.00E-04 (1) 5.0E-04 (2)<br />
p,p'-DDT 3.40E-01 3.40E-01 5.00E-04 (1) 5.0E-04 (2)<br />
Pentachlorophenol 8.10E-02 1.80E-02 3.00E-02 (1) 3.0E-02 (2)<br />
alpha Chlordane 1.3 1.2 5.00E-04 (1) 2.0E-04 (2)<br />
gamma Chlordane 1.3 1.2 5.00E-04 (1) 2.0E-04 (2)<br />
Dieldrin 16 16 5.00E-05 (1) 5.0E-05 (2)<br />
Endrin aldehyde NA NA 3.00E-04 (1) 3.0E-04 (2)<br />
Toxaphene 1.2 1.2 NA NA<br />
VOCs<br />
t-Butanol NA NA 0.3 (1) 3.00E-01 (2)<br />
Ethyl benzene NA NA 0.1 (1) 5.71E-01<br />
Toluene NA NA 2.00E-01 (1) 8.57E-02<br />
Xylenes NA NA 2.00E-01 (1) 2.00E-01<br />
Notes:<br />
Except as noted, all criteria are from OEHHA Toxicity Criteria Database ( www.oehha.ca.gov/risk/ChemicalDB/start.asp)<br />
or the OEHHA Air - Chronic RELs (www.oehha.ca.gov/air/chronic_rels/AllChrels.html).<br />
1. Integrated Risk Information Service, (www.oehha.ca.gov/risk/ChemicalDB/start.asp)<br />
2. U.S. EPA Region 9 PRGs. (www.epa.gov/region09/waste/sfund/prg/index.htm)<br />
Values for "chlordane" used for both alpha and gamma chlordane<br />
Values for "endrin" used for endrin aldehyde<br />
Iso-butanol used as a surrogate for t-butanol<br />
SVOCs = Semivolatile organic chemicals<br />
VOCs = Volatile organic chemicals<br />
CSFo = Oral cancer slope potency factor<br />
CSFi = Inhalation cancer slope potency factor<br />
RfDo = Chronic oral reference dose<br />
RfDi = Chronic inhalation reference dose<br />
101248 – <strong>Appendix</strong> B – July 2008 Page 8
Human Health Risk Assessment<br />
Contaminant Management Plan, SVRT/BART Extension<br />
adverse non-cancer health effects from ingestion of chemicals. Chronic RfDs are specifically<br />
developed to be protective for long-term exposure to a chemical and are generally used to evaluate the<br />
potential non-cancer effects associated with exposure periods between seven years and a lifetime (U.S.<br />
EPA, 1989). The RfD is derived from a no-observed-adverse-effect-level (NOAEL) or a lowest-<br />
observed-adverse-effect-level (LOAEL). For the risk assessment, a NOAEL is the key datum obtained<br />
from a study of a dose-response relationship. It is the highest level tested at which no adverse effects<br />
were demonstrated. In some studies, only a LOAEL is available for use in defining the RfD.<br />
However, the use of a LOAEL requires the application of additional uncertainty factors (UFs) and<br />
modifying factors (MFs) to ensure that a health-protective toxicity value is used.<br />
UFs are typically 10-fold factors used to calculate RfDs from laboratory data and attempt to account for<br />
uncertainty in:<br />
• sensitivity among the members of the human population (i.e., interhuman or intraspecies<br />
variability);<br />
• extrapolating animal data to humans (i.e., interspecies variability);<br />
• extrapolating from data obtained in a study with less-than-lifetime exposure to lifetime exposure<br />
(i.e., extrapolating from subchronic to chronic exposure);<br />
• extrapolating from a LOAEL rather than from a NOAEL; and<br />
• extrapolating from animal data when the database is incomplete.<br />
MFs are included to reflect the scientific uncertainties not explicitly addressed using UFs, and range<br />
from 1 to 10. The default value for a MF is 1.<br />
Methods used to derive inhalation RfDs are conceptually similar to those used to derive oral RfDs.<br />
However, the actual analysis of inhalation exposures is more complex than that for oral exposures<br />
because of the dynamics of the respiratory system and ability to account for inhaled dose in the<br />
experimental design of laboratory studies. The reference values from inhalation studies are generally<br />
reported as a reference concentration (RfC) of the toxicant in air (milligrams per cubic meter [mg/m 3 ]).<br />
However, these values are converted to RfDs for use in risk assessments using a human body weight of<br />
70 kilograms (kg) and inhalation rate of 20 cubic meters per day (m 3 /day).<br />
3.1.2 Toxicity Values for Carcinogens<br />
U.S. EPA’s current approach in determining a chemical’s carcinogenic potential is a complex process<br />
that can be summarized as follows. Initially, the toxicity database for a substance is evaluated as to its<br />
101248 – <strong>Appendix</strong> B – July 2008 Page 9
Human Health Risk Assessment<br />
Contaminant Management Plan, SVRT/BART Extension<br />
potential utility in assessing carcinogenic potential. In this step, a weight-of-evidence (WOE)<br />
classification is assigned to the chemical. The WOE classification scheme is designed to present the<br />
likelihood that a chemical will cause cancer in humans based on the strength of supporting human<br />
and/or animal data. The WOE classifications defined by EPA (1996) are:<br />
• Known/likely<br />
• Cannot be determined<br />
• Not likely<br />
The “known/likely” classification is used when the available evidence demonstrates that there is<br />
carcinogenic potential in humans based on one of the following lines of evidence:<br />
• The agent is known to be carcinogenic in humans based on either epidemiologic evidence or a<br />
combination of epidemiologic and experimental evidence, demonstrating causality between<br />
human exposure and cancer.<br />
• The agent is treated as if it were a known human carcinogen, based on a combination of<br />
epidemiological data showing a plausible causal association (not demonstrating it definitively)<br />
and strong experimental evidence.<br />
• The agent is likely to be carcinogenic in humans based on evidence that suggests the mode of<br />
action of cancer formation for available data is relevant or assumed to be relevant to human<br />
carcinogenicity.<br />
The “cannot be determined” classification is applied when available carcinogenic data are conflicting or<br />
limited in quantity, and thus are not adequate to convincingly demonstrate carcinogenic potential for<br />
humans. The descriptor of “cannot be determined” is used with a subdescriptor that captures one of<br />
these rationales:<br />
• The carcinogenic potential of the agent cannot be determined, but there is suggestive evidence<br />
that raises concern for carcinogenic effects.<br />
• The available carcinogenic data is conflicting.<br />
• There are inadequate data to evaluate the carcinogenic potential of the agent.<br />
• There are no data available to evaluate the carcinogenic potential of the agent.<br />
The “not likely” classification is applied when the current evidence is sufficient to determine that the<br />
agent is not likely to be carcinogenic in humans.<br />
• The agent is not likely to be a carcinogen in humans because the agent did not produce results<br />
indicative of a carcinogen in two well conducted studies in two appropriate animal species.<br />
• The agent is not likely to be a carcinogen in humans because the carcinogenic effects seen in<br />
animal studies from exposure to the agent are not relevant to humans.<br />
101248 – <strong>Appendix</strong> B – July 2008 Page 10
Human Health Risk Assessment<br />
Contaminant Management Plan, SVRT/BART Extension<br />
• The agent is not likely to be a carcinogen in humans through a specific exposure route or dose<br />
range.<br />
• The agent is not likely to be a carcinogen in humans based on extensive human evidence<br />
demonstrating lack of carcinogenicity.<br />
The predominant theory behind cancer development as it relates to risk assessment is that a small<br />
number of molecular events can evoke changes in a single cell, which can lead to uncontrolled cellular<br />
proliferation and, eventually, to cancer. In this model (i.e., the linear low dose model), it is assumed<br />
that there is no level of exposure to a chemical that does not pose "a finite probability, however small,<br />
of generating a carcinogenic response" (U.S. EPA, 1989). Recent insight into cancer processes does,<br />
however, support the theory that a threshold mechanism may be operative, especially if the cancer is a<br />
"…secondary effect of toxicity or of an induced physiological change that is itself a threshold" (U.S.<br />
EPA, 1999a). However, because data have not been deemed sufficient by regulatory agencies to apply<br />
the "threshold" concept in the development of risk assessments, the linear low-dose model is still<br />
applied.<br />
Cancer toxicity values are expressed as oral cancer slope factors (CSFo) and, for inhalation studies,<br />
unit risk values. CSFs are defined as the proportion of a population affected per mg/kg-day dose and<br />
are typically reported in units of (mg/kg-day) -1 . The unit risk (expressed as [mg/m 3 ] -1 or [µg/m 3 ] -1 ) is<br />
used in inhalation cancer toxicity data and can be interpreted as the increase in the lifetime risk of an<br />
individual who is exposed for a lifetime to either 1 mg/m 3 or µg/m 3 of the cancer agent. Extrapolating<br />
from the inhalation to oral route of exposure, DTSC and U.S. EPA Region 9 convert unit risks to CSFo<br />
by multiplying by the inhalation rate of 20 m 3 /day and dividing by a body weight of 70 kg.<br />
3.2 AVAILABILITY OF TOXICITY VALUES<br />
Very often, toxicity values are not available either because a particular exposure route has not been<br />
evaluated or there are no relevant toxicity data upon which to base calculation of a value for any<br />
exposure route. In the first instance, route-to-route extrapolations are used in order to calculate a<br />
toxicity value. Toxicity values are generally available for the oral route of exposure and inhalation<br />
toxicity values have also been developed for some constituents. However, extrapolations from one<br />
exposure route to another (i.e., route-to-route extrapolations) are frequently used when there are no<br />
toxicity values available for a given route of exposure.<br />
In instances where no data are available and a route-to-route extrapolation is not appropriate, the<br />
evaluation of risk is not feasible.<br />
101248 – <strong>Appendix</strong> B – July 2008 Page 11
Human Health Risk Assessment<br />
Contaminant Management Plan, SVRT/BART Extension<br />
4.0 CALCULATION OF HUMAN HEALTH RISK-BASED REUSE<br />
CONCENTRATIONS<br />
The calculation of risk-based reuse concentrations essentially uses the procedures developed to estimate<br />
potential cancer and noncancer risks. In calculating risks, chemical-specific toxicity values are applied<br />
in conjunction with chemical concentrations of COPCs and intake assumptions to estimate the<br />
theoretical probability of developing cancer (i.e., carcinogenic risks) and noncarcinogenic health<br />
effects. Risk estimates for noncarcinogenic and carcinogenic chemicals are calculated separately to<br />
account for differences in toxic mechanisms. To estimate risk-based reuse levels, a target risk is used<br />
to back-calculate the concentration in soil corresponding to the selected target risk. DTSC has no<br />
specific guidance for establishing target levels, except to note that “…a risk estimation greater than 10 -6<br />
or a hazard index greater than 1 indicate the presence of contamination that may pose a significant<br />
threat to human health. …” (DTSC, 1999). In addition, California’s Safe Drinking Water and Toxic<br />
Enforcement Act of 1986 (Proposition 65) legislates an incremental lifetime cancer risk of 1 x 10 -5 or<br />
less for workplace exposures. Under CERCLA, a cancer risk of 1 x 10 -6 is considered “the point of<br />
departure for determining remediation goals for alternatives when ARARs are not available or are not<br />
sufficiently protective because of the presence of multiple contaminants at a site or multiple pathways of<br />
exposure” (CERCLA, 1980), although cancer risks within the range of 1 x 10 -4 to 1 x 10 -6 or less are<br />
considered acceptable lifetime incremental risks by the U.S. EPA (U.S. EPA, 1991). For<br />
noncarcinogenic effects, CERCLA does not specify a point of departure, but it generally is appropriate<br />
to assume an HI equal to 1 (U.S. EPA, 1991).<br />
The approach for setting up the equations used for the back-calculation mentioned above is described in<br />
U.S. EPA Region 9 Preliminary Remediation Goals (U.S. EPA, 2004), and by the San Francisco<br />
Regional Water Quality Control Board (RWQCB, 2005). In general, this approach was used for this<br />
evaluation. A detailed description of the calculations are presented in the following sections.<br />
4.1 NONCANCER RISK-BASED CONCENTRATIONS FOR CHEMICALS IN SOIL/FILL<br />
The calculational approach used for reuse scenarios 1 through 4 is presented below:<br />
101248 – <strong>Appendix</strong> B – July 2008 Page 12
where:<br />
Human Health Risk Assessment<br />
Contaminant Management Plan, SVRT/BART Extension<br />
THQ x BW x AT<br />
Cs =<br />
⎡⎛<br />
IRs ⎞ ⎛ SA x AF x ABS⎞<br />
⎛ IRi ⎞ ⎛ IRi ⎞⎤<br />
EF x ED x ⎢⎜<br />
⎟ + ⎜<br />
⎟ + ⎜<br />
⎟ + ⎜ ⎟⎥<br />
⎣⎝<br />
RfDo x CF ⎠ ⎝ RfDo x CF ⎠ ⎝ RfDi x PEF ⎠ ⎝ RfDi x VF ⎠⎦<br />
Equation 4-1<br />
Cs = scenario-specific reuse concentration (mg/kg)<br />
THQ = target hazard quotient (unitless)<br />
BW = body weight (kg)<br />
AT = averaging time (365 days/year x ED, days)<br />
EF = exposure frequency (days per year)<br />
ED = exposure duration (years)<br />
IR = intake rate; soil ingestion rate (IRs, mg/day), inhalation rate (IRi,m 3 /day)<br />
RfD = reference dose; oral reference dose (RfDo), inhalation reference dose (RfDi) (mg/kg-day)<br />
CF = conversion factor (1E+06 mg/kg)<br />
SA = skin surface area (cm 2 /day)<br />
AF = soil-skin adherence factor (mg/cm 2 )<br />
ABS = dermal absorption factor (unitless)<br />
PEF = particulate emission factor (m 3 /kg)<br />
VF = volatilization factor (m 3 /kg)<br />
Note that equation 4-1 is a general equation, in that it includes the approach for both volatile and<br />
nonvolatile chemicals, which are dealt with separately. To determine which chemicals are considered<br />
volatile for the purposes of this evaluation, U.S. EPA decision rules were used. The U.S. EPA criteria<br />
are a Henry’s Law constant greater than 1E-05 atmospheres-cubic meters per mole (atm-m 3 /mole) and a<br />
molecular weight less than 200 grams per mole (g/mole).<br />
It should also be noted that, consistent with the procedure recommended for calculating preliminary<br />
remediation goals, concentrations calculated for the residential scenario (Reuse Scenario 1) were<br />
performed using the exposure parameters for children (ages 0 – 6 years). The lower bodyweights of<br />
children make this a health-protective approach.<br />
A slightly different approach was used for Scenario 5. Since this scenario involves a dust source<br />
(disturbances created from a passing train) that cannot be simulated using a PEF, an alternative<br />
approach had to be used. The dust generated from a passing train was estimated for a similar<br />
assessment (ERM, 2002). The concentration of dust generated by a passing train was estimated to be<br />
0.005 milligrams per cubic meter. Using this dust concentration, the following equation is used to<br />
estimate the reuse concentration from the inhalation pathway:<br />
101248 – <strong>Appendix</strong> B – July 2008 Page 13
Where:<br />
Human Health Risk Assessment<br />
Contaminant Management Plan, SVRT/BART Extension<br />
THQ x BW x AT x RfDi x CF<br />
Cs = Equation 4-2<br />
EF x ED x IRi x PC<br />
Cs = scenario-specific reuse concentration (mg/kg)<br />
THQ = target hazard quotient (unitless)<br />
BW = body weight (kg)<br />
AT = averaging time (365 days/year x ED, days)<br />
RfD = inhalation reference dose (mg/kg-day)<br />
CF = conversion factor (1E+06 mg/kg)<br />
EF = exposure frequency (days per year)<br />
ED = exposure duration (years)<br />
IRi = inhalation rate (m 3 /day)<br />
PC = daily concentration of dust generated by passing trains (mg/m 3 )<br />
4.2 CANCER RISK-BASED CONCENTRATIONS FOR CHEMICALS IN SOIL/FILL<br />
The calculational approach used for Reuse Scenarios 1 through 4 are similar, but differ because Reuse<br />
Scenario 1 involves a residential scenario for which age-adjusted parameters are used for the cancer<br />
calculations to represent both children and adult exposures. Such adjusted parameters are not used for<br />
the industrial/construction scenarios (Reuse Scenarios 2 and 3) because only adults are considered. The<br />
approach used for Reuse Scenario 1 to calculate reuse levels for potential carcinogens is presented in<br />
Equation 4-3.<br />
TR x ATc<br />
Cs =<br />
⎡⎛<br />
CSFo x IRs, ⎞<br />
⎛<br />
⎞ ⎛<br />
⎞⎤<br />
⎢⎜<br />
adj ⎟ ⎛ CSFo x SFS x ABS ⎞<br />
CSFi x IRa,<br />
+ ⎜<br />
⎟ + ⎜<br />
adj CSFi x IRa,<br />
⎟ + ⎜<br />
adj<br />
EF x<br />
⎟⎥<br />
⎢⎜<br />
CF ⎟<br />
⎜<br />
⎟ ⎜<br />
⎟⎥<br />
⎣⎝<br />
⎠ ⎝ CF ⎠ PEF<br />
VF<br />
⎝<br />
⎠ ⎝<br />
⎠⎦<br />
Where:<br />
Cs = scenario-specific reuse concentration (mg/kg)<br />
TR = target cancer risk (unitless)<br />
ATc = averaging time – carcinogens (days)<br />
EF = exposure frequency (days per year)<br />
CSF = cancer slope factor – CSFo oral, CSFi inhalation (<br />
1<br />
mg/kg - day<br />
Equation 4-3<br />
IRadj = age-adjusted intake rate – IRs,adj soil ingestion rate, adjusted (mg yr/kg day), IRa,adj<br />
inhalation rate, adjusted (m 3 yr/kg day)<br />
CF = conversion factor (1E+06 mg/kg)<br />
SFS = dermal factor (mg yr/kg day)<br />
101248 – <strong>Appendix</strong> B – July 2008 Page 14<br />
)
ABS = dermal absorption factor (unitless)<br />
PEF = particulate emission factor (m 3 /kg)<br />
VF = volatilization factor (m 3 /kg)<br />
Human Health Risk Assessment<br />
Contaminant Management Plan, SVRT/BART Extension<br />
The approach used for to calculate reuse levels for the nonresidential exposures (Reuse Scenarios 2, 3<br />
and 4) is presented in Equation 4-4.<br />
TR x BW x ATc<br />
Cs =<br />
Equation 4-4<br />
⎡⎛<br />
CSFo x IRs ⎞ ⎛ CSFo x SA x AF x ABS ⎞ ⎛ CSFi x IRa ⎞ ⎛ CSFi x IRa ⎞⎤<br />
EF x ED x ⎢⎜<br />
⎟ + ⎜<br />
⎟ + ⎜ ⎟ + ⎜ ⎟⎥<br />
⎣⎝<br />
CF ⎠ ⎝ CF ⎠ ⎝ PEF ⎠ ⎝ VF ⎠⎦<br />
Where:<br />
Cs = scenario-specific reuse concentration (mg/kg)<br />
BW =body weight (kg)<br />
TR = target cancer risk (unitless)<br />
ATc = averaging time – carcinogens (days)<br />
EF = exposure frequency (days per year)<br />
ED = exposure duration (years)<br />
1<br />
CSF = cancer slope factor – CSFo oral, CSFi inhalation (<br />
)<br />
mg/kg - day<br />
IR = intake rate – IRs soil ingestion rate (mg/day), IRa inhalation rate (m 3 /day)<br />
CF = conversion factor (1E+06 mg/kg)<br />
SA = skin surface area (cm 2 /day)<br />
AF = soil adherence factor (mg/cm 2 )<br />
ABS = dermal absorption factor (unitless)<br />
PEF = particulate emission factor (m 3 /kg)<br />
VF = volatilization factor (m 3 /kg)<br />
As described above for the noncarcinogenic reuse calculations, a slightly different approach was used<br />
for Scenario 5. Since this scenario involves a dust source that cannot be simulated using a PEF, a<br />
scenario-specific dust concentration and the following equation are used to estimate the reuse<br />
concentration from the inhalation pathway.<br />
Where:<br />
TR x ATc x CF<br />
Cs =<br />
Equation 4-5<br />
⎡⎛<br />
IRa x EDa ⎞ ⎛ IRc x EDc ⎞⎤<br />
CSFi x PC x EF x ⎢⎜<br />
⎟ + ⎜ ⎟⎥<br />
⎣⎝<br />
BWa ⎠ ⎝ BWc ⎠⎦<br />
Cs = scenario-specific reuse concentration (mg/kg)<br />
TR = target cancer risk (unitless)<br />
101248 – <strong>Appendix</strong> B – July 2008 Page 15
ATc = averaging time – carcinogens (days)<br />
CF = conversion factor (1E+06 mg/kg)<br />
1<br />
CSF = inhalation cancer slope factor (<br />
)<br />
mg/kg - day<br />
PC = daily concentration of dust generated by passing trains (mg/m 3 )<br />
EF = exposure frequency (days per year)<br />
IR = inhalation rate - IRa adult, IRc child (m 3 /day)<br />
ED = exposure duration – EDa adult, EDc a child (years)<br />
BW = body weight – BWa adult, BWc child (kg)<br />
Human Health Risk Assessment<br />
Contaminant Management Plan, SVRT/BART Extension<br />
It should be noted that some chemicals exhibit both carcinogenic and noncarcinogenic health effects.<br />
For this reason, both carcinogenic and noncarcinogenic risk-based concentrations will be calculated for<br />
these chemicals, and the lowest value will be presented as the final risk-based concentration. However,<br />
an exception to this generality is the case of the construction worker. To recognize the fact that these<br />
exposures are likely to occur over relatively short periods of time (i.e., less than one year) compared to<br />
those for the residential and industrial scenarios (more than a year), DTSC recommended that the reuse<br />
levels correspond to the noncarcinogenic effects rather than the carcinogenic effects for those chemicals<br />
that exhibit both carcinogenic and noncarcinogenic effects (DTSC memorandum from Kimiko Klein to<br />
Lynn Nakashima, October 1, 2004). An example of such a chemical is arsenic.<br />
4.3 CONCENTRATIONS FOR LEAD IN SOIL/FILL<br />
Although lead is classified as a probable human carcinogen by the U.S. EPA, there are no published<br />
slope factors for unspecified lead compounds. The State of California has developed an oral slope<br />
factor for lead acetate but not for the type of lead compounds that are likely to be present at the site.<br />
Thus, exposure and risks associated with contact with lead in the environment are based on estimating<br />
blood lead level. In a memorandum from Kimiko Klein to Lynn Nakashima, October 1, 2004, DTSC<br />
recommended that the Cal/EPA blood lead model LeadSpread 7 by used for the residential exposure<br />
scenarios, and the U.S. EPA Adult Lead Model (U.S. EPA, 2003) be used for the industrial and other<br />
worker exposure scenarios. Both models use a blood lead level of 10 micrograms lead per deciliter<br />
blood as a target. It should be noted that the approach used by LeadSpread 7 differs from that used to<br />
estimate reuse levels described above because LeadSpread 7 includes lead from sources other than soil<br />
in its calculations, including levels of lead in drinking water, household dust and food. By<br />
101248 – <strong>Appendix</strong> B – July 2008 Page 16
Human Health Risk Assessment<br />
Contaminant Management Plan, SVRT/BART Extension<br />
incorporating these inputs, LeadSpread 7 offers lead reuse concentrations with an additional level of<br />
health protection. It is also noted that the U.S. EPA Adult Lead Model was developed, in part, to<br />
estimate levels of lead in soil and dust that would not constitute an unreasonable risk to the fetus of<br />
pregnant mothers. Although few workers on the project site are expected to be pregnant women, the<br />
use of this model is therefore expected to provide an additional level of health protection. In fact, the<br />
choice of this conservative blood lead model is appropriate because it is known that the body burden for<br />
lead can persist for several years following incidental occupational exposure to lead in soil. Thus, the<br />
worker does not have to be pregnant at the time of exposure for a fetus to be at risk. For the purpose<br />
of this assessment, the values for the geometric standard deviation (2.1) and the baseline blood lead<br />
level (1.96 µg/dl) of a heterogeneous workforce (including white, black and Mexican workers) were<br />
used.<br />
Some of the standard default values used in LeadSpread 7 were revised to make the model more site-<br />
specific. For example, the values for background concentrations of lead in ambient air, lead in soil and<br />
in drinking water were adjusted to reflect the project area. Data collected by the California Air<br />
Resources Board for lead in respirable airborne dust indicate that lead levels in air from Alameda and<br />
Santa Clara Counties have steadily decreased from 1989 (www.arb.ca.gov/adam/toxics/sitepages). To<br />
reflect current air quality, average lead concentrations for Fremont and San Jose from 1998 to 2002<br />
(the most recent data available) were averaged to yield 0.0117 micrograms lead per cubic meter. To<br />
represent drinking water quality for Alameda and Santa Clara counties, the most recent reports from<br />
Santa Clara Valley Water District (www.sjmuniwater.com) Alameda County Water District<br />
(www.acwd.org) were used. The results show that the concentration in lead in drinking water in San<br />
Jose was less than 2 micrograms per liter (µg/l), while that for Alameda County was 7.4 µg/l. An<br />
average value of 4.7 µg/l was used to conservatively estimate lead levels in drinking water. Little<br />
information is available to represent average lead levels in soil. An average concentration of 23.9<br />
mg/kg is reported for California (Bradford, et al, 1996). However, this result does not include any<br />
samples collected from the San Francisco Bay area. A more representative value (11.4 mg/kg) for this<br />
project was presented by Scott (1995) from 158 samples collected in Santa Clara County. Values for<br />
the remaining exposure parameters used in the blood lead models are discussed in Section 4.4 below.<br />
101248 – <strong>Appendix</strong> B – July 2008 Page 17
4.4 EXPOSURE PARAMETERS<br />
Human Health Risk Assessment<br />
Contaminant Management Plan, SVRT/BART Extension<br />
The values for the exposure parameters used in this assessment are selected to be site-specific where<br />
possible. Where site-specific values are not available, health-protective, default values are used. The<br />
values for the parameters are listed in Table B-2. In general, most of the values listed in Table B-2 are<br />
the standard values recommended for the specific exposure scenarios by State and Federal risk<br />
assessment guidance. Derivation of the site-specific values are discussed below.<br />
101248 – <strong>Appendix</strong> B – July 2008 Page 18
Table B-2 - Exposure Parameters<br />
Human Health Risk Assessment<br />
Contaminant Management Plan, SVRT/BART Extension<br />
Exposure Scenario: Residential Industrial Industrial Construction Residential<br />
Resuse Scenario: (Unrestricted (Both Unrestricted On-Site and (Right of Way) (Encapsulation) (Multiple Resuse<br />
Exposure Parameter Off-Site) Stations and Facilities) Scenarios)<br />
concentration in soil (mg/kg) calculated calculated calculated calculated calculated<br />
target risk 1.00E-06 a 1.00E-05 a 1.00E-05 a 1.00E-05 a 1.00E-06 a<br />
target hazard quotient 1.00E+00 a 1.00E+00 a 1.00E+00 a 1.00E+00 a 1.00E+00 a<br />
body weight, adult (kg) 70 b 70 b 70 b 70 b 70 b<br />
body weight, child (kg) 15 b NA NA NA 15 b<br />
cancer slope factor - oral, inhalation (1/mg/kg-d) chem specific chem specific chem specific chem specific chem specific<br />
noncancer reference dose, oral, inhalation (mg/kg -d) chem specific chem specific chem specific chem specific chem specific<br />
averaging time for carcinogens - (d) 25550 b 25550 b 25550 b 25550 b 25550 b<br />
averaging time for noncarcinogens - (d) 365 x ED b 365 x ED b 365 x ED b 365 x ED b 365 x EDa,c b<br />
exposure frequency - (d/y) 350 b 250 c 100 d 20 / 140 f 350 b<br />
exposure duration (for adult scenarios) - (y) 30 b 25 c 25 c 7 / 1 f NA<br />
exposure duration, (for adult, child scenarios) - (y) 24 / 6 b NA NA NA 24 / 6 b<br />
soil ingestion rate, adjusted (mg yr / kg d) 114 g NA NA NA NA<br />
soil ingestion rate, adult, child (mg/d) 100 / 200 b 75 / NA c 75 / NA c 330 / NA e NA<br />
conversion factor (mg/kg) 1.00E+06 1.00E+06 1.00E+06 1.00E+06 1.00E+06<br />
dermal soil factor, (mg yr / kg d) 361 g NA NA NA NA<br />
skin surface area, adult/child (cm 2 /d) 5700/2800 b 3300/NA c 3300/NA c 3300/NA c NA<br />
Soil/skin adherence factor (mg/cm 2 ) 0.07 c 0.2 c 0.2 c 0.2115 h NA<br />
dermal absorption factor (unitless) chem specific chem specific chem specific chem specific NA<br />
inhalation rate, adult/child (m 3 /d) 20 / 8.3 d, h 20 /NA c 20 /NA c 20 /NA c 15.2 / 8.3 d, h<br />
inhalation rate, adjusted (m 3 yr/kg d) 11 (adjusted) g NA NA NA NA<br />
particulate emission factor (m 3 /kg) 9.30E+09 c 9.30E+09 c 9.30E+09 c 6.75E+07 e NA<br />
volatilization factor (m 3 /kg) chem specific chem specific chem specific chem specific NA<br />
particulate concentration (mg/m 3 ) NA NA NA NA 0.005 d<br />
Notes:<br />
a For noncancer: PEA (DTSC 1999). For cancer: 1E-06 used for residential-based scenarios (PEA, DTSC, 1999), and 1E-05 used for industrial/construction based-scenarios<br />
b Preliminary Endangerment Assessment Guidance Manual (DTSC, 1999), and Supplemental Guidance for Human Health Multimedia Risk Assessments of <strong>Hazardous</strong> Waste Sites<br />
c RAGS, Supplemental Guidance Standard Default Exposure Factors (USEPA, 1991), and Screening for Environmental Concerns at Sites with Contaminated Soil and Groundwater<br />
d CTX report text.<br />
e Supplemental Guidance for Developing Soil Screening Levels for Superfund Sites (USEPA, 2001)<br />
f values are for cancer / noncancer calculations (Screening for Environmental Concerns at Sites with Contaminated Soil and Groundwater, SFRWQCB, 2003)<br />
g Region 9 PRGs (USEPA, 2002)<br />
h Exposure Factors Handbook, Volume 1 (USEPA, 1997)<br />
i Screening for Environmental Concerns at Sites with Contaminated Soil and Groundwater, Vol.2 (SFRWQCB, 2003)<br />
101248 – <strong>Appendix</strong> B – July 2008 Page 19
Human Health Risk Assessment<br />
Contaminant Management Plan, SVRT/BART Extension<br />
No State guidance is available for the frequency that a worker spends in checking conditions along a<br />
railroad right-of-way (exposure frequency, Table B-2). A value of 90 days per year was used for a<br />
similar project using input from the railroad industry (ERM, 2002). However, the report quoted a<br />
value of 100 days per year in the text, and this is the value that the DTSC (October 1, 2004<br />
memorandum) has recommended we use for this assessment.<br />
Similarly, no State guidance is available for the exposure frequency or the soil ingestion rate of a<br />
construction worker involved in soil excavation activities. The value used for this assessment (330<br />
milligrams per day [mg/day]) is recommended specifically for such activity by the U.S. EPA (2001).<br />
The incidental soil ingestion rate for adults not engaged in construction activities (i.e., 75 milligrams<br />
per day) was recommended by the DTSC (telephone conference August 13, 2004) as intermediate<br />
between 50 and 100 milligrams per day.<br />
Age-specific values for inhalation rates were used for this assessment to match the age-specific age<br />
ranges defined for the adults and children, and for consistency with the ERM, 2002. Accordingly, the<br />
recommended inhalation rates for children aged 3 to 5 years (8.3 m 3 /day) were used for children, and<br />
the recommended inhalation rates for adults aged 19 to 65 years (15.2 m 3 /day) were used for adults<br />
(U.S.EPA, 1997).<br />
Default particulate emission factors (PEFs) and volatilization factors (VFs) and their calculation<br />
methods are presented by U.S. EPA (2002) and the San Francisco RWQCB (2005). The values for<br />
PEF and VF used for this assessment were made using the recommended calculation methods and more<br />
site-specific values for some of the components of these parameters. A Q/C term is used for evaluating<br />
atmospheric dispersion in the calculation for both the PEF and the VF. The Q/C term for a 1-acre<br />
source in the climatic zone for the San Francisco Bay area (78.51 grams/m 2 per kg/m 3 ) was used in<br />
place of the default value for a half-acre site in the climatic zone for Minneapolis (U.S. EPA, 1996b).<br />
Site-specific wind and soil conditions are also involved in the calculation of PEF. For the purpose of<br />
this assessment, the average annual wind velocity for San Jose over the 10 years from 1992 to 2002<br />
(2.9 meters per second, San Jose Air Airport www.calclim.dri.edu/ccda/comparative/avgwind.html)<br />
and soil texture information representative of anticipated site conditions (i.e., bare soil of a texture<br />
similar to a plowed field, Cowherd et al, 1985) were used to make the PEF term more site-specific.<br />
101248 – <strong>Appendix</strong> B – July 2008 Page 20
Human Health Risk Assessment<br />
Contaminant Management Plan, SVRT/BART Extension<br />
It should be noted that the value for PEF used for the construction scenario (6.75E+07 m 3 /kg) was<br />
calculated according to <strong>Appendix</strong> 2, Table 4 in the San Francisco RWQCB (2005) guidance, and<br />
described in the equation below.<br />
Where:<br />
Q/C<br />
PEF = Equation 4-6<br />
Jw<br />
PEF = particulate emission factor (m 3 /kg)<br />
Q/C = inverse of the mean concentration at the center of a 1-acre site in San Francisco<br />
(78.51 g/m 2 -second per kg/m 3 )<br />
Jw = PM10 emission flux (g/m 2 –second)<br />
The recommended value for the construction dust emission flux (1.2 tons/month-acre or 1.16E-06 g/m 2 -<br />
second) was used along with the site-specific Q/C discussed above to estimate the value for PEF used to<br />
represent the construction scenario.<br />
In the case of VF, the default value for the exposure duration term used in the VF calculation (30 years<br />
or 9.5E+08 seconds) was used for the assessment of the residential scenarios, and the corresponding<br />
values for the exposure duration (converted to seconds) for each of the other scenarios were used in<br />
place of the default for Scenarios 2 (25 years), 3 (25 years) , and 4 (seven years and one year for the<br />
carcinogenic and noncarcinogenic calculations, respectively).<br />
To estimate the risk-based level of soil lead for the off-site residential scenario, it is assumed that<br />
residents are exposed to background levels of lead in soil and groundwater, and the model was than<br />
used to estimate the concentration of lead in air corresponding to a blood lead level of 10 µg/l. The<br />
modeled air concentration was then used to calculate the corresponding soil concentration as follows:<br />
Where:<br />
C<br />
part<br />
Cs = x CF1 x CF2<br />
Equation 4-7<br />
C<br />
dust<br />
Cs = scenario-specific reuse concentration (mg/kg)<br />
Cpart = concentration of lead in air particulates (µg/m 3 )<br />
101248 – <strong>Appendix</strong> B – July 2008 Page 21
Cdust = concentration of particulates in air (mg/m 3 )<br />
CF1 = conversion factor (1E+06 mg/kg)<br />
CF2 = conversion factor (1E-03 mg/µg)<br />
Human Health Risk Assessment<br />
Contaminant Management Plan, SVRT/BART Extension<br />
Note that the term Cdust is equivalent to the term PC used in equations 4-2 and 4-5, above.<br />
It should also be noted that the approach represented by Equation 4-7 is expected to under-estimate the<br />
concentration of lead in soil corresponding to an acceptable risk (and is thus health-protective) because<br />
it assumes that all the lead in soil is associated with respirable sized particles, and the approach does not<br />
account for the decreases in dust levels resulting from dispersion, and thus assumes the receptors are<br />
located right at the source rather than off site.<br />
4.5 ARSENIC BIOAVAILABILITY<br />
An unknown but significant amount of the roadbed material at this site is believed to recycled slag from<br />
smelters. This has important consequences for this project because such slag is known to contain<br />
elevated concentrations of various metals, such as arsenic. However, it is also widely known that<br />
arsenic, while in the slag matrix, is relatively stable. In particular, even under the low acid conditions<br />
of the stomach, arsenic is known to be only sparingly leached from the slag matrix. Therefore, arsenic<br />
in slag has a very low bioavailability. Typically, when in vivo studies are performed to determine the<br />
toxicity of arsenic, arsenic is administered to the subjects as solutions of sodium arsenate. However,<br />
the low bioavailability of arsenic in slag means that it is likely to be absorbed into the subject at a<br />
greatly reduced rate compared to the arsenic in solution. This reduced absorption (referred to as<br />
relative bioavailability or just bioavailability) depends on the specific source of the slag, but has been<br />
measured in a review performed by EPA Region 8 using various mammalian species and various<br />
sources of smelter slag to range from seven to 51 percent of a sodium arsenate solution (U.S. EPA,<br />
1997). This review included both mine tailings and smelter slag, and found the values for smelter slag<br />
values were 7%, 10%, 15%, 18%, and 51%. Although the 51% appears to be an outlier, the average<br />
is 20%, and is 12.5% excluding the outlier. For the purpose of this assessment a value of 20% is used.<br />
This value is considered conservative because the information in the literature suggests that a more<br />
representative value for slag is probably closer to 12%.<br />
101248 – <strong>Appendix</strong> B – July 2008 Page 22
5.0 RESULTS<br />
Human Health Risk Assessment<br />
Contaminant Management Plan, SVRT/BART Extension<br />
Risk-based soil reuse concentrations were calculated for the COPCs identified at the project site. Site-<br />
specific concentrations were calculated for each of the reuse scenarios discussed in Section 2.3 of this<br />
report. The risk-based calculations are presented in Attachment B-1. As discussed previously, reuse<br />
concentrations were calculated for both cancer and noncancer health impacts. Except for the excavation<br />
reuse scenario, if one chemical has both cancer and noncancer endpoints, the lowest of the two was<br />
used as the risk-based reuse concentration. At the recommendation of the DTSC, the noncancer reuse<br />
levels are used for the excavation reuse scenario because construction activities are expected to result in<br />
only short-term exposures The resulting risk-based reuse concentrations for the chemicals detected at<br />
the site are summarized in Table B-3. The risk-based calculations used to obtain the results presented<br />
for lead in Table B-3 are provided in Attachment B-1 of this appendix, and are summarized in<br />
Table B-4.<br />
101248 – <strong>Appendix</strong> B – July 2008 Page 23
Human Health Risk Assessment<br />
Contaminant Management Plan, SVRT/BART Extension<br />
Reuse Exposure Scenarios<br />
Scenario 1 Scenario 2 Scenario 3 Scenario 4 Multiuse Scenario<br />
Chemical<br />
Metals<br />
Residential Industrial Right-of-Way Construction Residential<br />
Arsenic 0.21 8.7 21.8 830 181<br />
Barium 5,475 95,385 100,000 38,712 52,771<br />
Beryllium 156.4 2,725 6,813 1,106 204<br />
Cadmium 39.1 681 1,703 277 114<br />
Chromium 1,469 31,682 79,205 100,000 NA<br />
Cobalt 1,564 27,253 68,128 11,061 2,149<br />
Copper 3,129 54,506 100,000 22,121 NA<br />
Lead 213 646 1,615 262 100,000<br />
Mercury 23.5 409 1,022 166 9,687<br />
Molybdenum 391.1 6,813 17,033 2,765 NA<br />
Nickel 3,911 68,132 170,326 27,652 1,881<br />
Selenium 391.1 6,813 17,033 2,765 100,000<br />
Silver 391.1 6,813 17,033 2,765 NA<br />
Thallium 5.2 90 225 37 NA<br />
Vanadium 78.2 1,363 3,407 553 NA<br />
Zinc 23,464 100,000 100,000 100,000 100,000<br />
SVOCs<br />
Aroclor 1260 0.09 3.4 8.5 16 856<br />
Pesticides<br />
p,p'-DDE 1.63 77.9 194.8 277 5,033<br />
p,p'-DDT 1.63 77.9 194.8 277 5,033<br />
Pentachlorophenol 4.41 147.2 368.0 3125.9 95,073<br />
alpha Chlordane 0.44 21.7 54.3 274.3 1,426<br />
gamma Chlordane 0.44 21.7 54.3 274.3 1,426<br />
Dieldrin 0.03 1.7 4.1 21.9 107<br />
Endrin aldehyde 23.5 409 1,022 166 100,000<br />
Toxaphene 0.46 22.1 55.2 291.5 1,426<br />
VOCs<br />
t-Butanol 22,516 50,164 100,000 25,093 NA<br />
Ethyl benzene 4,452 9,601 24,003 3,693 NA<br />
Toluene 555 1,143 2,856 588 NA<br />
Xylenes 1,939 4,018 10,044 2,067 NA<br />
Notes:<br />
Table B-3 - Summary of Site-Specific Reuse Values<br />
NA = Not applicable<br />
If calculated value exceeds 100,000 mg/kg, the value presented defaults to 100,000 mg/kg consistent with the ceiling limit<br />
of 100,000mg/kg used by the USEPA Region 9 PRGs.<br />
101248 – <strong>Appendix</strong> B – July 2008 Page 24
Table B-4 - Summary of Lead Reuse Values<br />
Reuse<br />
Exposure<br />
Scenario Description Receptor<br />
Human Health Risk Assessment<br />
Contaminant Management Plan, SVRT/BART Extension<br />
Soil Lead<br />
Concentration 1<br />
(mg/kg)<br />
1 On/Off-site adult 903<br />
Residential child 213<br />
2 On-site adult 646<br />
industrial<br />
3 Right-of-way adult 1,615<br />
4 Construction adult 262<br />
multiuse Off-site residential adult 344,000<br />
exposed to on-site child 368,000<br />
soil via wind-blown<br />
dust<br />
Notes:<br />
1 Values for scenario 1 and the multipurpose land use were derived using LeadSpread7<br />
Values for the scenarios 2, 3, and 4 were derived using the Adult Lead Model, see text.<br />
A heterogeneous worker population was assumed with a geometric standard deviation of 2.0<br />
and a baseline blood concentrtion of 1.96 µ g/dl.<br />
Multiuse scenario calculations:<br />
adult: (1.72 ug/m 3 / 0.005 mg/m 3 ) x 10 6 mg/kg x 10 -3 mg/ug = 344,000 mg/kg, see text<br />
child: (1.83 ug/m 3 / 0.005 mg/m 3 ) x 10 6 mg/kg x 10 -3 mg/ug = 368,000 mg/kg, see text<br />
mg/kg = milligrams per kilogram<br />
101248 – <strong>Appendix</strong> B – July 2008 Page 25
6.0 UNCERTAINTY<br />
Human Health Risk Assessment<br />
Contaminant Management Plan, SVRT/BART Extension<br />
Understanding the major uncertainties assists with the interpretation of the risk characterization results.<br />
In general, the HHRA process operates in a "cascade" fashion, whereby each phase relies on<br />
information generated in the previous phase. If uncertainty is introduced at any stage in the process,<br />
this uncertainty is carried along through each of the subsequent risk assessment phases. When<br />
successive uncertainties introduce health-protective biases, the final risk-based concentrations will<br />
incorporate a significant safety factor, and be very protective of human health. Examples of<br />
uncertainties involved in each major step of the risk assessment process (i.e., exposure assessment,<br />
toxicity assessment, and risk characterization) are discussed separately below.<br />
6.1 UNCERTAINTIES IN EXPOSURE ASSESSMENT<br />
The identification of receptor groups for each reuse scenario is thought to represent a health-protective<br />
selection of future land uses. For example, unrestricted use is represented by the residential scenario,<br />
which is expected to be far more health protective than the selection of an industrial land use scenario,<br />
for which such soil could also be used.<br />
Similarly, the use of the industrial scenario to represent restricted off-site use or for the construction of<br />
stations or the maintenance facility is also expected to be protective of human health because it is likely<br />
that the workers and commuters will not be exposed to site soil at the levels assumed for this scenario.<br />
Commuters are not likely to contact soil at all because the stations are expected to be paved and<br />
landscaped. While offsite use is difficult to anticipate, workers at the maintenance facility are likely to<br />
spend more time indoors rather than the assumption used for this assessment that they spend their entire<br />
day in contact with site soil. Thus, while considerable uncertainty is associated with the exposure<br />
scenarios used to represent the various reuse scenarios, the uncertainties are biased toward health<br />
protection.<br />
Most of the values used for the exposure parameters listed in Table B-2 and those used for the lead<br />
evaluation are the default values recommended by State and Federal risk guidance to represent<br />
reasonable maximum exposure conditions. As such, they inherently introduce uncertainty biased<br />
toward an over-estimation of risk. The factors that incorporate some degree of site-specificity (e.g.,<br />
101248 – <strong>Appendix</strong> B – July 2008 Page 26
Human Health Risk Assessment<br />
Contaminant Management Plan, SVRT/BART Extension<br />
PEF, VF, ingestion rate for the construction scenario) tend to reduce the bias to a more neutral level<br />
(i.e., neither over-nor underestimating). Taken together, these factors serve to produce risk-based<br />
criteria that significantly underestimate the concentration corresponding to the risk-based reuse levels<br />
calculated for each scenario.<br />
A significant amount of uncertainty is associated with the fact that metals in soil tend to be less<br />
available following ingestion than is expressed by the toxicity criteria used to estimate their toxic<br />
effects. This particularly true for arsenic. This uncertainty comes from a variety of sources, the most<br />
important of which concerns the source of arsenic in site soil. A certain level of arsenic is likely to be<br />
naturally occurring in these soils. Naturally occurring background arsenic soil levels for California<br />
have been documented to range from 0.6 to 11.0 mg/kg (Bradford, 1996). In the southern portion of<br />
the San Francisco Bay, where the subject site is located, levels have been documented to range from<br />
less the 0.5 to 20 mg/kg (Scott, 1995). This is important because numerous studies have conducted in<br />
vivo bioavailability tests which show that generally less than 50 percent of the arsenic detected in soil is<br />
released within the human gastrointestinal tract and considered to be biologically available (Ruby,<br />
1999). However, the situation at this site is further complicated by the fact that some of the arsenic<br />
comes from the historical use of smelter slag as road base material. As discussed in Section 4.5, the<br />
bioavailability of arsenic and lead in slag is even less than in soil. To account for this, a value of 20<br />
percent was used for bioavailability in the calculations of risk-based reuse levels. Although the<br />
bioavailability of arsenic in slag from a variety of sources ranges from about 7 to 51 percent, the use of<br />
20 percent for this assessment is considered health protective because the bulk of the measured values<br />
are less than 20 percent. However, this factor represents a source of uncertainty for these calculations.<br />
6.2 UNCERTAINTIES IN TOXICITY ASSESSMENT<br />
Toxicity assessment involves the selection of noncancer toxicity indices (i.e., RfDs) and CSFs. RfDs<br />
are developed using animal data that must be extrapolated to human receptors in the HHRA process.<br />
This animal-to-human extrapolation process typically involves application of several uncertainty factors<br />
(UFs) and modifying factors applied to animal test data that drive calculated RfD to very conservative<br />
values. For instance, a UF of 10 is routinely applied to animal data to reduce a threshold dose ten-fold<br />
to arrive at the RfD. This UF is based on the assumption that humans are inherently 10-times more<br />
101248 – <strong>Appendix</strong> B – July 2008 Page 27
Human Health Risk Assessment<br />
Contaminant Management Plan, SVRT/BART Extension<br />
sensitive than the laboratory animal to the substance. This application of the UFs is likely to<br />
overestimate noncarcinogenic toxicity, as noted by Dourson et. al. (1992).<br />
Slope factors developed by the U.S. EPA are conservative, and represent the upper bound limit (i.e.,<br />
upper 95 percent UCL) probability of a cancer response occurring. Thus, the actual carcinogenic risk<br />
due to exposure to selected chemicals is likely to be lower than the calculated risk. One other source of<br />
uncertainty in the toxicity assessment lies in extrapolating experimental carcinogenic observations at<br />
high doses to the low doses experienced by the human population of interest. Because there is no<br />
empirical way to detect risks below the 5 to 10 percent range, the shape of the dose-response curve in<br />
the low dose region (Rodricks 1992) can only be hypothesized. Because the standard default approach<br />
is to assume that all carcinogens have a linear, no-threshold dose-response curve, the cancer potency<br />
for carcinogenic COPCs (e.g., arsenic, benzo(a)pyrene, etc.) is likely overestimated.<br />
U.S. EPA guidance indicates that carcinogenic risks and HQs resulting from various multiple chemicals<br />
should be considered additive (U.S. EPA 1989). In the absence of supporting data for synergy or<br />
antagonism, the assumption of additively could overestimate or underestimate potential cancer risk or<br />
HQs for receptors.<br />
6.3 UNCERTAINTY CONCLUSION<br />
Given that virtually all of the major sources of uncertainty described in this Section are identified as<br />
resulting in overestimations of cancer risks and noncancer hazard, it is concluded that the chemical-<br />
specific risk-based concentrations calculated for each reuse scenario correspond to risk levels<br />
significantly less than the target levels used for the calculations (i.e., cancer target risk of 1E-06 for<br />
residential exposure and 1E-05 for industrial and construction, and a noncancer hazard index of 1).<br />
Thus, the calculated reuse levels are protective of human health.<br />
101248 – <strong>Appendix</strong> B – July 2008 Page 28
7.0 REFERENCES<br />
Human Health Risk Assessment<br />
Contaminant Management Plan, SVRT/BART Extension<br />
Bradford, G.R., A. C. Chang, A.L. Page, D. Bakhtar, J. A. Frampton, and H. Wright. 1996.<br />
Background Concentrations of Trace and Major Elements in California Soils. Kearney Foundation of<br />
Soil Science, University of California. March.<br />
California Department of Toxic Substances Control (DTSC). 1999. Preliminary Endangerment<br />
Assessment Guidance Manual.<br />
California Department of Toxic Substances Control (DTSC). 2003. Consolidated Table of<br />
OEHHA/ARB Approved Risk Assessment Health Values<br />
Comprehensive Environmental Response, Compensation, and Liability Act (CERCLA or Superfund).<br />
1980. 40 CFR 300 §300.430(e)(2i).<br />
Cowherd, C., Muleski, G., Englehart, P., and Gillette, D., 1985. Rapid Assessment of Exposure to<br />
Particulate Emissions From Surface Contaminated Sites. EPA/600/8-85/002. February.<br />
Dourson M.L., L.A. Knauf, J.C. Swartout (Dourson et al). 1992. On Reference Dose (RfD) and Its<br />
Underlying Toxicity Data Base. Toxicology and Industrial Health, Vol. 8, No. 3, pages 171-189.<br />
Environmental Resources Management (ERM), 2002. Peninsula Corridor Joint Powers Board, Soil<br />
Management Plan, Caltrain North and South CTX Projects. December, 16.<br />
National Oceanographic and Atmospheric Administration (NOAA), 2004. NOAA Recorded Average<br />
Annual Wind Speed Through 2001. www.berner.com/new/energy-windspeed.htm.<br />
Risk Assessment Information System (RAIS). 2004. [website cited May 2004]<br />
http://risk.lsd.ornl.gov/index.shtml.<br />
Rodricks, J.V. 1992. Calculated Risks. Understanding the Toxicity and Human Health Risks of<br />
Chemicals in our Environment. Cambridge: Cambridge University Press.<br />
Ruby, M.V., R. Schoof, W. Brattin, M. Goldale, G. Post, M. Harnios, D. E. Mosby, S. W. Casteel,<br />
W. Berti, M. Carpenter, D. Edwards, D. Cragin, and W. Chappell. 1999. Advances in Evaluating the<br />
Oral Bioavailability of Inorganics in Soil for Use in Human Health Risk Assessment. Environ. Sci.<br />
Technol. 33(21):3697-3705.<br />
San Francisco Regional Water Quality Control Board (RWQCB) 2005. Screening For Environmental<br />
Concerns at Sites With Contaminated Soil and Groundwater. Volume 2. Background <strong>Documentation</strong><br />
for the Development of Tier 1 Environmental Screening Levels. February.<br />
Scott, C.M. 1995. Background Metal Concentrations in Soils in Northern Santa Clara County,<br />
California. Recent Geologic Studies in the San Francisco Bay Area. Vol. 76, p. 217- 224.<br />
U.S. EPA. 1989. Risk Assessment Guidance for Superfund (RAGS), Volume 1, Human Health<br />
101248 – <strong>Appendix</strong> B – July 2008 Page 29
Evaluation Manual (Part A). December.<br />
Human Health Risk Assessment<br />
Contaminant Management Plan, SVRT/BART Extension<br />
U.S. EPA. 1991. Risk Assessment Guidance for Superfund (RAGS), Volume 1,Part B. Development<br />
of Risk-based Preliminary Remediation Goals. December.<br />
U.S. EPA. 1996a. Proposed Guidelines for Carcinogen Risk Assessment. EPA/600/P-92/003C. U.S.<br />
Environmental Protection Agency, Office of Research and Development. Washington, D.C. Federal<br />
Register 61(79):17960-18011.<br />
U.S. EPA. 1996b. Soil Screening Guidance: User’s Guide. Office of Solid Waste and Emergency<br />
Response. EPA/540/R-96/018. April.<br />
U.S. EPA, 1997a. Exposures Factors Handbook, Volume 1 General Factors. EPA/600/P-95/002Fa.<br />
August.<br />
U.S. EPA. 1997. Casteel, S.; Brown, L.; Weis, C.; Henningson, G.; Hoffman, E. Region 8, Denver<br />
Colorado. Document Control Number 4500-88-AORH. December.<br />
U.S. EPA. 1999. Guidelines for Carcinogen Risk Assessment. Review Draft. NCEA-F-0644. Risk<br />
Assessment Forum, U.S. Environmental Protection Agency. Washington, D.C. July.<br />
U.S. EPA, 2001. Supplemental Guidance for Developing Soil Screening Levels for Superfund Sites.<br />
OSWER 9355.4-24.<br />
U.S. EPA. 2002a. Region 9 Preliminary Remediation Goals (PRGs) 2002. [cited October 1, 2002].<br />
Available from http://www.epa.gov/region09/waste/sfund/prg/index.htm.<br />
U.S. EPA, 2003. Recommendations of the Technical Review Workgroup for Lead for an Approach<br />
for an Approach to Assessing Risks Associated with Adult Exposures to Lead in soil. EPA-540-R-03-<br />
001. January.<br />
101248 – <strong>Appendix</strong> B – July 2008 Page 30
ATTACHMENT B-1<br />
Human Health Risk Assessment<br />
Contaminant Management Plan, SVRT/BART Extension<br />
RISK-BASED CALCULATIONS FOR REUSE SCENARIOS
C(mg/kg)<br />
=<br />
Symbol<br />
Residential Exposure Scenario, Cancer Risks<br />
TR × AT<br />
c<br />
EF<br />
⎡⎛<br />
CSF x IRs ⎞ ⎛ SFS<br />
⎢⎜<br />
o adj<br />
×<br />
⎟ ⎜<br />
⎢⎜<br />
+<br />
CF ⎟ ⎜<br />
⎣⎝<br />
⎠ ⎝<br />
× CSF × ABS⎞<br />
⎛ IRa, x CSF ⎞ ⎛ IRa x CSF ⎞⎤<br />
o ⎟<br />
+<br />
⎜ adj i ⎟<br />
+<br />
⎜ adj i ⎟⎥<br />
CF ⎟ ⎜ PEF ⎟ ⎜ VF ⎟⎥<br />
⎠ ⎝<br />
⎠ ⎝<br />
⎠⎦<br />
C concentration in soil (mg/kg) calculated<br />
TR target hazard quotient 1.00E-06<br />
CSFo, CSFi cancer slope factor - oral, inhalation (1/mg/kg-d) chem specific<br />
ATc averaging time for carcinogens - (d) 25550<br />
EF exposure frequency - residential (d/y) 350<br />
IRsadj soil ingestion rate, age adjusted - (mg - yr/kg - d) 114<br />
CF conversion factor (mg/kg) 1.00E+06<br />
SFadj dermal soil factor, age-adjusted (mg - yr/kg - d) 361<br />
AFc Soil/skin adherance factor (mg/cm 2 ) 0.07<br />
ABS dermal absorbtion factor (unitless) chem specific<br />
IRa, adj inhalation rate, age-sdjusted (m 3 -yr/kg - d) 11<br />
PEF particulate emission factor (m 3 /kg) 9.30E+09<br />
VF volatilization factor (m 3 /kg) chem specific<br />
arsenic bioavailability 0.2<br />
Chemical CSFo CSFi ABS risk-based concentration<br />
Metals (mg/kg)<br />
Arsenic 9.45E+00 1.20E+01 0.04 0.21<br />
Barium NA NA 0.01 NA<br />
Beryllium NA 8.40E+00 0.01 7,347<br />
Cadmium NA 1.50E+01 0.001 4,115<br />
Chromium NA 4.20E+01 0.01 1,469<br />
Cobalt NA NA 0.01 NA<br />
Copper NA NA 0.01 NA<br />
Mercury NA NA 0.1 NA<br />
Molybdenum NA NA 0.01 NA<br />
Nickel NA 9.10E-01 0.0002 67,822<br />
Selenium NA NA 0.01 NA<br />
Silver NA NA 0.01 NA<br />
Thallium NA NA 0.01 NA<br />
Vanadium NA NA 0.01 NA<br />
Zinc NA NA 0.01 NA<br />
SVOCs<br />
Aroclor 1260 5.00E+00 2.00E+00 0.14 0.09<br />
Pesticides<br />
p,p'-DDE 3.40E-01 3.40E-01 0.05 1.63<br />
p,p'-DDT 3.40E-01 3.40E-01 0.05 1.63<br />
Pentachlorophenol 8.10E-02 1.80E-02 0.25 4.41<br />
alpha Chlordane 1.3 1.2 0.04 0.44<br />
gamma Chlordane 1.3 1.2 0.04 0.44<br />
Dieldrin 16 16 0.05 0.03<br />
Endrin aldehyde NA NA 0.05 NA<br />
Toxaphene 1.2 1.2 0.05 0.46<br />
101248- 7/29/2008 Attachment B-1-1
Residential Exposure Scenario, Cancer Risks<br />
VF<br />
VOCs<br />
t-Butanol NA NA 4.93E+04 NA<br />
Ethyl benzene NA NA 4.67E+03 NA<br />
Toluene NA NA 3.46E+03 NA<br />
Xylenes NA NA 5.27E+03 NA<br />
Notes:<br />
SVOCs = Semivolatile organic chemicals<br />
VOCs = Volatile organic chemicals<br />
CSFo = Oral cancer slope potency factor<br />
CSFi = Inhalation cancer slope potency factor<br />
101248- 7/29/2008 Attachment B-1-2
C(mg/kg)<br />
=<br />
Symbol<br />
EF<br />
r<br />
Residential Exposure Scenario, Noncancer Risks<br />
THQ × BW × AT<br />
c n<br />
⎡⎛<br />
IRs ⎞ ⎛ SA × AF × ABS⎞<br />
⎛ IRi ⎞ ⎛ IRi ⎞⎤<br />
× ED × ⎢⎜<br />
c ⎟+<br />
⎜ c c ⎟+<br />
⎜ c ⎟+<br />
⎜ c ⎟⎥<br />
c ⎢⎜<br />
RfD × CF⎟<br />
⎜ RfD × CF ⎟ ⎜ RfD x PEF⎟<br />
⎜ RfD × VF⎟⎥<br />
⎣⎝<br />
o ⎠ ⎝ o ⎠ ⎝ i ⎠ ⎝ i ⎠⎦<br />
C concentration in soil (mg/kg) calculated<br />
THQ target hazard quotient 1<br />
RfDo, RfDi reference dose - oral, inhalation (mg/kg-d) chem specific<br />
BW c body weight - (kg) 15<br />
AT n averaging time for noncarcinogens - (d) 2190<br />
EF r exposure frequency - residential (d/y) 350<br />
ED c exposure duration - (y) 6<br />
IRs c soil ingestion rate - (mg/d) 200<br />
CF conversion factor (mg/kg) 1.00E+06<br />
SAc skin surface area, child (cm 2 /d) 2800<br />
AFc Soil/skin adherance factor (mg/cm 2 ) 0.2<br />
ABS dermal absorbtion factor (unitless) chem specific<br />
IRi c inhalation rate (m 3 /d) 8.3<br />
PEF particulate emission factor (m 3 /kg) 9.30E+09<br />
VF volatilization factor (m 3 /kg) chem specific<br />
arsenic bioavailability 0.2<br />
Chemical RfDo RfDi ABS risk-based concentration<br />
Metals (mg/kg)<br />
Arsenic 3.00E-04 8.6E-06 0.04 117.3<br />
Barium 7.00E-02 1.4E-04 0.01 5,475<br />
Beryllium 2.00E-03 5.7E-06 0.01 156.4<br />
Cadmium 5.00E-04 5.7E-06 0.001 39.1<br />
Chromium 1.50E+00 NA 0.01 100,000<br />
Cobalt 2.00E-02 5.7E-06 0.01 1,564<br />
Copper 4.00E-02 NA 0.01 3,129<br />
Mercury 3.00E-04 2.6E-05 0.1 23.5<br />
Molybdenum 5.00E-03 NA 0.01 391.1<br />
Nickel 5.00E-02 1.4E-05 0.0002 3,911<br />
Selenium 5.00E-03 5.7E-03 0.01 391.1<br />
Silver 5.00E-03 NA 0.01 391.1<br />
Thallium 6.60E-05 NA 0.01 5.2<br />
Vanadium 1.00E-03 NA 0.01 78.2<br />
Zinc 3.00E-01 NA 0.01 23,464<br />
SVOCs<br />
Aroclor 1260 2.0E-05 2.00E-05 0.14 1.6<br />
Pesticides<br />
p,p'-DDE 5.00E-04 5.0E-04 0.05 39.1<br />
p,p'-DDT 5.00E-04 5.0E-04 0.05 39.1<br />
Pentachlorophenol 3.00E-02 3.0E-02 0.25 2,346<br />
alpha Chlordane 5.00E-04 2.0E-04 0.04 39.1<br />
gamma Chlordane 5.00E-04 2.0E-04 0.04 39.1<br />
Dieldrin 5.00E-05 5.0E-05 0.05 3.9<br />
101248- 7/29/2008 Attachment B-1-3
Residential Exposure Scenario, Noncancer Risks<br />
Endrin aldehyde 3.00E-04 3.0E-04 0.05 23.5<br />
Toxaphene NA NA 0.05 NA<br />
VOCs VF<br />
t-Butanol 0.3 3.00E-01 4.93E+04 22,516<br />
Ethyl benzene 0.1 5.71E-01 4.67E+03 4,452<br />
Toluene 2.00E-01 8.57E-02 3.46E+03 555<br />
Xylenes 2.00E-01 2.00E-01 5.27E+03 1,939<br />
Notes:<br />
SVOCs = Semivolatile organic chemicals<br />
VOCs = Volatile organic chemicals<br />
ABS = dermal absorption factor<br />
VF = volatilization factor<br />
RfDo = Chronic oral reference dose<br />
RfDi = Chronic inhalation reference dose<br />
iso butanol used as surrogate for t-butanol<br />
endrin aldehyde evaluated as endrin<br />
Calculations are for child only, in accordacne with "DTSC PRGs" which use EPA PRG guidance<br />
If calculated value exceeds 100,000mg/kg, the value presented defaults to 100,000mg/kg consistent with the<br />
ceiling limit of 100,000mg/kg used by the USEPA Region 9 PRGs.<br />
101248- 7/29/2008 Attachment B-1-4
Risk-Based Cleanup Goals for Carcinogenic Risk<br />
C(mg/kg)<br />
Industrial, Right-Of-Way, and Construction Scenarios, Cancer Risks<br />
TR × TR BW × x BW ATcx<br />
ATc<br />
= =<br />
⎡⎛<br />
IRs ⎡⎛<br />
IRs x CSFo x CSFo ⎞ ⎛⎞SA<br />
⎛xSA<br />
AFx<br />
xAF<br />
ABSx<br />
xABS<br />
CSFox<br />
⎞ CSFo ⎛ IRa ⎞x<br />
⎛CSFi<br />
IRa⎞<br />
x ⎛CSFi<br />
IRa x⎞<br />
CSFi ⎛ IRa ⎞⎤<br />
x CSFi⎞⎤<br />
EF EF×<br />
× ED EDx<br />
x ⎢⎜<br />
⎢⎜<br />
⎟ + ⎜⎟<br />
+ ⎜<br />
⎟ + ⎜ ⎟ + ⎜ ⎟ + ⎜ ⎟ + ⎜ ⎟⎥<br />
⎟<br />
⎣⎝<br />
CF ⎠ ⎝<br />
CF<br />
⎠ ⎝ PEF ⎠ ⎝ VF<br />
⎥<br />
⎣⎝<br />
CF ⎠ ⎝<br />
CF<br />
⎠ ⎝ PEF ⎠ ⎝ ⎠⎦<br />
VF ⎠⎦<br />
Symbol Definition ind onsite ROW construct<br />
C concentration in soil (mg/kg) calculated calculated calculated<br />
TR target hazard quotient 1.00E-05 1.00E-05 1.00E-05<br />
BW body weight (kg) 70 70 70<br />
CSFo, CSFi cancer slope factor - oral, inhalation(1/mg/kg-d) chem specific chem specific chem specific<br />
ATc averaging time for carcinogens - (d) 25550 25550 25550<br />
EF exposure frequency - (d/y) 250 100 20<br />
ED exposure duration - (y) 25 25 7<br />
IRs soil ingestion rate - (mg/d) 75 75 330<br />
CF conversion factor (mg/kg) 1.00E+06 1.00E+06 1.00E+06<br />
SA skin surface area (cm 2 /day) 3300 3300 3300<br />
AF Soil/skin adherance factor (mg/cm 2 ) 0.2 0.2 0.21<br />
ABS dermal absorption factor (unitless) chem specific chem specific chem specific<br />
IRa, inhalation rate (m 3 /d) 20 20 20<br />
PEF particulate emission factor (m 3 /kg) 9.30E+09 9.30E+09 6.75E+07<br />
VF volatilization factor (m 3 /kg) chem specific chem specific chem specific<br />
arsenic bioavailability 0.2 0.2 0.2<br />
Chemical CSFo CSFi ABS risk-based concentration<br />
Metals (mg/kg)<br />
Arsenic 9.45E+00 1.20E+01 0.03 8.7 21.8 154.8<br />
Barium NA NA 0.01 NA NA NA<br />
Beryllium NA 8.40E+00 0.01 100,000 100,000 51,328<br />
Cadmium NA 1.50E+01 0.001 88,710 100,000 28,744<br />
Chromium NA 4.20E+01 0.01 31,682 79,205 10,266<br />
Cobalt NA NA 0.01 NA NA NA<br />
Copper NA NA 0.01 NA NA NA<br />
Mercury NA NA 0.1 NA NA NA<br />
Molybdenum NA NA 0.01 NA NA NA<br />
101248- 7/29/2008 Attachment B-1-5
Industrial, Right-Of-Way, and Construction Scenarios, Cancer Risks<br />
Nickel NA 9.10E-01 0.0002 100,000 100,000 100,000<br />
Selenium NA NA 0.01 NA NA NA<br />
Silver NA NA 0.01 NA NA NA<br />
Thallium NA NA 0.01 NA NA NA<br />
Vanadium NA NA 0.01 NA NA NA<br />
Zinc NA NA 0.01 NA NA NA<br />
SVOCs<br />
Aroclor 1260 5.00E+00 2.00E+00 0.14 3.4 8.5 59.7<br />
Pesticides<br />
p,p'-DDE 3.40E-01 3.40E-01 0.05 77.9 194.8 1028.9<br />
p,p'-DDT 3.40E-01 3.40E-01 0.05 77.9 194.8 1028.9<br />
Pentachlorophenol 8.10E-02 1.80E-02 0.25 147.2 368.0 3125.9<br />
alpha Chlordane 1.3 1.2 0.04 21.7 54.3 274.3<br />
gamma Chlordane 1.3 1.2 0.04 21.7 54.3 274.3<br />
Dieldrin 16 16 0.05 1.7 4.1 21.9<br />
Endrin aldehyde NA NA 0.05 NA NA NA<br />
Toxaphene 1.2 1.2 0.05 22.1 55.2 291.5<br />
VOCs VFind VFrow VFconst<br />
t-Butanol NA NA 3.73E+04 3.73E+04 2.38E+04 NA NA NA<br />
Ethyl benzene NA NA 3.54E+03 3.54E+03 2.25E+03 NA NA NA<br />
Toluene NA NA 2.62E+03 2.62E+03 1.67E+03 NA NA NA<br />
Xylenes NA NA 3.99E+03 3.99E+03 2.54E+03 NA NA NA<br />
Notes:<br />
SVOCs = Semivolatile organic chemicals<br />
VOCs = Volatile organic chemicals<br />
CSFo = Oral cancer slope potency factor<br />
CSFi = Inhalation cancer slope potency factor<br />
ABS = dermal absorption factor<br />
VF = volatilization factor<br />
iso butanol used as surrogate for t-butanol<br />
endrin aldehyde evaluated as endrin<br />
If calculated value exceeds 100,000mg/kg, the value presented defaults to 100,000mg/kg consistent with the ceiling limit of 100,000 mg/kg used by the USEPA Region 9 PRGs<br />
101248- 7/29/2008 Attachment B-1-6
C(mg/kg)<br />
=<br />
Industrial, Right-of-Way, and Construction Scenarios, Noncancer Risks<br />
EF ×<br />
THQ × BW × AT<br />
n<br />
⎡⎛<br />
⎞ ⎛<br />
⎞ ⎛<br />
⎞ ⎛ ⎞⎤<br />
⎢⎜<br />
IRs ⎟ ⎜ SA × AF×<br />
ABS ⎟ + ⎜ IRa ⎟ + ⎜ IRa<br />
ED ×<br />
+<br />
⎟⎥<br />
⎢⎜<br />
RfD × CF ⎟ ⎜ RfD × CF ⎟ ⎜ RfD x PEF ⎟ ⎜ RfD × VF⎟⎥<br />
⎣⎝<br />
o ⎠ ⎝ o ⎠ ⎝ i ⎠ ⎝ i ⎠⎦<br />
Symbol Definition ind onsite ROW construct<br />
C concentration in soil (mg/kg) calculated calculated calculated<br />
THQ target hazard quotient 1 1 1<br />
BW body weight (kg) 70 70 70<br />
RfDo, RfDi reference dose - oral, inhalation(mg/kg-d) chem specific chem specific chem specific<br />
AT n averaging time for noncarcinogens - (d) 9125 9125 365<br />
EF exposure frequency - (d/y) 250 100 140<br />
ED exposure duration - (y) 25 25 1<br />
IRs soil ingestion rate - (mg/d) 75 75 330<br />
CF conversion factor (mg/kg) 1.00E+06 1.00E+06 1.00E+06<br />
SA skin surface area (cm 2 /day) 3300 3300 3300<br />
AF Soil/skin adherance factor (mg/cm 2 ) 0.2 0.2 0.21<br />
ABS dermal absorption factor (unitless) chem specific chem specific chem specific<br />
IRa, inhalation rate (m 3 /d) 20 20 20<br />
PEF particulate emission factor (m 3 /kg) 9.30E+09 9.30E+09 6.75E+07<br />
VF volatilization factor (m 3 /kg) chem specific chem specific chem specific<br />
arsenic bioavailability 0.2 0.2 0.2<br />
Chemical RfDo RfDi ABS risk-based concentration<br />
Metals (mg/kg)<br />
Arsenic 3.00E-04 8.57E-06 0.03 2,044 5,107 830<br />
Barium 7.00E-02 1.4E-04 0.01 95,385 100,000 38,712<br />
Beryllium 2.00E-03 5.7E-06 0.01 2,725 6,813 1,106<br />
Cadmium 5.00E-04 5.7E-06 0.001 681 1,703 277<br />
Chromium 1.50E+00 NA 0.01 100,000 100,000 100,000<br />
Cobalt 2.00E-02 5.7E-06 0.01 27,253 68,128 11,061<br />
Copper 4.00E-02 NA 0.01 54,506 100,000 22,121<br />
Mercury 3.00E-04 2.6E-05 0.1 409 1,022 166<br />
Molybdenum 5.00E-03 NA 0.01 6,813 17,033 2,765<br />
Nickel 5.00E-02 1.4E-05 0.0002 68,132 170,326 27,652<br />
Selenium 5.00E-03 5.7E-03 0.01 6,813 17,033 2,765<br />
Silver 5.00E-03 NA 0.01 6,813 17,033 2,765<br />
Thallium 6.60E-05 NA 0.01 90 225 37<br />
Vanadium 1.00E-03 NA 0.01 1,363 3,407 553<br />
Zinc 3.00E-01 NA 0.01 100,000 100,000 100,000<br />
101248- 7/29/2008 Attachment B-1-7
SVOCs<br />
Pesticides<br />
Industrial, Right-of-Way, and Construction Scenarios, Noncancer Risks<br />
Aroclor 1260 2.0E-05 2.00E-05 0.14 27 68 16<br />
p,p'-DDE 5.00E-04 5.00E-04 0.05 681 1,703 277<br />
p,p'-DDT 5.00E-04 5.00E-04 1.05 680 1,697 278<br />
Pentachlorophenol 3.00E-02 3.0E-02 0.25 40,866 102,110 16,591<br />
alpha Chlordane 5.00E-04 2.0E-04 0.04 681 1,703 277<br />
gamma Chlordane 5.00E-04 2.0E-04 0.04 681 1,703 277<br />
Dieldrin 5.00E-05 5.0E-05 0.05 68 170 28<br />
Endrin aldehyde 3.00E-04 3.0E-04 0.05 409 1,022 166<br />
Toxaphene NA NA 0.05 NA NA NA<br />
VOCs VFind VFrow VFconst<br />
t-Butanol 0.3 3.00E-01 3.73E+04 3.73E+04 1.08E+04 50,164 100,000 25,093<br />
Ethyl benzene 0.1 5.71E-01 3.54E+03 3.54E+03 7.60E+02 9,601 24,003 3,693<br />
Toluene 2.00E-01 8.57E-02 2.62E+03 2.62E+03 7.56E+02 1,143 2,856 588<br />
Xylenes 2.00E-01 2.00E-01 3.99E+03 3.99E+03 1.15E+03 4,018 10,044 2,067<br />
Notes:<br />
SVOCs = Semivolatile organic chemicals<br />
VOCs = Volatile organic chemicals<br />
ABS = dermal absorption factor<br />
VF = volatilization factor<br />
RfDo = Chronic oral reference dose<br />
RfDi = Chronic inhalation reference dose<br />
iso butanol used as surrogate for t-butanol<br />
endrin aldehyde evaluated as endrin<br />
If calculated value exceeds 100,000mg/kg, the value presented defaults to 100,000mg/kg consistent with the ceiling limit of 100,000mg/kg used by the USEPA Region 9 P<br />
101248- 7/29/2008 Attachment B-1-8
Off-Site Residential Dust Exposure, Cancer Risks<br />
TR x ATc x CF<br />
C (mg/kg) =<br />
⎡⎛<br />
IRa x EDa ⎞ ⎛ IRc x EDc ⎞⎤<br />
CSF x PC x EF x ⎢⎜<br />
⎟ + ⎜<br />
⎟⎥<br />
⎣⎝<br />
BWa ⎠ ⎝ BWc ⎠⎦<br />
Symbol<br />
C concentration in soil (mg/kg) calculated<br />
TR target risk 1.00E-06<br />
BWc body weight, child (kg) 15<br />
Bwa body weight, adult (kg) 70<br />
CSFi cancer slope factor - inhalation (1/mg/kg-d) chem specific<br />
ATc averaging time for carcinogens - (d) 25550<br />
EF exposure frequency - residential (d/y) 350<br />
EDc exposure duration, child (yr) 6<br />
EDa exposure duration, adult (yr) 24<br />
CF conversion factor (kg/mg) 1.00E+06<br />
IRc inhalation rate, child (m 3 /d) 8.3<br />
IRa inhalation rate, adult (m 3 /d) 15.2<br />
PC particulate concentration (mg/m 3 ) 5.00E-03<br />
Chemical CSFi risk-based concentration<br />
Metals (mg/kg)<br />
Arsenic 9.45E+00 181<br />
Barium NA NA<br />
Beryllium 8.40E+00 204<br />
Cadmium 1.50E+01 114<br />
Chromium NA NA<br />
Cobalt NA NA<br />
Copper NA NA<br />
Mercury NA NA<br />
Molybdenum NA NA<br />
Nickel 9.10E-01 1,881<br />
Selenium NA NA<br />
Silver NA NA<br />
Thallium NA NA<br />
Vanadium NA NA<br />
Zinc NA NA<br />
SVOCs<br />
Aroclor 1260 2.00E+00 856<br />
Pesticides<br />
p,p'-DDE 3.40E-01 5,033<br />
p,p'-DDT 3.40E-01 5,033<br />
Pentachlorophenol 1.80E-02 95,073<br />
alpha Chlordane 1.2 1,426<br />
gamma Chlordane 1.2 1,426<br />
Dieldrin 16 107<br />
Endrin aldehyde NA NA<br />
Toxaphene 1.2 1,426<br />
Notes:<br />
101248- 7/29/2008 Attachment B-1-9
Off-Site Residential Dust Exposure, Cancer Risks<br />
Off-site dust is treated differently than onsite dust to account for the passage of trains<br />
as the largest source, rather than fugitive dust for onsite receptors (CTX report)<br />
Bioavailability of arsenic is not appropriate here because there is no ingestion route; just inhalation<br />
SVOCs = Semivolatile organic chemicals<br />
endrin aldehyde evaluated as endrin<br />
If calculated value exceeds 100,000mg/kg, the value presented defaults to 100,000mg/kg consistent with the<br />
ceiling limit of 100,000mg/kg used by the USEPA Region 9 PRGs.<br />
CSFi = Inhalation cancer slope potency factor<br />
101248- 7/29/2008 Attachment B-1-10
Symbol<br />
Off-Site Residential Dust Exposure, Noncancer Risks<br />
C concentration in soil (mg/kg) calculated<br />
THQ target hazard quotient 1.00E+00<br />
BWc body weight, child (kg) 15<br />
CSFi cancer slope factor - inhalation (1/mg/kg-d) chem specific<br />
Atn averaging time for carcinogens - (d) 2190<br />
EF exposure frequency - residential (d/y) 350<br />
EDc exposure duration, child (yr) 6<br />
CF conversion factor (kg/mg) 1.00E+06<br />
IRc inhalation rate, child (m 3 /d) 8.3<br />
PC particulate concentration (mg/m 3 ) 5.00E-03<br />
Chemical RfDi risk-based concentration<br />
Metals (mg/kg)<br />
Arsenic 8.6E-06 3,230<br />
Barium 1.4E-04 52,771<br />
Beryllium 5.7E-06 2,149<br />
Cadmium 5.7E-06 2,152<br />
Chromium NA NA<br />
Cobalt 5.7E-06 2,149<br />
Copper NA NA<br />
Mercury 2.6E-05 9,687<br />
Molybdenum NA NA<br />
Nickel 1.4E-05 5,390<br />
Selenium 5.7E-03 2,152,306<br />
Silver NA NA<br />
Thallium NA NA<br />
Vanadium NA NA<br />
Zinc NA NA<br />
SVOCs<br />
Aroclor 1260 2.00E-05 7,539<br />
Pesticides<br />
p,p'-DDE 5.0E-04 100,000<br />
p,p'-DDT 5.0E-04 100,000<br />
Pentachlorophenol 3.0E-02 100,000<br />
alpha Chlordane 2.0E-04 75,387<br />
gamma Chlordane 2.0E-04 75,387<br />
Dieldrin 5.0E-05 18,847<br />
Endrin aldehyde 3.0E-04 100,000<br />
Toxaphene NA NA<br />
Notes:<br />
C (mg/kg) =<br />
CF x RfDi x BWc x ATn x THQ<br />
PC x IRc x EF x EDc<br />
101248- 7/29/2008 Attachment B-1-11
Off-Site Residential Dust Exposure, Noncancer Risks<br />
Off-site dust is treated differently than onsite dust to account for the passage of trains<br />
as the largest source, rather than fugitive dust for onsite receptors (CTX report)<br />
Bioavailability of arsenic is not appropriate here because there is no ingestion route; just inhalation<br />
SVOCs = Semivolatile organic chemicals<br />
endrin aldehyde evaluated as endrin<br />
Calculations are for child only, in accordance with "DTSC PRGs" which use EPA PRG guidance<br />
If calculated value exceeds 100,000mg/kg, the value presented defaults to 100,000mg/kg consistent with the<br />
ceiling limit of 100,000mg/kg used by the USEPA Region 9 PRGs.<br />
RfDi = Chronic inhalation reference dose<br />
101248- 7/29/2008 Attachment B-1-12
USER'S GUIDE to version 7<br />
Results Applicable to the Off-Site Residential Scenario<br />
INPUT OUTPUT<br />
MEDIUM LEVEL PRG-99 PRG-95<br />
Lead in Air (ug/m 3 ) 0.0117 50th 90th 95th 98th 99th (ug/g) (ug/g)<br />
Lead in Soil/Dust (ug/g) 11.4 BLOOD Pb, ADULT 0.4 0.7 0.8 1.0 1.2 903 1289<br />
Lead in Water (ug/l) 2 BLOOD Pb, CHILD 0.8 1.4 1.7 2.1 2.4 213 315<br />
% Home-grown Produce 7% BLOOD Pb, PICA CHILD 0.9 1.6 1.9 2.3 2.6 137 202<br />
Respirable Indoor Dust (ug/m 3 Percentile Estimate of Blood Pb (ug/dl)<br />
) 1.5 BLOOD Pb, OCCUPATIONAL 0.4 0.7 0.8 1.0 1.1 4610 6588<br />
EXPOSURE PARAMETERS<br />
CALIFORNIA DEPARTMENT OF TOXIC SUBSTANCES CONTROL<br />
PATHWAYS<br />
units adults children<br />
Days per week days/wk<br />
Days per week, occupational 5 PEF ug/dl percent PEF ug/dl percent<br />
Geometric Standard Deviation Soil Contact 4.2E-5 0.00 0% 1.7E-5 0.00 0%<br />
Blood lead level of concern (ug/dl) Soil Ingestion 8.8E-4 0.01 3% 6.3E-4 0.01 2%<br />
Skin area, residential cm 2<br />
5700 2800 Inhalation1 0.02 5% 0.01 4%<br />
Skin area occupational cm 2<br />
3300 Inhalation 2.5E-6 0.00 0% 1.8E-6 0.00 0%<br />
Soil adherence ug/cm 2<br />
70 200 Water Ingestion 0.11 29% 0.11 31%<br />
Dermal uptake constant (ug/dl)/(ug/day) Food Ingestion1 0.22 56% 0.23 64%<br />
Soil ingestion mg/day 50 100 Food Ingestion 2.4E-3 0.03 7% 0%<br />
Soil ingestion, pica mg/day 200<br />
Ingestion constant (ug/dl)/(ug/day) 0.04 0.16<br />
Bioavailability unitless<br />
Breathing rate m 3 ADULTS<br />
Residential<br />
Occupational<br />
7<br />
Pathway contribution Pathway contribution<br />
Pathway<br />
1.6<br />
10<br />
0.00011<br />
CHILDREN<br />
typical with pica<br />
0.44<br />
Pathway contribution Pathway contribution<br />
/day 20 6.8 Pathway PEF ug/dl percent PEF ug/dl percent<br />
Inhalation constant (ug/dl)/(ug/day) 0.082 0.192 Soil Contact 5.9E-5 0.00 0% 0.00 0%<br />
Water ingestion l/day 1.4 0.4 Soil Ingestion 7.0E-3 0.08 10% 1.4E-2 0.16 18%<br />
Food ingestion kg/day 1.9 1.1 Inhalation1 1.5E-6 0.00 0% 0.00 0%<br />
Lead in market basket ug/kg 3.1<br />
Inhalation 0.02 2% 0.02 2%<br />
Lead in produce ug/kg 5.1<br />
Water Ingestion 0.13 16% 0.13 15%<br />
Food Ingestion, child 0.50 64% 0.50 58%<br />
Food Ingestion 5.5E-3 0.06 8% 0.06 7%<br />
101248- 7/29/2008 Attachment B-1-13
Reuse Scenario 2: On-Site Industrial<br />
Calculations of Preliminary Remediation Goals (PRGs)<br />
U.S. EPA Technical Review Workgroup for Lead, Adult Lead Committee<br />
Version date 05/19/03<br />
PRG<br />
Values for Non-<br />
Residential<br />
Exposure<br />
Scenario<br />
Exposure Equation 1<br />
Variable 1* 2** Description of Exposure Variable Units GSDi = Het<br />
PbBfetal, 0.95 X X<br />
th<br />
95 percentile PbB in fetus ug/dL 10<br />
Rfetal/maternal X X Fetal/maternal PbB ratio -- 0.9<br />
BKSF X X Biokinetic Slope Factor ug/dL per<br />
ug/day<br />
0.4<br />
GSDi X X Geometric standard deviation PbB -- 2.0<br />
PbB0 X X Baseline PbB ug/dL 1.96<br />
IRS X Soil ingestion rate (including soil-derived indoor dust) g/day 0.075<br />
IRS+D X Total ingestion rate of outdoor soil and indoor dust g/day --<br />
WS X Weighting factor; fraction of IRS+D ingested as outdoor soil -- --<br />
KSD X Mass fraction of soil in dust -- --<br />
AFS, D X X Absorption fraction (same for soil and dust) -- 0.12<br />
EFS, D X X Exposure frequency (same for soil and dust) days/yr 250<br />
ATS, D X X Averaging time (same for soil and dust) days/yr 365<br />
PRG Preliminary Remediation Goal ppm 646<br />
1<br />
Equation 1 does not apportion exposure between soil and dust ingestion (excludes WS, KSD). When IRS = IRS+D and WS = 1.0, the equations yield the same PRG.<br />
*Equation 1, based on Eq. 4 in USEPA (1996).<br />
1.645<br />
PRG =<br />
([PbB95fetal/(R*(GSDi )])-PbB0)*ATS,D BKSF*(IRS+D*AFS,D*EFS,D) Source: U.S. EPA (1996). Recommendations of the Technical Review Workgroup for Lead<br />
for an Interim Approach to Assessing Risks Associated with Adult Exposures to Lead in Soil<br />
101248 - 7/29/2008 Attachment B-1-14
Reuse Scenario 4: Construction<br />
Calculations of Preliminary Remediation Goals (PRGs)<br />
U.S. EPA Technical Review Workgroup for Lead, Adult Lead Committee<br />
Version date 05/19/03<br />
PRG<br />
Values for Non-<br />
Residential<br />
Exposure<br />
Scenario<br />
Exposure Equation 1<br />
Variable 1* 2** Description of Exposure Variable Units GSDi = Het<br />
PbBfetal, 0.95 X X<br />
th<br />
95 percentile PbB in fetus ug/dL 10<br />
Rfetal/maternal X X Fetal/maternal PbB ratio -- 0.9<br />
BKSF X X Biokinetic Slope Factor ug/dL per<br />
ug/day<br />
0.4<br />
GSDi X X Geometric standard deviation PbB -- 2.0<br />
PbB0 X X Baseline PbB ug/dL 1.96<br />
IRS X Soil ingestion rate (including soil-derived indoor dust) g/day 0.330<br />
IRS+D X Total ingestion rate of outdoor soil and indoor dust g/day --<br />
WS X Weighting factor; fraction of IRS+D ingested as outdoor soil -- --<br />
KSD X Mass fraction of soil in dust -- --<br />
AFS, D X X Absorption fraction (same for soil and dust) -- 0.12<br />
EFS, D X X Exposure frequency (same for soil and dust) days/yr 140<br />
ATS, D X X Averaging time (same for soil and dust) days/yr 365<br />
PRG Preliminary Remediation Goal ppm 262<br />
1<br />
Equation 1 does not apportion exposure between soil and dust ingestion (excludes WS, KSD). When IRS = IRS+D and WS = 1.0, the equations yield the same PRG.<br />
*Equation 1, based on Eq. 4 in USEPA (1996).<br />
1.645<br />
PRG =<br />
([PbB95fetal/(R*(GSDi )])-PbB0)*ATS,D BKSF*(IRS+D*AFS,D*EFS,D) Source: U.S. EPA (1996). Recommendations of the Technical Review Workgroup for Lead<br />
for an Interim Approach to Assessing Risks Associated with Adult Exposures to Lead in Soil<br />
101248 - 7/29/2008 Attachment B-1-15
Reuse Scenario 3: Right-Of-Way<br />
Calculations of Preliminary Remediation Goals (PRGs)<br />
U.S. EPA Technical Review Workgroup for Lead, Adult Lead Committee<br />
Version date 05/19/03<br />
PRG<br />
Values for Non-<br />
Residential<br />
Exposure<br />
Scenario<br />
Exposure Equation 1<br />
Variable 1* 2** Description of Exposure Variable Units GSDi = Het<br />
PbBfetal, 0.95 X X<br />
th<br />
95 percentile PbB in fetus ug/dL 10<br />
Rfetal/maternal X X Fetal/maternal PbB ratio -- 0.9<br />
BKSF X X Biokinetic Slope Factor ug/dL per<br />
ug/day<br />
0.4<br />
GSDi X X Geometric standard deviation PbB -- 2.0<br />
PbB0 X X Baseline PbB ug/dL 1.96<br />
IRS X Soil ingestion rate (including soil-derived indoor dust) g/day 0.075<br />
IRS+D X Total ingestion rate of outdoor soil and indoor dust g/day --<br />
WS X Weighting factor; fraction of IRS+D ingested as outdoor soil -- --<br />
KSD X Mass fraction of soil in dust -- --<br />
AFS, D X X Absorption fraction (same for soil and dust) -- 0.12<br />
EFS, D X X Exposure frequency (same for soil and dust) days/yr 100<br />
ATS, D X X Averaging time (same for soil and dust) days/yr 365<br />
PRG Preliminary Remediation Goal ppm 1,615<br />
1<br />
Equation 1 does not apportion exposure between soil and dust ingestion (excludes WS, KSD). When IRS = IRS+D and WS = 1.0, the equations yield the same PRG.<br />
*Equation 1, based on Eq. 4 in USEPA (1996).<br />
1.645<br />
PRG =<br />
([PbB95fetal/(R*(GSDi )])-PbB0)*ATS,D BKSF*(IRS+D*AFS,D*EFS,D) Source: U.S. EPA (1996). Recommendations of the Technical Review Workgroup for Lead<br />
for an Interim Approach to Assessing Risks Associated with Adult Exposures to Lead in Soil<br />
101248 - 7/29/2008 Attachment B-1-16
TABLE OF CONTENTS<br />
101248 – <strong>Appendix</strong> C – July 2008 i<br />
Ecological Risk Assessment<br />
Contaminant Management Plan, SVRT/BART Extension<br />
Section Page<br />
1.0 INTRODUCTION ........................................................................................... 1<br />
2.0 BACKGROUND INFORMATION ...................................................................... 1<br />
2.1 Environmental Setting .............................................................................. 1<br />
2.2 Special Status Species .............................................................................. 2<br />
2.3 Primary Contaminants.............................................................................. 4<br />
2.3.1 Contaminant Characterization Information............................................ 4<br />
2.3.2 Contaminant Mobility .................................................................... 6<br />
3.0 SCREENING-LEVEL PROBLEM FORMULATION .............................................. 6<br />
3.1 Key Ecological Receptors.......................................................................... 6<br />
3.2 Complete Exposure Pathways..................................................................... 7<br />
3.2.1 Exposure Routes........................................................................... 7<br />
3.2.1.1 Exposure Routes for Aquatic and Amphibious Species ................. 7<br />
3.2.1.2 Exposure Routes for Winged Predatory Species ......................... 8<br />
3.2.1.3 Summary of Exposure Routes ............................................... 8<br />
3.2.2 Exposure Pathways ....................................................................... 9<br />
3.2.2.1 Exposure Pathways for Aquatic and Amphibious Species .............. 9<br />
3.2.2.2 Exposure Pathways for Winged Predatory Species .....................10<br />
3.2.3 Summary of Complete Exposure Pathways ..........................................10<br />
4.0 ECOLOGICAL PROTECTION ........................................................................11<br />
4.1 Chemical-Specific Ecological Screening Levels ..............................................11<br />
4.2 Ecological Protection Measures .................................................................12<br />
5.0 REFERENCES..............................................................................................15
LIST OF ABBREVIATIONS AND ACRONYMS<br />
101248 – <strong>Appendix</strong> C – July 2008 ii<br />
Ecological Risk Assessment<br />
Contaminant Management Plan, SVRT/BART Extension<br />
BART Bay Area Rapid Transit<br />
EIS/EIR Environmental Impact Statement/Environmental Impact Report<br />
ER effects range<br />
ERA ecological risk assessment<br />
ER-L effects range-low<br />
ER-M effects range-median<br />
mg/kg milligrams per kilogram<br />
MPZ migration potential zone<br />
NOAA National Oceanic and Atmospheric Administration<br />
ROW right of way<br />
RWQCB Regional Water Quality Control Board, San Francisco Bay Region<br />
SVRT Silicon Valley Rapid Transit<br />
TEPH total extractable petroleum hydrocarbons<br />
TPH total petroleum hydrocarbons<br />
UP Union Pacific Railroad<br />
U.S. EPA United States Environmental Protection Agency<br />
VOC volatile organic compound<br />
<strong>VTA</strong> Santa Clara Valley Transportation Authority
1.0 INTRODUCTION<br />
Ecological Risk Assessment<br />
Contaminant Management Plan, SVRT/BART Extension<br />
In order to evaluate risks to potential ecological receptors, a screening level ecological risk assessment<br />
(ERA) has been performed for the Silicon Valley Rapid Transit (SVRT) project. The screening level<br />
ERA generally follows the guidance in the Ecological Risk Assessment Guidance for Superfund:<br />
Process for Designing and Conducting Ecological Risk Assessments - Interim Final (U.S. EPA, 1997).<br />
The ERA includes a summary of site information as it pertains to ecological receptors, problem<br />
formulation, and screening-level toxicity evaluations, exposure estimations, risk calculations, and<br />
recommended actions to ameliorate ecological risks. Only post-construction conditions are evaluated in<br />
this ERA.<br />
2.0 BACKGROUND INFORMATION<br />
The ecological setting and list of special status species presented in this ERA are based on the detailed<br />
site-specific ecological evaluation presented in the Final Environmental Impact Report (Final EIR) for<br />
the SVRT project (<strong>VTA</strong>, 2004).<br />
The affected environment in the SVRT project area was assessed by trained biologists (during various<br />
seasons in 2002 and 2003) to determine vegetation communities, jurisdictional waters of the United<br />
States including wetlands, wildlife corridors, and suitable habitat for ‘special status’ species. Although<br />
the surveys focused on the area that would be impacted by project construction, vegetation communities<br />
and incidental sightings of species were recorded for both the SVRT and its vicinity.<br />
As detailed below, the survey found that the SVRT project alignment is the location of some of the<br />
sensitive environments listed in the Ecological Risk Assessment Guidance:<br />
• habitat known to be used by federal designated or proposed endangered or threatened species;<br />
• habitat known to be used by state designated endangered or threatened species;<br />
• migratory pathways and feeding areas critical for maintenance of anadromous fish species<br />
within river reaches where fish spend extended periods of time; and<br />
• wetlands.<br />
2.1 ENVIRONMENTAL SETTING<br />
The SVRT project area covers a variety of environmental settings. The following biological<br />
communities were identified in the project area or its immediate vicinity:<br />
101248 – <strong>Appendix</strong> C – July 2008 Page 1
Ecological Risk Assessment<br />
Contaminant Management Plan, SVRT/BART Extension<br />
• Ruderal/disturbed habitat, including agriculture and ornamental landscapes, with a mixture of<br />
native and exotic plant species. The most common habitat. Exotic plant species may provide<br />
valuable habitat elements such as cover for nesting and roosting, as well as food sources such as<br />
nuts or berries.<br />
• Seasonal and freshwater emergent wetlands, including those on the bottoms of ditches and<br />
depressions excavated for flood control or other purposes. Wetland plant species are typically<br />
low-growing, tenacious perennials that tolerate disturbance and perennial wetness, though there<br />
are also annuals that tolerate seasonal wetness. Wetlands are among the most productive<br />
wildlife habitats in California, and provide food, cover, and water for various species of birds,<br />
mammals, reptiles, and amphibians. Wetlands are typically present along the creek banks and in<br />
the drainage ditches that cross the project corridor in approximately 14 locations. Most of the<br />
wetlands are also classified as Waters of the United States; the Draft EIS/EIR identified a total<br />
of 2.668 acres of Waters of the United States within the SVRT project area, though some of<br />
these are above the tunnel segment.<br />
• The Central Coast cottonwood-sycamore riparian forest, 2.6 acres of which are located on finegrained<br />
alluvial soils within the floodplains of Berryessa Creek, Coyote Creek, and Penitencia<br />
Creek. This habitat provides a wide range of resources to wildlife, such as cover, water,<br />
movement and migration corridors, and a variety of foraging opportunities.<br />
• Non-native annual grassland similar to non-native grassland communities in the valleys and<br />
foothills throughout much of California; these can also contain some native annual grasses and<br />
other vegetation. These grasslands provide foraging and nesting habitat for a wide variety of<br />
wildlife species including raptors, seed eating birds, small mammals, amphibians, and reptiles.<br />
Most portions of the SVRT project area are disturbed (or ‘ruderal’) habitat, since the BART tracks will<br />
be located on the former railroad right-of-way (ROW) for the Union Pacific Railroad (UP) and most<br />
stations or other facilities will be built on previously developed property. The former ROW has been<br />
regularly used by trains since Western Pacific Railroad constructed the railroad tracks in the 1920s. In<br />
most areas, the ROW corridor is about 60 feet wide, and bordered on either side by fences which<br />
impede the movement of land-borne animals. Much of the middle of the corridor consists of gravel used<br />
as ballast beneath the railroad tracks (the ballast width is generally greater than 18 feet wide where<br />
tracks were constructed above the surrounding grade, but widths of 10 to 33 feet have been observed),<br />
often with a buffer zone of bare earth on either side of the ballast. As a result, much of the railroad<br />
ROW cannot be considered a habitat for significant biological communities. However, as noted above,<br />
the project area also contains valuable biological communities other than ruderal habitat.<br />
2.2 SPECIAL STATUS SPECIES<br />
Special status species are species that have been afforded special recognition and protection by federal,<br />
state, or local resource conservation agencies and organizations. The assessment to identify special<br />
status species summarized in the Draft EIS/EIR identified a number of special status species with the<br />
101248 – <strong>Appendix</strong> C – July 2008 Page 2
Ecological Risk Assessment<br />
Contaminant Management Plan, SVRT/BART Extension<br />
potential to be present (or with suitable habitat) within the SVRT project area. The assessment included<br />
field surveys, literature searches and queries of agencies. The following special status species were<br />
identified as present or potentially present:<br />
Aquatic or amphibious species:<br />
• Central California coast steelhead, federally listed as threatened. Viable populations of this fish<br />
spawn in Coyote Creek and Upper Penitencia Creek from November through April, with<br />
juveniles typically remaining in the creeks into summer.<br />
• Central Valley late fall-run Chinook salmon, federally listed as threatened and a California<br />
species of special concern. Viable populations of this fish spawn in Coyote Creek and Upper<br />
Penitencia Creek from October through December, with juveniles typically migrating from the<br />
creeks in another few months.<br />
• California red-legged frog, federally listed as threatened and a California species of special<br />
concern. These amphibians prefer permanent and semi-permanent aquatic habitats, such as the<br />
riparian habitat along the creeks.<br />
• Southwestern pond turtle, a federal and state species of special concern. These amphibians are<br />
typically found in or adjacent to quiet waters with emergent vegetation, with habitat in streams<br />
including Coyote Creek, Upper Penitencia Creek and Lower Silver Creek.<br />
Winged predatory species:<br />
• Western burrowing owl, a federal and state species of special concern. These birds nest<br />
underground in open, dry annual or perennial grasslands and forages primarily for rodents.<br />
• Cooper’s hawk, a California species of special concern. This hawk generally nests in riparian<br />
and evergreen forests, is tolerant of human disturbance, and eats primarily smaller birds and<br />
mammals.<br />
• White-tailed kite, a hawk which is a federal species of concern and fully protected by the state.<br />
The white-tailed kite nests in riparian forest and oak woodland and forages in open habitats for<br />
primarily small mammals.<br />
• Loggerhead shrike, a predatory songbird which is a federal and state species of special concern.<br />
Loggerhead shrikes prefer open habitat with grasses interspersed with trees and bare ground,<br />
where they hunt for a wide variety of prey including insects, small mammals and birds, and<br />
reptiles. Loggerhead shrikes are adaptable to urban settings, and were observed at a number of<br />
locations in the SVRT project area during the ecological assessment.<br />
• Yuma myotis bat, a winged mammal that is a federal species of concern. May be found<br />
roosting under bridges and buildings in the project area, or roosting and feeding in riparian<br />
areas. Has not been observed in the project area.<br />
• Long-legged myotis bat, a winged mammal that is a federal species of concern. May be found<br />
roosting under bridges, buildings, or trees (in snags or under the bark) in riparian areas. Has<br />
not been observed in the project area.<br />
101248 – <strong>Appendix</strong> C – July 2008 Page 3
Ecological Risk Assessment<br />
Contaminant Management Plan, SVRT/BART Extension<br />
• Pacific long-eared myotis bat, a winged mammal that is a federal species of concern. May be<br />
found roosting under bridges, buildings, or trees (in snags or under the bark) in riparian areas.<br />
Has not been observed in the project area.<br />
• Western big-eared bat, a winged mammal that is a federal and state species of concern. May be<br />
found roosting under bridges and buildings. Has not been observed in the project area.<br />
Vegetation species:<br />
• Congdon’s tarplant, a flowering thistle-like plant that is a federal species of concern. The<br />
Condon’s tarplant grows in unplowed grasslands, and has been observed within the SVRT<br />
project area.<br />
• Alkali milkvetch, a tiny, annual member of the pea family, is a federal species of concern. This<br />
plant can be found in moist grasslands in heavy clay soils, and is not considered likely to be<br />
present within the SVRT project area.<br />
• Diamond-petaled California poppy, a federal species of concern, is a relative of the California<br />
poppy. It is typically located in depressions in alkaline heavy clay soils and is unlikely to be<br />
present within the SVRT project area.<br />
In addition, swallows are federally protected species of birds that may nest in colonies under artificial<br />
structures, such as bridges. Tree swallows have been observed under the Abel Street undercrossing.<br />
2.3 PRIMARY CONTAMINANTS<br />
Living environments for ecological receptors tend to be concentrated in surface and near-surface soils.<br />
Preliminary characterization of the SVRT project alignment indicates that the primary contaminants in<br />
surface and near-surface site soils are arsenic, lead, and higher molecular weight petroleum<br />
hydrocarbons (TPH), the same as at greater depth. The metals appear to be primarily related to the use<br />
of smelter slag for some of the ballast underlying the railroad tracks, though lead from aerial deposition<br />
and other localized sources (e.g., batteries for signalized intersections) also appears present. The<br />
petroleum hydrocarbons appear to be primarily widely-spread lubricants and fuels related to railroad<br />
operation, though there are also areas where off-site releases of gasoline have migrated onto the site in<br />
groundwater.<br />
2.3.1 Contaminant Characterization Information<br />
Based on hundreds of samples, approximately 40 percent of ballast along the railroad tracks in the line<br />
segment contains arsenic concentrations of at least 120 milligrams per kilogram (mg/kg), with levels up<br />
to 323 mg/kg detected. For the shallow soil underlying the ballast, approximately 40 percent of samples<br />
contain arsenic concentrations of at least 80 mg/kg. Arsenic concentrations in shallow soil adjacent to<br />
(not under) the ballast are even lower, with concentrations typically around 50 mg/kg. At the future<br />
101248 – <strong>Appendix</strong> C – July 2008 Page 4
Ecological Risk Assessment<br />
Contaminant Management Plan, SVRT/BART Extension<br />
maintenance facility, arsenic was detected in 25 of the 50 samples, at concentrations averaging 18.4<br />
mg/kg and not exceeding 57 mg/kg. Arsenic levels in station/station campus locations off the former<br />
UP railroad tracks are expected to be substantially lower, near naturally-occurring background levels<br />
below 10 mg/kg.<br />
Lead concentrations in ballast along the line segment exceed 20 mg/kg approximately half the time,<br />
with levels up to 599 mg/kg detected. Lead levels in soil along the line segment were typically less than<br />
10 mg/kg, though this level was often exceeded, especially in shallow soil immediately beneath the<br />
ballast. Near intersections with major roadways, where aerially deposited lead could be expected, lead<br />
levels were greater than 50 mg/kg about half the time. At the future maintenance facility, lead<br />
concentrations appear greater than along the line segment. Lead was detected in each of 71 samples, at<br />
concentrations averaging 190.9 mg/kg, though the average concentration was 65.5 mg/kg if three<br />
locations with lead levels above 1,000 mg/kg are excluded. Lead levels in station/station campus<br />
locations off the railroad tracks are expected to be substantially lower, near naturally-occurring<br />
background levels below 10 mg/kg.<br />
TPH is relatively widespread in the project area, particularly along the former railroad tracks in the line<br />
segment and the maintenance facility yard. However, TPH concentrations are generally quite limited.<br />
Along the line segment, Earth Tech performed analyses for total extractable petroleum hydrocarbons<br />
(TEPH, all relatively low volatility petroleum hydrocarbons with between 10 and 34 carbons) in 37<br />
locations, with TEPH detected in 13 of the locations. The average detected concentration was 11.6<br />
mg/kg, and the maximum detected concentration was 34.6 mg/kg. TPH concentrations in the<br />
maintenance facility area (Newhall Yard) are known to be higher than along the line segment.<br />
Excluding known hot spots such as the locomotive refueling area, 53 analyses were run for TPH as<br />
motor oil, with 37 detections, at an average detected concentration of 367 mg/kg. TPH levels in<br />
station/station campus locations off the railroad tracks are expected to be lower than either the line<br />
segment or the maintenance facility yard.<br />
Other inorganic compounds do not appear to be present consistently at levels above background levels.<br />
Other organic chemicals, such as pesticides and volatile organic compounds (VOCs), have only been<br />
detected intermittently, and at relatively low levels.<br />
101248 – <strong>Appendix</strong> C – July 2008 Page 5
2.3.2 Contaminant Mobility<br />
Ecological Risk Assessment<br />
Contaminant Management Plan, SVRT/BART Extension<br />
The physical/chemical characteristics of the chemicals of primary concern (arsenic, lead and TPH)<br />
suggest that these chemicals are unlikely to migrate significantly outside the project ROW.<br />
Metals present in site materials are generally adsorbed to or physically an integral component of site<br />
materials. The slag from smelting contains lead and arsenic which are physical components of the slag,<br />
in the sense that they are integrated within the matrix of the slag material. Metals are leached from the<br />
slag by surface water, and carried in a dissolved form. The degree to which metals are carried by water<br />
or bound to soil and sediment is largely a function of the oxidation state of the metal and its interaction<br />
with other substances present in soil. Because of the limited solubilities and ionic states of lead and<br />
arsenic, these dissolved metals are quickly adsorbed onto soil or sediments, limiting their downward<br />
migration (though they will intermittently desorb and be carried deeper by infiltrating surface water<br />
before resorbing). Metals can also be carried laterally in surface water runoff in either dissolved form<br />
or adsorbed to sediment particles; although the ballast and rail tracks are elevated, the surrounding land<br />
is flat, which lessens the potential for significant lateral migration of metals.<br />
TPH is somewhat more mobile than metals, particularly the lower molecular weight, more soluble<br />
components. However, the TPH on site is primarily higher molecular weight.<br />
3.0 SCREENING-LEVEL PROBLEM FORMULATION<br />
3.1 KEY ECOLOGICAL RECEPTORS<br />
This section identifies means by which the ecological receptors (inhabitants of biological communities,<br />
including but not limited to special status species) described in Sections 2.1 and 2.2 may contact the<br />
chemicals of potential concern described in Section 2.3.<br />
Ecological receptors within the SVRT project area are primarily located along the former UP ROW,<br />
since other areas of the SVRT project alignment are even more disturbed than the ROW. After<br />
completion of the SVRT, the SVRT tracks will pass through riparian forest, grasslands, and surface<br />
water bodies/wetlands such as creeks, not just disturbed land. Ecological receptors will be located<br />
within each of these three habitats, and special status species have the potential to be located within<br />
each of these habitats. However, in terms of habitat complexity and the numbers of special status<br />
species that may be present, the wetlands and associated riparian forest are more critical habitat than the<br />
grasslands.<br />
101248 – <strong>Appendix</strong> C – July 2008 Page 6
Ecological Risk Assessment<br />
Contaminant Management Plan, SVRT/BART Extension<br />
The chemicals of potential concern (Section 2.3) are believed to have greater ecotoxicity for animal<br />
receptors (including mammals, birds, amphibians and fish) than for plant receptors. This is for two<br />
primary reasons:<br />
• Their more complex biological structures make animals generally less resistant than plants to<br />
the ecotoxicity of natural soil components such as arsenic and lead; and<br />
• Animals bioaccumulate toxic chemicals to a much greater degree than do plants.<br />
It should be noted that the special status species identified in Section 2.2 represent carnivorous species.<br />
Although herbivorous and granivorous species are not represented, bioaccumulation of chemicals such<br />
as arsenic and lead up the food chain towards carnivores make them sensitive species. As a result, this<br />
ecological risk assessment will focus on animals, particularly predatory animals, which are expected to<br />
feel the greatest effects of bioaccumulation.<br />
There are 12 special status animal species listed in the “aquatic or amphibious species” and “winged<br />
predatory species” categories in Section 2.2. This ecological risk assessment will consider these species<br />
to be the key ecological receptors, because:<br />
• They are all considered to be species of special concern, and thus receive greater protection;<br />
• They may be present in each of the habitats under consideration, and thus provide a good proxy<br />
for the health of each habitat; and<br />
• 11 of the 12 animal special status species are predatory, and thus are sensitive indicators of<br />
bioaccumulation in the food chain.<br />
3.2 COMPLETE EXPOSURE PATHWAYS<br />
3.2.1 Exposure Routes<br />
There are different possible exposure routes through which the different types of key receptors may be<br />
exposed to contaminants. These are discussed below.<br />
3.2.1.1 Exposure Routes for Aquatic and Amphibious Species<br />
For the four aquatic and amphibious species, possible exposure routes include:<br />
• ingestion and dermal contact with sediment and water; and<br />
• ingestion of contaminated food.<br />
Direct contact with contaminated material by an aquatic or amphibious species will require that the<br />
contaminants be transported from the SVRT site to the aquatic habitat (hereafter called a creek because<br />
101248 – <strong>Appendix</strong> C – July 2008 Page 7
Ecological Risk Assessment<br />
Contaminant Management Plan, SVRT/BART Extension<br />
of the prevalence of creeks along the project alignment). If contaminants are not transported to a creek,<br />
the potential exposure pathways listed above will not be complete, and exposure will not occur. Due to<br />
the limited solubility of the contaminants, and their limited potential for lateral migration, impact from<br />
the SVRT site on either the water or the sediment in nearby creeks is not expected to be significant.<br />
3.2.1.2 Exposure Routes for Winged Predatory Species<br />
For the eight winged predatory species, possible exposure routes include:<br />
• inhalation of contaminated dusts or vapors;<br />
• ingestion of contaminated prey; and<br />
• dermal absorption after direct contact between the skin and contaminated material.<br />
Inhalation of contaminated dusts or vapors could be a significant concern for the winged predatory<br />
species if sources of contaminated dusts or vapors were near where the individuals spend significant<br />
amounts of time, the nesting areas of the species. Generally, sources of dusts or vapors further from the<br />
nesting areas would result in significantly less exposure due to attenuation near nests and significantly<br />
lower exposure duration in areas further from the nest. At this site, exposure would tend to be to dusts,<br />
given the physical characteristics of the chemicals of potential concern.<br />
If predators take prey from the contaminated areas of the SVRT site, then exposure to site contaminants<br />
may occur. However, most if not all of the winged predatory species of special concern cover a<br />
significant range, which would tend to dilute contaminated prey with prey captured outside the SVRT<br />
project area. Ingestion of contaminated soil may also occur during cleaning of feathers, though the<br />
amount of SVRT soil ingested during preening is likely to be very small, and thus the incidental<br />
ingestion pathway is not expected to result in significant exposure.<br />
Dermal absorption is not expected to be a significant exposure pathway for the winged predatory<br />
species of concern. The birds are covered with feathers, which tends to limit dermal exposure through<br />
the prevention of direct dermal contact. Although bats do not have feathers, they tend to spend the vast<br />
majority of their time airborne or perched above the ground surface, which reduces the potential for<br />
dermal exposure.<br />
3.2.1.3 Summary of Exposure Routes<br />
In summary, the most realistic routes for exposure to contaminated material are:<br />
101248 – <strong>Appendix</strong> C – July 2008 Page 8
Ecological Risk Assessment<br />
Contaminant Management Plan, SVRT/BART Extension<br />
• Aquatic and amphibious species: direct contact with contaminated sediments, and ingestion of<br />
contaminated food and sediments.<br />
• Winged predatory species: inhalation of contaminated dusts near nests, and ingestion of<br />
contaminated prey.<br />
3.2.2 Exposure Pathways<br />
To be complete, an exposure pathway requires both an exposure route and a mechanism which moves<br />
the either the receptor or a chemical into a location where it can be exposed to the contaminant.<br />
This section identifies potential exposure pathways and evaluates the extent to which they may be<br />
considered complete by evaluating contaminant transport mechanisms. In order to complete an exposure<br />
pathway which would lead to one of the most realistic exposure routes listed in Section 3.2.1.3, the<br />
transport mechanisms described below would be necessary.<br />
3.2.2.1 Exposure Pathways for Aquatic and Amphibious Species<br />
For aquatic and amphibious species to have direct contact with contaminated sediments, site-related<br />
chemicals would have to be transported into the aquatic environment. Due to the low solubility of site-<br />
related chemicals, this would be most likely to occur through the physical action of surface water<br />
bringing contaminated soil into suspension (such as via small-scale erosion caused by storm water<br />
runoff), and then flowing downhill to a creek where the contaminated sediment could be deposited. It is<br />
also possible that high winds could pick up soil as dust and deposit it in a creek. Only in these<br />
circumstances would an exposure pathway leading to direct contact with contaminated sediment be<br />
completed. In either case, the contaminated media would have started its transport from the ground<br />
surface, relatively near a creek.<br />
Ingestion of contaminated food could occur if the food is affected by contaminated stream sediments or<br />
through ingestion of contaminated prey. The mechanism which would cause contaminated stream<br />
sediments is the same as that discussed in the prior paragraph for sediment. Two separate transport<br />
mechanisms are possible for ingestion of contaminated prey:<br />
• Prey species such as insects and small mammals could ingest contaminated soil or plant<br />
material, and then be ingested. It is also possible that such prey species living beyond the<br />
hunting range of the aquatic species could ingest contaminated site material, and then move to<br />
the hunting range and become ingested.<br />
101248 – <strong>Appendix</strong> C – July 2008 Page 9
Ecological Risk Assessment<br />
Contaminant Management Plan, SVRT/BART Extension<br />
• An amphibious receptor, such as a frog or a turtle, could move out of the creek and ingest<br />
animal or vegetable matter that has been contaminated by contact with site-impacted media. It<br />
should be noted that amphibious receptors are likely to limit their foraging to within a relatively<br />
short distance from their water source.<br />
In summary, ingestion of contaminated prey could result from the presence of contaminated surface or<br />
near-surface soil near a creek.<br />
3.2.2.2 Exposure Pathways for Winged Predatory Species<br />
Winged predatory species would only inhale contaminated material from the air around their nests if it<br />
were mobilized as dust by high winds. To represent a significant exposure pathway, the generation of<br />
dust would have to take place near the nests. For most of the winged predatory species of special<br />
concern listed above, nests within the project area would be located within riparian habitats near creek<br />
banks. Only the burrowing owl (which has not been observed in the project area) and the loggerhead<br />
shrike (which has) would be expected to nest in open areas. Thus, based on the nesting habits of the<br />
winged predatory species of special concern identified at this site, exposure via inhalation of dust<br />
generated from surface soils is of concern primarily in the riparian cottonwood-sycamore forest near<br />
creek banks.<br />
The ingestion of contaminated prey by winged predatory species could realistically include surface<br />
dwelling prey such as insects, and near-surface species such as earthworms, and rodents. If these prey<br />
species were in contact with contaminated surface or subsurface site soil, then the pathway between<br />
contaminated site soil and winged predatory species may be considered complete. Winged predatory<br />
species would be expected to have access to prey species at any location along the project alignment.<br />
3.2.3 Summary of Complete Exposure Pathways<br />
Considering both exposure routes and contaminant transport mechanisms, the following potential<br />
exposure pathways are considered to be complete for the purpose of this assessment:<br />
• For aquatic and amphibious species, direct contact with or ingestion of contaminated sediments<br />
carried to a creek by runoff from nearby surface site soil.<br />
• For aquatic and amphibious species, ingestion of mobile prey that are contaminated by surface<br />
or subsurface soil near a creek and then moves to the creek.<br />
• For amphibious species, ingestion of prey contaminated by surface or subsurface soil near a<br />
creek.<br />
• For winged predatory species, inhalation of contaminated airborne dust generated from<br />
contaminated surface soil near riparian forest along a creek.<br />
101248 – <strong>Appendix</strong> C – July 2008 Page 10
Ecological Risk Assessment<br />
Contaminant Management Plan, SVRT/BART Extension<br />
• For winged predatory species, ingestion of prey contaminated by surface or subsurface soil<br />
anywhere along the project alignment.<br />
4.0 ECOLOGICAL PROTECTION<br />
Ecological protection will focus on preventing exposure of species of special concern or other<br />
ecological receptors in the habitats of concern. Because most potentially complete exposure pathways<br />
involve surface or near-surface soil near a creek, exposure minimization measures will focus on<br />
reducing the presence of contaminated material at the surface or near-surface in areas of the site near<br />
creeks.<br />
4.1 CHEMICAL-SPECIFIC ECOLOGICAL SCREENING LEVELS<br />
In determining reuse criteria for soil/fill near surface water boundaries, Earth Tech assumed that<br />
chemical levels in soil near a creek could translate into the same chemical levels in creek sediments.<br />
Thus, sediment levels developed to safeguard aquatic habitats can be applied to site soils. Sediment<br />
quality benchmarks for specific chemicals were obtained from Table 3 of the Cal/EPA Regional Water<br />
Quality Control Board San Francisco Bay Region’s Staff Report, Ambient Concentrations of Toxic<br />
Chemicals in San Francisco Bay Sediments (RWQCB, 1998). These benchmarks, called effects ranges<br />
(ER) for potential toxic effects in sediments, were developed by Dr. Long of the National Oceanic and<br />
Atmospheric Administration (NOAA) (Long et al, 1995).<br />
The ER benchmarks were developed to identify concentrations of contaminants that were associated<br />
with biological effects in laboratory, field or modeling studies. They were derived from a large<br />
database spanning hundreds of data points, taken from numerous projects across the country. The ER-L<br />
(effects range-low) value is the concentration equivalent to the lower 10 th percentile of the compiled<br />
study data, while the ER-M (effects range-median) is the concentration equivalent to the 50 th percentile<br />
of the compiled study data. These benchmarks are generally interpreted as follows: sediment<br />
concentrations below the ER-L are “rarely” associated with adverse effects, sediment concentrations<br />
between the ER-L and the ER-M are “occasionally” associated with adverse effects, and sediment<br />
concentrations above the ER-M are “frequently” associated with adverse effects.<br />
The ER-L and ER-M for chemicals of potential concern are presented in Table C-1.<br />
101248 – <strong>Appendix</strong> C – July 2008 Page 11
4.2 ECOLOGICAL PROTECTION MEASURES<br />
Ecological Risk Assessment<br />
Contaminant Management Plan, SVRT/BART Extension<br />
This screening level ecological risk assessment has been prepared in order to identify potential risks to<br />
ecological receptors and to allow selection of protective measures which will substantially reduce the<br />
risks of chemical exposure by ecological receptors. Appropriate ecological protection measures are<br />
described herein.<br />
Most complete exposure pathways, and thus most potential risks to ecological receptors, involve<br />
contaminated surface or near-surface soil near a creek, surface waters, or other aquatic habitat. Thus,<br />
the focus of ecological protection measures will be on reducing the presence of contaminated material at<br />
the surface or near-surface of areas near creeks.<br />
The attached Contaminant Management Plan text identifies Migration Potential Zones (MPZs) as areas<br />
where reuse of impacted soil or ballast will be restricted due to the proximity of groundwater or surface<br />
waters. In order to protect ecological receptors, materials containing contaminant levels greater than the<br />
ER-M thresholds will not be used within an MPZ. In order to simplify the process of contaminated soil<br />
reuse, the Contaminant Management Plan will use the more-restrictive requirement that materials<br />
unable to meet the standards for unrestricted on-site or off-site reuse will not be used within an MPZ.<br />
101248 – <strong>Appendix</strong> C – July 2008 Page 12
RWQCB ESL for<br />
Groundwater<br />
Protection, Residential,<br />
Shallow Soil, Drinking<br />
Water Resource a<br />
RWQCB<br />
Sediment<br />
ER-L d<br />
(dry weight)<br />
NOAA<br />
SQuiRT<br />
Conservative<br />
Value e<br />
Ecological Risk Assessment<br />
Contaminant Management Plan, SVRT/BART Extension<br />
Background Value<br />
Resulting Ecological<br />
Screening Value<br />
Arsenic N/A 8.2 5.9 4<br />
5.5 f<br />
5.9<br />
Lead N/A 46.7 30.24 5<br />
16.1 f<br />
30.24<br />
Benzene 0.044 N/A N/A 0.0 0.044<br />
TPH-Gasoline 100 N/A N/A 0.0 100<br />
TPH-Diesel (middle distillates) 100 N/A N/A 0.0 100<br />
TPH-Oil (residual fuels) 1,000 N/A N/A 0.0 1,000<br />
PCE 0.7 N/A 0.057 6<br />
0.0 0.057<br />
TCE 0.46 N/A 0.041 6<br />
0.0 0.041<br />
DDT 4.3 0.00158 7<br />
0.00389 5<br />
0.0 0.00158<br />
Arochlor 1260 6.3 3<br />
0.0227 3<br />
3, 5<br />
0.02155 0.0 0.0255<br />
Benzo (a) pyrene 130 0.43 0.0319 4<br />
0.0 0.0319<br />
Notes:<br />
Chemical<br />
Table C-1 – Ecological Screening Values<br />
All concentrations are in mg/kg unless otherwise noted. DDT Dichlorodiphenyltrichloroethane<br />
1<br />
Arsenic PRG is the cancer endpoint. ESL Environmental Screening Level<br />
2<br />
Lead "CAL-Modified PRG", non-standard method applied. ER-L Effects Range - Low<br />
3<br />
Value for total PCBs used. mg/kg Milligrams per Kilogram<br />
4<br />
Freshwater Sediment TEL. mg/L Milligrams per Liter<br />
5<br />
Marine Sediment TEL. N/A Not Applicable<br />
6<br />
Marine Sediment AET. NOAA National Oceanographic and Atmospheric Administration<br />
7<br />
DDTs, total of 6 isomers. PCB Polychlorinated Biphenyl<br />
PCE Tetrachloroethylene<br />
a<br />
San Francisco Bay RWQCB, 2003. July 2003 Update to<br />
RWQCB Regional Water Quality Control Board<br />
Environmental Screening Levels Technical Document . July 21.<br />
SQuiRT Screening Quick Reference Tables<br />
b<br />
EPA, 2002. EPA Region 9 PRGs Table . October 1. Edited February 2003. TCE Trichloroethylene<br />
c<br />
California Code of Regulations, Title 22, Section 66261. TPH Total Petroleum Hydrocarbons<br />
d<br />
San Francisco Bay RWQCB, 1998. Ambient Concentrations of<br />
Toxic Chemicals in San Francisco Bay Sediments . May.<br />
e<br />
NOAA, 1999. Screening Quick Reference Tables (SQuiRTs) . September.<br />
US EPA United States Environmental Protection Agency<br />
101248 – <strong>Appendix</strong> C – July 2008 Page 13
Ecological Risk Assessment<br />
Contaminant Management Plan, SVRT/BART Extension<br />
MPZs are defined as areas within 50 feet of creeks, wetlands or other surface water drainage features,<br />
or within 5 feet of the groundwater table. Based on the relatively flat land surface in the project area, a<br />
distance of 50 feet is a reasonable buffer between the edge of the MPZ and the edge of a creek or other<br />
aquatic habitat, and thus between ecological receptors and significant contaminant exposure.<br />
Actions are also appropriate to address exposure by potential receptors not in aquatic habitats or<br />
riparian forest, though there are fewer complete exposure pathways for special status species outside the<br />
aquatic or riparian habitats. The attached Contaminant Management Plan text identifies chemical levels<br />
above which contaminated soil must be encapsulated. These provide ecological receptors in grasslands<br />
or ruderal habitats with an additional level of protection.<br />
101248 – <strong>Appendix</strong> C – July 2008 Page 14
5.0 REFERENCES<br />
Ecological Risk Assessment<br />
Contaminant Management Plan, SVRT/BART Extension<br />
Earth Tech. 2002a. UPRR Alignment Investigation Data for BART Extension to San Jose, Fremont /<br />
Milpitas / San Jose CA. Draft, March.<br />
________. 2002b. UPRR Alignment Environmental Impacts Summary for BART Extension to San Jose,<br />
Fremont / Milpitas / San Jose, California. Draft, May.<br />
________. 2003a. Phase II Investigation Data Summary Report for UPRR Newhall Yard, San<br />
Jose/Santa Clara, California. Draft, February.<br />
________. 2003b. Additional Investigation Data Summary Report for UPRR Newhall Yard, San<br />
Jose/Santa Clara, California. Draft, July.<br />
Long, Edward, D. Donald MacDonald, Sherri L. Smith, and Fred D. Calder. 1995. Incidence of Adverse<br />
Biological Effects Within Ranges of Chemical Concentrations in Marine and Estuarine<br />
Sediments, in Journal of Environmental Management, Volume 19(1), pages 81-97.<br />
Jones & Stokes. 2004. Preactive Survey for Special-Status Plants and Wildlife along the Silicon Rapid<br />
Transit Corridor from Station 0+00 to 570+00. August 17.<br />
Parsons Corporation. 2003. Biological and Wetlands Resources Technical Report. August.<br />
Santa Clara Valley Transportation Authority. 2004. BART Extension to Milpitas, San Jose and Santa<br />
Clara, Draft Environmental Impact Statement / Environmental Impact Report & Draft 4(f)<br />
Evaluation. Draft, March.<br />
San Francisco Regional Water Quality Control Board (RWQCB). 1998. Staff Report, Ambient<br />
Concentrations of Toxic Chemicals in San Francisco Bay Sediments. May.<br />
________. 2003. Screening For Environmental Concerns at Sites With Contaminated Soil and<br />
Groundwater. Volume 2. Background <strong>Documentation</strong> for the Development of Tier 1<br />
Environmental Screening Levels. July.<br />
United States Environmental Protection Agency, Office of Solid Waste and Emergency Response.<br />
1997. Ecological Risk Assessment Guidance for Superfund: Process for Designing and<br />
Conducting Ecological Risk Assessments – Interim Final. Interim Final, July.<br />
101248 – <strong>Appendix</strong> C – July 2008 Page 15
Methodology for Modifying ESLs for Metals<br />
Contaminant Management Plan, SVRT/BART Extension<br />
METHODOLOGY FOR DETERMINING SITE-SPECIFIC ENVIRONMENTAL<br />
SCREENING LEVELS FOR METALS<br />
The dilution attenuation factor (DAF) for metals will be determined in two-step process. First, the<br />
correlation between total and soluble metal will be estimated. This will allow a determination of the<br />
site-specific solubility of each chemical of concern (COC), and provide an estimate of the concentration<br />
of that metal in the soil solution as a function of its total concentration in soil. This step will require<br />
the use of a test to simulate the soil leaching process. The second step will account for the dilution that<br />
occurs after the COC in the soil solution mixes with the groundwater. This step will require the<br />
estimation of soil infiltration rates and groundwater flow rates that are representative of the site.<br />
To achieve the first step, an extraction procedure will be used to determine the correlation between total<br />
and dissolved metal. As recommended in the Environmental Screening Level (ESL) guidance<br />
document produced by the Regional Water Quality Control Board, San Francisco Bay Region<br />
(RWQCB), a procedure such as the Synthetic Precipitation Leaching Procedure or the Waste Extraction<br />
Test (WET) modified to use deionized (DI) water will be used (RWQCB, 2005). The results will be<br />
multiplied by the dilution factor used for the test to yield the soluble concentration of metal. Soils<br />
representing a range of total metal levels will be tested, and the results will be plotted to obtain of best-<br />
fit correlation between total and soluble metal concentrations. This relationship will be used to obtain<br />
the soluble metal level of a soil which corresponds to a given total metal level. In turn, the soluble<br />
metal level can be used in a simple model such as the Summers Model to estimate the concentration in<br />
groundwater corresponding to a given concentration in soil.<br />
The Summer’s Model is given below:<br />
Cgw = [(Qp x Cp) + (Qa x Ca)] / Qp + Qa (U.S.EPA, 1989)<br />
Where:<br />
day<br />
Cgw = final concentration in groundwater (milligrams per liter [mg/L])<br />
Qp = volumetric flux of water through the vadose zone (meters per square meter per<br />
[m/m 2 -day])<br />
101248 – <strong>Appendix</strong> D – July 2008 Page 1
(mg/L)<br />
Methodology for Modifying ESLs for Metals<br />
Contaminant Management Plan, SVRT/BART Extension<br />
Cp = concentration of the chemical in the vadose zone soil pore water (leachate)<br />
Qa = volumetric groundwater flux (m/m 2 -day)<br />
Ca = concentration already in groundwater (mg/L)<br />
With the relationship between the total and groundwater concentrations (i.e., DAF), the concentration<br />
of total metal in a soil that corresponds to a given concentration (e.g. the Maximum Contaminant Level<br />
or an ESL to protect aquatic wildlife) can be calculated and used to establish reuse criteria if the<br />
situation at the site warrants.<br />
The approach described above is directly applicable to the soil/groundwater pathway. However, the<br />
soil/surface water pathway is more complicated. This involves a combination of infiltration and surface<br />
runoff, and is further complicated by the more variable rates of stream flow throughout the year. As a<br />
practical solution to this problem, if and when a DAF for surface water is needed, the value calculated<br />
for the groundwater case described above may be used for surface water. This is expected to provide a<br />
conservative estimate for surface water protection because the times during which infiltration and runoff<br />
are expected to occur are also the times of maximum stream velocity, and this velocity is expected to<br />
greatly exceed that of the groundwater. Thus, DAFs for the surface water scenario are expected to<br />
greatly exceed those for the groundwater scenario. For this reason, the DAF for groundwater is<br />
expected to significantly underestimate that for surface water, and thus provide a large safety factor.<br />
Example of Site-Specific ESL Modification for Arsenic:<br />
As described above, the first step is to determine the relationship between the total and soluble<br />
concentrations of arsenic for a range of soil representing arsenic levels likely to be encountered during<br />
the project. For the following example, representative samples were selected from along the SVRT<br />
Line Segment portion of the project based on arsenic concentrations and locations along and within the<br />
alignment, including proximity to the ballast within the right-of-way. These soil samples were initially<br />
collected in September 2004 and October 2004 during the preliminary engineering phase and analyzed<br />
for total arsenic (Earth Tech, 2005). These soil samples were subsequently extracted using the WET<br />
test modified with DI water, and the results are presented in Table D-1.<br />
101248 – <strong>Appendix</strong> D – July 2008 Page 2
Methodology for Modifying ESLs for Metals<br />
Contaminant Management Plan, SVRT/BART Extension<br />
Based on the arsenic DI Wet Results presented in Table D-1, the relationship between total and soluble<br />
arsenic is plotted in Figure D-1, along with the equation that represents a best-fit relationship between<br />
the two. Note that of the ten paired data points, one appeared to be inconsistent with the rest (330<br />
mg/kg total arsenic, and less than 0.04 mg/L soluble arsenic), and was therefore not included in the<br />
graph.<br />
101248 – <strong>Appendix</strong> D – July 2008 Page 3
Methodology for Modifying ESLs for Metals<br />
Contaminant Management Plan, SVRT/BART Extension<br />
Table D-1 - Summary of Site-Specific (SVRT Line Segment) Arsenic DI WET Results<br />
Sample ID<br />
Depth<br />
(feet bgs)<br />
Sample<br />
Collection Date<br />
Total As<br />
(mg/kg)<br />
PESS-11-3 3-3.5 10/11/04 190 1.8<br />
PESS-13-2 2-2.5 10/11/04 300 11<br />
PESS-14-1.5 1.5-2 10/01/04 420 11<br />
DI WET Result<br />
(mg/L) Comments<br />
PESS-15-0 0-0.5 10/01/04 330 0.04 see Note 1 and 2<br />
PESS-17-2 2-2.5 10/01/04 22 0.04 see Note 2<br />
PESB-09-5 5-5.5 10/01/04 100 0.04 see Note 2<br />
PESS-18-1.5 1.5-2 10/01/04 33 0.04 see Note 2<br />
PESS-26-0 0-0.5 09/17/04 150 2.5<br />
PESB-11-0 0-.05 10/16/04 85 0.04 see Note 2<br />
PESB-02-0 0-0.5 09/03/04 11 0.04 see Note 2<br />
Notes:<br />
bgs = below ground surface<br />
mg/kg = milligrams per kilogram<br />
1. The data for PESS-15-0 (total arsenic concentration of 330 mg/kg and soluble concentration of<br />
Soluble Arsenic (mg/L)<br />
Methodology for Modifying ESLs for Metals<br />
Contaminant Management Plan, SVRT/BART Extension<br />
Figure D-1 - Site-Specific (SVRT Line Segment) Solubility of Arsenic<br />
40.0<br />
35.0<br />
30.0<br />
25.0<br />
20.0<br />
15.0<br />
10.0<br />
5.0<br />
0.0<br />
Solubility of Site Arsenic<br />
y = 0.0285e 0.017x<br />
0 100 200 300 400 500<br />
Total Arsenic (mg/kg)<br />
Next, to use the Summer’s Model, the volumetric flow through the vadose zone (Qp) is calculated as<br />
follows:<br />
Qp = Vinf x A x eff<br />
Where:<br />
Vinf = vertical infiltration rate of dissolved metal (m/day)<br />
A = area of source (m 2 )<br />
ηeff = effective porosity (unitless)<br />
For the purpose of this example, the value for Vinf is assumed to be equal to the rainfall rate for the<br />
City of San Jose, adjusted for a typical runoff of 30 percent as recommended by Caltrans for a rail yard<br />
(Caltrans Highway Design Manual, 2005). Average daily precipitation data were obtained from the<br />
University of California Integrated Pest Management Program (www.ipm.ucdavis.edu/caludt.cgi/) for<br />
the period from 1951 to the present. Since infiltration can be expected to occur only during rainfall<br />
101248 – <strong>Appendix</strong> D – July 2008 Page 5
Methodology for Modifying ESLs for Metals<br />
Contaminant Management Plan, SVRT/BART Extension<br />
event, the average daily rainfall was totaled for the period where daily rainfall exceeded 0.05 inches.<br />
Corrected for 30 percent runoff, the calculated rate becomes 1.81E-06 centimeters per second (cm/s).<br />
For the purpose of this example, the average area is assumed to be equal to the typical width of the<br />
right-of-way (60 feet); and, for simplicity, is assumed to be a square. Thus the area used for these<br />
calculations is 3,600 ft 2 (334 m 2 ).<br />
The value used for ηeff was estimated based on the soil types logged along the Line Segment during<br />
environmental investigations that were conducted during the preliminary engineering phase (Earth<br />
Tech, 2005). The value used for ηeff is 0.32, which is the value recommended by Ghislain (1986) for<br />
silty clay soils.<br />
The value used for Qa in the Summer’s Model is calculated as follows:<br />
Qa = Vgw x W x L<br />
Where:<br />
Vgw = average groundwater velocity (m/day)<br />
W = width of reuse area perpendicular to the flow of groundwater (m)<br />
L = thickness of aquifer (m)<br />
Vgw was estimated using the standard Darcy approach, as follows:<br />
Vgw =<br />
Where:<br />
K x i<br />
η<br />
eff<br />
K = hydraulic conductivity (cm/s)<br />
i = hydraulic gradient (ft/ft)<br />
ηeff = effective porosity (unitless)<br />
The values for these three parameters were obtained as follows:<br />
101248 – <strong>Appendix</strong> D – July 2008 Page 6
• The value of ηeff (0.32) was estimated as described above.<br />
Methodology for Modifying ESLs for Metals<br />
Contaminant Management Plan, SVRT/BART Extension<br />
• The values for K were obtained from aquifer tests performed at three areas (Kato Road,<br />
Montague Expressway, and Hostetter Road) along the Line Segment (Earth Tech, 2005). The<br />
calculated values for K ranged over an order of magnitude: from 0.036 gallons per minute<br />
gallons per minute per square foot (gpm/ft 2 ) (2.44E-03 cm/s) at Kato Road, to 0.32 gpm/ft 2<br />
(2.17E-02 cm/s) at Hostetter Road. For this reason, an average value (1.21E-02 cm/s) was<br />
used to estimate the reuse values.<br />
• Values for the hydraulic gradient were obtained from reports available for sites where there has<br />
been groundwater monitoring and/or remediation conducted near the Line Segment. The<br />
hydraulic gradient values were more consistent than the K values, with values of approximately<br />
0.007 ft/ft near Kato Road (Shaw, 2004), 0.008 ft/ft near Montague Expressway/Capitol<br />
Avenue (Levine-Fricke, 2005), and 0.007 near Hostetter Road (ETIC, 2001). Based on these<br />
values, a value of 0.007 was used for this example.<br />
The value for L was also obtained from the aquifer tests performed at three areas (Kato Road,<br />
Montague Expressway, and Hostetter Road) along the Line Segment (Earth Tech, 2005). Aquifer<br />
thickness was estimated to range from about 50 to 60 feet. For the purpose of this example, the value<br />
for aquifer thickness was conservatively assumed to be 50 feet (15.24 m)<br />
Finally, the combination of the Summer’s Model and the solubility relationships was used to solve for<br />
the total concentration in soil corresponding to a target groundwater concentration. This concentration<br />
will depend on the situation encountered in the field. If the situation is a portion of the site which is 5<br />
feet or less to groundwater, then the target concentration may be the Maximum Contaminant Level to<br />
protect groundwater for the purpose of drinking. For arsenic, this is 50 µg/L. However, if the<br />
situation is reuse in an area within 50 feet of a surface water body, then the target may be the surface<br />
water ESL to protect freshwater aquatic life. For arsenic, this is 150 µg/L (RWQCB, 2005).<br />
The Summer’s Model, now set up to represent conditions that are likely to be typical of the project site,<br />
can be used to calculate the soluble concentration of arsenic that will correspond to the endpoint<br />
concentrations described above. The relationship displayed in Figure D-1 can then be used to estimate<br />
the concentration of total arsenic corresponding to the soluble level calculated in the Summer’s Model.<br />
101248 – <strong>Appendix</strong> D – July 2008 Page 7
Based on the above example, the calculated results are provided in Table D-2.<br />
Methodology for Modifying ESLs for Metals<br />
Contaminant Management Plan, SVRT/BART Extension<br />
101248 – <strong>Appendix</strong> D – July 2008 Page 8
Methodology for Modifying ESLs for Metals<br />
Contaminant Management Plan, SVRT/BART Extension<br />
Table D-2 – Calculated Site-Specific Arsenic Reuse Values<br />
Permeability<br />
Reuse Goal 1.21E-02 cm/s<br />
Protect Drinking Water<br />
(50 µg/L)<br />
Protect Aquatic Habitat<br />
(150 µg/L)<br />
Notes:<br />
cm/s = centimeters per second<br />
mg/kg = milligrams per kilogram<br />
µg/L = micrograms per liter<br />
REFERENCES:<br />
298 mg/kg<br />
364 mg/kg<br />
California Department of Transportation (Caltrans), 2001. Highway Design Manual, Table 819.2B.<br />
May 1.<br />
Earth Tech, 2005. Draft Silicon Valley Rapid Transit Project, Line Segment <strong>Hazardous</strong> <strong>Materials</strong><br />
Characterization. March 18.<br />
ETIC, 2001. Remediation System Evaluation Report, Former Exxon Retail Site 7-3664, 1898 North<br />
Capitol Ave., San Jose, CA. September.<br />
Ghislain, Marsily, 1986. Quantitative Hydrogeology: Groundwater Hydrogeology for Engineers.<br />
Translated by Gunilla de Marsily.<br />
Levine-Fricke, 2005. Combined Quarterly NPDES Monitoring Report for 11/1/04 through 1/31/05 and<br />
Semiannual Groundwater Monitoring Report for 8/1/04 through 1/31/05, JCI JonesCchemicals Facility,<br />
985 Montague Expwy, Milpitas, CA. February 28.<br />
Regional Water Quality Control Board, San Francisco Bay Region (RWQCB) 2005. Screening For<br />
Environmental Concerns at Sites With Contaminated Soil and Groundwater. Volume 2. Background<br />
<strong>Documentation</strong> for the Development of Tier 1 Environmental Screening Levels. February.<br />
101248 – <strong>Appendix</strong> D – July 2008 Page 9
Methodology for Modifying ESLs for Metals<br />
Contaminant Management Plan, SVRT/BART Extension<br />
Shaw Environmental, 2004. First Half 2004 Semi-Annual Groundwater Monitoring Report, Scott<br />
Creek Business Park, 48870 Kato Road, Fremont, CA. August.<br />
U.S. EPA. 1989. Determining Soil Response Action Levels Based on Potential Contaminant Migration<br />
to Groundwater: A Compendium of Examples. EPA/540/2-89/057. October.<br />
101248 – <strong>Appendix</strong> D – July 2008 Page 10
This page intentionally left blank.
SITE MANAGEMENT PLAN<br />
Former Ford Automobile Assembly Plant<br />
Formerly 1100 South Main Street<br />
Milpitas, California<br />
Prepared for<br />
Ford Motor Land Development Corporation<br />
One Parklane Boulevard<br />
Dearborn, Michigan 48120<br />
March 1997<br />
Project No. 3341.01K<br />
Geomatrix Consultants<br />
GEOMATRIX
f<br />
i<br />
TABLE OF CONTENTS<br />
GEOMATHIX<br />
Eagc<br />
1 0 INTRODUCTION 1<br />
2.0 BACKGROUND t 2<br />
21 PROPERTY DESCRIPTION 2<br />
2 2 SHALLOW SUBSURFACE CONDITIONS 2<br />
23 PROPERTY USE HISTORY 3<br />
2 4 SUMMARY OF SOIL INVESTIGATION AND REMEDIATION<br />
ACTIVITIES 4<br />
241 Soil Investigation Activities 4<br />
242 _SoiI Remediation Activities . . . _ — - - - -5<br />
2 5 SUMMARY OF GROUNDWATER INVESTIGATION AND<br />
REMEDIATION ACTIVITIES 5<br />
2 5 1 Groundwater Investigation 6<br />
252 Groundwater Remediation 6<br />
2 52 1 Groundwater Extraction Trench System and Treatment Plant -<br />
1989 to 1994 7<br />
2522 Enhanced In-Situ Bioremediadon System -1994 to 1996 7<br />
2523 Jones Chemical Company Groundwater Extraction System -<br />
] 994 to Present 8<br />
2 6 CURRENT ENVIRONMENTAL CONDITIONS 8<br />
3 0 HUMAN HEALTH AND ECOLOGICAL RISK EVALUATION 8<br />
3.1 HUMAN HEALTH RISK 9<br />
3 2 ECOLOGICAL RISK 9<br />
4 0 CLOSURE OF SITE REMEDIATION SYSTEMS 9<br />
4 1 EXTRACTION TRENCH SYSTEM 9<br />
4 2 TREATMENT SYSTEM 10<br />
43 AIR SPARGING SYSTEM ' 10<br />
4 4 MONITORING WELLS 11<br />
5 0 PROPERTY MANAGEMENT MEASURES DURING ONGOING SITE<br />
OPERATIONS, MAINTENANCE, AND REDEVELOPMENT 11<br />
5 1 NOTIFICATION AND DISCLOSURE REQUIREMENTS 11<br />
5 2 CONSTRUCTION SAFETY MEASURES 12<br />
5 3 SOIL MANAGEMENT 12<br />
5 4 USE OF SHALLOW SITE GROUNDWATER 12<br />
6 0 REFERENCES 14<br />
(l)
TABLE OF CONTENTS<br />
(Continued)<br />
LIST OF FIGURES<br />
Figure I Property Location Map<br />
Figure 2 Site Plan<br />
Figure 3 Groundwater Extraction Trench and Treatment System<br />
Figure 4 Enhanced Bioremediation Air Sparging Wells Network<br />
Figure 5 Monitoring Wells<br />
IAPROJECI\JMI\REPORTS\SMP.DOC (ll)<br />
GEOMATHIX
i<br />
i<br />
SITE MANAGEMENT PLAN<br />
Former Ford Automobile Assembly Plant<br />
Formerly 1100 South Main Street<br />
Milpitas, California<br />
1.0 INTRODUCTION<br />
Geomatnx Consultants, Inc (Geomatnx) has prepared this Site Management Plan (SMP) on<br />
behalf of Ford Motor Land Development Corporation (FMLDC) for the former Ford Assembly<br />
Plant located at the former 1100 South Main Street, Milpitas, California 1 (the Property, Figure<br />
1), currently the Great Mall of the Bay Area (Great Mall) The objectives of this SMP are to<br />
I) summarize the remaining decommissioning activities necessary to complete site closure, 2)<br />
provide information on the known environmental conditions at the Property which will remain<br />
upon completion of the decommissioning activities, and, 3) address the current system for<br />
notification or other requirements during ongoing operations, maintenance, or development of<br />
the Property following the decommissioning activities<br />
The SMP is organized as follows 1<br />
• Section 2 0 - presents background information on the Property, including<br />
descriptions of the Property and its use history, a description of shallow subsurface<br />
conditions, and a summary of soil and groundwater investigation and remediation<br />
activities performed at the Property<br />
• Section 3 0 - discusses the human health and ecological risk issues associated with<br />
residual chemicals in soil and petroleum hydrocarbons in groundwater at the<br />
Property<br />
• Section 4 0 - describes the remaining decommissioning activities necessary to<br />
complete closure of existing remediation systems<br />
• Section 5 0 - presents Property management measures developed to address<br />
notification and other requirements for the Property that should be considered<br />
during ongoing operations and maintenance of the Property, the continuing<br />
development of the Property, or if Property use changes Included in this section is<br />
The current address of Great Mall Management is 947 Great Mall Drive, Milpitas, California.<br />
J APROJBCnJM IWEPORTSISMRDOC<br />
GEOMATRIX
a discussion on management of any disturbed or excavated soil and potential use of<br />
groundwater on the Property<br />
2.0 BACKGROUND<br />
This section summarizes pertinent background information regarding the Property, including a<br />
description of the Property, shallow subsurface conditions, Property use history, and remedial<br />
investigations and activities performed at the Property<br />
2.1" PROPERTY DESCRIPTION " '<br />
The Property is located at the former 1100 South Main Street in a predominantly commercial<br />
and industrial area of Milpitas, California. According to the City of Milpitas Planning<br />
Department, the Property is designated as a central commercial zone (C-2 zone) Land use in<br />
the Property vicinity is agricultural (A zone) to the west, heavy industrial (M-2 zone) to the<br />
north, east, and south, and central commercial (C-2 zone) to the southwest and northwest of the<br />
Property Interstate 880 is approximately 1 5 miles to the west, and San Francisco Bay is<br />
approximately 5 miles to the northwest<br />
The Property currently is occupied by a large enclosed shopping mall, the Great Mall The<br />
Great Mall has a building footprint area in excess of two million square feet (approximately 46<br />
acres) The current property configuration is the result of a 1996 subdivision of a larger parcel<br />
into the "Great Mall parcel" and nine "out-parcels," as shown on Figure 2 The subsurface<br />
impact of chemicals from former site operations is limited to the Great Mall parcel, therefore,<br />
the Property refers only to the Great Mall parcel for purposes of this management plan<br />
2.2 SHALLOW SUBSURFACE CONDITIONS<br />
The Property is located on relatively flat terrain in Santa Clara Valley that gently slopes<br />
northwest toward San Francisco Hay Ground elevations vary from approximately 45 feet<br />
above mean sea level (msl) in the southeastern portion of the Property, to approximately 25 feet<br />
above msl in the northwestern corner of the Property The Property is underlain by a complex<br />
1 \PROJECT\3M IWEPORTSISMPJXX: f<br />
GEDMATRIX
ii<br />
i. J&,.,<br />
| sequence of heterogeneous and laterally discontinuous deposits of clay, silt, sand, and gravel to<br />
at least 50 feet below ground surface (bgs) The sediments underlying the Property are<br />
| predominantly fine grained This fine-grained matrix contains numerous discontinuous layers<br />
of coarse-grained sands and gravel The coarse-grained layers are typically thin (less than 5<br />
I feet thick), however, locally, some borings at the Property had up to 15 feet of sand at depths<br />
below 25 feet bgs Shallow groundwater beneath the Property generally has been observed<br />
I between 5 and 15 feet bgs Horizontal hydraulic gradients at the Property generally have been<br />
towards the north and northwest A more detailed description of hydrogeologic conditions at<br />
I ~ the Property is included in the Groundwater Quality Investigation~Report (Geomatnx, 1996a) -<br />
I 23 PROPERTY USE HISTORY<br />
Ford Motor Company purchased the Property in 1953 from Western Pacific Railroad. A<br />
passenger car and commercial vehicle assembly plant was built m 1953 and operated until May<br />
1983 During its operating life, chemical handling at the automobile assembly plant included<br />
the storage and use of '<br />
• solvents, thinners, paints, and other chemical formulations for surface preparation<br />
and application of vehicle finish coatings,<br />
• lubricating oils and gasoline for motor vehicles, and<br />
• diesel fuel to power pumps in the emergency fire suppression system.<br />
An industrial wastewater treatment system, that included on-site wastewater lagoons,<br />
discharged treated wastewater to the City of Milpitas sanitary sewer system<br />
The Property was sold to Manam Financial Corporation in December 1984, and portions of the<br />
Property were leased to a variety of tenants, primarily for warehouse/storage uses The<br />
Property was subsequently re-acquired by FMLDC in 1988 In 1994, the former automobile<br />
assembly plant building was remodeled into the Great Mall A detailed description of the<br />
lAPROJECTO W I\REPORraSMP.DOC<br />
*<br />
GEDMATBIX
W *>, i •* fcv « ' GEOMATRIX<br />
historical uses of the Property is presented in the Site Use History, Former Ford Automobile<br />
Assembly Plant report (McLaren/Hart Environmental Engineering [McLaren/Hart], 1992)<br />
2.4 SUMMARY OF SOIL INVESTIGATION AND REMEDIATION ACTIVITIES<br />
Soil investigation and remediation activities were performed at the Property from 1982 to 1993<br />
by various consultants and contractors on behalf of FMLDC Investigative and remedial<br />
activities undertaken for soil at the Property are summarized below<br />
2.4.1 Soil Investigation Activities _<br />
McLaren/Hart and others conducted soil investigation activities in localized areas of the<br />
property based on the use or storage of chemicals in these areas In addition, McLaren/Hart<br />
conducted two phases of soil investigations, one in October-November 1992 (Phase I), and one<br />
in February 1993 (Phase II) (McLaren/Hart, 1996a) to identify remedial actions for soil<br />
Chemicals detected in soil at the Property primarily consisted of petroleum hydrocarbons,<br />
including gasoline, stoddard solvent, hydraulic oil, polynuclear aromatic compounds (PNAs),<br />
and benzene, toluene, ethylbenzene and xylenes (BTEX), as well as tetrachloroethylene (PCE),<br />
tnchloroethylene (TCE), methylene chloride, naphthalene, 1,2-methylnaphthalene, acetone,<br />
nickel and zinc McLaren/Hart established cleanup concentrations for the soil at the Property<br />
based on potential exposure to chemicals in soil assuming both residential and commercial<br />
industrial scenarios and protection of groundwater quality For each chemical, the lowest of<br />
these values was selected as the cleanup concentration Cleanup concentrations for soil at the<br />
Property were approved by the staff of the Regional Water Quality Control Board - San<br />
Francisco Bay Region (RWQCB) The cleanup concentrations established for soil at the<br />
Property are 760 milligrams per kilogram (mg/kg) for'acetone, 0 7 mg/kg for benzene, 900<br />
mg/kg for ethylbenzene, 7 mg/kg for methylene chloride, 120 mg/kg for 2-methyInaphthalene,<br />
45 mg/kg for naphthalene, 1600 mg/kg for toluene, and 24 mg/kg for xylenes. For all other<br />
volatile organic compounds (VOCs), the cleanup concentration is 1 mg/kg total VOCs, as<br />
stated in RWQCB Order No 90-63<br />
I \PROJECTUM 1VREPOR1S15MP.DOC
I<br />
I<br />
2.4.2 Soil Remediation Activities<br />
•* f<br />
A summary of soil remediation activities conducted by McLaren/Hart at the Property from<br />
1983 through 1993 is presented in McLaren/Hart's Phase I and II Soil Investigation Report<br />
(McLaren/Hart, 1996a) Approximately 10,000 cubic yards of soil were excavated from<br />
various areas of the site Affected soil at the Property was either removed from the Property or<br />
remediated on site to concentrations below the cleanup concentrations (McLaren/Hart, 1996b)<br />
2.5 SUMMARY OF GROUNDWATER INVESTIGATION AND REMEDIATION<br />
ACTIVITIES<br />
Ground water investigation and remediation activities were performed at the Property from 1982<br />
to 1996 by various consultants and contractors on behalf of FMLDC Based on the results of<br />
investigations performed by McLaren/Hart and others, the groundwater at the Property was<br />
impacted in two primary areas by petroleum hydrocarbons<br />
1 Former Gasoline Pump No 1 Area a former gasoline pump and associated 20,000gallon<br />
gasoline underground storage tank (UST), located outside and adjacent to<br />
the assembly plant, that was used to fuel maintenance vehicles between 1954 to<br />
1984 According to an engineering drawing, approximately 30 to 40 gallons per<br />
day or 1,000 gallons per month of gasoline were dispensed from this pump<br />
2 Former Executive Gasoline Tank Area a former 2,000-gallon gasoline UST that<br />
supplied fuel to a pump outside the executive garage for fueling the executive<br />
automobiles The UST was used from 1954 until the facility was closed in 1983<br />
Approximately 7,500 gallons per month were dispensed from this pump<br />
These two areas have been the primary focus of groundwater investigations performed at the<br />
Property by FMLDC as required by the RWQCB. In addition, halogenated volatile organic<br />
*<br />
compounds (HVOCs) in groundwater have migrated onto the Property from Jones Chemical,<br />
Inc (Jones), a site regulated by the RWQCB, located east of the Property at 985 Montague<br />
Expressway Investigative and remedial activities undertaken for groundwater at the Property<br />
are summarized below<br />
WROJECTUM IWEPORTOSMP DOC<br />
GEOIVIATRIX
2.5.1 Ground water Investigation<br />
Groundwater quality data were collected at the Property from 1982 to 1996 The cumulative<br />
results of groundwater investigations and monitoring at the Property indicate that petroleum<br />
hydrocarbons, primarily gasoline, have been released to shallow groundwater beneath the<br />
Property The primary on-site source areas of petroleum hydrocarbons to groundwater have<br />
been the Former Gasoline Pump No 1 and the Former Executive Gasoline Tank Area, The<br />
maximum lateral and vertical extents of the groundwater affected by petroleum hydrocarbons in<br />
both areas were defined and were monitored by numerous perimeter wells for several years<br />
Data indicated that the extent of the dissolved petroleum hydrocarbon plumes were stableand - r<br />
that petroleum hydrocarbon concentrations within the affected areas were stable or decreasing<br />
A detailed description of groundwater investigation and remediation activities performed at the<br />
Property is presented in the Groundwater Quality Investigation Report (Geomatnx 1996a)<br />
The groundwater investigations and monitoring performed by Jones also have shown that<br />
HVOC releases upgradient of the Property have migrated in groundwater to beneath the<br />
eastern, upgradient edge of the Property. Groundwater migrating onto the Property from the<br />
east includes the following HVOCs PCE, TCE, 1,1-dichloroethene (1,1-DCE), 1,2-<br />
dichloroethene (1,2-DCE), 1,1,1-tnchloroethane (1,1,1-TCA), 1,1-dichloroethane (1,1-DCA),<br />
and 1,2-dichloroethane (1,2-DCA) and vinyl chloride Recent monitoring well data obtained<br />
from Jones (October 1996) indicate that total concentrations of HVOCs remaining in<br />
groundwater beneath the Property are generally less than 100 micrograms per liter (ng/1) and<br />
consist of TCE, PCE, 1,1,1-TCA, 1,1-DCE, and 1,2-DCA.<br />
»<br />
2.5.2 Groundwater Remediation<br />
This section presents a bnef description of the groundwater remediation activities undertaken at<br />
the Property<br />
I \PROJECT\3M 1\R£PORTS\SMP.DOC<br />
GEOMATRIX
1<br />
i<br />
g 2.S.2.I Groundwater Extraction Trench System and Treatment Plant - 1989 to 1994<br />
In 1989, a groundwater extraction trench system and air stripping treatment plant were installed<br />
I by McLaren/Hart to intercept petroleum hydrocarbon-affected groundwater emanating from the<br />
Former Gasoline Pump No 1 Area and the Former Executive Gasoline Tank Area, The<br />
I ground water extraction trench system consisted of an approximately 2000-foot long extraction<br />
trench and groundwater cut-off slurry wall The purpose of the slurry wall was to enhance the<br />
I extraction system by further preventing flow of groundwater past the trench and to prevent the<br />
* flow of downgradient groundwater into the extraction trench Extraction of groundwater began<br />
' on 31 October 1989 and continued until April 1994 Significant concentrations of petroleum<br />
i hydrocarbon constituents were not detected in samples from the trench over the time-frame it<br />
* operated, indicating that both groundwater plumes had stabilized pnor to reaching the trench,<br />
most likely due to in-situ bioremediation As approved by the RWQCB, the groundwater<br />
extraction and treatment system was deactivated upon the installation of an enhanced bio-<br />
remediation system m 1994 (Section 2522)<br />
2.5.2.2 Enhanced In-Situ Bioremediation System - 1994 to 1996<br />
An enhanced in-situ bioremediation system, approved by the RWQCB, was installed by<br />
Geraghty & Miller and operated at the Property from 1994 to 1996 The purpose of this system<br />
was to enhance the rate of biodegradation of petroleum hydrocarbons in groundwater in both<br />
the Former Gasoline Pump No 1 Area and the Former Executive Gasoline Tank Area. The<br />
system consisted of an air sparging system in both areas and a vapor extraction system in the<br />
Former Gasoline Pump No I Area (Geraghty & Miller, 1995) The system was deactivated in<br />
December 1996 following RWQCB approval as part of site closure (RWQCB, 1996)<br />
Until 1995, the extracted vapors were passed through granular activated carbon for treatment<br />
and discharged to the atmosphere under permit from the Bay Area Air Quality Management<br />
District (BAAQMD) In 1995, the BAAQMD eliminated requirements for treatment due to the<br />
1 \PROJECTU341 WEPORTS\SMP.DOC<br />
I<br />
GEOMATRIX
low concentrations of benzene being discharged, benzene was not detected in any of the<br />
samples collected in the latest sampling event conducted in September 1996<br />
1 4<br />
2.5.23 Jones Chemical Company Groundwater Extraction System - 1994 to Present<br />
The RWQCB, in Order No 90-072 Provisions 2 C and 2 F, required Jones to prevent the<br />
continued migration of HVOCs and to implement plume containment Jones designed and<br />
installed a groundwater extraction system that included five groundwater extraction wells on<br />
the eastern side of the Property to contain the downgradient portion of its plume These wells<br />
fJE-19 through JE-23)~were installed m September 1993 about 300 feet apart in the eastern<br />
portion of the Property (Figure 3) Jones began extraction from the wells on 2 February 1994<br />
(Levme-Fricke, 1996) According to RWQCB Order No 90-072, Jones is required to continue<br />
operating this HVOC groundwater extraction system , -<br />
2 6 CURRENT ENVIRONMENTAL CONDITIONS<br />
, i<br />
Based on the results of the extensive investigative and remedial actions that were performed at<br />
the Property, the identified environmental conditions that need to be considered during ongoing<br />
operations and maintenance of the Property, the continuing development of the Property, or if<br />
the Property use changes, are (1) the presence of residual concentrations of chemicals in<br />
shallow soil, (2) the presence of residual petroleum hydrocarbons in shallow groundwater in the<br />
Former Gasoline Pump No 1 Area and the Former Executive Gasoline Tank Area, and, (3) the<br />
presence of HVOCs from an upgradient source in groundwater beneath the upgradient (eastern)<br />
edge of the Property,<br />
3.0 HUMAN HEALTH AND ECOLOGICAL RISK EVALUATION<br />
This section summarizes the results of human health and ecological risk evaluations performed<br />
for the Property.<br />
IVROJECTUM HREPORTOSMP.DOC<br />
GEOMATRIX
I<br />
I 3.1 HUMAN HEALTH RISK<br />
• Health risk evaluations were conducted to assess the potential risk to potential future residents<br />
a and commercial workers at the Property in its current development Health risks associated<br />
' with residual chemicals in shallow soil were evaluated by McLaren/Hart (McLaren/Hart, 1991)<br />
| Health risks associated with residual petroleum hydrocarbons in groundwater were evaluated by<br />
Geomatnx (Geomatnx, 1996b) These evaluations concluded that soil containing residual<br />
I chemicals and groundwater containing residual petroleum hydrocarbons at the Property will<br />
, pose no threat to the health of residents or workers who might come into contact with soil on<br />
I the Property or potential vapors emanating from groundwater beneath the Property.<br />
* *<br />
*<br />
| 3.2 ECOLOGICAL RISK<br />
The Property is currently occupied by a large indoor shopping mall, and is completely covered<br />
I by the mall structure, concrete and asphalt paving, and limited landscaping As a result, the<br />
Property provides no viable habitat to support an urban animaj population As discussed in the<br />
Site Closure Report (Geomatnx, 1996b), groundwater affected by petroleum hydrocarbons has<br />
f<br />
not migrated beyond the Property's boundaries, the groundwater plumes are considered stable,<br />
and chemical concentrations in groundwater generally are decreasing Therefore, the Property<br />
does not present unacceptable nsk to biota in the environment.<br />
•<br />
4.0 CLOSURE OF SITE REMEDIATION SYSTEMS<br />
This section describes the decommissioning activities necessary to complete closure of the<br />
remediation systems at the Property. It is estimated that these closure activities will be<br />
completed by August 1997<br />
4.1 EXTRACTION TRENCH SYSTEM<br />
The groundwater extraction trench system installed by McLaren/Hart consists of a groundwater<br />
extraction trench, a groundwater cutoff slurry wall, water conveyance pipelines, and electrical<br />
conduits (Figure 3) In conformance with Santa Clara Valley Water District (SCVWD)<br />
1 \PROJECIU341 \REPORTS\SMP-DOC
equirements, decommissioning activities for the extraction trench will include injecting grout<br />
into the extraction wells, trench monitoring wells, and trench drain pipes located within the<br />
trench, removal and disposal of equipment associated with the extraction trench system, and I<br />
installation of flow barriers at required intervals along the trench Closure activities for the<br />
water conveyance pipeline and electrical conduits, as required by the City of Milpitas, will<br />
include removal of pull boxes and electrical and instrumentation cables from conduits, capping<br />
of the conduits, and drainage of the groundwater conveyance pipeline There are no closure<br />
requirements associated with the groundwater cutoff slurry wall In addition, the SCVWD<br />
-groundwater production permit that is associated with the groundwater extraction trench system<br />
will be closed<br />
4.2 TREATMENT SYSTEM<br />
i *<br />
The groundwater treatment system, installed by McLaren/Hart, includes a granular activated<br />
carbon and air stripper unit (Figure 3) Decommissioning activities will include collecting a<br />
water sample from the water that has accumulated in the influent surge tank for analysis in<br />
accordance with City of Milpitas Fire Department and the National Pollutant Discharge<br />
Elimination System (NODES) permit requirements. If analytical results indicate that organic<br />
compounds are present in the water at concentrations exceeding NPDES effluent limits, the<br />
water will be treated by the air stripper prior to discharge through the effluent outfall under the<br />
existing NPDES permit In conformance with the City of Milpitas Building Department,<br />
decommissioning activities will also include dismantling and removal/disposal of treatment<br />
system components, including structural concrete within the treatment system compound and<br />
the compound security fence The NPDES permit and the BAAQMD operating permit<br />
associated with the groundwater treatment system will be closed.<br />
43 AIR SPARGING SYSTEM<br />
The air sparging system installed by Geraghty & Miller consists of an air sparging system and<br />
vapor extraction system located inside the Great Mall and an air sparging system located<br />
outside the Great Mall (Figure 4) Decommissioning activities for the air sparging systems will<br />
I \PROJECT\334 ]WEPORTS\SMP.DOC<br />
GEOMATRIX<br />
10
8<br />
I<br />
fi<br />
r<br />
include destruction of the wells associated with the systems in conformance to the requirements<br />
of the SCVWD The vapor extraction system will be converted to a passive venting system by<br />
connecting the piping directly to the roof vent Equipment and piping associated with the vapor<br />
extraction system and not necessary for passive venting will be removed The BAAQMD<br />
permit associated with the an- sparging systems will be revised to reflect the change to a passive<br />
venting system<br />
4.4 MONITORING WELLS<br />
All remaining monitoring we/Is at the Property not associated with Jones (i e, extraction wells -<br />
JE-19 through -23 and monitoring wells JB-83, JB-84, and JB-91) will be destroyed in<br />
accordance with the SCVWD requirements (Figure 5). The SCVWD permits associated with<br />
the momtonng wells will be closed upon well destruction<br />
5.0 PROPERTY MANAGEMENT MEASURES DURING ONGOING SITE<br />
OPERATIONS, MAINTENANCE, AND REDEVELOPMENT<br />
*<br />
Property management measures to be taken during ongoing operations, maintenance, and i<br />
redevelopment include the following' notification and disclosure requirements, construction<br />
safety measures, soil management, and use of groundwater on the Property These measures<br />
are discussed below<br />
5.1 NOTIFICATION AND DISCLOSURE REQUIREMENTS<br />
The environmental conditions at the Property are summarized in McLaren/Hart's Phase I and II<br />
Soil Investigation Report (McLaren/Mart, 1996a) and Soil Remediation Summary Report<br />
(McLaren/Hart, 1996b), and Geomatnx's Groundwater Quality Investigation Report<br />
(Geomatrix, 1996a) and Site Closure Report (Geomatnx, 1996b), and should be disclosed to all<br />
potential buyers, contractors, and interested parties to the extent required by law The<br />
disclosure should include information contained in these reports regarding the nature and extent<br />
of chemicals m the soil and groundwater and potential human health risks This SMP should be<br />
I-\PROJECTU34 HREPORTSSMPDOC<br />
••<br />
11<br />
GEOMATHIX
included as part of the disclosure In addition, tenants at the Property are notified of<br />
environmental conditions at the Property as part of the lease agreement with Great Mall<br />
Management<br />
5.2 CONSTRUCTION SAFETY MEASURES<br />
Great Mall Management lease provisions currently require that no construction activities can<br />
occur without notification to and authorization by Great Mall Management Prior to any<br />
significant construction activities at the Property, the contractor should prepare a site-specific<br />
health and safety plan (HSP) The HSP should describe the construction activities and address<br />
standard safety precautions such as protective measures for workers and soil handling issues, as<br />
appropnate In the event that activities performed at the Property will disturb the subsurface in<br />
•<br />
areas where chemicals are known to be present, resulting in additional exposure pathways (such<br />
as for maintenance or construction workers), the potential health risks associated with exposure<br />
to those residual chemicals in soil and groundwater should be evaluated, and appropnate<br />
precautions included in the HSP All applicable state and federal regulations should be adhered<br />
to<br />
53 SOIL MANAGEMENT<br />
Since some soil at the Property may contain chemical concentrations (below the established site<br />
cleanup concentrations), soil excavated during construction activities should be evaluated<br />
and/or analyzed for the appropnate chemicals based on the use history of the Property and/or<br />
the previous soil investigations performed at the Property (McLaren/Hart, 1996a and 1996b). If<br />
soil requires off-site disposal, additional waste characterization may be required by the disposal<br />
facility under consideration<br />
5.4 USE OF SHALLOW SITE GROUNDWATER<br />
HVOCs and certain petroleum hydrocarbon constituents are known to be present in shallow<br />
groundwater at concentrations that currently exceed objectives for drinking water. However,<br />
shallow groundwater is not anticipated to be used as a source of drinking water Therefore, it is<br />
IVROJECT\3MI\REPOim\SMP.DOC J2<br />
BEOMATRIX
anticipated that ground-water will not be used for drinking water or other purposes until such<br />
I time as the RWQCB and applicable regulatory agencies approve use of groundwater at the<br />
I<br />
Property<br />
1APROJECT\3J«I\REPORTS\SMP.DOC -.<br />
GEOMATRIX
6.0 REFERENCES<br />
California Regional Water Quality Control Board, San Francisco Bay Region, 1996, Letter to<br />
,' Jerome S Amber Regarding Site Closure Request, Former Ford Assembly Plant,<br />
Milpitas, Santa Clara County, 18 December<br />
Geomatnx Consultants, Inc, I996a, Ground water Quality Investigation Report, Former Ford<br />
Automobile Assembly Plant, 1100 South Main Street, Milpitas, California, August<br />
•<br />
Geomatnx Consultants, Inc, 1996b, Site Closure Report, Former Ford Automobile Assembly<br />
Plant, 1100 South Mam Street, Milpitas, California, November<br />
Geraghty & Miller, Inc , 1995, Letter to Mr Hon-Ting Man, Bay Area Air Quality<br />
Management District, from Edward H Crump, dated 18 December<br />
McLaren/Hart Environmental Engineering, 1991, Soil Health-Based Cleanup Levels for Ford<br />
Motor Company Automobile Assembly Facility in Milpitas, California, 16 December<br />
McLaren/Hart Environmental Engineering, 1992, Site Use History, Former Ford Automobile<br />
Assembly Plant, Milpitas, California, 18 December<br />
McLaren/Hart Environmental Engineering, 1996a, Phase I and II Soil Investigation Report,<br />
Former Ford Automobile Assembly Plant, Milpitas, California, September<br />
McLaren/Hart Environmental Engineering, 1996fa, Soil Remediation Summary Report, Former<br />
Ford Automobile Assembly Plant, Milpitas, California, September<br />
1 \PRQJECI\3M I \REPORTS\SMPDOC<br />
GEOMATRIX<br />
14
t.<br />
B-"<br />
SOUTHERN PACIFIC RAILROAD<br />
MW-67 'MW-63<br />
. / .MW-66<br />
MW-61 **•<br />
MW-,2/<br />
MW-65<br />
EXTRACTION TRENCH<br />
PROPERTY BOUNDARY<br />
MW-18<br />
\W-19<br />
.MW-56<br />
MW-54<br />
THE GREAT MALL<br />
EXPLANATION<br />
SCALE IN FEET<br />
GROUNDWATER MONITORING WELLS<br />
TO BE DESTROYED<br />
MONITORING WELLS<br />
Former Ford Automoble Assembly Plant<br />
MApttos, Cofifornw<br />
GEOMATRIX<br />
Project No<br />
3341 OIK
I STOW VAttD BAOB<br />
SOUTHERN PACIFIC RAILROAD<br />
PROPERTY BOUNDARY<br />
THE GREAT MALL<br />
EXPLANATION<br />
A-LEVEL TRIGGER MONITORING WELL TO BE<br />
DESTROYED<br />
A-LEVEL MONITORING WELL ASSOCIATED<br />
WITH AIR SPARGING SYSTEM TO BE<br />
DESTROYED<br />
PILOT WELL ASSOCIATED WITH AIR<br />
SPARGING SYSTEM TO BE<br />
DESTROYED<br />
, ENHANCED BlOREMEDlATlON<br />
AIR SPARGING WELLS NETWORK<br />
Former Ford Automobae Assembly Plant<br />
, , Mflpitos, California<br />
GEOMATRIX<br />
Project No<br />
334101K<br />
Figure<br />
4
SOUTHERN PSCIF1C RAILROAD<br />
GROUNDWATER<br />
TREATMENT SYSTEM<br />
EXTRACTION TRENCH<br />
PROPERTY BOUNDARY<br />
PIPER DRIVE<br />
EXPLANATION<br />
SCALE « fEET<br />
EW-3ra EXTRACTION WELLS TO 6£ DESTROYED<br />
TMW-3© TRENCH MONITORING WELLS TO BE<br />
DESTROYED<br />
GROUNOWATER TREATMENT SYSTEM TO BE<br />
DECOMMISSIONED<br />
CRQUNOWATEft EXTRACTION TRENCH<br />
AND TREATMENT SYSTEM<br />
former ford Automobile Assembly Plont<br />
MHpttos, CoMornra<br />
Project No<br />
3341.01 K
STMU WATER BASKS<br />
OUT-PARCEL B_<br />
OLTT-PAflCEL 7<br />
SOUTHERN PACIFIC RAILROAD<br />
EXTRACTION TRENCH<br />
PROPERTY BOUNDARY<br />
FORMER UNDERGROUND<br />
STORAGE TANK AREA<br />
FORMER GASOLINE<br />
PUMP NO f AREA<br />
THE GREAT MALL<br />
FORMER EXECUTIVE<br />
GASOLINE TANK AREA<br />
SCALE IN FEET<br />
Former Ford Automobile Assembly Plant<br />
Mrlpilas California<br />
GEO MATRIX<br />
Project No<br />
3341 OIK<br />
Figure<br />
2
California Regional Water Quality Control Board<br />
San Francisco Bay Region<br />
\VinstOD H. Hicknx buntet Address hnp7/ww» iwrcb ca gov Gray Davis<br />
Sifntanfor 1515 Cl»y Street. Suite 1400 Oakland Cabforaia 94612 Gtntmor<br />
Envtronmtntat phone (510) 622-2300 3 FAX (510) 622-2460<br />
Protection<br />
[COPY I<br />
Mr Jack Williams<br />
Swerdlow Real Estate Group, Inc<br />
200 South Park Road<br />
Hollywood, FL 33021<br />
6 - 2001<br />
File No 43S0153 (ME!)<br />
Subject Implementation of Site Management Plan, Great Mall of the Bay Area, Former<br />
Ford Assembly Plant, Milpitas, California<br />
Dear Mr Williams<br />
Regional Board staff has reviewed previous and ongoing development activities at the Great Mall<br />
of the Bay Area (the Property) We would like to take this opportunity to summan7e these<br />
development activities with respect to the implementation of the March 1997 Site Management<br />
Plan (SMP) prepared for the Property The SMP provides recommendations regarding the<br />
implementation of Property management measures These measures were developed to address<br />
notification and other requirements for the Property that should be considered during ongoing<br />
operations and maintenance of the Property, the continuing development of the Property, or a<br />
change in Property use Additionally, this letter outlines specific requirements for<br />
implementation of the SMP for ongoing and future developments These requirements were<br />
discussed in meetings held on February 27, 2001 between Mark Johnson of the Regional Board<br />
and representatives of Geomatnx Consultants, Inc (Geomatnx), on behalf of the Swerdlow Real<br />
Estate Group, Inc These issues were also discussed with you in a meeting held on March 15,<br />
2001<br />
As you know, in March 1997, Regional Board Order No 97-039 rescinded Site Cleanup<br />
requirements for the Property, accepted closure of all areas of concern based on the current land<br />
uses, and required implementation of the SMP for any redevelopment activities that intrude into<br />
the subsurface Such development activities completed since then include Vans SkatePark,<br />
Oshman's Supersports USA (Oshman's), Dave & Buster's, and Century Theaters Ongoing<br />
developments include the Home Depot Project and the northeastern parking structure We<br />
-understand -that additional -site development activities are -planned<br />
In general, previous developments (i e , Vans SkatePark, Oshman's, Dave & Buster's, and<br />
Century Theater) have been completed in the southern and western areas of the Property, where<br />
California Environmental Protection Agency
-2-<br />
i<br />
COPY<br />
historic industrial uses were highly defined and well understood Implementation of the SMP<br />
during development of these areas was straightforward due to the strength of the data As per the<br />
SMP, impacted soil from previously identified and remediated areas (i e , Oshman's loading<br />
dock) was segregated, characterized, and handled appropriately However, ongoing development<br />
activities, such as the northeastern parking structure, are being performed in areas of the Property<br />
where histonc industrial uses were significantly more active, and the potential for encountering<br />
environmental concerns is greater than in previous developments Additionally, this is the area<br />
where the Jones Chemical Company is currently undergoing groundwater extraction and<br />
remediation activities Therefore, the following actions will be required for ongoing and future<br />
development activities at the Property<br />
i<br />
1} The Regional Board shall be notified in writing at least 60 days prior to initiating<br />
construction activities below grade (e g , drilling, excavation, or grading)<br />
2) Hislonc documents shall be reviewed to identify areas of potential environmental concern<br />
Histonc environmental data, if available shall be reviewed for adequacy and compared to<br />
the previously developed health-based cleanup levels 1 (HBCLs) This will identify potential<br />
environmental data gaps that need to be investigated and considered prior to the proposed<br />
development Any additional data will then be collected, as necessary If no data gaps are<br />
identified, then the histonc environmental data shall be summanzed in a project-specific<br />
SMP (see item 4) and submitted to the Regional Board<br />
3) A screening level human health nsk assessment (HHRA) using the histonc and, if<br />
applicable, newly collected data will be performed. This would incorporate the companson<br />
of the complete data set with respect to HBCLs or other applicable HHRA screening cntena,<br />
to evaluate the need for a project specific HHRA This document shall be submitted to the<br />
Regional Board at least 60 days prior to initiation of construction activities<br />
4) A project-specific SMP, Health and Safety Plan, and other documents descnbmg potential<br />
nsk management measures shall be submitted to die Regional Board 60 days pnor to project<br />
initiation The SMP will contain an executive summary of environmental conditions as they<br />
pertain to each specific development and potential exposure to construction workers The<br />
SMP and Health and Safety Plans shall discuss measures to notify and educate all<br />
construction workers involved in subsurface work of potential environmental conditions and<br />
potential hazards which may be encountered dunng construction In addition, the project<br />
specific SMP and Health and Safety Plan will set forth notification protocols for the<br />
construction workers, in the event that previously unidentified environmental issues are<br />
encountered dunng construction<br />
McLaren/Hare, 1991, Soil Health Based Clean-Up Levels for Ford Motor Company<br />
Automobile Assembly Facility in Milpicas California<br />
California Environmental Protection Agency<br />
•^ Ktf\, trd Paprr
+,r~**t*ewiK, sf?.-n<br />
>j j"-\ *-",,-> ;-<br />
These requirements are not applicable to development of the Out Parcel areas, such as the Home<br />
Depot Project As described in our letter of September 11,2000, the Regional Board has no<br />
environmental concerns related to the development of the Out Parcel areas<br />
In accordance with the above requirements, please respond to this letter describing proposed<br />
SMP activities for the proposed development of the eastern portion of the Property, including the<br />
ongoing development of the northeastern parking structure, by May 10, 2001 For all future<br />
developments, please respond to the requirements as set forth in items 1 through 4 above, by<br />
submitting the appropriate documentation to the Board, 60 days prior to initiation of construction<br />
activities This response is required under the authority of Section 13267 of the California Water<br />
Code Failure to respond or a late response may subject you to civil liability imposed by the<br />
Board to a maximum amount of $1000 per day Any extension of the time deadline must be<br />
confirmed in writing by Board staff<br />
Should you have any questions, please contact Mr Mark Johnson of my Staff at (510)622-2493,<br />
ore-mail himatmej@rb2swrcbcagov<br />
cc Lester Feldman, Geomatnx<br />
Sincerely,<br />
Loretta K. Barsamian<br />
Executive Officer<br />
len A Hill, Chief<br />
Toxic Cleanup Division<br />
California Environmental Protection Agency<br />
•f^Rrt \iled Paper