Revenues - BayWa
Revenues - BayWa
Revenues - BayWa
You also want an ePaper? Increase the reach of your titles
YUMPU automatically turns print PDFs into web optimized ePapers that Google loves.
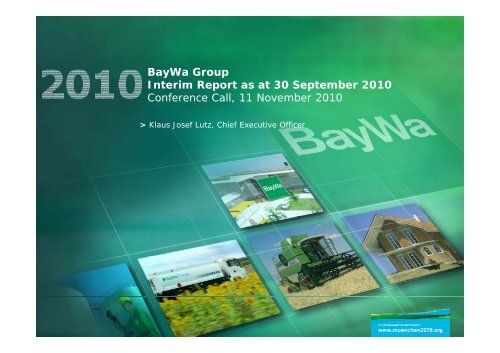
<strong>BayWa</strong> Group<br />
Interim Report as at 30 September 2010<br />
Conference Call, Call 11 November 2010<br />
> Klaus Josef Lutz, Chief Executive Officer<br />
1
2<br />
Agriculture<br />
Market developments in the third quarter of 2010<br />
� Lower harvest volume following bumper harvest in 2009 causes the price of wheat to surge<br />
� High producer prices and damp weather conditions encourage farmers to sell<br />
� Strong operating resources business – recovery in the demand for fertilisers<br />
� Trends indicate economic activity in the agriculture sector is on the rise - increasing willingness to invest<br />
Buildingg Materials<br />
� Recovery of the construction sector economy at a low level<br />
� Number of residential building permits climbs after historic lows<br />
� Stable consumer trend in the retail business (DIY & Garden Centres)<br />
� Seasonally-induced catching up effects<br />
Energy<br />
� IIncrease iin hheating ti oil il sales l bbut t still till bbelow l year-earlier li llevel l ( (ca -7%) 7%)<br />
� Filling levels (oil) of tanks in private households slightly below the level customary at this time of the year<br />
� Economic recovery boosts lubricants business<br />
� Decline in the solar business from cuts in government promotion of solar energy lower than expected
Development of the Group<br />
3
4<br />
[in EUR m]<br />
2.500<br />
2.000<br />
1.500<br />
1.000<br />
500<br />
0<br />
[in EUR m]<br />
30<br />
20<br />
10<br />
0<br />
1,888<br />
Q3/2009<br />
19.1<br />
Q3/2009<br />
10.1%<br />
55.5%<br />
<strong>Revenues</strong> and EBIT in Q3 of 2010 against previous year<br />
2,078<br />
Q3/2010<br />
29.7<br />
Q3/2010<br />
<strong>Revenues</strong><br />
� EUR 2,078 million (∆ 10/09: +EUR 190 million / +10.1%)<br />
� Recovery of the fertiliser business<br />
� Strong development in retail (DIY)<br />
� Level of revenues benefits from <strong>BayWa</strong> y r.e.<br />
EBIT<br />
� EUR 29.7 million (∆ 10/09: EUR +10.6 10.6 million / +55.5%) 55.5%)<br />
� Best quarterly results after the exceptional year of 2007<br />
� No impairment charges for fertiliser in 2010<br />
� IIncrease iin hheating ti oil il sales l ffollowing ll i a weakk fi firstt hhalf-year lf
5<br />
[EUR m]<br />
45<br />
40<br />
35<br />
30<br />
25<br />
20<br />
15<br />
10<br />
5<br />
0<br />
25.8<br />
2006<br />
+61%<br />
Year-on-year (Q3) comparison of EBIT<br />
41.66<br />
2007<br />
‐35%<br />
27.0<br />
2008<br />
‐29%<br />
19.1<br />
2009<br />
+55%<br />
29.7<br />
2010<br />
Ø 28,6<br />
Q3
[in EUR m]<br />
[in EUR m]<br />
6<br />
1‐9/2009<br />
1‐9/2009<br />
4.5%<br />
20.4%<br />
<strong>Revenues</strong> and EBIT in 1-9 of 2010 against previous year<br />
1‐9/2010<br />
1‐9/2010<br />
<strong>Revenues</strong><br />
� EUR 5,855 million (10/09: EUR +251 million / +4.5%)<br />
� Agriculture Segment at previous year‘s level<br />
� Energy Segment with swift growth (price-induced+ <strong>BayWa</strong> r.e)<br />
� Buildingg Materials Segment g Bau raises sales through g new<br />
DIY& GC<br />
� Disposal of car dealer operations (EUR -135 million)<br />
EBIT<br />
� EUR 86 million (∆ 10/09: EUR +14.6 14.6 million / +20.4%) 20.4%)<br />
� Higher sales volumes in the op. resources business (fertilisers)<br />
� Contribution to profit of just under EUR 10 million by <strong>BayWa</strong> r.e;<br />
compensates seasonal decline in oil business (EUR -8.3 83million) million)<br />
� Special effect from the disposal of the Animedica investment<br />
(around EUR 5.2 million)
7<br />
Year-on-year comparison<br />
in EUR m 1-9 2007 1-9 2008 1-9 2009 1-9 2010 ∆10/09 (%)<br />
<strong>Revenues</strong> 5,277.2<br />
EBITDA 171.6<br />
6,742.5<br />
207.2<br />
5,604.4<br />
141.8<br />
5,855.4<br />
157.7<br />
4.5%<br />
11.2%<br />
% of <strong>Revenues</strong> 3.3% 3.1% 2.5% 2.7%<br />
EBIT 104.3 134.5 71.4 86.0 20.4%<br />
% of <strong>Revenues</strong> 2.0% 2.0% 1.3% 1.5%<br />
EBT 67 67.8 8 92 92.2 2 40 40.4 4 55 55.8 8 38 38.1% 1%<br />
% of <strong>Revenues</strong> 1.3% 1.4% 0.7% 1.0%<br />
Consolidated net income 53.0<br />
TTax rate t 21 21.8% 8% 21 21.9% 9% 25 25.0% 0% 23 23.9% 9%<br />
72.0<br />
30.3<br />
42.5<br />
40.3%<br />
Share of minority interest 22.7 18.3 11.8 14.2 20.3%<br />
as % of net income 42.8% 25.4% 38.9% 33.4%<br />
Share of owners of parent company 30.3 53.7 18.5 28.3 53.0%<br />
as % of net income 57.2% 74.6% 61.1% 66.6%<br />
Earnings per share (EPS) in EUR 0.89 1.58 0.54 0.83<br />
53.7%
8<br />
Key data – balance sheet (IFRS)<br />
in EUR million 1-9 2009 1-9 2010 ∆10/09 (%)<br />
Total assets<br />
2,939.3 3,440.9<br />
Equity<br />
957.5 984.0<br />
Equity ratio 32.6% 28.6%<br />
17.1%<br />
iin EUR million illi 11-9 9 2009 11-9 9 2010 ∆10/09 10/09 (%)<br />
Non-current assets<br />
1,427.2<br />
Current assets 1,507.4<br />
Provisions 590.7<br />
Financial liabilities 664.6<br />
1,438.8<br />
1,959.3<br />
598.0<br />
757.3<br />
2.8%<br />
0.8%<br />
30.0%<br />
1.2%<br />
13.9%
9<br />
Cashflow<br />
In EUR m 1-9 2009 1-9 2010 ∆10/09 (%)<br />
Consolidated net income<br />
94.9<br />
Cash flow from operating activities 23.1<br />
114.7<br />
47.9<br />
20.9%<br />
107.4% %<br />
Cash flow from investing activities - 55.1 - 94.0 70.6%<br />
Cash flow from financing Activities 28.9 56.7 96.2%<br />
Cash & cash equivalents at the start of the period<br />
Cash & cash equivalents at the end of the period<br />
16.1<br />
13.1<br />
19.7<br />
33.2<br />
22.4%<br />
153.4%
Development of the Segments<br />
10
11<br />
<strong>BayWa</strong> Agriculture<br />
� Seeds<br />
� Fertilisers l<br />
� Crop protection<br />
� Grain<br />
�� Feedstuff<br />
� Fruit<br />
� Agricultural equipment
12<br />
Developments in 1-9/2010<br />
Development of operating resources<br />
� Strong demand for fertilisers (price level rising gradually)<br />
� Stable demand for seed<br />
� Competition exerts pressure on crop protection margins<br />
Development of agricultural produce<br />
� Sharp increase in grain prices from end of Q2 onwards (drought and speculation)<br />
� Collection and storage of harvest above year-earlier level<br />
� Processing and drying of grain harvest due to weather conditions<br />
Development of agricultural equipment<br />
� Order intake around 25% higher than a year ago (tractors)<br />
� Incoming liquidity encourages greater willingness to invest
13<br />
[in EUR m]<br />
3.000<br />
2.000<br />
1.000<br />
0<br />
[in EUR m]<br />
50<br />
40<br />
30<br />
20<br />
10<br />
0<br />
2,560<br />
1,927<br />
1‐9/2009<br />
32.1<br />
21.8<br />
0.4%<br />
38.6%<br />
<strong>Revenues</strong> and EBIT in 1-9 of 2010 against previous year<br />
2,571<br />
1,944<br />
1‐9/2010<br />
44.5<br />
36.4<br />
10,3 8,1<br />
1‐9/2009<br />
1‐9/2010<br />
Agrar<br />
Technik<br />
Agrar<br />
Technik<br />
<strong>Revenues</strong><br />
� Agriculture ∆ 10/09: EUR +17 million (+0.9%)<br />
� Agricultural Equipment ∆ 10/09: EUR -6 million (-0.9%)<br />
� Sales at previous year‘s level<br />
� Sale of operating p g resources stable; fertiliser prices p<br />
� Sale of grain in H1/2010 at low price level<br />
� Agricultural Equip.: increased order intake<br />
EBIT<br />
� Agriculture ∆ 10/09: / EUR + 14.6 million ( (+67.0%) %)<br />
� Agricultural Equipment ∆ 10/09: EUR – 2.2 million (-21.4%)<br />
� Fertiliser problem (2009) no longer an issue – raises profit<br />
� Agricultural equip. with effects delayed to Q4/2010
14<br />
Year-on-year comparison<br />
in EUR m 1-9 2007 1-9 2008 1-9 2009 1-9 2010 ∆10/09 (%)<br />
<strong>Revenues</strong> 2,414.1<br />
EBITDA 83.2<br />
3,179.1<br />
128.3<br />
2,559.8<br />
61.4<br />
2,570.9<br />
74.9<br />
0.4%<br />
22.0%<br />
% of <strong>Revenues</strong> 3.4% 4.0% 2.4% 2.9%<br />
EBIT 53.3 96.1 32.1 44.5 38.6%<br />
% of <strong>Revenues</strong> 2.2% 3.0% 1.3% 1.7%<br />
EBT 32 32.4 4 68 68.3 3 11 11.9 9 26 26.0 0 118 118.5% 5%<br />
% of <strong>Revenues</strong> 1.3% 2.1% 0.5% 1.0%
15<br />
Trend of market prices<br />
Wheat B-wheat, Hamburg, 02/11/2010<br />
tbd
Grain Balance - World and Usage<br />
in EUR m 03/04 04/05 05/06 06/07 07/08 08/09 09/10 10/11*<br />
Production 1,862 2,042 2,017 2,002 2,124 2,237 2,222 2,200<br />
Beginning g g Balance 429 355 403 389 342 364 448 474<br />
Available 2,291 2,397 2,420 2,391 2,466 2,601 2,670 2,674<br />
Consumption 1,936 1,994 2,031 2,049 2,102 2,153 2,196 2,245<br />
Ending Balance<br />
Stock / Consumption in<br />
355 403 389 342 364 448 474 429<br />
% 18 20 19 17 17 21 22 19<br />
Days in Ending Stock 67 74 70 61 63 76 79 70<br />
[I [In millions illi off ttons, wheat, h t rice, i maize, i bbarley, l oats, t rye, sorghum] h ]<br />
Status: 09/2010; *2010/11 forecast; figures partly estimated<br />
SSources: DRV DRV, ACTI Schumacher, S h h DOWJ DOWJones, B<strong>BayWa</strong> W<br />
16
17<br />
Trend of market prices<br />
Urea CAN<br />
Granulated urea ex Baltic Sea Ports Ports,<br />
Calcium ammonium nitrate ex Baltic Sea Ports Ports,<br />
02/11/2010<br />
02/11/2010
18<br />
<strong>BayWa</strong> Building<br />
Materials<br />
� Building Materials<br />
� DIY & Garden d Centres
19<br />
Development in 1-9/2010<br />
Development p of Buildingg Materials<br />
� Slow start to the season due to the weather and project delays (Q3)<br />
� Increase in modernisation and refurbishment activities in residential construction<br />
� Increase in the warehousing business over the course of the year<br />
� As from Q3, result positive<br />
Development p of DIY & Garden Centres<br />
� Catching up effect in the retail business (Q3)<br />
� Optimisation of product mix having positive effects<br />
� Very good start to business of refurbished garden centres in Backnang, Illertissen and<br />
Grafenau<br />
� Garden business suffered from cold weather in the spring
20<br />
[in EUR m]<br />
1.500<br />
1.000<br />
500<br />
0<br />
[in EUR m]<br />
1,341<br />
986<br />
355<br />
1‐9/2009<br />
16 16.33<br />
7.9<br />
7.5%<br />
2.5%<br />
1,441<br />
1,024<br />
417<br />
1‐9/2010<br />
16 16.77<br />
6.8<br />
1‐9/2009 1‐9/2010<br />
<strong>Revenues</strong> and EBIT in 1-9 2010 against previous year<br />
Baustoffe<br />
B&G<br />
Baustoffe<br />
B&G<br />
<strong>Revenues</strong><br />
� Building Materials ∆ 10/09: EUR + 38 million (+3.9%)<br />
Increase in roof business and tradingg in solar components p<br />
Slight economic recovery in the construction sector<br />
� DIY & Garden Centres ∆ 10/09: EUR + 62 million (+17.5%)<br />
EBIT<br />
Sales growth through larger sales area and product mix<br />
optimisation<br />
� Building Materials ∆ 10/09: EUR -1.1 million (-13.9%)<br />
Delays in projects and due to the weather<br />
� DIY&Garden Centres ∆ 10/09: EUR +1.5 million (+17.8%)<br />
Increase in profit due to non-recurrent costs for opening<br />
new centres
21<br />
Year-on-year comparison<br />
in EUR m 1-9 2007 1-9 2008 1-9 2009 1-9 2010 ∆10/09 (%)<br />
<strong>Revenues</strong> 1,281.4<br />
EBITDA 40.3<br />
1,354.6<br />
45.0<br />
1,341.1<br />
41.2<br />
1,441.4<br />
39.8<br />
7.5%<br />
-3.4%<br />
% of <strong>Revenues</strong> 3.1% 3.3% 3.1% 2.8%<br />
EBIT 17.7 20.2 16.4 16.8 2.4%<br />
% of <strong>Revenues</strong> 1.4% 1.5% 1.2% 1.2%<br />
EBT 65 6.5<br />
75 7.5<br />
76 7.6<br />
80 8.0 53% 5.3%<br />
% of <strong>Revenues</strong> 0.5% 0.6% 0.6% 0.6%
22<br />
<strong>BayWa</strong> Energy<br />
� Fuel<br />
� Heating oill<br />
� Lubricants<br />
� Solid biofuels<br />
�� <strong>BayWa</strong> rr.e e
23<br />
Development in 1-9/2010<br />
Development of Energy (conventional)<br />
� Rising demand for heating oil from H2 onwards<br />
� At the end of Q3, levels of filling tanks in private households still slightly below average<br />
levels for the time of the year (around 60%)<br />
� Fuel oil: margin trend remains stable<br />
� Development of lubricants business higher y/y due to influence of economy<br />
Development of <strong>BayWa</strong> r.e<br />
� DDevelopment l t off B<strong>BayWa</strong> W r.e iin li line with ith plan l<br />
� Profit generated in particular by solar business<br />
� First project sale (La BenateWind Park in France)<br />
� Completion of on-roof solar plant in Barcelona‘s harbour
2.000<br />
1.500<br />
1.000<br />
24<br />
[in EUR m]<br />
500<br />
0<br />
[in EUR m]<br />
11,367 367<br />
26.8%<br />
<strong>Revenues</strong> and EBIT in 1-9 2010 against previous year<br />
1,734<br />
1,525<br />
209<br />
1‐9/2009 1‐9/2010<br />
10.1%<br />
15 15.22<br />
5.4<br />
1‐9/2009 1‐9/2010<br />
Konv. Energie<br />
<strong>BayWa</strong> r.e<br />
Konv. Energie<br />
<strong>BayWa</strong> r.e<br />
<strong>Revenues</strong><br />
� Energy (conventional) ∆ 10/09: EUR + 158 million (+11.6%)<br />
� Pi Price-induced i d d iincrease iin revenue ffrom conventional ti l ttrading di<br />
� Rising volume of sales from lubricants<br />
� <strong>BayWa</strong> r.e: EUR + 209 million<br />
� Solar boom due to cuts in a feed-in tariffs at mid-year drives<br />
<strong>BayWa</strong> r.e‘s revenues<br />
EBIT<br />
� Energy (conventional) ∆ 10/09: EUR -8.4 million (-60.9%)<br />
� Volume-induced decline; demand for heating oil still modest<br />
owing to high oil prices<br />
� <strong>BayWa</strong> r.e: EUR + 9.8 million<br />
� Profit contribution by MHH Solartechnik of around EUR 9.5<br />
million
25<br />
Year-on-year comparison<br />
in EUR m 1-9 2007 1-9 2008 1-9 2009 1-9 2010 ∆10/09 (%)<br />
<strong>Revenues</strong> 1,271.5<br />
EBITDA 9.0<br />
1,837.3<br />
13.0<br />
1,366.8<br />
20.1<br />
1,734.8<br />
25.1<br />
26.9%<br />
24.9%<br />
% of <strong>Revenues</strong> 0.7% 0.7% 1.5% 1.4%<br />
EBIT 3.4<br />
7.0 13.8 15.2 10.1%<br />
% of <strong>Revenues</strong> 0.3% 0.4% 1.0% 0.9%<br />
EBT 25 2.5<br />
74 7.4 13 13.0 0 13 13.3 3 23% 2.3%<br />
% of <strong>Revenues</strong> 0.2% 0.4% 1.0% 0.8%
26<br />
<strong>BayWa</strong> Other<br />
Activities<br />
Food production
27<br />
[in EUR m]<br />
[in EUR m]<br />
337<br />
‐67.7%<br />
109<br />
1‐9/2009 1‐9/2010<br />
3.3%<br />
1‐9/2009 1‐9/2010<br />
<strong>Revenues</strong> and EBIT in 1-9 2010 against previous year<br />
<strong>Revenues</strong><br />
� Ybbstaler: EUR 74.1 million<br />
� Frisch & Frost: EUR 34 million<br />
� ∆ 10/09: EUR -228 million (-67.6%)<br />
�� Decline in revenues due to disposal of car dealer operations<br />
as from 1 October 2009<br />
EBIT<br />
� ∆ 10/09: EUR +0.3 million (+3.3%)<br />
� Increase in profit through disposal of Animedica stake<br />
� Ergebnis Frisch & Frost around EUR 2 million lower y/y<br />
�� Disposal of car dealer operations: benefited from scrap<br />
premium in 2009<br />
� Ybbstaler around EUR 0.2 million lower y/y
28<br />
Year-on-year comparison<br />
in EUR m 1-9 2007 1-9 2008 1-9 2009 1-9 2010 ∆10/09 (%)<br />
<strong>Revenues</strong> 310.3<br />
EBITDA 39.1<br />
371.5<br />
20.9<br />
336.7<br />
19.0<br />
108.8<br />
18.0<br />
-67.7%<br />
-5.3%<br />
% of <strong>Revenues</strong> 12.6% 5.6% 5.7% 16.5%<br />
EBIT 29.9 11.2<br />
9.2<br />
9.5 3.3%<br />
% of <strong>Revenues</strong> 9.6% 3.0% 2.7% 8.8%<br />
EBT 26 26.4 4 91 9.1<br />
78 7.8<br />
85 8.5 90% 9.0%<br />
% of <strong>Revenues</strong> 8.5% 2.4% 2.3% 7.8%
29<br />
Outlook in 2010<br />
<strong>BayWa</strong> Agriculture<br />
� Good grain sales potential due to inventory stockpiles<br />
� Collection and storage business likely to be weaker than in 2009<br />
� Grain prices: sideways movement anticipated at a high level<br />
� Stable incoming liquidity boosts operating resources and agricultural equipment business<br />
� Agriculture Segment : anticipates an increase in revenues and profits as against the year-earlier<br />
figures<br />
B<strong>BayWa</strong> W BBuilding ildi Materials<br />
M t i l<br />
� Building Materials: delaying effects likely to boost performance in the final quarter<br />
� Overall development of the Building Materials business unit falls short of expectations despite<br />
possibility of increase as against the year-earlier figure<br />
� DIY&GC: slight growth anticipated from optimisation of product mix and DIY and garden centres<br />
� Consumer behaviour more stable owing to economic situation<br />
� Building Materials Segment: following quarters depend greatly on the weather and the economy<br />
<strong>BayWa</strong> Energy<br />
� Fuel: winter quarter likely to boost order volumes further (heating oil)<br />
� Record result in 2009 from conventional energy gy business cannot be repeated p<br />
(higher oil prices as against previous year – weaker consumer demand and margins)<br />
� Further reductions of tariffs under the German Renewable Energies Act (EEG) to provide<br />
stimulus for the solar business before the year ends<br />
� Completion and sale of projects (and plants) planned for the final quarter<br />
� <strong>BayWa</strong> r.e‘s EBIT target of EUR 20 million on track
30<br />
The <strong>BayWa</strong> Share
31<br />
<strong>BayWa</strong> Share<br />
Share price performance<br />
from 30/09/2009 until 01/11/2010<br />
Share<br />
Share<br />
Closing price on 30/09/2009 € 25.03<br />
High (01/11/2010) € 31.50<br />
Low (28/10/2009) € 21.47<br />
Closing price on 30/09/2010 € 30.23<br />
Market capitalisation in € million<br />
As per p 30/09/2009 683.47<br />
As per 30/09/2010<br />
Free float market cap.<br />
1,031.10<br />
(30/09/2010) 407.77
32<br />
<strong>BayWa</strong> Share 2010<br />
Shareholder structure as per 30/09/2010<br />
Free float<br />
39.55<br />
35.33<br />
Raiffeisen Agrar<br />
Invest GmbH<br />
25.12<br />
Bayerische<br />
Raiffeisen‐<br />
Beteiligungs AG<br />
More information on the <strong>BayWa</strong> share and share capital<br />
Sept. 2010<br />
Stock exchanges Frankfurt, Munich, Xetra<br />
Segment Official Market/Prime Standard<br />
Stock exch. index MDAX (Sec. code no. 519406)<br />
ISIN DE0005194062<br />
Share capital EUR 87,307,622.40<br />
Number of shares 34,104,540<br />
Denomination No-par No par value shares with an arithmetical portion of<br />
EUR 2.56 each in the share capital<br />
Securitisation<br />
In the form of a global certificate deposited with<br />
Clearstream Banking AG. Shareholders participate<br />
as co-owners corresponding to the number of<br />
shares held (collective custody account)
33<br />
Financial Calendar 2010/11<br />
November 2010<br />
11/11 B<strong>BayWa</strong> W AG PPress CConference f Q3<br />
11/11 <strong>BayWa</strong> AG<br />
March 2011<br />
Analysts‘ Conference Call Q3<br />
30/03 <strong>BayWa</strong> AG Annual Results Press Conference<br />
31/03 Frankfurt a.M. a M<br />
May 2011<br />
Analysts‘ Analysts Conference<br />
12/05 <strong>BayWa</strong> AG Press Release Q1<br />
12/05 <strong>BayWa</strong> AG<br />
June 2011<br />
Analysts‘ Conference Call Q1<br />
15/06 ICM, München<br />
August 2010<br />
Annual General Meeting of Shareholders<br />
04/08 <strong>BayWa</strong> AG Press Conference, Half-yearly Results<br />
04/08 <strong>BayWa</strong> AG Analysts‘ Analysts Conference Call<br />
November 2011<br />
10/11 <strong>BayWa</strong> AG Press Conference Q3<br />
10/11 <strong>BayWa</strong> AG Analysts‘ Conference Call Q3
34<br />
Investor Relations Manager<br />
Josko Radeljic<br />
Arabellastr. 4<br />
D-81925 München<br />
Phone: +49 (0)89 ( ) / 92 22 - 38 87<br />
Fax: +49 (0)89 / 92 12 - 38 87<br />
Investor Relations contact<br />
e-mail: investorrelations@baywa.de
35<br />
Disclaimer<br />
� The information in this presentation is partly made up of forward-looking statements which<br />
are bbased d on assumptions ti and d are subject bj t tto unforeseeable f bl risks. i k<br />
� In as much as the assumptions on the successful integration of acquisitions and on the<br />
internal growth of the company should prove to be inaccurate, or should other<br />
unforeseeable risks occur, the possibility of the assets, financial position and results of<br />
operations p of the Group p diverging g g negatively g y from the target g figures g cited in this<br />
presentation should not be discounted.<br />
� <strong>BayWa</strong> AG can therefore undertake no guarantee that the actual development of the net<br />
worth, financial position and results of operations of the Group will concur with the target<br />
figures described in this presentation.


