
Create successful ePaper yourself
Turn your PDF publications into a flip-book with our unique Google optimized e-Paper software.
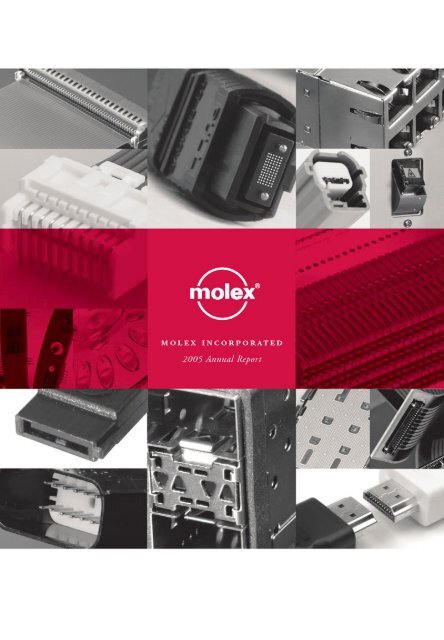
<strong>Molex</strong> <strong>2005</strong> Annual Report<br />
T O O U R S H A R E H O L D E R S<br />
Fiscal <strong>2005</strong> was a year of highs and<br />
lows for <strong>Molex</strong>. We achieved record<br />
revenue and expanded our marketshare,<br />
customer base and industries served.<br />
Conversely, we weathered a series of<br />
very difficult challenges that led to<br />
realignment of our manufacturing<br />
footprint and acceleration of our management<br />
succession plan. Through it<br />
all, the people of <strong>Molex</strong>, our customers<br />
and our shareholders demonstrated<br />
their resiliency, loyalty and confidence<br />
in our ability to manage through<br />
change and move the company forward.
F I N A N C I A L P E R F O R M A N C E<br />
For the year ended June 30, <strong>Molex</strong><br />
achieved all-time-high sales of $2.55<br />
billion, a year-over-year increase of<br />
$301.9 million or 13.4%. Our revenue<br />
growth outpaced that of the overall<br />
connector industry by almost two to one.<br />
Net income, including a pretax charge<br />
discussed below, was $154.4 million,<br />
down 12.2% from the previous year.<br />
Our results include a pretax charge of<br />
$27.9 million taken in the fourth quar-<br />
ter for expenses associated with facility<br />
closures and related workforce reduc-<br />
tions. We anticipate another $15 million<br />
to $25 million will be necessary in fiscal<br />
2006 as we complete the phased trans-<br />
fer of production. The fiscal <strong>2005</strong> results<br />
also include $25.2 million in pretax asset<br />
impairment charges, as well as $9.9 million<br />
in pretax legal, accounting and other costs<br />
arising from the resignation of our former<br />
auditors.<br />
Increasing our profitability remained<br />
a challenge in fiscal <strong>2005</strong>. Net profit on<br />
sales, including the pretax charges, was<br />
6.1%, down from 7.8% the year before.<br />
Rapidly escalating raw materials costs<br />
and relentless competitive pricing pres-<br />
sure squeezed margins as never before.<br />
Although we implemented offsetting<br />
price increases to our distribution sales<br />
channel, we have not been as successful<br />
with the majority of our business. Our<br />
client mix skews heavily toward large<br />
global accounts and industries that make<br />
raising prices more difficult.<br />
<strong>Molex</strong> <strong>2005</strong> Annual Report<br />
T O O U R S H A R E H O L D E R S<br />
2<br />
B U S I N E S S D E V E L O P M E N T S<br />
<strong>Molex</strong> is the second largest connector<br />
company in the world in terms of<br />
revenue, with approximately 8% of the<br />
$33.7 billion industry in fiscal <strong>2005</strong>. The<br />
connector market grew nearly 7%, and we<br />
advanced our share nearly twice that rate.<br />
Capitalizing on key trends. <strong>Molex</strong>’s core<br />
strengths and competencies were a worthy<br />
match for the dynamic <strong>2005</strong> market-<br />
place. Customer supplier consolidation<br />
continued unabated, but our global<br />
presence, comprehensive product line<br />
and attention to quality and service kept<br />
us above the cut. As technology conver-<br />
gence further blurred the lines between<br />
data products, telecommunications, medical<br />
and industrial applications, we were<br />
able to cross-sell products designed for<br />
one industry into another. We offset<br />
the automotive industry’s lower output<br />
by winning programs that increased the<br />
electronic content in vehicles. Greater<br />
functionality in virtually everything<br />
electronic, especially consumer products,<br />
presented us with numerous avenues for<br />
demonstrating our leadership in high-<br />
density, high-performance connectors,<br />
as well as microminiature and digital<br />
technologies.<br />
Diversifying our business mix. During the<br />
year, we built on our relationships with<br />
existing customers and established rela-<br />
tionships with hundreds of new customers<br />
in industries of strongest growth. These
Sales by Industry<br />
27% Telecommunications<br />
24% Data Products<br />
19% Automotive<br />
18% Consumer<br />
9% Industrial<br />
3% Other<br />
3
include <strong>Molex</strong> mainstays such as con-<br />
sumer electronics, mobile phones and<br />
computers. We also increased our share<br />
of the global automotive market and<br />
industrial accounts. As a result of our<br />
demand creation efforts, we further pen-<br />
etrated markets relatively new to <strong>Molex</strong><br />
such as medical electronics and non-<br />
automotive transportation. For the first<br />
time, we began selling to the commercial<br />
military market, providing standardized<br />
products for communications equip-<br />
ment, computers and vehicles.<br />
Valuating our brand. A <strong>2005</strong> study we<br />
commissioned asked customers and non-<br />
customers what matters most to them<br />
in a connector supplier and how <strong>Molex</strong><br />
measures up against those attributes.<br />
Respondents ranked us number one<br />
globally in overall performance, citing<br />
more positive experiences with <strong>Molex</strong><br />
than any other brand. The survey also<br />
determined <strong>Molex</strong> to be the most recog-<br />
nized connector brand in the Americas<br />
and second most recognized name in<br />
Europe and the Far East South. Although<br />
we rated high in many areas, the study<br />
Net Revenue<br />
(in thousands of dollars)<br />
$ 2 , 5 4 8 , 6 5 2<br />
$ 2 , 2 4 6 , 7 1 5<br />
$ 1 , 8 4 3 , 0 9 8<br />
$ 1 , 7 1 1 , 4 9 7<br />
$ 2 , 3 6 5 , 5 4 9<br />
05 04 03 02 01<br />
<strong>Molex</strong> <strong>2005</strong> Annual Report<br />
T O O U R S H A R E H O L D E R S<br />
Net Income<br />
(in thousands of dollars)<br />
$ 1 5 4 , 4 3 4<br />
$ 1 7 5 , 9 5 0<br />
4<br />
$ 8 4 , 9 1 8<br />
05 04 03 02 01<br />
found plenty of room for improvement<br />
and gave us concrete benchmarks for<br />
tracking progress.<br />
P R O F I T A B I L I T Y I N I T I A T I V E S<br />
As sales for the year attest, we did a<br />
good job of identifying and attracting<br />
new business. But revenue growth is<br />
only half the challenge. We are in the<br />
midst of aggressive measures to effect<br />
higher returns on assets and revenue. We<br />
anticipate that when completed in 2006,<br />
the plant closures, consolidations and<br />
attendant workforce reductions currently<br />
underway should save us approximately<br />
$35 million pretax annually.<br />
Realigning our manufacturing footprint.<br />
After the tech bubble burst, we were left<br />
with excess capacity, which was com-<br />
pounded by the outflow of manufacturing<br />
from the U.S. and Western Europe to<br />
lower-cost regions. Fewer trade barriers,<br />
lower freight costs and streamlined supply<br />
chain logistics have made conducting<br />
business across countries and conti-<br />
nents far easier, so we no longer need to<br />
duplicate assets to serve customers. For<br />
$ 7 6 , 4 7 9<br />
$ 2 0 3 , 9 1 9<br />
Net Income<br />
(as a percent of net revenue)<br />
6 . 1 %<br />
7 . 8 %<br />
4 . 6 %<br />
4 . 5 %<br />
8 . 6 %<br />
05 04 03 02 01
these reasons, over the past few years,<br />
our strategy has been to consolidate<br />
multiple plants of modest size in fa-<br />
vor of operating fewer, larger and fully<br />
integrated facilities in strategic locations<br />
around the world.<br />
In <strong>2005</strong>, we began closing certain<br />
facilities in the U.S. and Europe and<br />
transferring production to existing plants<br />
within the same regions. Specifically, we<br />
will cease manufacturing in our Detroit<br />
automotive facility, but will keep the<br />
development center open. We also are<br />
closing an industrial products plant in<br />
New England. Additionally, we are clos-<br />
ing facilities in Ireland and Portugal and<br />
reducing the size of our development<br />
center in Germany.<br />
<strong>Molex</strong> was one of the first companies<br />
in our industry to manufacture in the<br />
Far East. Today, we operate six plants in<br />
China, including our Shanghai factory,<br />
which is undergoing a second expansion<br />
for a total of more than half a million<br />
square feet. When our seventh China<br />
factory opens in 2007, it will contain<br />
nearly 700,000 square feet and be our<br />
largest plant worldwide. Now, 40% of<br />
Return on Beginning<br />
Stockholders’ Equity<br />
7 . 5 %<br />
9 . 3 %<br />
<strong>Molex</strong> <strong>2005</strong> Annual Report<br />
T O O U R S H A R E H O L D E R S<br />
4 . 6 %<br />
4 . 3 %<br />
1 2 . 0 %<br />
05 04 03 02 01<br />
5<br />
our manufacturing capacity is in lower-<br />
cost areas such as China, Eastern Europe<br />
and Mexico.<br />
Investing in new products. Our new<br />
products not only boost sales and ensure<br />
our future, they also command the<br />
highest profit margins. In fiscal <strong>2005</strong>,<br />
we commercialized 384 products; that’s<br />
an average of more than one per day.<br />
We also were granted a record 775 patents<br />
worldwide. New releases–products intro-<br />
duced in the past three years–accounted<br />
for 30% of fiscal <strong>2005</strong> revenue. We intend<br />
to continue our industry-leading rate of<br />
investment in research and development<br />
to maintain that level in the year ahead.<br />
Reducing SG&A. Although our selling,<br />
general and administrative expense has<br />
improved, we believe that at more than<br />
24% of sales, it is still too high. As we<br />
continue to streamline our organization,<br />
our target is to become more efficient<br />
and cost effective and drive down our<br />
SG&A rate steadily over time.<br />
In all our operations, we are using<br />
the <strong>Molex</strong> Global Information System<br />
Capital Expenditures<br />
(in thousands of dollars)<br />
$ 2 3 0 , 8 9 5<br />
$ 1 8 9 , 7 2 4<br />
$ 1 7 1 , 1 9 3<br />
$ 1 7 2 , 4 9 7<br />
$ 3 7 6 , 3 0 0<br />
05 04 03 02 01
to identify areas in which we can exert<br />
greater expense control. Our goal is to<br />
manage our spending more efficiently<br />
and bring it to a level that is both com-<br />
petitive and sustainable.<br />
Hand-in-hand with these profitability<br />
initiatives is our stock buyback program,<br />
which gives us an additional avenue for<br />
enhancing shareholder return. The Board<br />
of Directors has authorized the company<br />
to invest our cash assets in repurchasing<br />
up to $250 million of <strong>Molex</strong> shares on<br />
a discretionary basis during the period<br />
ending December 31, 2006.<br />
R E G I O N A L R E V I E W<br />
Americas. Sales in the region grew a<br />
modest 2% for the fiscal year, reflecting<br />
the accelerated movement offshore of<br />
original equipment and contract manu-<br />
facturers. Although most of that business<br />
remained within <strong>Molex</strong>, it contributed<br />
to sales in other regions and depressed<br />
Americas results. We offset the revenue<br />
loss with an increase in sales through<br />
distribution, growth in our industrial and<br />
high-performance products and the stron-<br />
gest new product lineup in two decades.<br />
Sales in the connector group, our<br />
largest business, were essentially flat,<br />
but profitability improved due to new<br />
products and efforts to keep process<br />
costs down. Integrated product sales<br />
once again grew faster than connector<br />
sales. The biggest boost came from high-<br />
performance cables and fiber optics<br />
products for data, storage, testing and<br />
medical applications, as well as for the<br />
<strong>Molex</strong> <strong>2005</strong> Annual Report<br />
T O O U R S H A R E H O L D E R S<br />
6<br />
telecommunications market, which has<br />
finally stabilized.<br />
Automotive suffered a fifth year of<br />
revenue decline, but we believe that is<br />
about to change. We anticipate sales will<br />
grow approximately 8% in fiscal 2006,<br />
as we begin to reap the benefits of work-<br />
ing with Singapore, Japan and China on<br />
major programs for global customers.<br />
Our cost structure will improve signifi-<br />
cantly from closing our Detroit plant and<br />
redistributing manufacturing to optimize<br />
our other U.S. factories and integrated<br />
products capabilities in Mexico. At the<br />
same time, by expanding our develop-<br />
ment centers in Detroit and at Lisle head-<br />
quarters, we will keep design activity near<br />
our customers.<br />
We have identified and begun work-<br />
ing with new customers and industries<br />
with significant long-term potential,<br />
including medical electronics, commer-<br />
cial military and value-added resellers<br />
that manufacture and sell domestically.<br />
We anticipate an increase in revenue in<br />
2006, propelled by growth in our core<br />
markets, greater traction in new applica-<br />
tions and several automotive programs<br />
that are moving into production. As<br />
our manufacturing costs come down, we<br />
expect profitability to improve.<br />
Far East North. (Japan and Korea) Rev-<br />
enue increased 5% in U.S. dollars and<br />
held steady in local currencies. A robust<br />
business environment in Japan, a recov-<br />
ering economy in Korea and a steady<br />
flow of new products stimulated sales.
29<br />
Development<br />
Groups<br />
Design Centers<br />
24<br />
Locations<br />
5<br />
16<br />
Countries
Consumer electronics remained <strong>Molex</strong><br />
Japan’s strongest business, from digital<br />
still cameras and portable audio players<br />
to game machines and plasma display<br />
panels for flat screen TVs. Growth also<br />
came from hard disk drives and printers<br />
for the data market.<br />
During the year, we further capitalized<br />
on our ability to design more compact,<br />
higher performance products for the<br />
sophisticated end of the mobile phone<br />
market. We are developing all new con-<br />
nectors for third generation phones,<br />
which in Japan include such high-speed<br />
capabilities as a TV function in addition<br />
to a camera. As more global phone mak-<br />
ers move to 3G technology, we are well<br />
positioned to grow sales substantially.<br />
The industrial side of our business<br />
continued to expand, driven by servo<br />
motors and customer investment in new<br />
semiconductor equipment. In automo-<br />
tive, we had several design wins in Japan,<br />
but in Korea, where we have longstand-<br />
ing relationships with major automakers,<br />
the sluggish economy stalled growth.<br />
Integrated products saw a healthy<br />
increase in volume. To counter pricing<br />
Research and Development<br />
(in thousands of dollars)<br />
$ 1 3 3 , 5 9 5<br />
$ 1 1 9 , 0 2 8<br />
<strong>Molex</strong> <strong>2005</strong> Annual Report<br />
T O O U R S H A R E H O L D E R S<br />
$ 1 1 6 , 9 8 6<br />
$ 1 1 1 , 7 7 1<br />
$ 1 3 4 , 6 3 7<br />
05 04 03 02 01<br />
8<br />
pressure, we fulfill most of this demand<br />
from <strong>Molex</strong> Japan’s plant in Dalian,<br />
China, which completed a 60% capacity<br />
expansion.<br />
<strong>Molex</strong> Korea benefited from modest<br />
strength in the electronics industry and<br />
overall connector market. However, our<br />
sales for personal computers slowed.<br />
For fiscal 2006, the Far East North<br />
region anticipates single-digit growth,<br />
largely from consumer electronics and<br />
mobile phones.<br />
Far East South. (Singapore, Malaysia,<br />
China, Thailand, Taiwan and India) In<br />
<strong>Molex</strong>’s fastest growing region, sales rose<br />
23% year over year in U.S. dollars and<br />
22% in local currencies. Global customers<br />
increasing their design and manufacturing<br />
volume in the region, greater penetration<br />
of Taiwanese multinational accounts and<br />
a bigger share of the world’s mobile phone<br />
industry drove growth.<br />
Mobile phones constitute nearly one-<br />
third of Far East South sales. Another<br />
important customer segment is the con-<br />
sumer electronics industry. During the<br />
year, we introduced a new set of products<br />
Customer Revenue Americas<br />
(in thousands of dollars)<br />
$ 7 0 1 , 4 7 0<br />
$ 6 8 6 , 1 2 9<br />
$ 6 4 1 , 1 9 7<br />
$ 6 6 6 , 2 7 2<br />
05 04 03 02 01<br />
$ 1 , 0 4 1 , 4 6 1
that keep pace with the ongoing migra-<br />
tion from analog to digital technology.<br />
We are coordinating opportunities with<br />
our <strong>Molex</strong> counterparts in Japan to have<br />
these products designed in the Far East<br />
North, then produced in China.<br />
In the data, networking and computing<br />
arena, we shifted our focus from telecom-<br />
munications infrastructure equipment to<br />
the far stronger server market. We also<br />
grew in our traditional niche of personal<br />
computers and notebooks.<br />
Our automotive business, although still<br />
in its early stages, is accelerating. We grew<br />
our product pipeline to five times what it<br />
was in 2004. The Big 3 U.S. automakers<br />
and their suppliers moving to China want<br />
local design, procurement and production,<br />
which we can provide. In 2007, when our<br />
plant in western China opens in Chengdu–<br />
considered the Detroit of China–<br />
it will supply the automotive industry,<br />
as well as manufacture a full range of<br />
<strong>Molex</strong> products. To offer customers a<br />
complete solution, we maintain a balance<br />
between high-precision, high-technology<br />
manufacturing in Singapore and com-<br />
moditized capability in China.<br />
Customer Revenue<br />
Far East North<br />
(in thousands of dollars)<br />
$ 5 2 3 , 7 1 7<br />
$ 4 9 9 , 3 4 8<br />
$ 4 0 7 , 8 2 1<br />
$ 3 5 1 , 5 4 2<br />
05 04 03 02 01<br />
$ 4 9 9 , 2 6 5<br />
<strong>Molex</strong> <strong>2005</strong> Annual Report<br />
T O O U R S H A R E H O L D E R S<br />
Customer Revenue<br />
Far East South<br />
(in thousands of dollars)<br />
$ 7 6 9 , 2 1 8<br />
$ 6 2 3 , 6 1 9<br />
9<br />
$ 4 5 8 , 8 1 9<br />
Our outlook is very positive. Chinese<br />
consumption is strong and growing.<br />
India, which has the potential to become<br />
a more important market for us, is<br />
attracting many additional offshore<br />
manufacturers. Overall, we anticipate a<br />
double-digit revenue increase in the year<br />
ahead, as our investments in design,<br />
tooling and manufacturing allow us to<br />
meet the demands of our expanding<br />
customer base.<br />
05 04 03 02 01<br />
Europe. Despite difficult economies and<br />
the ongoing exodus of manufacturing<br />
to the Far East, our European region<br />
increased revenue 31% in U.S. dollars<br />
and 22% in local currencies. Our 2004<br />
French automotive acquisition generated<br />
about a quarter of that growth.<br />
The European connector market<br />
is expanding, albeit at a single-digit<br />
pace. We are focused on the strongest<br />
markets and business most likely to stay<br />
in Europe. That includes connectors<br />
and integrated products for industrial,<br />
medical and automotive applications.<br />
Integrated products now account for<br />
25% of our revenue.<br />
$ 3 6 6 , 3 5 2<br />
$ 3 8 9 , 1 0 8<br />
Customer Revenue<br />
Europe<br />
(in thousands of dollars)<br />
$ 5 0 4 , 4 5 3<br />
$ 3 8 5 , 0 5 1<br />
$ 2 9 1 , 0 4 3<br />
$ 2 7 9 , 4 7 7<br />
$ 3 7 8 , 1 9 9<br />
05 04 03 02 01
During the year, we won projects from<br />
customers engaged in land- and marine-<br />
based oil exploration, as well as manu-<br />
facturers requiring <strong>Molex</strong> products for<br />
industrial controls, testing equipment and<br />
power management. We also increased<br />
our business with the only major mobile<br />
phone company still producing in Europe.<br />
In automotive, our acquisition gave<br />
us a needed boost in both sales and<br />
marketshare. We believe the trend for<br />
European automakers, at least for the<br />
next five years, is to be locally based and<br />
rely on local distribution. We are in a<br />
good position to fulfill this need with a<br />
well-rounded connector portfolio and<br />
robust new product pipeline.<br />
Key initiatives include improving<br />
capacity utilization, shifting more manu-<br />
facturing to our Eastern European loca-<br />
tions and using Six Sigma methodology<br />
to eliminate waste and enhance quality.<br />
Additionally, we are ahead of schedule<br />
with introducing lead-free products<br />
and have assured our customers we will<br />
deliver well in advance of the European<br />
compliance deadline.<br />
We see much the same for fiscal 2006:<br />
European economies should remain flat,<br />
and manufacturing will continue to<br />
move offshore. Our growth likely will<br />
stem from internal profitability measures<br />
and a continued push into automotive<br />
and industrial markets.<br />
T R A N S I T I O N S<br />
Among the many challenges we addressed<br />
during the year was the resignation of<br />
<strong>Molex</strong> <strong>2005</strong> Annual Report<br />
T O O U R S H A R E H O L D E R S<br />
1 0<br />
our former auditor. We also needed to<br />
prepare for compliance with the inter-<br />
nal controls over financial reporting<br />
required by the Sarbanes-Oxley Act.<br />
Our new firm, Ernst & Young LLP,<br />
recently completed its audit of <strong>Molex</strong>’s<br />
fiscal <strong>2005</strong>, 2004 and 2003 financial<br />
statements and management’s assessment<br />
of the effectiveness of our internal controls<br />
over financial reporting for fiscal <strong>2005</strong>. As<br />
we expected, the additional audit of our<br />
financial statements did not result in any<br />
restatement of prior years’ earnings.<br />
We believe that both results and the<br />
manner in which we achieve them are<br />
of great importance. We take our respon-<br />
sibility to shareholders in the areas of<br />
corporate governance, financial reporting<br />
and business integrity very seriously.<br />
To that end, we have implemented a<br />
number of measures to strengthen our<br />
accounting and financial reporting infra-<br />
structure and processes. Working with<br />
PricewaterhouseCoopers LLP, our advisor<br />
on internal controls compliance, we<br />
documented, enhanced and tested our<br />
internal controls over financial reporting.<br />
In July, we welcomed David Landsittel<br />
to the <strong>Molex</strong> Board of Directors. David<br />
has 42 years of experience in public<br />
accounting and was Chairman of the<br />
Auditing Standards Board of the American<br />
Institute of Certified Public Accountants.<br />
He qualifies as an “audit committee<br />
financial expert” under the Sarbanes-<br />
Oxley Act and serves on our Audit<br />
Committee. Prior to David’s joining the<br />
Board, our Audit Committee consulted
Sales by Region<br />
Americas<br />
27.5%<br />
Far East South<br />
30.2%<br />
Far East North<br />
20.5%<br />
Europe<br />
19.8%<br />
New Ventures<br />
2.0%
with independent advisors, including<br />
Charles Bowsher, a former Comptroller<br />
General of the United States. Additionally,<br />
we recently hired a new Corporate Con-<br />
troller, who will serve as our principal<br />
accounting officer and spearhead external<br />
reporting matters, including SEC filings,<br />
and ensure compliance with all accounting<br />
regulations.<br />
Much was accomplished in fiscal <strong>2005</strong>,<br />
and we remain dedicated to continually<br />
review and assess our actions in response<br />
to evolving regulations and best practices.<br />
Introducing the Next Generation of Leadership.<br />
On the first day of our new fiscal year,<br />
Martin Slark assumed the role of Vice<br />
Chairman and Chief Executive Officer.<br />
Martin has had a stellar career since<br />
joining <strong>Molex</strong> in 1976, serving in<br />
administrative, operational and execu-<br />
tive positions in the U.S. and overseas.<br />
Liam McCarthy replaced Martin as our<br />
President and Chief Operating Officer.<br />
Liam has held many functional and execu-<br />
tive positions in all four of our geographic<br />
regions during his outstanding 29-<br />
year career at <strong>Molex</strong>, most recently as<br />
Regional Vice President of our European<br />
operations. In May <strong>2005</strong>, we welcomed<br />
back David Johnson as Vice President,<br />
Treasurer and Chief Financial Officer.<br />
His experience includes 12 years with<br />
<strong>Molex</strong> in financial and accounting man-<br />
agement positions, as well as nine years<br />
Martin P. Slark<br />
V I C E C H A I R M A N A N D<br />
C H I E F E X E C U T I V E O F F I C E R<br />
<strong>Molex</strong> <strong>2005</strong> Annual Report<br />
T O O U R S H A R E H O L D E R S<br />
Fred A. Krehbiel<br />
C O - C H A I R M A N<br />
O F T H E B O A R D<br />
1 2<br />
as Chief Financial Officer and Treasurer of<br />
another publicly traded company. <strong>Molex</strong><br />
has had strong leadership throughout its<br />
history. We are confident that Martin,<br />
Liam and Dave will continue this tradition.<br />
Regionally, Werner Fichtner, President<br />
of our European operations for 23<br />
years, retired at the end of fiscal <strong>2005</strong>.<br />
We thank Werner for his many contri-<br />
butions to <strong>Molex</strong>. Succeeding him is<br />
Graham Brock, a 28-year <strong>Molex</strong> veteran,<br />
who most recently served as Europe’s<br />
Vice President of Sales and Marketing.<br />
We also announced the timing of the<br />
retirement of Ron Schubel, who for the<br />
past seven years has been President of<br />
the Americas, capping his 23-year career<br />
at <strong>Molex</strong>. Ron will begin transferring his<br />
duties to Dave Root in October and retire<br />
a year later. Dave, who also began at<br />
<strong>Molex</strong> 23 years ago, is Vice President of<br />
Sales and Marketing in the Americas.<br />
S T R A T E G I E S F O R O U R F U T U R E<br />
We view fiscal 2006 as a transition year.<br />
We will maintain the financial and<br />
market momentum gained in <strong>2005</strong> and<br />
follow through on the positive changes<br />
underway. The new management team<br />
already has begun implementing fresh<br />
ideas and innovative approaches that will<br />
take <strong>Molex</strong> to the next level of success.<br />
The Leadership Roundtable that begins<br />
on the next page offers additional insight<br />
into their vision, goals and strategies.<br />
John H. Krehbiel, Jr.<br />
C O - C H A I R M A N<br />
O F T H E B O A R D
L E A D E R S H I P<br />
R O U N D T A B L E<br />
with<br />
m a r t i n s l a r k ,<br />
l i a m m c c a r t h y<br />
and<br />
d a v i d j o h n s o n
Martin Slark<br />
v i c e c h a i r m a n a n d c h i e f e x e c u t i v e o f f i c e r<br />
In his 29-year career with <strong>Molex</strong>, Martin has held administrative, operational and<br />
executive positions, internationally and domestically. His proven leadership, penchant<br />
for technology, customer-centric focus and understanding of the borderless marketplace<br />
give him a broad platform for directing for success.<br />
Liam McCarthy<br />
p r e s i d e n t a n d c h i e f o p e r a t i n g o f f i c e r<br />
Liam knows the geographic, cultural and operational map of <strong>Molex</strong>. For 29 years,<br />
he has worked on the functional side of our business in all four regions. He uses that<br />
insight to leverage best practices globally to enhance the effectiveness of our operations,<br />
customer service and overall profitability.<br />
David Johnson<br />
v i c e p r e s i d e n t , t r e a s u r e r a n d c h i e f f i n a n c i a l o f f i c e r<br />
Dave spent a dozen years in financial leadership positions in our Far East regions<br />
and New Ventures & Acquisitions Group. He returned to <strong>Molex</strong> after serving as<br />
Chief Financial Officer of a technology and manufacturing firm. His international<br />
and public company experience set a solid foundation for his global<br />
financial responsibilities.
<strong>Molex</strong><br />
<strong>Molex</strong><br />
<strong>2005</strong><br />
<strong>2005</strong><br />
Annual<br />
Annual<br />
Report<br />
Report<br />
L E A D E R S<br />
D<br />
H<br />
I S<br />
I<br />
C<br />
P<br />
U<br />
R<br />
S S<br />
O<br />
I<br />
U<br />
O<br />
N D T A B L E<br />
Key members of <strong>Molex</strong>’s leadership team<br />
met recently with the objective of dissecting<br />
the multiple challenges confronting the<br />
company as it enters fiscal 2006. As importantly,<br />
they discussed their longer-term<br />
vision and how the actions they take in<br />
response to these critical issues will shape<br />
the company in the future. Participating<br />
were Martin Slark, Vice Chairman and<br />
Chief Executive Officer, who assumed that<br />
post from President and Chief Operating<br />
Officer July 1, <strong>2005</strong>; Liam McCarthy, who<br />
succeeded Martin on that date after serving<br />
as Vice President of Operations, Europe;<br />
and David Johnson, who rejoined <strong>Molex</strong><br />
as Vice President, Treasurer and Chief<br />
Financial Officer, effective May 16, <strong>2005</strong>.<br />
1 5
<strong>Molex</strong> <strong>2005</strong> Annual Report<br />
L E A D E R S H I P R O U N D T A B L E<br />
What are the challenges–both internal and external–facing <strong>Molex</strong> today, and how are you<br />
addressing them?<br />
martin I know I speak for each of us in acknowledging that as the new leadership<br />
team at <strong>Molex</strong>, we have a lot of work to do. But I feel it’s equally important to stress<br />
that the company is fundamentally very strong. The platform we have been given to<br />
build on is tremendous–more than 27,000 very talented people around the world, a<br />
company with a single focus on the interconnect industry, a solid number two posi-<br />
tion in a growing industry and a portfolio of more than 100,000 active products.<br />
Don’t forget that we sold 30 billion connectors in fiscal <strong>2005</strong> and generated $2.55<br />
billion in sales.<br />
dave And we have virtually no debt and almost $500 million of cash and marketable<br />
securities on our balance sheet.<br />
liam Add to that the international strength of <strong>Molex</strong>–a great global footprint for serving<br />
customers, expertise around the world and a cross-cultural exchange of best practices.<br />
martin We have a lot going for us, but we have to leverage those strengths and im-<br />
prove our execution.<br />
liam When we consider the multiple challenges we’re up against globally, one of the<br />
most significant is that today we’re in a far more competitive industry, one that is<br />
driven by China-centric pricing, particularly for commodity products.<br />
martin <strong>Molex</strong> is working to overcome the unbalanced recovery we have seen since<br />
the technology bubble burst a few years ago. There’s been far more growth in Asia<br />
than we predicted, so we have a capacity shortage there and excess capacity in Europe<br />
and the Americas. The basic issue is that revenue has shifted faster than our asset base,<br />
and now more than 50% of our revenue comes from Asia. Pre-bubble, the high-end<br />
telecom and high-end computer markets were very profitable for us, but businesses<br />
in capital-investment-driven markets have been slower to recover.<br />
liam We’ve already done a great deal to alleviate the situation. We have six factories<br />
in China and we’re just finishing a large expansion in Shanghai. In fiscal 2007, we’ll<br />
open a seventh plant in Chengdu in western China. In Europe, as our customers<br />
continue to move production overseas, we’ve resized operations to meet our current<br />
level of business and refocused on areas of growth. Europe is still a strong connec-<br />
tor market, but demand is coming from some areas we haven’t concentrated on until<br />
recently like automotive, industrial and medical. At the same time, we’ve improved<br />
productivity in terms of quality, time and materials.<br />
1 6
<strong>Molex</strong> <strong>2005</strong> Annual Report<br />
L E A D E R S H I P R O U N D T A B L E<br />
“There are basically three ways<br />
Martin Slark<br />
p r e s i d e n t a n d c h i e f e x e c u t i v e o f f i c e r<br />
m o l e x i n c o r p o r a t e d<br />
to structure any company:<br />
by geography, by global product line<br />
or by the end-market you service.<br />
<strong>Molex</strong> historically has been organized<br />
1 7<br />
into four geographic regions,<br />
but we need to decide if that’s<br />
the right structure going forward.”<br />
Martin Slark
“<br />
Our challenge is to continue to<br />
leverage <strong>Molex</strong> best practices and use the<br />
global power of the company to drive<br />
improvement at a faster rate.”<br />
Liam McCarthy<br />
<strong>Molex</strong> <strong>2005</strong> Annual Report<br />
L E A D E R S H I P R O U N D T A B L E<br />
1 8
<strong>Molex</strong> <strong>2005</strong> Annual Report<br />
L E A D E R S H I P R O U N D T A B L E<br />
martin <strong>Molex</strong>’s demand creation initiative has been successful in identifying<br />
markets with growth potential. We use our integrated systems to help target oppor-<br />
tunities faster and manage our opportunity pipeline better, so we can capture more<br />
business and gain marketshare.<br />
dave Our integrated systems also give us the ability to track global volumes and<br />
leverage buying power. We’re not as efficient in this as we would like to be, but we’re<br />
determined to improve. We spend 30% of our revenue on materials, and that percent-<br />
age is rising, driven in particular by growth in our integrated products business and<br />
unprecedented increases in the cost of copper, gold and plastics, which moves with<br />
the price of oil. We’ve always offset escalating costs with productivity gains, but these<br />
commodities are going up so fast, it’s harder to do today.<br />
liam We now have our first global director of procurement, which will help us set<br />
worldwide standards for materials and put a structure in place to obtain more aggres-<br />
sive cost reductions from suppliers.<br />
Becoming A Truly Global Company<br />
martin We know we can accomplish more with a limited set of initiatives that we<br />
can get everyone behind. So we’re focusing our energies–and all <strong>Molex</strong>–on four key<br />
areas where we will demonstrate identifiable change in fiscal 2006 and beyond. These<br />
strategic objectives start with making <strong>Molex</strong> truly global. We are very successful in<br />
operating globally, but we’re still struggling with making <strong>Molex</strong> as effective a global<br />
company as we want and need to be.<br />
liam Being truly global offers so many opportunities for uniformity–in quality,<br />
planning, engineering, delivery and project management. Unfortunately, customers<br />
sometimes see a wide disparity in our performance from region to region. We have<br />
customers tell us which <strong>Molex</strong> entity they want to deal with based on their experi-<br />
ence, rather than us telling them which one they should go to based on who will do<br />
the best job for their particular need.<br />
martin There are basically three ways to structure any company: by geography, by<br />
global product line or by the end-market you service. <strong>Molex</strong> historically has been<br />
organized into four geographic regions, but we need to decide if that’s the right<br />
structure going forward. In the past, we designed, manufactured and sold products<br />
primarily within each region, so it made sense to organize and reward people that way.<br />
liam Today, most of our business crosses regional boundaries, so sharing best-in-class<br />
ideas and putting in place measurement systems that motivate and reward the right<br />
behavior become a very different challenge.<br />
1 9
martin We still measure and reward local behavior, but we expect people to act<br />
globally. We have to make sure that our reward system supports actions that optimize<br />
results for us and our customers. For example, <strong>Molex</strong> Japan is an undisputed leader in<br />
microminiature technology, so it’s logical to design all new microminiature products<br />
there. But if volume is significant enough, we might choose to manufacture the prod-<br />
ucts in China and then sell them worldwide. We need measurement and incentive<br />
systems that reward this type of global behavior.<br />
liam We experienced this situation in Europe. When cell phone production moved<br />
to China, we were still doing development work in Ireland, but not getting credit<br />
for any of the revenue or profit. We know we must change this and make our reward<br />
system match our philosophy of design anywhere, make anywhere, sell anywhere.<br />
dave Looking at our financial results this year, people would conclude that our two<br />
Asian regions had a good year and the Americas and Europe had a poor year. But our<br />
Far East South region, without fully supporting attendant costs, benefited from en-<br />
gineering and sales work performed in America and Europe, so profitability ends up<br />
being higher in one region and lower in others. The question remains, how do we set<br />
incentives to be a truly global company? I think the answer will involve a great deal<br />
of cultural change, but if we can implement the right structure, the results should be<br />
well worth the effort.<br />
martin It helps that the three of us have spent significant time in the <strong>Molex</strong> regions.<br />
We’ve all lived and worked overseas for extended periods. Many managers travel to-<br />
day, but it’s not the same as living and working in a country and really getting to<br />
know the people, culture and business practices.<br />
liam Respecting differences is important when applying best practices operationally.<br />
But I believe we can still leverage more standardization across the company without<br />
going against a country’s culture and the entrepreneurial spirit that has always been<br />
a strength of <strong>Molex</strong>.<br />
martin I think the functions that work best today are those with a strong global<br />
structure like finance and IT. With engineering, marketing and quality, we struggle<br />
to share best-in-class ideas.<br />
dave Within <strong>Molex</strong>, all finance personnel report on a direct-line basis up through the<br />
CFO. This structure has enabled us to establish outstanding financial systems, most<br />
notably, the global information system that is fundamental to every aspect of our<br />
business. In completing the assessment of our internal control environment required<br />
by Sarbanes-Oxley, we’ve developed even better processes and more efficient ways to<br />
manage our business.<br />
<strong>Molex</strong> <strong>2005</strong> Annual Report<br />
L E A D E R S H I P R O U N D T A B L E<br />
2 0
<strong>Molex</strong> <strong>2005</strong> Annual Report<br />
L E A D E R S H I P R O U N D T A B L E<br />
2 1<br />
“In completing the assessment<br />
of our internal control environment<br />
required by Sarbanes-Oxley,<br />
we’ve developed even better processes<br />
and more efficient ways<br />
to manage our business.”<br />
Dave Johnson
Making <strong>Molex</strong> A Great Place To Work<br />
<strong>Molex</strong> <strong>2005</strong> Annual Report<br />
L E A D E R S H I P R O U N D T A B L E<br />
liam In addition to our global objective, we’re striving to make <strong>Molex</strong> an even better<br />
place to work. People at <strong>Molex</strong> have an enviable work ethic, ambition and optimism<br />
that transcend country boundaries.<br />
dave I decided to return to <strong>Molex</strong> because the leadership and employees make it a<br />
really exceptional place to work. Certainly we can always improve in areas like em-<br />
powerment and communication. As we make strategic decisions about the future,<br />
we need to communicate our vision. We’re all part of the process. Everyone needs to<br />
understand where the company is headed and what they can do to help us all move<br />
toward common goals.<br />
martin <strong>Molex</strong> has had a difficult time since the last recession, making it tougher<br />
to maintain a highly desirable and exciting workplace. I think the number one way<br />
to do it right is to grow the company, so you create opportunities for employees and<br />
provide them with training and development to take advantage of those opportuni-<br />
ties. In the end, people don’t leave because of pay; they leave because they are not<br />
challenged in their work.<br />
Excelling In Total Customer Service<br />
martin Our next objective is to do a better job of servicing our customers. We need<br />
to present one face to customers–one <strong>Molex</strong> and the best <strong>Molex</strong>–which goes back to<br />
our first goal of being truly global.<br />
liam I think quality, delivery and new product introductions are the key dimensions<br />
of customer service. We’ve embraced the principles of Six Sigma and lean manufac-<br />
turing, as well as many smaller but significant changes in the way we do things. Our<br />
challenge is to continue to leverage <strong>Molex</strong> best practices and use the global power of<br />
the company to drive improvement at a faster rate.<br />
dave And we can leverage the global power of our centralized information system to<br />
analyze and track data and accelerate our progress in reducing defects. We know we<br />
must drive quality incidents down to zero parts per million.<br />
martin Servicing customers well also includes being ready with new products that<br />
meet our customers’ needs. We do a pretty good job of that today, and the number<br />
of products we introduce each year supports it. Our more than 1,000 sales engineers<br />
around the world call on customers and stay alert to their needs. Our role is to iden-<br />
tify opportunities and respond faster than our competitors.<br />
2 2
<strong>Molex</strong> <strong>2005</strong> Annual Report<br />
L E A D E R S H I P R O U N D T A B L E<br />
liam When you are well positioned with your customers–and we are–they tell you<br />
what equipment they are developing, so we can develop the appropriate products.<br />
Staying close to them is critical, as is participating in international standards com-<br />
mittees.<br />
dave But we all know that value is central to customer service. Customers want to<br />
know they’re getting the most cost-effective price.<br />
martin It’s not far from the truth to say that customers want the product now, per-<br />
fect and free. We need to get as close to that scenario as possible while still making a<br />
reasonable profit. To do that, we have to be strong in the fundamentals because the<br />
vast majority of customer decisions are made on objective factors. Relationships are<br />
not as key as they used to be.<br />
Producing Superior Financial Results<br />
dave Our fourth strategic objective is to generate outstanding financial results. It<br />
encompasses profitability, as well as metrics we haven’t concentrated on as much<br />
before–but that matter to the investment community–such as working capital man-<br />
agement and return on assets.<br />
martin We make the highest profits on new connector products, which are around<br />
30% of our revenue each year. But our integrated products, which have lower mar-<br />
gins, have increased to about 22% of our revenue. The harnesses, cables and other<br />
labor-intensive assemblies we make around the world are growing twice as fast as<br />
connector sales. We have to face the reality of an increasing segment of our business<br />
having lower return on sales, but higher return on assets.<br />
liam We have moved most of our integrated products to low-cost production coun-<br />
tries like Mexico and China, as well as Eastern Europe. That has reduced our labor<br />
cost, but we still need to work on our materials cost.<br />
martin <strong>Molex</strong> has always been cash rich and willing to replicate capabilities in re-<br />
gions around the world. This has been an advantage in the past, but reflects poorly<br />
on our return on assets. We’re starting to drive a better return on investment through<br />
factory consolidation and improved global logistics. Customers tell us they don’t care<br />
where we make a product, just as long as we get it to them on time. So we don’t have<br />
to be so concerned about manufacturing close to our customers’ plants and we can<br />
have fewer larger factories, often in lower-cost countries.<br />
2 3
dave We’ve set aside $40 million to $60 million for restructuring our European and<br />
Americas operations, which will have a minor effect on operating results in fiscal<br />
2006, but should reduce operating costs by approximately $35 million annually be-<br />
ginning in fiscal 2007.<br />
martin We also have to put more emphasis on making acquisitions that are both<br />
strategic and accretive to the bottom line.<br />
dave You’re right. We have to be more adept not only at assessing a business before<br />
we buy it, but also in managing integration once it’s part of <strong>Molex</strong>.<br />
martin In closing this discussion, I’d like to reiterate that what we’ve been talking<br />
about today are refinements for the future of <strong>Molex</strong>, not a major overhaul. We are do-<br />
ing a lot of things well. In the past 20 years, we’ve advanced from number nine in our<br />
industry to number two. What we are aiming for are ways to get even better at what<br />
we do, ways to continue to improve our technology, cost competitiveness, customer<br />
service and value to shareholders.<br />
<strong>Molex</strong> <strong>2005</strong> Annual Report<br />
L E A D E R S H I P R O U N D T A B L E<br />
2 4
Fred A. Krehbiel (4)*<br />
is Co-Chairman of the<br />
Board of <strong>Molex</strong> Incorporated.<br />
Over the past 40 years, his<br />
responsibilities have included<br />
serving the Company as<br />
Co-Chief Executive Officer,<br />
Chairman of the Board,<br />
Vice Chairman and Chief<br />
Executive Officer. Age 64.<br />
Director since 1972.<br />
John H. Krehbiel, Jr. (4)<br />
is Co-Chairman of<br />
the Board of <strong>Molex</strong><br />
Incorporated. In his 46 years<br />
with <strong>Molex</strong>, he has held<br />
numerous positions, including<br />
Co-Chief Executive<br />
Officer, Chief Operating<br />
Officer and President.<br />
Age 68. Director since 1966.<br />
Michael J. Birck (3)(4)<br />
is a founder and Chairman<br />
of the Board of Tellabs, Inc.,<br />
which develops network<br />
solutions for telecom service<br />
providers. Age 67.<br />
Director since 1995.<br />
Douglas K. Carnahan (1)*<br />
retired from Hewlett-<br />
Packard Company in 1998<br />
as Senior Vice President<br />
after 30 years with the<br />
computer and computer<br />
peripherals provider. Age 63.<br />
Director since 1997.<br />
Michelle L. Collins (3)<br />
is Managing Director<br />
of private equity firm<br />
Svoboda, Collins L.L.C.<br />
and former partner in the<br />
corporate finance department<br />
of William Blair &<br />
Company, L.L.C. Age 45.<br />
Director since 2003.<br />
Edgar D. Jannotta (3)*(4)<br />
is Chairman of securities<br />
and investment banking<br />
firm William Blair &<br />
Company, L.L.C., where he<br />
has worked for 46 years.<br />
Age 74. Director since 1986.<br />
<strong>Molex</strong> <strong>2005</strong> Annual Report<br />
B O A R D O F D I R E C T O R S<br />
Fred L. Krehbiel<br />
is President, Connector<br />
Products Division, Americas,<br />
at <strong>Molex</strong> Incorporated.<br />
In his 16 years with the<br />
Company, he has worked<br />
in engineering, marketing<br />
and managerial capacities,<br />
most recently as President<br />
of the Automotive Division,<br />
Americas. Age 40.<br />
Director since 1993.<br />
David L. Landsittel (1)<br />
is a consultant on auditing<br />
and financial reporting,<br />
with 42 years’ experience<br />
in public accounting.<br />
He was Chairman of<br />
the Auditing Standards<br />
Board of the American<br />
Institute of Certified Public<br />
Accountants and served in<br />
audit leadership positions<br />
at Arthur Andersen LLP.<br />
Age 65. Director since <strong>2005</strong>.<br />
Joe W. Laymon (2)<br />
is Group Vice President,<br />
Corporate Human Resources<br />
and Labor Affairs at Ford<br />
Motor Company. He has<br />
held human resources and<br />
labor relations positions at<br />
Eastman Kodak Company<br />
and Xerox Corporation.<br />
Age 52. Director since 2002.<br />
Donald G. Lubin (3)<br />
is a partner and former<br />
Chairman of law firm<br />
Sonnenschein Nath &<br />
Rosenthal LLP, where he has<br />
worked for 48 years. Age 71.<br />
Director since 1994.<br />
Masahisa Naitoh (2)<br />
is Chairman and Chief<br />
Executive Officer of<br />
The Institute of Energy<br />
Economics, Japan, an energy<br />
and environmental think<br />
tank. Until 2003, he was<br />
Executive Vice Chairman<br />
of Itochu Corporation, one<br />
of Japan’s leading trading<br />
companies. Age 67.<br />
Director since 1995.<br />
Robert J. Potter, Ph.D. (2)*(1)<br />
is Chief Executive Officer<br />
of R.J. Potter Company.<br />
He served as President and<br />
Chief Executive Officer of<br />
computer network provider<br />
Datapoint Corporation and<br />
Group Vice President of<br />
Nortel Networks Limited.<br />
Age 72. Director since 1981.<br />
Martin P. Slark (4)<br />
is Vice Chairman and Chief<br />
Executive Officer of <strong>Molex</strong><br />
Incorporated. Over the past<br />
29 years with the Company,<br />
he has held a variety of<br />
positions around the world<br />
and was elected to his present<br />
post in <strong>2005</strong>. Age 50.<br />
Director since 2000.<br />
Committees<br />
1 Audit<br />
2 Compensation<br />
3 Nominating and<br />
Corporate Governance<br />
4 Executive<br />
* Chair<br />
S E N I O R E X E C U T I V E S<br />
Our senior executives apply an average of 22 years of <strong>Molex</strong> management experience to their global leadership responsibilities.<br />
Lye Hin Ang<br />
Group General Manager,<br />
Malaysia and Singapore<br />
<strong>Molex</strong> Far East South<br />
Graham C. Brock<br />
Vice President,<br />
<strong>Molex</strong> Incorporated<br />
and President,<br />
<strong>Molex</strong> Europe<br />
Diane S. Bullock<br />
Vice President,<br />
Global Procurement,<br />
<strong>Molex</strong> Incorporated<br />
David K. Christein<br />
Vice President,<br />
<strong>Molex</strong> Americas<br />
J. T. Chung<br />
General Manager<br />
and President, <strong>Molex</strong> Korea,<br />
<strong>Molex</strong> Far East North<br />
Daniel A. Dixon<br />
Director, Technical Services,<br />
<strong>Molex</strong> Incorporated<br />
James E. Fleischhacker<br />
Executive Vice President,<br />
<strong>Molex</strong> Incorporated<br />
Louis A. Hecht<br />
Corporate Secretary<br />
and General Counsel,<br />
<strong>Molex</strong> Incorporated<br />
Katsumi Hirokawa<br />
Vice President,<br />
<strong>Molex</strong> Incorporated<br />
and President,<br />
<strong>Molex</strong>-Japan Co., Ltd.,<br />
<strong>Molex</strong> Far East North<br />
Yasuhiro Ichijo<br />
Executive Director, Total<br />
Engineering and Marketing,<br />
<strong>Molex</strong>-Japan Co., Ltd.,<br />
<strong>Molex</strong> Far East North<br />
David D. Johnson<br />
Vice President,<br />
Treasurer and<br />
Chief Financial Officer,<br />
<strong>Molex</strong> Incorporated<br />
J. Joseph King<br />
Vice President,<br />
Strategic Planning,<br />
<strong>Molex</strong> Incorporated<br />
Fred A. Krehbiel<br />
Co-Chairman of the Board,<br />
<strong>Molex</strong> Incorporated<br />
Fred L. Krehbiel<br />
President, Connector<br />
Products Division,<br />
<strong>Molex</strong> Americas<br />
John H. Krehbiel, Jr.<br />
Co-Chairman of the Board,<br />
<strong>Molex</strong> Incorporated<br />
Joseph H. Lawniczak<br />
Director, Manufacturing,<br />
<strong>Molex</strong> Incorporated<br />
Thomas S. Lee<br />
Vice President,<br />
New Ventures and<br />
Acquisitions,<br />
<strong>Molex</strong> Incorporated<br />
G. Neil Lefort<br />
Vice President,<br />
Investor Relations,<br />
<strong>Molex</strong> Incorporated<br />
Robert B. Mahoney<br />
Executive Vice President,<br />
<strong>Molex</strong> Incorporated<br />
and President,<br />
<strong>Molex</strong> Far East South<br />
Gary J. Matula<br />
Vice President,<br />
Information Systems and<br />
Chief Information Officer,<br />
<strong>Molex</strong> Incorporated<br />
2 5<br />
Liam G. McCarthy<br />
President and<br />
Chief Operating Officer,<br />
<strong>Molex</strong> Incorporated<br />
Atsuhiko Nariki<br />
Executive Director,<br />
Business Operations,<br />
<strong>Molex</strong>-Japan Co., Ltd.,<br />
<strong>Molex</strong> Far East North<br />
Kathi M. Regas<br />
Vice President,<br />
Human Resources,<br />
<strong>Molex</strong> Incorporated<br />
David B. Root<br />
Vice President,<br />
Sales and Marketing,<br />
<strong>Molex</strong> Americas<br />
Thomas E. Schneider<br />
Vice President,<br />
Tooling Group,<br />
<strong>Molex</strong> Americas<br />
Ronald L. Schubel<br />
Executive Vice President,<br />
<strong>Molex</strong> Incorporated and<br />
President, <strong>Molex</strong> Americas<br />
Martin P. Slark<br />
Vice Chairman and<br />
Chief Executive Officer,<br />
<strong>Molex</strong> Incorporated<br />
Frank Tan<br />
Managing Director,<br />
Greater China Region,<br />
<strong>Molex</strong> Far East South<br />
Goro Tokuyama<br />
Chairman, <strong>Molex</strong>-Japan<br />
Co., Ltd. and <strong>Molex</strong> Korea<br />
and President,<br />
<strong>Molex</strong> Far East North<br />
Hans A. van Delft<br />
General Manager,<br />
General Products Division,<br />
<strong>Molex</strong> Europe<br />
Jay R. Williamson<br />
Vice President,<br />
Worldwide Quality,<br />
<strong>Molex</strong> Incorporated<br />
Roy Wong<br />
General Manager,<br />
Shanghai,<br />
<strong>Molex</strong> Far East South
<strong>Molex</strong> <strong>2005</strong> Annual Report<br />
T R A N S L A T I O N
<strong>Molex</strong> <strong>2005</strong> Annual Report<br />
T R A N S L A T I O N
<strong>Molex</strong> <strong>2005</strong> Annual Report<br />
T R A N S L A T I O N<br />
2 7
<strong>Molex</strong> <strong>2005</strong> Annual Report<br />
T R A N S L A T I O N
<strong>Molex</strong> <strong>2005</strong> Annual Report<br />
T R A N S L A T I O N
<strong>Molex</strong> <strong>2005</strong> Annual Report<br />
T R A N S L A T I O N
<strong>Molex</strong> <strong>2005</strong> Annual Report<br />
T R A N S L A T I O N
<strong>Molex</strong> <strong>2005</strong> Annual Report<br />
T R A N S L A T I O N
<strong>Molex</strong> <strong>2005</strong> Annual Report<br />
T R A N S L A T I O N
<strong>Molex</strong> <strong>2005</strong> Annual Report<br />
T R A N S L A T I O N
<strong>Molex</strong> <strong>2005</strong> Annual Report<br />
T R A N S L A T I O N
<strong>Molex</strong> <strong>2005</strong> Annual Report<br />
T R A N S L A T I O N
UNITED STATES<br />
SECURITIES AND EXCHANGE COMMISSION<br />
Washington, D.C. 20549<br />
____________<br />
FORM 10-K<br />
ANNUAL REPORT PURSUANT TO SECTION 13 OR 15(d) OF<br />
THE SECURITIES EXCHANGE ACT OF 1934<br />
For the fiscal year ended June 30, <strong>2005</strong><br />
Commission File Number 0-7491<br />
____________<br />
MOLEX INCORPORATED<br />
(Exact name of registrant as specified in its charter)<br />
Delaware 36-2369491<br />
(State or other jurisdiction of (I.R.S. Employer<br />
incorporation or organization) Identification No.)<br />
2222 Wellington Court, Lisle, Illinois 60532<br />
(Address of principal executive offices)<br />
Registrant’s telephone number, including area code: (630) 969-4550<br />
____________<br />
SECURITIES REGISTERED PURSUANT TO SECTION 12(b) OF THE ACT: None<br />
SECURITIES REGISTERED PURSUANT TO SECTION 12(g) OF THE ACT<br />
Common Stock, par value $0.05<br />
Class A Common Stock, par value $0.05<br />
____________<br />
Indicate by check mark whether the registrant (1) has filed all reports required to be filed by Section<br />
13 or 15 (d) of the Securities Exchange Act of 1934 during the preceding 12 months (or for such shorter<br />
period that the registrant was required to file such reports), and (2) has been subject to such filing<br />
requirements for the past 90 days. Yes � No �<br />
Indicate by check mark if disclosure of delinquent filers pursuant to Item 405 of Regulation S-K<br />
(Section 229.405 of this chapter) is not contained herein, and will not be contained, to the best of registrant’s<br />
knowledge, in definitive proxy or information statements incorporated by reference in Part III of this Form<br />
10-K or any amendment to this Form 10-K. �<br />
Indicate by check mark whether the registrant is an accelerated filer (as defined in Rule 12b-2 of the<br />
Act). Yes � No �<br />
Indicate by check mark whether the registrant is a shell company (as defined in Rule 12b-2 of the<br />
Act). Yes � No �<br />
On September 2, <strong>2005</strong>, the following numbers of shares of the Company’s common stock were outstanding:<br />
Common Stock 100,616,780<br />
Class A Common Stock 87,494,778<br />
Class B Common Stock 94,255<br />
The aggregate market value of the voting and non-voting shares (based on the closing price of these<br />
shares on the National Association of Securities Dealers Automated Quotation System on December 31,<br />
2004) held by non-affiliates was approximately $3.94 billion.<br />
DOCUMENTS INCORPORATED BY REFERENCE<br />
Portions of the Proxy Statement for the Annual Meeting of Stockholders, to be held on October 28,<br />
<strong>2005</strong> are incorporated by reference into Part III of this annual report on Form 10-K.<br />
1
TABLE OF CONTENTS<br />
Page<br />
Part I<br />
Item 1. Business .................................................................................................................................................. 3<br />
Item 2. Properties..............................................................................................................................................12<br />
Item 3. Legal Proceedings................................................................................................................................12<br />
Item 4. Submission of Matters to a Vote of Security Holders ..................................................................13<br />
Part II<br />
Item 5. Market for the Registrant’s Common Equity, Related Stockholder<br />
Matters and Issuer Purchases of Equity Securities........................................................................13<br />
Item 6. Selected Financial Data ......................................................................................................................15<br />
Item 7. Management’s Discussion and Analysis of Financial Condition and<br />
Results of Operations.........................................................................................................................16<br />
Item 7A. Quantitative and Qualitative Disclosures About Market Risk.....................................................33<br />
Item 8. Financial Statements and Supplementary Data..............................................................................35<br />
Item 9. Changes in and Disagreements with Accountants on Accounting and<br />
Financial Disclosure............................................................................................................................ 66<br />
Item 9A. Controls and Procedures....................................................................................................................66<br />
Item 9B. Other Information ..............................................................................................................................68<br />
Part III<br />
Item 10. Directors and Executive Officers of the Registrant......................................................................68<br />
Item 11. Executive Compensation...................................................................................................................68<br />
Item 12. Security Ownership of Certain Beneficial Owners and Management and<br />
Related Stockholder Matters ............................................................................................................. 68<br />
Item 13. Certain Relationships and Related Transactions............................................................................68<br />
Item 14. Principal Accountant Fees and Services..........................................................................................68<br />
Part IV<br />
Item 15. Exhibits and Financial Statement Schedules ..................................................................................69<br />
Schedule II - Valuation and Qualifying Accounts .........................................................................70<br />
Index to Exhibits.................................................................................................................................71<br />
Signatures..............................................................................................................................................73<br />
<strong>Molex</strong> Web Site<br />
<strong>Molex</strong> Incorporated makes available through its Web site at www.molex.com its annual report on<br />
Form 10-K, quarterly reports on Form 10-Q, current reports on Form 8-K and all amendments to those<br />
reports as soon as reasonably practicable after such material is electronically filed with the Securities and<br />
Exchange Commission.<br />
Information relating to corporate governance at <strong>Molex</strong>, including its Code of Conduct, information<br />
concerning executive officers, directors and Board committees (including committee charters), and<br />
transactions in <strong>Molex</strong> securities by directors and officers, is available on or through the Company’s Web site<br />
at www.molex.com under the “Investors” caption.<br />
<strong>Molex</strong> is not including the information on its Web site as a part of, or incorporating it by reference<br />
into, this annual report on Form 10-K.<br />
2
Item 1. Business<br />
3<br />
PART I<br />
<strong>Molex</strong> was incorporated in the state of Delaware in 1972 and originated from an enterprise<br />
established in 1938. As used herein the terms “<strong>Molex</strong>” or “Company” include <strong>Molex</strong> Incorporated and its<br />
subsidiaries.<br />
<strong>Molex</strong> is the world’s second-largest manufacturer of electronic connectors in terms of revenue. Net<br />
revenue was $2.55 billion for the fiscal year ended June 30, <strong>2005</strong>. The Company operated 58 manufacturing<br />
plants, located in 19 countries on five continents, and employed 27,525 people worldwide as of June 30,<br />
<strong>2005</strong>.<br />
<strong>Molex</strong>’s core business is the manufacture and sale of electromechanical components. <strong>Molex</strong>’s<br />
products are used by a large number of leading original equipment manufacturers (OEMs) throughout the<br />
world. The Company designs, manufactures and sells more than 100,000 products, including terminals,<br />
connectors, planar cables, cable assemblies, interconnection systems, backplanes, integrated products, and<br />
mechanical and electronic switches. <strong>Molex</strong> also provides manufacturing services to integrate specific<br />
components into a customer’s product.<br />
The Connector Industry<br />
The global connector industry is highly competitive and fragmented and is estimated to represent<br />
approximately $33.7 billion in revenue for the year ended June 30, <strong>2005</strong>. The industry has grown at a<br />
compounded annual rate of 5-6% over the past 24 years and is expected to grow at a rate of 6-7% in calendar<br />
year <strong>2005</strong>. <strong>Molex</strong> currently believes that its market share is approximately 8% of the worldwide market for<br />
electronic connectors.<br />
The connector industry is characterized by rapid advances in technology and new product<br />
development. These advances have been substantially driven by the increased functionality of applications in<br />
which our products are used. Although many of the products in the connector market are mature products,<br />
some with 25-30 year life spans, there is also a constant demand for new product solutions.<br />
Industry trends of particular relevance for the Company include:<br />
• Globalization. Synergistic opportunities exist for the industry to design, manufacture and sell<br />
electronic products in different countries around the world in an efficient and seamless process.<br />
For example, electronic products may be designed in Japan, manufactured in China, and sold in<br />
the United States.<br />
• Convergence of markets. Traditionally separate markets such as consumer electronics, data products<br />
and telecommunications are converging, resulting in single devices offering broad-based<br />
functionality.<br />
• Increasing electronics content. Consumer demand for advanced product features, convenience and<br />
connectivity is driving connector growth at rates faster than the growth rates of the underlying<br />
electronics markets.<br />
• Product size reduction. High-density, micro-miniature technologies are expanding to many markets<br />
leading to smaller devices and greater mobility.<br />
• Consolidating supply base. Generally, global OEMs are consolidating their supply chain by selecting<br />
global companies possessing broad product lines for the majority of their connector<br />
requirements.<br />
• Price erosion. As unit volumes grow, production experience is accumulated and costs decrease,<br />
and as a result, prices decline.
Markets and Products<br />
below:<br />
The approximate percentage of the Company’s net revenue by market for fiscal <strong>2005</strong> is summarized<br />
Percentage of Fiscal <strong>2005</strong> Typical End Use Products<br />
Markets<br />
Net Revenue<br />
Supported by <strong>Molex</strong><br />
Telecommunications 27 % Mobile phones and devices,<br />
networking equipment, switches and<br />
transmission equipment<br />
Data Products 24 % Desktop and notebook computers,<br />
peripheral equipment, servers, storage,<br />
copiers, printers and scanners<br />
Automotive 19 % Engine control units, body<br />
electronics, safety electronics, sensors,<br />
panel instrumentation and other<br />
automotive electronics<br />
Consumer 18 % Digital electronics - CD and DVD<br />
players, cameras, plasma and LCD<br />
televisions, electronic games and<br />
major appliances<br />
Industrial 9 % Factory automation, robotics,<br />
automated test equipment, vision<br />
systems and diagnostic equipment<br />
Other 3 % Electronic and electrical devices for a<br />
variety of markets<br />
Telecommunications – In the telecommunications market, the Company believes its key strengths<br />
include: high speed/optical signal product lines; backplane connector systems; power distribution product;<br />
micro-miniature connectors; global coordination; and complementary products such as keyboards and<br />
antennas.<br />
For mobile phones, <strong>Molex</strong> provides micro-miniature connectors, SIM card sockets, keypads,<br />
electromechanical subassemblies and internal antennas and subsystems. An area of particular innovation is<br />
high-speed backplanes and cables for infrastructure equipment. For example, <strong>Molex</strong>’s Plateau HS Dock TM<br />
incorporates a new plated plastic technology to increase bandwidth, reduce crosstalk and control impedance<br />
in applications such as telecommunication routers.<br />
Data Products – In the data market, the Company’s key strengths include: its high-speed signal<br />
product line; storage input/output (I/O) products; standards committee leadership; global coordination; low<br />
cost manufacturing; and strong relationships with OEMs, contract manufacturers and original design<br />
manufacturers.<br />
<strong>Molex</strong> manufactures power, optical and signal connectors and cables for fast end-to-end data<br />
transfer, linking disk drives, controllers, servers, switches and storage enclosures. The Company’s ongoing<br />
involvement in industry committees contributes to the development of new standards for the connectors and<br />
cables that transport data. For example, <strong>Molex</strong>’s family of small form-factor pluggable products offers endusers<br />
both fiber optic and copper connectivity and more efficient storage area network management.<br />
<strong>Molex</strong> holds a strong position with connectors used in servers, the segment of this market that<br />
accounts for the largest volume of connector purchases. The Company offers a large variety of products for<br />
power distribution, signal integrity, processor and memory applications. <strong>Molex</strong> is also the lead designer in the<br />
industry for storage devices. <strong>Molex</strong>’s Serial ATA product enables higher-speed communication between<br />
a computer’s disk drive and processor. In addition, the Company’s product portfolio includes virtually every<br />
interconnect for copiers, printers, scanners and projectors.<br />
4
Automotive – In the automotive market the Company believes its strengths include: new product<br />
development expertise; focus on entertainment, safety and convenience features; technical skills; and<br />
integrated manufacturing capabilities.<br />
The Company’s interconnects are in air bags and seatbelts, tire pressure monitoring systems and<br />
powertrain controls, windows and temperature controls. Today’s cars are mobile communication centers,<br />
complete with navigation tools and multimedia entertainment. <strong>Molex</strong>’s Media Oriented System Transport<br />
(MOST) connector system uses plastic optical fiber to transmit audio, video and data at high speeds in<br />
devices such as CD and DVD players.<br />
Consumer – In the consumer market, the Company believes its key strengths include: optical and<br />
micro-miniature connector expertise; breadth of its high wattage (power) product line; cable and wire<br />
application equipment; and low cost manufacturing.<br />
<strong>Molex</strong> designs and manufactures many of the world’s smallest connectors for home and portable<br />
audio, digital still and video cameras, DVD players and recorders, as well as devices that combine multiple<br />
functions. The Company’s super micro miniature products support customer needs for increased power,<br />
speed and functionality but with decreased weight and space requirements. <strong>Molex</strong> believes that it provides<br />
industry leadership with advanced interconnection products that help enhance the performance of video and<br />
still cameras, DVD players, portable music players, PDAs and hybrid devices that combine multiple<br />
capabilities into a single unit.<br />
<strong>Molex</strong> is a leading connector source and preferred supplier to some of the world’s largest computer<br />
game makers and has won numerous projects that demonstrate its skill in designing innovative connectors.<br />
In addition, <strong>Molex</strong> provides products for video poker and slot machines. Pachinko machines, which are<br />
popular in Japan, use the Company’s compact 2.00mm pitch MicroClasp TM connector, which features an<br />
inner lock that helps on-site installers easily insert new game boards.<br />
Industrial – In the industrial market, the Company believes its key strengths include: optical and<br />
micro miniature connector expertise; breadth of its power and signal product lines; distribution partnerships;<br />
and global presence.<br />
This is a relatively new area of emphasis for the Company, further diversifying its customer mix. The<br />
Company’s high-performance cables, backplanes, power connectors and integrated products are found in<br />
products ranging from electronic weighing stations to industrial microscopes and vision systems. Advances<br />
in semiconductor technology require comparable advances in equipment to verify quality, function and<br />
performance. For this reason, <strong>Molex</strong> developed its Very High-Density Metric (VHDM) connector system to<br />
help assure signal integrity and overall reliability in high-speed applications such as chip testers.<br />
In the factory automation market, <strong>Molex</strong> is building its base by expanding its line of compact robotic<br />
connectors and I/O connectors for servo motors, as well as identifying factory uses for the time-tested<br />
products it has developed for other industries.<br />
Other – Medical electronics is a growing market for <strong>Molex</strong> connectors, switch and assembly<br />
products. <strong>Molex</strong> provides both connectors and custom integrated systems for diagnostic and therapeutic<br />
equipment used in hospitals including x-ray, magnetic resonance imaging (MRI) and dialysis machines.<br />
Military electronics is also an emerging market for <strong>Molex</strong>. The Company has found a range of electronic<br />
applications for its products in the commercial-off-the-shelf (COTS) segment of this market. Products<br />
originally developed for the computer, telecommunications and automotive markets can be used in an<br />
increasing number of military applications.<br />
Business Objectives and Strategies<br />
One of the Company’s primary business objectives is to develop or improve its leadership position<br />
in each of its core connector markets by increasing its overall position as a preferred supplier and its<br />
competitiveness on a global scale.<br />
5
The Company believes that its success in achieving industry-leading revenue growth throughout its<br />
history is the result of the following key strengths:<br />
• Broad and deep technological knowledge of microelectronic devices and techniques, power<br />
sources, coatings and materials.<br />
• Strong intellectual property portfolio that underlies many key products.<br />
• High product quality standards, backed with stringent systems designed to ensure consistent<br />
performance, that meet or surpass customers’ expectations.<br />
• Strong technical collaboration with customers.<br />
• Extensive experience with the product development process.<br />
• Broad geographical presence in developed and developing markets.<br />
• Continuous effort to develop an efficient, low-cost manufacturing footprint.<br />
• A broad range of products both for specific applications and for general consumption.<br />
Competition<br />
<strong>Molex</strong> intends to serve its customers and achieve its objectives by continuing to do the following:<br />
• Concentrate on core markets. The Company focuses on markets where it has the expertise,<br />
qualifications and leadership position to sustain a competitive advantage. <strong>Molex</strong> has been an<br />
established supplier of interconnect solutions for more than 60 years. It is a principal supplier<br />
of connector components to the telecommunications, computer, consumer, automotive and<br />
industrial electronics markets.<br />
• Grow through the development and release of new products. <strong>Molex</strong> invests strategically in the tools and<br />
resources to develop and bring to market new products and to expand existing product lines.<br />
New products are essential to enable customers to advance their solutions and their market<br />
leadership positions. In fiscal <strong>2005</strong>, the Company generated 30% of its revenue from new<br />
products, which are defined as those products released in the last 36 months.<br />
• Optimize manufacturing. The Company analyzes the design and manufacturing patterns of its<br />
customers along with its own supply chain economics to help ensure that its manufacturing<br />
operations are of sufficient scale and are located strategically to minimize production costs and<br />
maximize customer service.<br />
• Leverage financial strength. <strong>Molex</strong> uses its expected cash flow from operations to invest aggressively<br />
in new product development, to align manufacturing capacity with customer requirements and<br />
to pursue productivity improvements. The Company invested 14.3% of net revenue in capital<br />
expenditures and research and development activities in fiscal <strong>2005</strong>.<br />
<strong>Molex</strong> competes with many companies in each of its product categories. These competitors include<br />
Amphenol Corporation, Framatome Connectors International, Hirose Electronic Co., Ltd, Hon Hai<br />
Precision Industry Co., Ltd., Japan Aviation Electronics Industry, Ltd., Japan Solderless Terminal Ltd. and<br />
Tyco International Ltd. as well as a significant number of smaller competitors. The identity and significance<br />
of competitors may change over time. <strong>Molex</strong> believes that the 10 largest connector suppliers (as measured by<br />
revenue) represent approximately 51% of the worldwide market in terms of revenue. Many of these<br />
companies offer products in some, but not all, of the markets and regions served by <strong>Molex</strong>.<br />
The Company’s products compete to varying degrees on the basis of quality, price, availability,<br />
performance and brand recognition. <strong>Molex</strong> also competes on the basis of customer service. <strong>Molex</strong>’s ability<br />
to compete also depends on continually providing innovative new product solutions and worldwide support<br />
for its customers.<br />
Customers, Demand Creation and Sales Channels<br />
<strong>Molex</strong> sells products directly to OEMs, contract manufacturers and distributors. The Company’s<br />
customers include global companies such as Cisco, Dell, Ford, Hewlett Packard, IBM, Matsushita, Motorola,<br />
6
Nokia, Samsung, Siemens, Sony and Toyota. No customer accounted for more than 10% of net revenues in<br />
fiscal years <strong>2005</strong>, 2004 or 2003.<br />
Many of the Company’s customers operate in more than one geographic region of the world and<br />
<strong>Molex</strong> has developed a global footprint to service these customers. <strong>Molex</strong> is engaged in significant<br />
operations in foreign countries. The Company’s net revenue originating outside the U.S. based on shipping<br />
point to the customer was approximately 74% in fiscal <strong>2005</strong>, 70% in fiscal 2004 and 66% in fiscal 2003.<br />
In fiscal <strong>2005</strong>, the share of net revenue from the different regions was approximately as follows:<br />
• 51% of net revenue originated in Asia, with 30% from the Far East South region (China, Hong<br />
Kong, Indonesia, India, Malaysia, Philippines, Singapore, Taiwan and Thailand) and 21% from<br />
the Far East North region (Japan and Korea). Approximately 17% and 19% of revenue in fiscal<br />
<strong>2005</strong> was derived from operations in Japan and China, respectively.<br />
• 27% of net revenue originated in the Americas (United States, Canada, Mexico and South<br />
America).<br />
• 20% of net revenue originated in Europe.<br />
• 2% of net revenue originated from operations that have not yet been assigned to a particular<br />
region.<br />
Revenues from customers are generally attributed to countries based upon the location of the <strong>Molex</strong><br />
sales office. Most of the Company’s sales in international markets are made by foreign sales subsidiaries. In<br />
countries with low sales volumes, sales are made through various representatives and distributors.<br />
<strong>Molex</strong> sells its products primarily through its own sales organization with a presence in most major<br />
connector markets worldwide. To complement its own sales force, <strong>Molex</strong> works with a network of<br />
distributors to serve a broader customer base and provide a wide variety of supply chain tools and<br />
capabilities. Sales through distributors represented approximately 20% of <strong>Molex</strong>’s total revenue in fiscal<br />
<strong>2005</strong>.<br />
<strong>Molex</strong> seeks to provide customers one-to-one service tailored to their business. The Company’s<br />
engineers work collaboratively with customers, often via an innovative online design system, to develop<br />
products for specific applications. <strong>Molex</strong> provides customers the benefit of state-of-the-art technology for<br />
engineering, design and prototyping – supported from 29 development centers in 16 countries. In addition,<br />
most customers have a single <strong>Molex</strong> customer service contact and a specific field salesperson to provide<br />
technical product and application expertise.<br />
<strong>Molex</strong>’s sales force around the world has access to the Company’s customer relationship<br />
management database, which integrates with <strong>Molex</strong>’s global information system to provide 24/7 visibility on<br />
orders, pricing, contracts, shipping, inventory and customer programs. <strong>Molex</strong> offers a self-service<br />
environment for its customers through its Web site at www.molex.com, so that customers can access the<br />
Company’s entire product line, download drawings or 3D models, obtain price quotes, order samples and<br />
track delivery.<br />
Information regarding the Company’s operations by geographical region appears in Note 23 of the<br />
Notes to Consolidated Financial Statements. A discussion of market risk associated with changes in foreign<br />
currency exchange rates can be found in Management’s Discussion and Analysis of Financial Condition and<br />
Results of Operations.<br />
Research and Development<br />
<strong>Molex</strong> remains committed to investing in world-class technology development, particularly in the<br />
design and manufacture of connectors and interconnect systems. The Company’s research and development<br />
activities are directed toward developing technology innovations, primarily high speed signal integrity,<br />
miniaturization, higher power delivery, optical signal delivery and sealed harsh environment connectors that<br />
<strong>Molex</strong> believes will deliver the next generation of products. <strong>Molex</strong> continues to invest in new manufacturing<br />
processes, as well as improve existing products and reduce costs. <strong>Molex</strong> believes that it is well positioned in<br />
7
the technology industry to help drive innovation and promote industry standards that will yield innovative<br />
and improved products for customers.<br />
<strong>Molex</strong> incurred total research and development costs of $134 million in fiscal <strong>2005</strong>, $119 million in<br />
fiscal 2004 and $117 million in fiscal 2003. The Company believes this investment, typically at 5% or more<br />
of net revenue, is among the highest level relative to the largest participants in the industry and helps it<br />
achieve a competitive advantage.<br />
<strong>Molex</strong> strives to provide customers with the most advanced interconnection products through<br />
intellectual property development and participation in industry standards committees. <strong>Molex</strong> engineers are<br />
active in approximately 45 such committees, helping give the Company a voice in shaping the technologies of<br />
the future. In fiscal <strong>2005</strong>, <strong>Molex</strong> commercialized approximately 384 new products and received 775 product<br />
patents.<br />
<strong>Molex</strong> performs a majority of its design and development of connector products in the U.S. and<br />
Japan, but has additional product development capabilities in various locations, including China, Germany,<br />
India, Ireland, Korea, Malaysia and Singapore.<br />
Manufacturing<br />
<strong>Molex</strong>’s core manufacturing expertise includes molding, stamping, plating and assembly operations.<br />
The Company utilizes state of the art plastic injection molding machines and metal stamping and forming<br />
presses. <strong>Molex</strong> has created new processes to meet the ongoing challenge of manufacturing smaller and<br />
smaller connectors. The Company has also developed proprietary plated plastic technology, which provides<br />
excellent shielding performance while eliminating secondary manufacturing processes in applications such as<br />
mobile phone antennas.<br />
The Company also has expertise in printed circuit card and harness assembly for its integrated<br />
products operations, which build devices that leverage <strong>Molex</strong> connector content. Because integrated products<br />
require labor-intensive assembly, each <strong>Molex</strong> region operates at least one low-cost manufacturing center,<br />
whether in China, India, Malaysia, Mexico, Poland, Slovakia or Thailand.<br />
<strong>Molex</strong> continually looks for ways to reduce its manufacturing costs as it increases capacity, resulting<br />
in a trend of fewer but larger factories. The Company achieved economies of scale and higher capacity<br />
utilization while continuing to assure on time delivery. <strong>Molex</strong> has consolidated certain plants and expanded<br />
others, with the result that the average <strong>Molex</strong> factory is 25% larger and generally manufactures a wider range<br />
of products than five years ago.<br />
Raw Materials<br />
The principal raw materials that <strong>Molex</strong> purchases for the manufacture of its products include plastic<br />
resins for molding, metal alloys (primarily copper based) for stamping and gold and palladium salts for use in<br />
the plating process. The Company also purchases molded and stamped components and connector<br />
assemblies. Most materials and components used in the Company’s products are available from several<br />
sources. To achieve economies of scale, <strong>Molex</strong> concentrates purchases from a limited number of suppliers,<br />
and therefore in the short term may be dependent upon certain suppliers to meet performance and quality<br />
specifications and delivery schedules. <strong>Molex</strong> anticipates that its raw material expenditures as a percentage of<br />
sales may increase due to growth in <strong>Molex</strong>’s integrated products business and increases in certain commodity<br />
costs.<br />
Backlog and Seasonality<br />
The backlog of unfilled orders at June 30, <strong>2005</strong> was approximately $259.5 million, a 22% decline<br />
compared with backlog of $332.6 million at June 30, 2004. The decrease in backlog was partially attributable<br />
to an increase in distribution orders in June 2004 of approximately $36 million in advance of a price increase.<br />
In addition, during fiscal <strong>2005</strong> the Company provided additional vendor-managed inventory progress to<br />
customers. Under this method, the new order and shipment occur simultaneously and without impacting<br />
8
eported backlog. Substantially all of these orders are scheduled for delivery within 12 months. The majority<br />
of orders are shipped within 30 days of acceptance.<br />
Employees<br />
<strong>Molex</strong> does not believe that aggregate worldwide sales reflect any significant degree of seasonality.<br />
As of June 30, <strong>2005</strong>, <strong>Molex</strong> employed 27,525 people worldwide. The Company believes it has been<br />
successful in attracting and retaining qualified personnel in highly competitive labor markets due to its<br />
competitive compensation and benefits as well as its rewarding work environment. <strong>Molex</strong> considers its<br />
relations with its employees to be strong.<br />
<strong>Molex</strong> is committed to employee development and places a high priority on developing <strong>Molex</strong><br />
leaders of the future through training at all levels. This includes on-the-job and online learning, as well as<br />
custom initiatives such as the Company’s two-year, in-house global management training program.<br />
Acquisitions and Investments<br />
<strong>Molex</strong>’s strategy to provide a broad range of connectors requires a wide variety of technologies,<br />
products and capabilities. The rapid pace of technological development in the connector industry and the<br />
specialized expertise required in different markets make it difficult for a single company to organically<br />
develop all of the required products. Thus, <strong>Molex</strong> makes selective acquisitions primarily to gain new<br />
products or greater access to markets.<br />
<strong>Molex</strong> will seek to make future investments or acquisitions where it believes that it can stimulate the<br />
development of, or acquire, new technologies and products to further its strategic objectives and strengthen<br />
its existing businesses. However, the source for a significant majority of the Company’s growth has come<br />
from internally developed products and not acquisitions.<br />
Intellectual Property<br />
Intellectual property rights that apply to the Company’s various products and services include<br />
patents, trade secrets and trademarks. <strong>Molex</strong> maintains an active program to protect its investment in<br />
technology by attempting to ensure intellectual property rights protection for its products.<br />
As of June 30, <strong>2005</strong>, the Company owned 870 United States patents and had 252 patent applications<br />
on file with the U.S. Patent Office. The Company also owned 2,999 corresponding patents and had 1,584<br />
patent applications on file in other countries. No assurance can be given that any patents will be issued on<br />
pending or future applications. As the Company develops products for new markets and uses, it normally<br />
seeks available patent protection.<br />
<strong>Molex</strong> also protects certain details about its processes, products and strategies as trade secrets,<br />
keeping confidential the information that provides the Company with a competitive advantage. <strong>Molex</strong> has<br />
ongoing programs designed to maintain the confidentiality of such information.<br />
The Company believes that its intellectual property is important but does not consider itself<br />
materially dependent upon any single patent or group of related patents.<br />
Regulatory Compliance<br />
<strong>Molex</strong> is committed to achieving high standards of environmental quality and product safety, and<br />
strives to provide a safe and healthy workplace for its employees, contractors and the communities in which it<br />
does business. The Company has regional environmental, health and safety (EHS) policies and strict<br />
disciplines that are applied to its operations. <strong>Molex</strong> closely monitors the environmental laws and regulations<br />
in the countries in which it operates and believes it is in full compliance with federal, state and local<br />
regulations pertaining to environmental protection.<br />
9
Many of <strong>Molex</strong>’s worldwide manufacturing sites are certified to the International Organization for<br />
Standardization (ISO) 14001 environmental management system standard, which requires that a broad range<br />
of environmental processes and policies be in place to minimize environmental impact, maintain compliance<br />
with environmental regulations and communicate effectively with interested stakeholders. <strong>Molex</strong>’s ISO<br />
14001 environmental auditing program includes not only compliance components, but also modules on<br />
business risk, environmental excellence and management systems. <strong>Molex</strong> has internal processes that focus<br />
on minimizing and properly managing hazardous materials used in its facilities and products. The Company<br />
monitors regulatory and resource trends and sets company-wide short and long-term performance targets for<br />
key resources and emissions.<br />
The manufacture, assembly and testing of <strong>Molex</strong> products are subject to a broad array of laws and<br />
regulations, including restrictions on the use of hazardous materials. <strong>Molex</strong> believes that its efforts to reduce<br />
the use of hazardous substances have positioned the Company well to meet environmental restrictions on<br />
product content throughout the world, such as the Restriction on Hazardous Substances (RoHS) directive in<br />
the European Union. The RoHS directive eliminates most uses of lead, cadmium, hexavalent-chromium,<br />
mercury and certain flame-retardants in electronics placed on the market after July 1, 2006.<br />
Executive Officers<br />
The following information relates to the executive officers of <strong>Molex</strong> who serve at the discretion of<br />
the Board of Directors and are customarily elected for one-year terms at the Regular Meeting of the Board of<br />
Directors held immediately following the Annual Stockholders’ Meeting. All of the executive officers named<br />
hold positions as officers and/or directors of one or more subsidiaries of the Company. For purposes of<br />
this disclosure, only the principal positions are set forth.<br />
Positions Held with Registrant Year<br />
Name During the Last Five Years (a) Age Employed<br />
Frederick A. Krehbiel (b) Co-Chairman (1999-); Chief Executive Officer (2004-<strong>2005</strong>); 64 1965 (c)<br />
Co-Chief Executive Officer (1999-2001).<br />
John H. Krehbiel, Jr. (b) Co-Chairman (1999-); Co-Chief Executive 68 1959 (c)<br />
Officer (1999-2001).<br />
Martin P. Slark Vice-Chairman and Chief Executive Officer (<strong>2005</strong>-); 50 1976<br />
President and Chief Operating Officer (2001-<strong>2005</strong>);<br />
Executive Vice President (1999-2001).<br />
Liam McCarthy President and Chief Operating Officer (<strong>2005</strong>-); 49 1976<br />
Regional Vice President of Operations, Europe (2000-<br />
<strong>2005</strong>); Interim General Manager of <strong>Molex</strong> Ireland Ltd.<br />
(2002-2004).<br />
Robert B. Mahoney Executive Vice President (2002-); Regional 52 1995<br />
President, Far East South (2004-); Treasurer<br />
and Chief Financial Officer (1996-2004, <strong>2005</strong>);<br />
Corporate Vice President (1996-2002).<br />
Ronald L. Schubel Executive Vice President (2001-); Corporate Vice 61 1981<br />
President (1982-2001); Regional President, Americas (1998-).<br />
James E. Fleischhacker Executive Vice President (2001-); Corporate 61 1984<br />
Vice President (1994-2001); Regional President,<br />
Far East South (1998-2001, 2003-2004).<br />
10
Positions Held with Registrant Year<br />
Name During the Last Five Years (a) Age Employed<br />
David D. Johnson Vice President, Treasurer and Chief 49 <strong>2005</strong><br />
Financial Officer (<strong>2005</strong>-); Vice President, Treasurer and<br />
Chief financial Officer, Sypris Solutions, Inc. (1998-<strong>2005</strong>).<br />
Katsumi Hirokawa Vice President (<strong>2005</strong>-). Positions at <strong>Molex</strong> Japan 58 1995<br />
Co., Ltd.: President (2002-); Executive Vice President-<br />
Sales (2002-2002); Senior Director-Sales (1996-2002).<br />
Graham C. Brock Vice President (<strong>2005</strong>-) and Regional 51 1976<br />
President, Europe (<strong>2005</strong>-); Regional Vice President -<br />
Sales & Marketing, Europe (2000-<strong>2005</strong>).<br />
Kathi M. Regas Vice President (1994-). 49 1985<br />
Louis A. Hecht Corporate Secretary (1977-) and 61 1974<br />
General Counsel (1975-).<br />
(a) All positions are with Registrant unless otherwise stated.<br />
(b) John H. Krehbiel, Jr. and Frederick A. Krehbiel (the Krehbiel Family) are brothers. The members of the<br />
Krehbiel Family may be considered to be “control persons” of the Registrant. The other executive<br />
officers listed above have no relationship, family or otherwise, to the Krehbiel Family, Registrant or each<br />
other.<br />
(c) Includes period employed by Registrant’s predecessor.<br />
Code of Business Conduct<br />
In accordance with Item 406 of Regulation S-K, <strong>Molex</strong> has adopted a Code of Business Conduct<br />
that incorporates its code of ethics applicable to all employees and officers, including the chief executive<br />
officer and chief financial officer, and including its independent directors, who are not employees of the<br />
Company, with regard to their <strong>Molex</strong>-related activities. The Code of Business Conduct incorporates the<br />
Company’s guidelines designed to deter wrongdoing and to promote honest and ethical conduct and<br />
compliance with applicable laws and regulations. They also incorporate <strong>Molex</strong>’s expectations of its<br />
employees that enable the Company to provide accurate and timely disclosure in filings with the Securities<br />
and Exchange Commission and other public communications. In addition, they incorporate <strong>Molex</strong><br />
guidelines pertaining to topics such as environmental, health and safety compliance, diversity and nondiscrimination,<br />
supplier expectations, privacy and business continuity.<br />
The full text of <strong>Molex</strong>’s Code of Business Conduct is published on the Company’s investor relations<br />
Web site at www.molex.com.<br />
11
Item 2. Properties<br />
<strong>Molex</strong> owns and leases manufacturing, warehousing and office space in locations around the world.<br />
The leases are of varying terms with expirations ranging from fiscal 2006 through fiscal 2017. The leases in<br />
aggregate are not considered material to the financial position of the Company. The total square footage of<br />
these facilities at June 30, <strong>2005</strong> is presented below:<br />
Owned Leased Total<br />
6,874,932 693,830 7,568,762<br />
<strong>Molex</strong> believes that its buildings, machinery and equipment have been well maintained and are<br />
adequate for its current needs. A listing of principal manufacturing facilities is presented below:<br />
Australia Italy Singapore<br />
Melton, Victoria Padova Jurong Town<br />
Brazil Japan Slovakia<br />
Manaus (2) Kagoshima (3) Kechnec<br />
São Paulo Okayama Liptovsky Hradok<br />
Shizuoka<br />
China (P.R.C.) Tochigi<br />
Dongguan (2) Yamato Taiwan<br />
Shanghai Taipei<br />
Dalian (3) Malaysia<br />
Perai, Penang Thailand<br />
France Bangpakong<br />
Villemur Mexico<br />
Guadalajara United States<br />
Germany Nogales Pinellas Park, Florida<br />
Ettlingen St. Petersburg, Florida<br />
Poland Downers Grove, Illinois (2)<br />
Tczew Gilford, New Hampshire<br />
India Sulecin Lincoln, Nebraska (3)<br />
Bangalore (2) Torzym Naperville, Illinois (2)<br />
Gandhinagar Mooresville, Indiana<br />
Noida Portugal Maumelle, Arkansas (2)<br />
Pune Santo Tirso Auburn Hills, Michigan (2)<br />
Ireland Republic of Korea<br />
Millstreet Ansan City (2)<br />
Shannon (2) Gwang-Ju<br />
Item 3. Legal Proceedings<br />
Between March 2, <strong>2005</strong> and April 22, <strong>2005</strong> seven separate complaints were filed, each purporting to<br />
be on behalf of a class of <strong>Molex</strong> shareholders, against <strong>Molex</strong>, and certain <strong>Molex</strong> officers and employees. The<br />
shareholder actions have been consolidated before Judge Ruben Castillo in a case pending in the United<br />
States District Court for the Northern District of Illinois Eastern Division entitled The Takara Trust v.<br />
<strong>Molex</strong> Incorporated, et. al., Case No. 05C 1245. The Consolidated Amended Complaint alleges, among<br />
other things, that during the period from July 27, 2004 to February 14, <strong>2005</strong> the named defendants made or<br />
caused to be made a series of materially false or misleading statements about <strong>Molex</strong>’s business, prospects,<br />
operations, and financial statements which constituted violations of Section 10(b) of the Exchange Act of<br />
1934, as amended, and Rule 10b-5 promulgated hereunder and Section 20(a) of the Exchange Act. The<br />
complaint also alleges that certain of the named defendants engaged in insider trading in violation of Section<br />
10(b) and Rule 10b-5. As relief, the complaint seeks, among other things, declaration that the action be<br />
certified as a proper class action, unspecified compensatory damages (including interest) and payment of<br />
costs and expenses (including fees for legal counsel and experts). The individual defendants named in the<br />
12
Consolidated Amended Complaint are: J. Joseph King, Diane S. Bullock, John H. Krehbiel Jr., Frederick A.<br />
Krehbiel, Ronald L. Schubel and Martin P. Slark. On July 6, <strong>2005</strong> the Court appointed City of Pontiac<br />
Group as lead plaintiff, and approved City of Pontiac Group’s choice of lead counsel. On September 6,<br />
<strong>2005</strong>, the Court denied the plaintiffs motion to permit limited discovery. <strong>Molex</strong> intends to vigorously contest<br />
the Shareholder Actions.<br />
Item 4. Submission of Matters to a Vote of Security Holders<br />
None.<br />
PART II<br />
Item 5. Market for the Registrant’s Common Equity, Related Stockholder Matters and<br />
Issuer Purchases of Equity Securities<br />
<strong>Molex</strong> is traded on the National Market System of the NASDAQ in the United States and on the<br />
London Stock Exchange and trades under the symbols MOLX for Common Stock and MOLXA for Class A<br />
Common Stock.<br />
The number of stockholders of record at September 2, <strong>2005</strong> was 2,702 for Common Stock and 7,907<br />
for Class A Common Stock.<br />
The following table presents quarterly stock prices for the years ended June 30:<br />
<strong>2005</strong> 2004 2003<br />
Low – High Low – High Low – High<br />
Common Stock 1st $27.55 $31.39 $26.14 $31.10 $22.85 $33.75<br />
2nd 27.57 31.31 28.70 35.12 19.43 29.62<br />
3rd 24.62 29.13 28.48 36.10 19.98 25.50<br />
4th 24.47 28.15 27.72 33.24 21.15 29.36<br />
Class A Common Stock 1st 23.55 26.82 21.72 26.69 19.79 28.94<br />
2nd 24.33 27.46 24.36 29.67 17.95 26.12<br />
3rd 22.48 25.99 24.44 30.36 17.02 22.12<br />
4th 21.75 25.08 23.72 28.55 18.01 25.73<br />
The following table presents quarterly dividends per common share for the years ended June 30:<br />
Common Stock<br />
Class A<br />
Common Stock<br />
<strong>2005</strong> 2004 <strong>2005</strong> 2004<br />
Quarter ended:<br />
September 30.............................................................................. $ 0.0375 $ 0.0250 $ 0.0375 $ 0.0250<br />
December 31 .............................................................................. 0.0375 0.0250 0.0375 0.0250<br />
March 31 ..................................................................................... 0.0375 0.0250 0.0375 0.0250<br />
June 30......................................................................................... 0.0375 0.0250 0.0375 0.0250<br />
Total............................................................................................. $ 0.1500 $ 0.1000 $ 0.1500 $ 0.1000<br />
Cash dividends on common stock have been paid every year since 1977. On July 28, <strong>2005</strong>, the<br />
Board of Directors of <strong>Molex</strong> increased the regular quarterly cash dividend to $0.05 per share.<br />
On April 25, <strong>2005</strong>, <strong>Molex</strong>’s Board of Directors authorized purchases of the Company’s outstanding<br />
Common Stock and Class A Common Stock during the period ending December 31, 2006 up to an aggregate<br />
value of $250 million on a discretionary basis. This authorization replaced the Company’s previous<br />
authorization to purchase shares up to an aggregate value of $100 million during the fiscal year ending June<br />
30, <strong>2005</strong>. As of June 30, <strong>2005</strong>, the dollar value of shares that may yet be purchased under the new plan was<br />
$215 million.<br />
13
The following table contains information about purchases of <strong>Molex</strong> equity securities by the<br />
Company pursuant to the current authorization during the quarter ended June 30, <strong>2005</strong>:<br />
Total Number of Dollar Value of<br />
Total Number Average Price Shares Purchased Shares that May Yet<br />
of Shares Paid Per as Part of Publicly Be Purchased Under<br />
Period: Purchased Share Announced Plan the Plan<br />
April 1 to April 30 .................... − − − $250,000,000<br />
May 1 to May 31 ....................... 1,265,000 $23.63 1,265,000 $220,104,151<br />
June 1 to June 30 ...................... 198,280 (1) $24.75 190,000 $215,397,970<br />
Total....................................... 1,463,280 $23.78 1,455,000 $215,397,970<br />
(1) During the quarter, 8,280 shares of Class A Common Stock were transferred to the Company<br />
from certain employees to pay withholding taxes on the vesting of restricted stock. The aggregate market<br />
value of the shares transferred totaled $201 thousand.<br />
Descriptions of the Company’s Common Stock appear under the caption “Description of the Three<br />
Different Classes of Stock” in the Company’s <strong>2005</strong> Proxy Statement and in Note 20 of the “Notes to<br />
Consolidated Financial Statements.”<br />
14
Item 6. Selected Financial Data<br />
<strong>Molex</strong> Incorporated<br />
Ten-Year Financial Highlights Summary<br />
(in thousands, except per share data)<br />
<strong>2005</strong> 2004 2003 2002 2001 2000 1999 1998 1997 1996<br />
Operations<br />
Net revenue ..................... $2,548,652 $2,246,715 $1,843,098 $1,711,497 $2,365,549 $2,217,096 $1,711,649 $1,622,975 $1,539,712 $1,382,673<br />
Gross profit ..................... 873,344 776,746 607,700 536,551 859,610 853,892 668,125 670,266 640,895 562,731<br />
Income from operations<br />
Income before<br />
197,346 221,183 102,258 101,148 283,754 314,989 221,145 263,179 251,278 216,277<br />
income taxes ............... 216,887 239,892 110,042 93,221 291,416 323,694 230,214 274,823 262,369 228,953<br />
Income taxes.................... 62,463 63,571 24,762 16,684 87,424 100,810 52,363 92,490 95,581 83,300<br />
Net income (1) (2) ..........<br />
Earnings per share: (3)<br />
154,434 175,950 84,918 76,479 203,919 222,454 178,029 182,243 166,716 145,586<br />
Basic............................. 0.82 0.93 0.44 0.39 1.04 1.13 0.92 0.93 0.85 0.74<br />
Diluted.........................<br />
Net income - percent<br />
0.81 0.92 0.44 0.39 1.03 1.12 0.91 0.92 0.84 0.74<br />
of net revenue............. 6.1% 7.8% 4.6% 4.5% 8.6% 10.0% 10.4% 11.2% 10.8% 10.5%<br />
Financial Position<br />
Current assets .................. 1,374,063 1,168,644 962,113 915,343 891,865 1,023,009 881,338 867,791 873,614 734,589<br />
Current liabilities............. 469,504 428,464 356,148 359,593 374,106 475,449 342,441 336,275 342,026 275,182<br />
Working capital(4) .......... 904,559 740,180 605,965 555,750 517,759 547,560 538,897 531,516 531,588 459,407<br />
Current ratio(5) ...............<br />
Property, plant and<br />
2.9 2.7 2.7 2.5 2.4 2.2 2.6 2.6 2.6 2.7<br />
equipment, net............ 984,237 1,022,378 1,007,948 1,067,590 1,092,567 980,775 809,602 676,161 665,468 613,125<br />
Total assets....................... 2,727,672 2,572,346 2,329,870 2,253,920 2,213,627 2,247,106 1,902,012 1,639,634 1,636,931 1,460,999<br />
Long-term debt ............... 8,043 10,243 13,137 14,223 19,351 21,593 20,148 5,566 7,350 7,450<br />
Capital leases.................... 1,932 3,796 3,731 3,626 6,114 - - - - -<br />
Stockholders’ equity ....... 2,168,264 2,065,994 1,896,568<br />
Return on beginning<br />
1,827,652 1,765,640 1,705,804 1,500,537 1,261,570 1,235,912 1,131,271<br />
stockholders’ equity (6) 7.5% 9.3% 4.6% 4.3% 12.0% 14.8% 14.1% 14.7% 14.7% 13.1%<br />
Dividends per share (3)<br />
Average common<br />
shares outstanding: (3)<br />
0.15 0.10 0.10 0.10 0.10 0.09 0.05 0.05 0.04 0.03<br />
Basic............................. 188,646 190,207 191,873 194,327 195,471 196,060 194,340 195,750 196,389 196,768<br />
Diluted......................... 190,572 192,186 193,229 195,986 197,633 198,208 195,631 197,971 198,349 198,819<br />
(1) Fiscal <strong>2005</strong> results include a restructuring charge of $27.9 million ($21.6 million after-tax) and a charge for asset impairment of<br />
$25.2 million ($24.3 million after-tax). Fiscal 2003 results include a restructuring charge of $35.0 million ($24.8 million after-tax).<br />
Fiscal 2002 results include a restructuring charge of $24.2 million ($18.8 million after-tax. Fiscal 2001 results include a<br />
restructuring charge of $30.8 million ($21.4 million after-tax). See Notes 7 and 9 of the “Notes to Consolidated Financial<br />
Statements” for a discussion of the Company’s restructuring costs and other charges and credits to income.<br />
(2) Fiscal <strong>2005</strong> results include the correction of prior years’ errors. See Note 4 of the “Notes to Consolidated Financial Statements.”<br />
(3) Restated for the following stock dividends: 25%–January 2000; 25%–November 1997; 25%–February 1997; 25%–August 1995.<br />
(4) Working capital is defined as current assets minus current liabilities.<br />
(5) Current ratio is defined as current assets divided by current liabilities.<br />
(6) Return on beginning stockholders’ equity is defined as the current year net income divided by the beginning stockholder’s equity.<br />
The prior year-end stockholders’ equity is the same as the beginning stockholders’ equity for the current year.<br />
15
Item 7. Management’s Discussion and Analysis of Financial Condition and Results of<br />
Operations<br />
Overview<br />
<strong>Molex</strong>'s core business is the manufacture and sale of electromechanical components. <strong>Molex</strong>’s<br />
products are used by a large number of leading original equipment manufacturers (OEMs) throughout the<br />
world. The Company designs, manufactures and sells more than 100,000 products including terminals,<br />
connectors, planar cables, cable assemblies, interconnection systems, backplanes, integrated products and<br />
mechanical and electronic switches. <strong>Molex</strong> also provides manufacturing services to integrate specific<br />
components into a customer’s product.<br />
<strong>Molex</strong> connectors, interconnecting devices and assemblies are used principally in the<br />
telecommunications, computer, consumer products, automotive and industrial markets. The Company’s<br />
products are used in a wide range of applications including desktop and notebook computers, computer<br />
peripheral equipment, mobile phones, digital electronics such as cameras and plasma televisions, automobile<br />
engine control units and adaptive braking systems, factory robotics and diagnostic equipment.<br />
Net revenues by market can fluctuate based on various factors including new technologies within the<br />
industry, composition of customers and new products or model changes introduced by <strong>Molex</strong> or its<br />
customers. The approximate percentage of net revenue by market for fiscal <strong>2005</strong>, 2004 and 2003 is outlined<br />
below. Certain changes have been made to previously reported 2004 and 2003 information to conform to<br />
the Company’s current classification of customers into its market definitions.<br />
% of Net Revenue<br />
<strong>2005</strong> 2004 2003<br />
Markets:<br />
Telecommunications........................................................................................................... 27% 23% 21%<br />
Data Products ...................................................................................................................... 24 26 27<br />
Automotive........................................................................................................................... 19 17 19<br />
Consumer.............................................................................................................................. 18 21 21<br />
Industrial............................................................................................................................... 9 10 9<br />
Other ..................................................................................................................................... 3 3 3<br />
Total................................................................................................................................. 100% 100% 100%<br />
<strong>Molex</strong> believes that its sales mix is balanced, with growth prospects in a number of markets. During<br />
the last two years, the Company has experienced higher growth rates in the telecommunications market,<br />
which includes mobile phones, networking and transmission equipment and slower growth in automotive<br />
and consumer products.<br />
<strong>Molex</strong> sells its products directly to OEMs and to their subcontractors and suppliers and, to a lesser<br />
extent, through distributors throughout the world. <strong>Molex</strong> engineers work collaboratively with customers to<br />
develop products that meet their specific needs. The Company’s connector products are designed to help<br />
manufacturers assemble their own products more efficiently. <strong>Molex</strong>’s electronic components help enable<br />
manufacturers to break down their production into sub-assemblies that can be built on different production<br />
lines, in different factories or by subcontractors. The Company’s connectors allow these sub-assemblies to<br />
be readily plugged together before selling the end product to a customer. <strong>Molex</strong> connectors also enable users<br />
to connect together related electronic items, such as mobile phones to battery chargers and computers to<br />
printers. Many <strong>Molex</strong> customers are multi-national corporations that manufacture their products in multiple<br />
operations in several countries.<br />
<strong>Molex</strong> services its customers through its global manufacturing footprint. As of June 30, <strong>2005</strong>, the<br />
Company operated 58 manufacturing plants, located in 19 countries on five continents. Manufacturing in<br />
many sectors has continued to move from the United States and Western Europe to lower cost regions. In<br />
addition, reduced trade barriers, lower freight cost and improved supply chain logistics have reduced the need<br />
for duplicate regional manufacturing capabilities. For these reasons, <strong>Molex</strong>’s strategy has been to consolidate<br />
multiple plants of modest size in favor of operating fewer, larger and more integrated facilities in strategic<br />
16
locations around the world. In April <strong>2005</strong>, <strong>Molex</strong> announced a plan to realign part of its manufacturing<br />
capacity that is expected to result in the closing of seven plants in five countries. <strong>Molex</strong> operates its business<br />
in four geographic regions. In <strong>2005</strong>, 51% of the Company’s revenue was derived from sales in Asia.<br />
Economic growth in Asia, particularly in China, is anticipated to be greater than in the Americas and Europe.<br />
The Company’s management believes that it has positioned the business to benefit from this trend.<br />
Approximately 40% of <strong>Molex</strong>’s manufacturing capacity is in lower cost areas such as China, Eastern Europe<br />
and Mexico.<br />
The market in which the Company operates is highly fragmented with a limited number of large<br />
companies and a significant number of smaller companies making electronic connectors. <strong>Molex</strong> is currently<br />
the world’s second-largest manufacturer of electronic connectors. <strong>Molex</strong> believes that its global presence and<br />
its ability to design and manufacture its products throughout the world and to service its customers globally<br />
is a key advantage for the Company. The Company’s growth has come primarily from new products that it<br />
develops, often in collaboration with its customers.<br />
Financial Highlights<br />
Net revenue for fiscal <strong>2005</strong> of $2.55 billion increased 13.4% over fiscal 2004 net revenue of $2.25<br />
billion. Net revenue in local currencies increased 10.2%. Net income for the year of $154.4 million<br />
decreased $21.6 million from $176.0 million reported in the prior year. This year’s net income included a<br />
restructuring charge of $27.9 million ($21.6 million after-tax), a goodwill impairment charge of $22.9 million<br />
($22.9 million after-tax) and an asset impairment charge of $2.3 million ($1.4 million after-tax).<br />
On April 25, <strong>2005</strong>, the Company announced a plan to realign part of its manufacturing capacity in<br />
order to reduce costs and better optimize plant utilization and to reduce selling, general and administrative<br />
expenses. <strong>Molex</strong> recorded a pre-tax charge of $27.9 million in the fiscal <strong>2005</strong> fourth quarter and is<br />
anticipating an additional estimated pre-tax charge of $15 million to $25 million during fiscal 2006 in<br />
connection with this plan. Cash expenditures through June 30, <strong>2005</strong> in connection with the restructuring<br />
were $3.8 million, consisting primarily of severance and other employee-related costs. Implementation of<br />
this restructuring program began in the fiscal <strong>2005</strong> fourth quarter and is expected to continue through fiscal<br />
2006.<br />
During the fiscal <strong>2005</strong> fourth quarter in accordance with Statement of Financial Accounting<br />
Standard (SFAS) No. 142, “Goodwill and Other Intangible Assets,” the Company performed its annual<br />
impairment review and recorded a non-cash goodwill impairment charge of $22.9 million related to the<br />
adjustment of the carrying value of the Company’s <strong>Molex</strong> Premise Networks (MPN) business unit.<br />
The Company also recorded in the fiscal <strong>2005</strong> fourth quarter an asset impairment charge of $2.3<br />
million to reflect the expected sale price, less costs of disposition, of a U.S. property that is held for sale.<br />
This building was previously used for manufacturing and warehousing of fiber optic products that were<br />
consolidated into other facilities.<br />
In connection with the resignation of its former auditor, responses to SEC comment inquiries, and<br />
internal investigations authorized by the Company’s Audit Committee, the Company estimates that legal,<br />
accounting and other costs during fiscal <strong>2005</strong> increased by approximately $9.9 million.<br />
These results do not include any impact related to the expensing of stock options according to SFAS<br />
No. 123(R), “Share-Based Payment.” If the Company had applied SFAS No. 123(R) to its results for the<br />
year ended June 30, <strong>2005</strong>, net income would have been reduced by approximately $10 million. The Company<br />
has adopted SFAS No. 123(R) in fiscal 2006 as required by that standard.<br />
Outlook<br />
<strong>Molex</strong> believes that the outlook of the global markets remains favorable. During fiscal 2006, <strong>Molex</strong><br />
will continue to focus on delivering additional profit leverage and increasing its market share. The Company<br />
expects net revenue growth of 5% to 8% during fiscal 2006. The Company estimates that net revenue for<br />
the fiscal year ending June 30, 2006 will be in a range of $2.675 billion to $2.750 billion.<br />
17
The Company anticipates that its growth in fiscal 2006 will be led by the Far East North and Far<br />
East South regions, while business in the Americas and Europe is expected to increase modestly. The<br />
Company expects strong demand for digital consumer products, including high definition televisions and<br />
digital audio players, hand-held devices and data storage products. In the industrial and distribution markets,<br />
the Company expects solid growth, and in the telecom infrastructure and automotive markets, the Company<br />
expects growth to be below the average for the overall connector market. <strong>Molex</strong> also expects to continue to<br />
increase sales in the medical and commercial military markets.<br />
Based on these net revenue expectations, earnings per share for the fiscal year ending June 30, 2006,<br />
including a pre-tax restructuring charge expected to be between $15.0 million and $25.0 million, are estimated<br />
to be in a range of $1.07 to $1.12. The reduction in earnings per share from the restructuring charge is<br />
estimated to be in the range of $0.06 to $0.09. In addition, the earnings per share estimate includes the<br />
adoption of SFAS No. 123(R) requiring the expensing of stock option costs. This non-cash accounting<br />
charge is expected to negatively impact fiscal 2006 earnings per share by approximately $0.05.<br />
Management currently expects the effective tax rate to decrease to approximately 28.5% for fiscal<br />
2006 compared with 28.8% in <strong>2005</strong>.<br />
The Company’s current restructuring activities are expected to be substantially completed during<br />
fiscal 2006. However, the actual timing of the facility closures and related headcount reductions remain<br />
dependent upon a number of factors, including the Company’s efforts to achieve a phased and efficient<br />
transfer of production and obtaining customer approvals particularly in the automotive market. <strong>Molex</strong><br />
expects that the pre-tax savings from these restructuring activities will be in the range of $10 million to $15<br />
million for fiscal 2006. These savings are after transition costs to be incurred in relocating manufacturing<br />
assets, and the costs of increased direct labor headcount at the facilities where production is being<br />
transferred. In total, <strong>Molex</strong> expects to terminate approximately 1,400 employees globally, and to add back<br />
approximately 800 employees, for a net reduction of approximately 600 employees. The cost savings are<br />
expected to be heavily weighted toward the end of fiscal 2006, by which time the plant relocations should be<br />
substantially completed. As a result, the expected cost benefit in fiscal 2007 is substantially greater than in<br />
fiscal 2006. The estimated full-year impact for fiscal 2007 of these savings is expected to be in the range of<br />
$32 million to $40 million. The timing of the cash expenditures associated with these charges does not<br />
necessarily correspond to the fiscal period in which the accounting charge is taken.<br />
The Company estimates capital spending in fiscal 2006 to be in a range of $220 million to $240<br />
million, primarily for investment in production assets including molds, dies and assembly equipment, and for<br />
the planned expansion in lower cost locations such as China and Poland. The only significant planned new<br />
plant location is a seventh manufacturing facility in China, to be located in the southwest region.<br />
<strong>Molex</strong>’s continued success is dependent on technological advancement, including developing<br />
strategic products for specific markets. Research and development spending in fiscal 2006 is estimated to be<br />
in a range of $145 million to $155 million, almost entirely for new product development.<br />
Critical Accounting Estimates<br />
The accounting and financial reporting policies of the Company are in conformity with U.S. generally<br />
accepted accounting principles (GAAP). The preparation of financial statements in conformity with GAAP<br />
requires management to make estimates and assumptions that affect the reported amounts of assets and<br />
liabilities, the disclosure of contingent assets and liabilities at the date of the financial statements, and the<br />
reported amounts of revenues and expenses during the reporting period. Management has discussed the<br />
development and selection of the critical accounting estimates communicated below with the Audit<br />
Committee of the Company’s Board of Directors and the Audit Committee has reviewed the Company’s<br />
related disclosures herein.<br />
<strong>Molex</strong>’s significant accounting policies are summarized in Note 2 of the “Notes to Consolidated<br />
Financial Statements.” Noted here are a number of policies that require significant judgments or estimates.<br />
18
Revenue Recognition<br />
<strong>Molex</strong>’s revenue recognition policies are in accordance with Staff Accounting Bulletin (SAB)<br />
No. 101, “Revenue Recognition in Financial Statements,” and SAB No. 104, “Revenue Recognition,” as<br />
issued by the Securities and Exchange Commission (the Commission) and other applicable guidance.<br />
The Company recognizes revenue upon shipment of product and transfer of ownership to the<br />
customer. Contracts and customer purchase orders generally are used to determine the existence of an<br />
arrangement. Shipping documents, proof of delivery and customer acceptance (when applicable) are used to<br />
verify delivery. The Company assesses whether an amount due from a customer is fixed and determinable<br />
based on the terms of the agreement with the customer, including, but not limited to, the payment terms<br />
associated with the transaction. The impact of judgments and estimates on revenue recognition is minimal.<br />
A reserve for estimated returns is established at the time of sale based on historical return experience to<br />
cover returns of defective product and is recorded as a reduction of revenue.<br />
Income Taxes<br />
Deferred tax assets and liabilities are recognized based on differences between the financial<br />
statement and tax bases of assets and liabilities using presently enacted tax rates. The Company has net<br />
deferred tax assets of $143.5 million at June 30, <strong>2005</strong>.<br />
The Company has operations in several countries around the world that are subject to income and<br />
other similar taxes in these countries. The estimation of the income tax amounts to be recorded by the<br />
Company involves the interpretation of complex tax laws and regulations, evaluation of tax audit findings and<br />
assessment of how foreign taxes may affect domestic taxes. Although the Company’s management believes<br />
its tax accruals are adequate, differences may occur in the future depending on the resolution of pending and<br />
new tax matters.<br />
The Company periodically assesses the carrying value of its deferred tax assets based upon its ability<br />
to generate sufficient future taxable income in certain tax jurisdictions. If the Company determines that it<br />
will not be able to realize all or part of its deferred tax assets in the future, a valuation allowance is established<br />
in the period such determination is made. The Company has determined that it is unlikely that it will realize a<br />
net deferred asset in the future relating to certain non-U.S. net operating losses. A valuation allowance of<br />
$5.6 million was recorded in fiscal <strong>2005</strong> to offset the recording of a deferred tax asset of $5.6 million related<br />
to certain European net operating losses. The cumulative valuation allowance relating to net operating losses<br />
is approximately $28.7 million at June 30, <strong>2005</strong>.<br />
It is the Company’s policy to establish accruals for taxes that may become payable in future years as a<br />
result of examinations by tax authorities. The Company establishes the accruals based upon management’s<br />
assessment of probable contingencies. At June 30, <strong>2005</strong>, the Company believes it has appropriately accrued<br />
for probable contingencies. To the extent the Company was to prevail in matters for which accruals have<br />
been established or be required to pay amounts in excess of accruals, the Company’s effective tax rate in a<br />
given financial statement period could be affected.<br />
Inventory<br />
Inventories are valued at the lower of first-in, first-out (FIFO) cost or market value. FIFO<br />
inventories recorded in the Company’s consolidated balance sheet are adjusted for an allowance covering<br />
inventories determined to be slow-moving or excess. The allowance for slow-moving and excess inventories<br />
is maintained at an amount management considers appropriate based on factors such as historical usage of<br />
the product, open sales orders and future sales forecasts. If <strong>Molex</strong>’s sales forecast for specific products is<br />
greater than actual demand and the Company fails to reduce manufacturing output accordingly, it could be<br />
required to write down additional inventory, which would have a negative impact on gross margin and<br />
operating results. Such factors require judgment, and changes in any of these factors could result in changes<br />
to this allowance.<br />
19
Pension Plans<br />
The costs and obligations of the Company’s defined benefit pension plans are dependent on<br />
actuarial assumptions. Three critical assumptions used, which impact the net periodic pension expense<br />
(income) and two of which impact the benefit obligation, are the discount rate, expected return on plan assets<br />
and rate of compensation increase. The discount rate is determined based on high-quality fixed income<br />
investments that match the duration of expected benefit payments. The Company has typically used the<br />
market rate for AA/Aa rated corporate bonds for this assumption. The expected return on plan assets<br />
represents a forward projection of the average rate of earnings expected on the pension assets. The<br />
Company has estimated this rate based on historical returns of similarly diversified portfolios. The rate of<br />
compensation increase represents the long-term assumption for expected increases to salaries for pay-related<br />
plans. These key assumptions are evaluated annually. Changes in these assumptions can result in different<br />
expense and liability amounts.<br />
The effects of the indicated increase and decrease in selected assumptions for the Company’s<br />
pension plans as of June 30, <strong>2005</strong>, assuming no changes in benefit levels and no amortization of gains or<br />
losses, is shown below (in thousands):<br />
Increase (Decrease) Increase (Decrease)<br />
in PBO in Pension Expense<br />
U.S. Plan Int’l Plans U.S. Plan Int’l Plans<br />
Discount rate change:<br />
Increase 50 basis points.................................................................................. $(4,334) $(9,729) $(338) $(345)<br />
Decrease 50 basis points ................................................................................<br />
Expected rate of return change:<br />
3,974 8,447 356 372<br />
Increase 100 basis points................................................................................ N/A N/A $(340) $(305)<br />
Decrease 100 basis points .............................................................................. N/A N/A 340 305<br />
Other Postretirement Benefits<br />
The Company has retiree health care plans that cover the majority of its U.S. employees. There are<br />
no significant postretirement health care benefit plans outside of the U.S. The health care cost trend rate<br />
assumption has a significant effect on the amount of the accumulated postretirement benefit obligation<br />
(APBO) and retiree health care benefit expense. A 100 basis-point change in the assumed health care cost<br />
trend rates would have the following effects (in thousands):<br />
<strong>2005</strong> 2004 2003<br />
Effect on total service and interest cost:<br />
Increase 100 basis points....................................................................................... $ 1,073 $ 714 $ 407<br />
Decrease 100 basis points .....................................................................................<br />
Effect on APBO:<br />
(908) (600) (317)<br />
Increase 100 basis points....................................................................................... $ 8,655 $ 6,277 $ 5,942<br />
Decrease 100 basis points ..................................................................................... (7,325) (5,279) (4,654)<br />
Goodwill and Intangible Assets<br />
Goodwill is recorded when the purchase price paid for an acquisition exceeds the estimated fair value<br />
of the net identified tangible and intangible assets acquired.<br />
The Company performs an annual goodwill impairment analysis as of May 31st, or earlier if<br />
indicators of potential impairment exist. In assessing the recoverability of goodwill, the Company reviews<br />
both quantitative as well as qualitative factors to support its assumptions with regard to fair value. <strong>Molex</strong>’s<br />
impairment review process compares the fair value of the reporting unit in which goodwill resides to its<br />
carrying value. Reporting units may be operating segments as a whole or an operation one level below an<br />
operating segment, referred to as a component. Components are defined as operations for which discrete<br />
financial information is available and reviewed by segment management.<br />
The fair value of a reporting unit is estimated using a discounted cash flow model for the evaluation<br />
of impairment. The expected future cash flows are based on management’s estimates and are determined by<br />
20
looking at numerous factors including projected economic conditions and customer demand, revenue and<br />
margins, changes in competition, operating costs and new products introduced. In determining fair value,<br />
the Company makes certain judgments. If these estimates or their related assumptions change in the future<br />
as a result of changes in strategy and/or market conditions, the Company may be required to record an<br />
impairment charge.<br />
Although management believes its assumptions in determining the projected cash flows are<br />
reasonable, changes in those estimates could affect the evaluation.<br />
Restructuring Costs<br />
<strong>Molex</strong> has recorded charges in connection with restructuring its business. In accordance with SFAS<br />
No. 146, “Accounting for Costs Associated with Exit or Disposal Activities,” the Company recognizes a<br />
liability for restructuring costs at fair value when the liability is incurred. The main components of <strong>Molex</strong>’s<br />
restructuring plans are related to workforce reductions and the closure and consolidation of excess facilities.<br />
Workforce-related charges are accrued when it is determined that a liability has been incurred, which is<br />
generally after individuals have been notified of their termination dates and expected severance payments, but<br />
under certain circumstances may be recognized over a number of accounting periods. Plans to consolidate<br />
excess facilities result in charges for lease termination fees, future commitments to pay lease charges, net of<br />
estimated future sublease income, and adjustments to the fair value of buildings and equipment to be sold.<br />
Charges for the consolidation of excess facilities are based on an estimate of the amounts and timing of<br />
future cash flows related to the expected future remaining use and ultimate sale or disposal of buildings and<br />
equipment.<br />
If the amounts and timing of cash flows from restructuring activities are significantly different from<br />
Company estimates, the future amount of restructuring charges could be different than those projected.<br />
Impairment of Long-Lived Assets<br />
In accordance with SFAS No. 144, “Accounting for the Impairment or Disposal of Long-Lived<br />
Assets,” the Company assesses the impairment of long-lived assets, other than goodwill and trade names,<br />
including property and equipment, and identifiable intangible assets subject to amortization, whenever events<br />
or changes in circumstances indicate the carrying value may not be recoverable. Factors the Company<br />
considers important, which could trigger an impairment review, include significant changes in the manner of<br />
the Company’s use of the asset, changes in historical or projected operating performance, and significant<br />
negative economic trends.<br />
21
Results of Operations<br />
Year Ended June 30, <strong>2005</strong> Compared with Year Ended June 30, 2004<br />
Year Over Year Over<br />
Years Ended Year Year Results as %<br />
June 30, $ Change % Change of Net Revenue<br />
(in thousands) Favorable Favorable<br />
<strong>2005</strong> 2004 (Unfavorable) (Unfavorable) <strong>2005</strong> 2004<br />
Net revenue....................................... $ 2,548,652 $ 2,246,715 $ 301,937 13.4% 100.0% 100.0%<br />
Cost of sales ...................................... 1,675,308 1,469,969 (205,339) (14.0) 65.7 65.4<br />
Gross profit....................................... 873,344 776,746 96,598 12.4 34.3 34.6<br />
Selling, general & administrative .... 622,954 555,563 (67,391) (12.1) 24.5 24.7<br />
Restructuring costs........................... 27,875 − (27,875) (100.0) 1.1 −<br />
Goodwill and asset impairments.... 25,169 − (25,169) (100.0) 1.0 −<br />
Income from operations.................. 197,346 221,183 (23,837) (10.8) 7.7 9.9<br />
Other (income) expense, net .......... (19,541) (18,709) 832 4.4 0.8 0.8<br />
Income before income taxes........... 216,887 239,892 (23,005) (9.6) 8.5 10.7<br />
Income taxes & minority interest... 62,453 63,942 1,489 2.3 2.4 2.9<br />
Net income........................................ $ 154,434 $ 175,950 $ (21,516) (12.2)% 6.1% 7.8%<br />
Net revenue<br />
The acquisition of French-based Connecteurs Cinch S.A. and its subsidiaries (Cinch) completed in<br />
April, 2004, added $30.2 million of incremental revenue for fiscal <strong>2005</strong>. The strengthening of certain foreign<br />
currencies, principally the euro and the yen, compared with the U.S. dollar increased revenue by<br />
approximately $72.1 million over the prior year period. The Company estimates that the impact of price<br />
erosion reduced revenue by approximately $88 million for fiscal <strong>2005</strong>, compared with the prior year. The<br />
balance of the revenue increase came primarily from unit volume increases with existing customers and<br />
existing products, and sales of new products. Revenue derived from the sale of new products released by the<br />
Company within the last 36 months was $764 million, or 30% of total revenue, in the current year, compared<br />
with $563 million, or 25% of revenue, for the prior year.<br />
The following table sets forth information on the Company’s net revenue by geographic regions for<br />
the periods indicated:<br />
Year Over Year Over<br />
Years Ended Year Year Results as %<br />
June 30, $ Change % Change of Net Revenue<br />
(in thousands) Favorable Favorable<br />
<strong>2005</strong> 2004 (Unfavorable) (Unfavorable) <strong>2005</strong> 2004<br />
Americas ............................................ $ 701,470 $ 686,129 $ 15,341 2.2% 27.5% 30.5%<br />
Far East North.................................. 523,717 499,348 24,369 4.9 20.5 22.2<br />
Far East South .................................. 769,218 623,619 145,599 23.3 30.2 27.8<br />
Europe................................................ 504,453 385,051 119,402 31.0 19.8 17.1<br />
Corp. and Other ............................... 49,794 52,568 (2,774) (5.3) 2.0 2.4<br />
Total ................................................... $ 2,548,652 $ 2,246,715 $ 301,937 13.4% 100.0% 100.0%<br />
Americas Region - North and South America<br />
Customer revenue in the Americas region for fiscal <strong>2005</strong> increased 2.2% from the prior year, due to a<br />
slightly stronger demand for electronic connector products, particularly in high performance products,<br />
including cable assemblies for the high-end server market in supercomputer applications. The Company has<br />
also seen some recovery in the telecommunications market, resulting in demand for cable harnesses in that<br />
area.<br />
22
Modest sales growth reflects the accelerated movement offshore of OEMs and contract<br />
manufacturers. Although management believes that most of the related revenue remained within <strong>Molex</strong>, it<br />
contributed to sales in other regions and reduced the Americas results. The revenue loss was partially offset<br />
with an increase in distribution sales, industrial sales and new product sales.<br />
Integrated product sales grew at a faster rate than connector products, with the most significant<br />
increase from high performance cables and fiber optics products for computer and industrial market<br />
applications, as well as for the telecommunications market, which has finally stabilized.<br />
Far East North Region - Japan and Korea<br />
Customer revenue in the Far East North region in fiscal <strong>2005</strong> increased 4.9% from the prior year in<br />
U.S. dollars and remained steady in local currencies. Foreign currency translation contributed approximately<br />
$24 million to the revenue increase. A robust business environment in Japan, a recovering economy in<br />
Korea and a steady flow of new products stimulated sales. New products generated 35% of fiscal <strong>2005</strong><br />
revenue.<br />
The most significant growth in fiscal <strong>2005</strong> for Japan came from advanced digital home entertainment<br />
products such as digital still cameras and portable audio players and from consumer electronics products<br />
such as game machines and plasma display panels for flat screen TVs. Growth also came from hard disk<br />
drives and printers for the computer market.<br />
During the year, the region further capitalized on its ability to design more compact, higher<br />
performance products for the sophisticated end of the mobile phone business in the telecommunications<br />
market. The region is developing new connectors for third generation (3G) phones, which in Japan include<br />
such high-speed capabilities as TV and camera functionality. As more global phone makers move to 3G<br />
technology, <strong>Molex</strong> believes the region is well positioned to grow.<br />
Revenue to the industrial market increased, largely due to servo motor demand and customer<br />
investment in new semiconductor equipment. Automotive design wins in Japan were offset by decreased<br />
demand from Korean automakers due to Korea’s sluggish economy. In Korea, modest strength in the<br />
electronics industry and the overall connector market was offset by reduced sales of personal computers.<br />
Revenue from integrated products grew at a faster rate than connector products in fiscal <strong>2005</strong>. To<br />
counter pricing pressure, most integrated products are manufactured in <strong>Molex</strong>’s plant in Dalian, China, which<br />
underwent a 60% capacity expansion in fiscal <strong>2005</strong>.<br />
Far East South Region - Singapore, Malaysia, China, Thailand, Taiwan and India<br />
Consistent with the migration of business from the Americas, Europe and Far East North regions to<br />
the Far East South region, customer revenue in the Far East South region increased 23.3% in fiscal <strong>2005</strong> in<br />
U.S. dollars, 22.0% in local currencies, compared with the prior year. This region is now the Company’s<br />
largest and fastest growing segment. Favorable foreign currency translation of approximately $8 million had<br />
a modest impact on revenue. The revenue growth in this region, which represents 30% of the Company’s<br />
customer revenue, was driven by strong demand across the consumer products and computer markets, as<br />
well as the mobile phone sector of the telecommunications market.<br />
The Company’s sales in China increased by 23% as a result of customer demand supported by<br />
increased production capacity. The biggest drivers of this growth were American, European and Japanese<br />
companies moving their design and production to China and greater penetration of Taiwanese multinational<br />
accounts. <strong>Molex</strong> experienced strong demand in the mobile phone, notebook and desktop computer,<br />
consumer electronics and automotive markets.<br />
Products used in mobile phones constitute nearly one-third of Far East South sales. Consumer<br />
electronics is another important market for the region. During the year, new products were introduced to<br />
keep pace with the ongoing migration from analog to digital technology. The region is coordinating<br />
23
opportunities with its <strong>Molex</strong> counterparts in Japan to have these products designed in the Far East North<br />
and produced in China.<br />
In the data, networking and computing arena, the Company shifted its focus from<br />
telecommunications infrastructure equipment to the far stronger server market. The region also grew in its<br />
traditional niche of personal computers and notebooks.<br />
The automotive business in the Far East South region, although still in its early stages, is accelerating.<br />
The Company’s product pipeline grew to five times the 2004 level. The Big 3 (Daimler Chrysler, Ford and<br />
General Motors) and their suppliers moving to China want local design, procurement and production, which<br />
the region can provide. The Company plans to open a new plant in summer 2007 in Chengdu, considered<br />
the Detroit of China. The new plant is expected to be <strong>Molex</strong>’s largest worldwide and manufacture products<br />
for the automotive industry and for other industries as well. To offer customers a complete solution, the<br />
region maintains a balance between high precision, high technology manufacturing in Singapore and<br />
commoditized capability in China.<br />
European Region<br />
Customer revenue in Europe for fiscal <strong>2005</strong> increased 31.0% from the prior year in U.S. dollars and<br />
22.0% in local currencies. The Company’s Cinch automotive acquisition, which occurred during the fourth<br />
fiscal quarter of 2004, accounted for $30.2 million of the $119.4 million in growth. Foreign currency<br />
translation, led by the strong euro, also favorably impacted customer revenue in Europe by approximately<br />
$35 million. The remaining revenue growth in this region was primarily driven by demand for mobile phones<br />
in the telecommunications market and products in the industrial market.<br />
The European connector market has been growing, albeit at a single-digit pace. The region is<br />
focused on the strongest markets that <strong>Molex</strong> believes are most likely to stay in Europe. These include<br />
connectors and integrated products for industrial, medical and automotive applications. Integrated products<br />
now account for approximately 25% of the region’s revenue.<br />
During the year, the region won projects from customers engaged in land- and marine-based oil<br />
exploration, as well as manufacturers requiring <strong>Molex</strong> products for industrial controls, testing equipment and<br />
power management. The region also increased its business with Nokia, the only major mobile phone<br />
company still producing in Europe.<br />
Management believes that the trend for European automakers, at least for the next five years, will be<br />
locally based and will rely on local distribution. <strong>Molex</strong> believes the region is in a good position to fulfill this<br />
need with a broad connector product offering and a robust new product pipeline.<br />
Key initiatives in the region include improving capacity utilization, shifting more manufacturing to<br />
the region’s Eastern European locations, and using Six Sigma methodology to eliminate waste and enhance<br />
quality. Additionally, <strong>Molex</strong> is ahead of schedule with introducing lead-free products and expects that it will<br />
deliver well in advance of the European compliance deadline.<br />
Gross Profit<br />
Gross profit was $873.3 million for the year, up $96.6 million, or 12.4% over the prior year period.<br />
Gross profit margin was 34.3% of net revenue, down from 34.6% in the prior year. The Company was not<br />
able to fully offset the negative impact of price erosion discussed earlier with the leverage on the higher sales<br />
volume. The gross profit margin was also negatively impacted by higher raw material costs. The Company<br />
estimates that it paid approximately $17 million more for metal alloys (primarily copper), gold and plastic<br />
resins in the current year compared with the same period last year. Although <strong>Molex</strong> implemented offsetting<br />
price increases to its distribution sales channel, it has not been as successful with the majority of its business.<br />
<strong>Molex</strong>’s client mix skews toward large global customers and industries that make raising prices more difficult.<br />
Certain products manufactured by <strong>Molex</strong> in Japan and Europe are sold in other regions of the world at<br />
selling prices primarily denominated in or closely linked to the U.S. dollar. The gross profit margin was<br />
24
negatively impacted as the yen and euro strengthened relative to the U.S. dollar. The Company estimates this<br />
currency transaction impact to be approximately $6.5 million compared with the prior year.<br />
Also included in the results for the year ended June 30, <strong>2005</strong> are corrections of errors that reduced<br />
gross profit by $7.9 million. See Note 4 to the “Notes to Consolidated Financial Statements” for further<br />
discussion.<br />
Selling, General and Administrative Expenses<br />
Selling, general and administrative expenses were $623.0 million for the year, compared with $555.6<br />
million in the prior year. As a percentage of net revenue, selling, general and administrative expenses were<br />
24.5% this year, down slightly from 24.7% in the prior year. The Cinch acquisition added incremental selling,<br />
general and administrative expenses of approximately $16.0 million as compared with the prior year. The<br />
currency translation impact further increased selling, general and administrative expenses by approximately<br />
$16.9 million. Also, in connection with the resignation of its former auditor, responses to SEC comment<br />
inquiries, and internal investigations authorized by the Company’s Audit Committee, the Company estimates<br />
that legal, accounting and other costs during fiscal <strong>2005</strong> increased by approximately $9.9 million. Research<br />
and development expenditures for the year increased $14.6 million to $133.6 million, or 5.2% of net revenue,<br />
compared with 5.3% of net revenue last year.<br />
Research and development expenditures in fiscal <strong>2005</strong> contributed to the release of approximately<br />
384 new products during the year. In fiscal <strong>2005</strong>, 30% of net revenue was derived from the sale of products<br />
released by the Company within the last three years. <strong>Molex</strong> continued its long-term commitment to<br />
reinvesting its profits in new product design and tooling to maintain and enhance the Company’s competitive<br />
position. The Company was granted 775 new patents during the year, an increase of 36% over the prior year.<br />
Also included in the results for the year ended June 30, <strong>2005</strong> are corrections of errors that increased<br />
selling, general and administrative expense by $1.5 million. See Note 4 to the “Notes to Consolidated<br />
Financial Statements” for further discussion.<br />
Restructuring Costs<br />
<strong>Molex</strong> recorded a pre-tax restructuring charge of $27.9 million in the fourth quarter of fiscal <strong>2005</strong> in<br />
order to reduce costs, better optimize plant utilization and reduce selling, general and administrative<br />
expenses. The restructuring includes facility closures that impact the Company's operations in the Americas<br />
and European regions. In the Americas region, the Company will close an industrial manufacturing facility in<br />
New England and cease manufacturing in its Detroit area automotive facility. The automotive development<br />
center also located in the Detroit area will continue in operation. Production from these facilities will be<br />
transferred to existing plants within the region. In Europe, the Company will close certain manufacturing<br />
facilities in Ireland, Portugal and Slovakia, and reduce the size of a development center in Germany.<br />
Production from these manufacturing facilities will be transferred to existing plants within the region. The<br />
Company estimates that it will reduce headcount by approximately 1,400 employees initially and then add<br />
back 800 employees at the facilities where production is being transferred, for a net reduction of 600<br />
employees.<br />
The pre-tax charge for the fiscal <strong>2005</strong> fourth quarter included cash expenditures of $3.8 million,<br />
which consisted primarily of severance and other employee-related costs. The timing of the cash<br />
expenditures associated with these charges does not necessarily correspond to the period in which the<br />
accounting charge is taken. The actual timing of the facility closures and related headcount reductions and<br />
the resulting charges and cash expenditures will be dependent upon a number of factors including the<br />
Company's efforts to achieve a phased and efficient transfer of production. Implementation of this<br />
restructuring program is expected to continue through fiscal 2006 for which the Company is anticipating an<br />
additional estimated pre-tax charge of $15 million to $25 million during fiscal 2006. Approximately 60% of<br />
the additional charges are expected to impact the Americas region with the remainder impacting Europe. For<br />
additional information concerning the status of the Company’s restructuring programs see Note 7 of the<br />
“Notes to Consolidated Financial Statements.”<br />
25
Goodwill and Other Asset Impairments<br />
The Company also recorded a pre-tax non-cash goodwill impairment charge of $22.9 million.<br />
During <strong>2005</strong>, the Company completed its annual impairment review for goodwill. Indicators of impairment<br />
were found in the <strong>Molex</strong> Premise Network (MPN) reporting unit. The MPN business, consisting of<br />
products primarily sold into the structured cabling market for data communications had not performed as<br />
management had expected. Slower growth in MPN’s markets served and slower-than-expected customer<br />
acceptance of its products in the structured cabling business, as well as a delay in the transition to nextgeneration<br />
data communication networks, had a negative impact on MPN’s operating results. These factors<br />
resulted in lower growth expectations for the reporting unit, which resulted in the goodwill impairment<br />
charge. For additional discussion on goodwill and the impairment charge, see Note 12 of the “Notes to<br />
Consolidated Financial Statements.”<br />
Additionally, the Company recorded a pre-tax asset impairment charge of $2.3 million related to the<br />
expected sale of a U.S. based facility that was previously used for manufacturing and warehousing of fiber<br />
optic products that have now been consolidated into other facilities.<br />
Other Income<br />
Total other income was $19.5 million for fiscal <strong>2005</strong>, compared with $18.7 million in the prior year.<br />
Fiscal 2004 results included a $10.4 million gain resulting from an IPO completed by an affiliate and the sale<br />
of stock of this affiliate, as well as a loss on investment of $5.0 million.<br />
Interest income, net of interest expense, was $6.4 million for fiscal <strong>2005</strong> compared with $3.7 million<br />
in the prior year period due to both higher cash balances held in the current year as well as higher interest<br />
rates.<br />
Effective Tax Rate<br />
The effective tax rate was 28.8% for fiscal <strong>2005</strong> compared with 26.5% in fiscal 2004. The increase in<br />
the effective tax rate from the prior year reflects the charge for the goodwill impairment the Company<br />
recognized in fiscal <strong>2005</strong> and an increase in the valuation allowance for losses incurred for which no tax<br />
benefit could be recorded. These items were offset to some extent by the favorable resolution of various tax<br />
matters with tax authorities as well as the correction of accruals for income tax exposures and other income<br />
tax adjustments (see Note 4 to the “Notes to Consolidated Financial Statements”). The Company also<br />
reflected a tax benefit related to the recording of state deferred taxes in fiscal <strong>2005</strong>.<br />
Net Income<br />
Net income for the year was $154.4 million, down 12.2% from $176.0 million reported in fiscal 2004.<br />
Fiscal <strong>2005</strong> net income included after-tax charges of $21.6 million for restructuring costs, $22.9 million for<br />
goodwill impairment and $1.4 million for other asset impairments. Foreign currency translation increased net<br />
income by approximately $4.1 million. Diluted earnings per share were $0.81 for fiscal <strong>2005</strong> compared with<br />
$0.92 for fiscal 2004.<br />
Comprehensive income includes all non-stockholder changes in equity and consists of net income,<br />
foreign currency translation adjustments and unrealized gains and losses on available-for-sale securities. The<br />
increase in comprehensive income for fiscal <strong>2005</strong> was primarily due to favorable foreign currency translation<br />
adjustments resulting from the weaker U.S. dollar versus the yen and euro.<br />
Backlog<br />
The Company’s order backlog on June 30, <strong>2005</strong> was approximately $259.5 million, a decline of $73.1<br />
million compared with $332.6 million at June 30, 2004. The decrease in backlog was partially attributable to<br />
an increase in distribution bookings in June 2004 of approximately $36 million placed in advance of a price<br />
increase. In addition, during fiscal <strong>2005</strong> the Company provided vendor-managed inventory programs to<br />
26
customers. Under this method, the new order and shipment occur simultaneously and without impacting<br />
reported backlog. New orders for fiscal <strong>2005</strong> were $2,489.8 million, compared with $2,366.0 million last year.<br />
Year Ended June 30, 2004 Compared to Year Ended June 30, 2003<br />
Year Over Year Over<br />
Years Ended Year Year Results as %<br />
June 30, $ Change % Change of Net Revenue<br />
(in thousands) Favorable Favorable<br />
2004 2003 (Unfavorable) (Unfavorable) 2004 2003<br />
Net revenue....................................... $ 2,246,715 $ 1,843,098 $ 403,617 21.9% 100.0% 100.0%<br />
Cost of sales ...................................... 1,469,969 1,235,398 (234,571) (19.0) 65.4 67.0<br />
Gross profit....................................... 776,746 607,700 169,046 27.8 34.6 33.0<br />
Selling, general & administrative .... 555,563 470,415 (85,148) (18.1) 24.7 25.5<br />
Restructuring costs........................... − 35,027 35,027 100.0 − 2.0<br />
Income from operations.................. 221,183 102,258 118,925 116.3 9.9 5.5<br />
Other (income) expense, net .......... (18,709) (7,784) 10,925 140.4 0.8 0.5<br />
Income before income taxes........... 239,892 110,042 129,850 118.0 10.7 6.0<br />
Income taxes & minority interest... 63,942 25,124 (38,818) (154.5) 2.9 1.4<br />
Net income........................................ $ 175,950 $ 84,918 $ 91,032 107.2% 7.8% 4.6%<br />
Revenue<br />
Revenue was $2.25 billion for the fiscal year ended June 30, 2004, an increase of 21.9%, compared<br />
with $1.84 billion last year. The strengthening of certain foreign currencies, principally the euro and yen,<br />
compared with the U.S. dollar increased revenue by approximately $89 million in fiscal 2004.<br />
The following table sets forth information on the Company’s net revenue by geographic regions for<br />
the periods indicated:<br />
Year Over Year Over<br />
Years Ended Year Year Results as %<br />
June 30, $ Change % Change of Net Revenue<br />
(in thousands) Favorable Favorable<br />
2004 2003 (Unfavorable) (Unfavorable) 2004 2003<br />
Americas ............................................ $ 686,129 $ 641,197 $ 44,932 7.0% 30.5% 34.8%<br />
Far East North.................................. 499,348 407,821 91,527 22.4 22.2 22.1<br />
Far East South .................................. 623,619 458,819 164,800 35.9 27.8 24.9<br />
Europe................................................ 385,051 291,043 94,008 32.3 17.1 15.8<br />
Corp. and Other ............................... 52,568 44,218 8,350 18.9 2.4 2.4<br />
Total ................................................... $ 2,246,715 $ 1,843,098 $ 403,617 21.9% 100.0% 100.0%<br />
Americas Region - North and South America<br />
Customer revenue was $686.1 million in fiscal 2004, an increase of 7% compared with fiscal 2003<br />
revenue of $641.2 million, with the growth occurring during the second half of the fiscal year. The revenue<br />
growth in this region was due to a broad improvement across all markets led by a recovering economy and<br />
strong consumer confidence in the U.S.<br />
Far East North - Japan and Korea<br />
Customer revenue grew 22.4% to $499.3 million in fiscal 2004 compared with revenue of $407.8<br />
million in fiscal 2003. Foreign currency translation contributed approximately $33 million to this increase.<br />
Demand was especially strong for advanced digital home entertainment products such as digital still cameras,<br />
camcorders and flat screen and plasma TVs, as well as for high-end mobile phones. Revenue also improved<br />
in the industrial market, especially for semiconductor inspection equipment and industrial automation.<br />
27
Far East South Region - Singapore, Malaysia, China, Thailand, Taiwan and India<br />
Customer revenue for fiscal 2004 was $623.6 million, an increase of $164.8 million or 35.9%,<br />
compared with the prior year. The biggest drivers of this growth were American, European and Japanese<br />
companies moving production to China and strong demand in the consumer electronics, mobile phone,<br />
notebook and desktop computer markets.<br />
European Region<br />
In Europe, customer revenue in fiscal 2004 was $385.1 million, an increase of 32.3%, as compared<br />
with $291.0 million in fiscal 2003. During the fourth fiscal quarter, the Company purchased the assets and<br />
business of Cinch, which added revenues of $20.5 million during fiscal 2004. Foreign currency translation,<br />
led by the strong euro, also increased customer revenues by approximately $44.5 million.<br />
Gross Profit<br />
Gross profit was $776.7 million for fiscal 2004. The increase in gross profit was primarily due to<br />
leverage from the higher sales volumes. The realized savings from the prior year’s restructuring program also<br />
contributed to the improvement. Offsetting these improvements, the Company estimates that it paid<br />
approximately $10 million more in fiscal 2004 for metal strip and gold purchases.<br />
During fiscal 2004, the Company realized savings of approximately $16 million related to the fiscal<br />
2003 restructuring actions of which approximately 75% is reflected in fiscal 2004 cost of sales. For additional<br />
information concerning the status of the Company’s restructuring programs, see Note 7 of the “Notes to<br />
Consolidated Financial Statements.”<br />
Selling, General and Administrative Expenses<br />
Selling, general and administrative expenses were $555.6 million. Foreign currency translation<br />
increased selling, general and administrative expenses by approximately $23 million.<br />
Research and development expenditures were $119.0 million, or 5.3% of net revenue, during fiscal<br />
2004, compared with $117.0 million, or 6.3% of net revenue, in the prior year. During fiscal 2004, the<br />
Company adopted a more narrow definition of research and development. This change had the effect of<br />
reducing reported research and development spending in fiscal 2004 by approximately $18 million compared<br />
with the prior year.<br />
Research and development expenditures in fiscal 2004 contributed to the release of 415 new<br />
products during the year. In fiscal 2004, 25.1% of net revenue was derived from the sale of products released<br />
by the Company within the last three years. <strong>Molex</strong> continued its long-term commitment to reinvesting its<br />
profits in new product design and tooling to maintain and enhance the Company’s competitive position. The<br />
Company was granted 568 new patents during the year.<br />
Other Income<br />
Other (income) expense for fiscal 2004 included a pre-tax gain of $10.4 million from the sale of stock<br />
of an affiliate and an equity gain resulting from an IPO completed by the affiliate. <strong>Molex</strong> retains a 20%<br />
ownership in this affiliate. In addition, the Company recorded a pre-tax charge of $5.0 million to exit other<br />
investments in start-up technologies.<br />
Interest income, net of interest expense of $2.2 million, was $3.7 million for fiscal 2004 compared<br />
with $8.2 million, net of interest expense of $2.9 million, in the prior year period. The prior year included an<br />
interest benefit of approximately $3.0 million from the favorable closure of tax audits in several U.S.<br />
jurisdictions.<br />
28
Effective Tax Rate<br />
The effective income tax rate was 26.5% for fiscal 2004 compared with 22.5% in fiscal 2003. The<br />
increase in the effective tax rate from the prior year is primarily the result of an increase in the Company’s<br />
pre-tax earnings from higher rate jurisdictions.<br />
Net Income<br />
Net income rose to $176.0 million during fiscal 2004. Favorable foreign currency translation<br />
contributed $4.7 million to net income. Fiscal 2003 net income included an after-tax charge of $28.6 million<br />
for restructuring costs and the write-down of certain investments. Diluted earnings per share was $0.92 for<br />
fiscal 2004 compared with $0.44 for fiscal 2003.<br />
Comprehensive income includes all non-stockholder changes in equity and consists of net income,<br />
foreign currency translation adjustments, and unrealized gains and losses on available-for-sale securities. The<br />
increase in comprehensive income for fiscal 2004 was primarily due to net income and favorable foreign<br />
currency translation adjustments resulting from the weaker U.S. dollar versus the yen and euro.<br />
Financial Condition and Liquidity<br />
<strong>Molex</strong>’s financial position remains strong and the Company continues to be able to fund capital<br />
projects and working capital needs principally out of operating cash flows and cash reserves. Cash, cash<br />
equivalents and marketable securities totaled $497.6 million and $338.7 million at June 30, <strong>2005</strong> and 2004,<br />
respectively. The Company’s long-term financing strategy is to rely on internal sources of funds for investing<br />
in plant, equipment and acquisitions. Management believes that the Company’s liquidity and financial<br />
flexibility are adequate to support both current and future growth. <strong>Molex</strong> has historically used external<br />
borrowings only when a clear financial advantage exists. Long-term debt and obligations under capital leases<br />
at June 30, <strong>2005</strong> totaled $10.0 million. The Company has available lines of credit totaling $122.0 million at<br />
June 30, <strong>2005</strong>.<br />
Cash Flows<br />
Below is a table setting forth the key lines of the Company’s Consolidated Statements of Cash<br />
Flows (in thousands):<br />
<strong>2005</strong> 2004 2003<br />
Cash provided from operating activities................................................ $ 430,835 $ 292,031 $ 304,872<br />
Cash used for investing activities............................................................ (286,232) (158,358) (249,225)<br />
Cash used for financing activities ........................................................... (75,689) (86,108) (92,331)<br />
Effect of exchange rate changes on cash............................................... 6,411 7,890 2,183<br />
Net increase (decrease) in cash................................................................ $ 75,325 $ 55,455 $ (34,501)<br />
Operating Activities<br />
Cash provided from operating activities increased by $138.8 million from fiscal 2004 due mainly to<br />
steady working capital levels and higher cash earnings when compared with the prior year. Although<br />
customer revenue was higher during fiscal <strong>2005</strong>, accounts receivable balances increased moderately. The<br />
Company also increased inventory levels in fiscal <strong>2005</strong> to support the higher volume, although this increase<br />
was partially offset by higher accounts payable balances. Working capital, defined as current assets minus<br />
current liabilities, at June 30, <strong>2005</strong> was $904.6 million compared with $740.2 million at June 30, 2004.<br />
Investing Activities<br />
Cash used for investing activities increased by $127.9 million primarily due to higher capital<br />
expenditures and an increase in the level of investment in marketable securities during fiscal <strong>2005</strong>. During<br />
the first quarter of fiscal <strong>2005</strong>, the Company sold its investment in an affiliate and generated cash from this<br />
transaction of $14.1 million.<br />
29
Financing Activities<br />
Cash was used primarily for the payment of dividends and the purchase of treasury stock. The<br />
Company purchased 2,395,000 shares of Common and Class A Common Stock during fiscal <strong>2005</strong> at an<br />
aggregate cost of $58.2 million and 2,740,000 shares during fiscal 2004 at an aggregate cost of $70.2 million.<br />
The Company’s Board of Directors previously authorized the discretionary purchase of up to $100.0<br />
million of Common Stock and/or Class A Common Stock during fiscal <strong>2005</strong>. On April 25, <strong>2005</strong>, the<br />
Company’s Board of Directors replaced this $100 million authorization with a new authorization of a<br />
discretionary purchase program that expires December 31, 2006 and increased the aggregate value of any<br />
future purchases to $250 million.<br />
<strong>Molex</strong> has a strong cash balance and cash flow and very little debt. The Company believes at this<br />
time that share repurchases are a good investment as compared with investing its cash in short-term money<br />
instruments or marketable securities, particularly with the current low interest rates. The Company also uses<br />
shares repurchased to replenish stock used for exercises of employee stock options, employee stock awards<br />
and the Employee Stock Purchase Plan.<br />
As part of its growth strategy, the Company may, in the future, acquire other companies in the same<br />
or complementary lines of business, and pursue other business ventures. The timing and size of any new<br />
business ventures or acquisitions the Company completes may impact its cash requirements.<br />
Contractual Obligations and Commercial Commitments<br />
The following table summarizes <strong>Molex</strong>’s significant contractual obligations at June 30, <strong>2005</strong>, and the<br />
effect such obligations are expected to have on liquidity and cash flows in future periods.<br />
Less Than 1-3 3-5 More Than<br />
(in thousands) Total 1 Year Years Years 5 Years<br />
Operating lease obligations............................... $ 24,232 $ 9,650 $ 6,523 $ 2,928 $ 5,131<br />
Capital lease obligations .................................... 5,452 2,971 2,391 90 −<br />
Other long-term liabilities................................. 9,920 156 1,812 546 7,406<br />
Purchase obligations .......................................... 2,350 − 2,350 − −<br />
Debt obligations ................................................. 11,079 3,036 2,087 5,368 588<br />
Tota1 (1) ............................................................... $ 53,033 $ 15,813 $ 15,163 $ 8,932 $ 13,125<br />
(1) Total does not include contractual obligations recorded on the balance sheet as current liabilities<br />
or certain purchase obligations, as discussed below.<br />
Contractual obligations for purchases of goods or services are defined as agreements that are<br />
enforceable and legally binding on <strong>Molex</strong> and that specify all significant terms, including fixed or minimum<br />
quantities to be purchased; fixed, minimum or variable price provisions; and the approximate timing of the<br />
transaction. <strong>Molex</strong>’s purchase orders are based on current manufacturing needs and are fulfilled by vendors<br />
within short time horizons. In addition, some purchase orders represent authorizations to purchase rather<br />
than binding agreements. With the exception of one purchase obligation for raw materials included in the<br />
table above, the Company does not generally have significant agreements for the purchase of raw materials or<br />
other goods specifying minimum quantities and set prices that exceed expected requirements for three<br />
months. Agreements for outsourced services generally contain clauses allowing for cancellation without<br />
significant penalty, and are therefore not included in the table above.<br />
The expected timing of payments of the obligations above is estimated based on current<br />
information. Timing of payments and actual amounts paid may be different, depending on the time of<br />
receipt of goods or services, or changes to agreed-upon amounts for some obligations.<br />
30
Off-Balance Sheet Arrangements<br />
An off-balance sheet arrangement is any contractual arrangement involving an unconsolidated entity<br />
under which a company has (a) made guarantees, (b) a retained or a contingent interest in transferred assets,<br />
(c) any obligation under certain derivative instruments or (d) any obligation under a material variable interest<br />
in an unconsolidated entity that provides financing, liquidity, market risk, or credit risk support to a company,<br />
or engages in leasing, hedging, or research and development services within a company.<br />
<strong>Molex</strong> does not have exposure to any off-balance sheet arrangements with the exception of certain<br />
operating leases. See Note 18 to the Notes to Consolidated Financial Statements for further discussion on<br />
the Company’s lease arrangements.<br />
The Company does not have any unconsolidated special purpose entities.<br />
Forward-looking Statements<br />
This Annual Report on Form 10-K, including the information incorporated by reference herein and<br />
the exhibits hereto, may include “forward-looking” statements. Forward-looking statements broadly involve<br />
the Company’s current expectations or forecasts of future results. The Company’s forward-looking<br />
statements generally relate to growth strategies, industry trends, financial results, cost reduction initiatives,<br />
manufacturing strategies, product development, regulatory approvals, competitive strengths, the scope of<br />
<strong>Molex</strong>’s Intellectual property rights, and sales efforts. Such statements can be identified by the use of<br />
terminology such as “anticipate,” “believe,” “could,” “estimate,” “expect,” “forecast,” “intend,” “may,”<br />
“plan,” “possible,” “project,” “should,” “will” and similar words or expressions. Any statements that are not<br />
historical facts, including estimates, projections, future trends and the outcome of events that have not yet<br />
occurred, are forward-looking statements.<br />
Forward-looking statements speak only as of the date made and the Company undertakes no<br />
obligation to update any forward-looking statement, but investors are advised to consult any further<br />
disclosures by the Company on this subject in its filings with the Commission, especially on Forms 10-K, 10-<br />
Q and 8-K in which <strong>Molex</strong> discusses in more detail various important factors that could cause actual results<br />
to differ from expected or historical results. The Company intends to take advantage of the safe harbor<br />
provisions of the Private Securities Litigation Reform Act of 1995 regarding forward-looking statements, and<br />
is including this sentence for the express purpose of enabling it to use the protections of the safe harbor with<br />
respect to all forward-looking statements.<br />
Risk Factors<br />
It is not possible to foresee or identify all factors that may affect the Company’s prospects or<br />
forward-looking statements and any list of such factors cannot be an exhaustive list of all risks, uncertainties<br />
or potentially inaccurate assumptions affecting such prospects or forward-looking statements.<br />
Consider carefully these factors as well as any factors discussed with specific forward-looking<br />
statements in this annual report and in the Company’s other filings with the Commission. In some cases,<br />
these factors have affected, and in the future (together with other unknown factors) may affect, the<br />
Company’s ability to implement its business strategy and could cause actual results to differ materially from<br />
those contemplated by such forward-looking statements. No assurance can be made that any expectation,<br />
estimate or projection contained in a forward-looking statement can be achieved.<br />
The Company’s ability to achieve results consistent with its current expectations or otherwise<br />
depends significantly on certain factors that may cause actual future results to differ materially from<br />
expectations. Risk factors that could influence the Company’s prospects, performance and financial condition<br />
generally include a number of factors that might be within or outside the influence of management. Factors<br />
that could affect the Company’s performance and condition include the following:<br />
• Competitive Factors: pricing pressures, both in the U.S. and abroad; development of new products<br />
by existing and future competitors having superior performance compared to the Company’s<br />
existing and future products; technological advances, patents, and registrations obtained by<br />
31
existing and future competitors, which could make the Company’s existing products or products<br />
under development obsolete, unmarketable or uncompetitive; existing and future competitors<br />
may have more engineering, manufacturing, marketing, financial and personnel resources<br />
available to them, may have better access to such resources, may be better able to attract and<br />
retain highly qualified personnel resources, and may have lower manufacturing costs. The<br />
Company can give no assurances that it will be able to compete successfully against existing or<br />
future competitors and such competitive factors could lead to price cuts, reduced gross margins<br />
and loss of market share.<br />
• Available Market Opportunities: the timing, size, and nature of strategic initiatives, market<br />
opportunities, and research and technology platforms available to the Company; the Company<br />
may be unsuccessful in identifying and consummating acquisitions and other business<br />
development initiatives, which could impede its growth and ability to remain competitive.<br />
• Industry Consolidation: the trend of consolidation in the connector industry as well as among<br />
customers, resulting in more significant, complex, and long-term contracts than in the past, and<br />
potentially greater pricing pressures and the possible strengthening of competitors through<br />
industry consolidation.<br />
• Industry Changes: the electronics industry is characterized by rapid technological advancement,<br />
requiring the Company to have the ability to anticipate and react effectively to the changing<br />
electronics environment, including the enhancement of existing products and the successful<br />
development and introduction of new products that are accepted in markets in which the<br />
Company operates. However, the Company will not be able to predict with certainty<br />
technological trends or new products in the market and will not be able to predict whether its<br />
products and services will meet with market acceptance or be profitable, and therefore, the<br />
Company may not be able to compete successfully.<br />
• Cyclical Industry and Demand of Customers: cyclical patterns of the connector industry and customer<br />
industries; decline or lack of growth of customers industries, customer demand of <strong>Molex</strong>’s<br />
products, and the capital investment patterns and financial capabilities of customers could have<br />
an adverse effect on the Company’s business.<br />
• Manufacturing and Distribution Challenges: achievement of manufacturing efficiencies and quality<br />
objectives, including gross margin benefits from manufacturing process and supply chain<br />
programs; efficiently and consistently manufacturing quality products; successfully managing the<br />
relationships with suppliers and distributors; and effectively managing inventory mix and<br />
inventory levels.<br />
• Cost and Availability of Raw Materials and Supplies: volatility in the prices of plastic resins, copperbased<br />
metal alloys, gold and palladium salts, molded and stamped components, and connector<br />
assemblies could increase the costs of the Company’s products reducing gross margins or<br />
demand for its products.<br />
• Restructuring Implementation: ability to successfully transition manufacturing operations to low<br />
labor cost locations in response to industry changes and successfully complete the plant<br />
restructuring actions, including the transition of production to <strong>Molex</strong>’s other facilities; the<br />
Company’s ability to successfully complete these ongoing efforts and to generate the level of<br />
cost savings expected and/or that are necessary to effectively compete.<br />
• Acquisition Integration: efficient integration of acquired businesses and achieved planned cost<br />
synergies and profit expectations, difficulties that could disrupt the Company’s ongoing<br />
business, distract management and the workforce, increase the Company’s expenses and<br />
adversely affect operating results.<br />
• Product Development: maintain research and development expenditures, successfully forecast longterm<br />
market trends and successfully complete prototypes to develop and obtain customer<br />
approval for products on a timely basis. Such development expenditures often must be made<br />
before knowing whether the resulting new products will meet with market acceptance or result<br />
in revenue and the Company may focus resources on technologies that do not become widely<br />
accepted and are not commercially viable. In addition, new products may contain defects or<br />
errors that are detected only after deployment.<br />
32
• Demand for Employees: competition for key personnel in various of the Company’s product and<br />
geographic markets is intense and future success depends in large part on the continued ability to<br />
hire, assimilate and retain key employees, including qualified engineers and other highly skilled<br />
personnel needed to compete and develop successful new products. The Company may not be<br />
as successful as competitors at recruiting, assimilating and retaining highly skilled personnel.<br />
• Intellectual Property and Contract Rights: the failure or inability to obtain, limitations on the use of, or<br />
the loss of patent and other intellectual property rights; enforcing contract rights and/or<br />
unauthorized third party use of the Company’s intellectual property rights, technologies and<br />
products, which in foreign countries may be difficult to police where the laws may not protect<br />
intellectual property rights to the same extent as the laws of the U.S. or other countries.<br />
• Financial Management: management of financial assets, including having adequate internal controls<br />
and effective cash management and leveraging various tax planning opportunities to achieve the<br />
expected effective tax rate.<br />
• Additional Impairment Charges: pursuant to GAAP, periodically assessing goodwill, intangibles and<br />
other long-lived assets to determine if they are impaired; disruptions to the Company’s or<br />
customer’s business, protracted economic weakness and unexpected significant declines in<br />
operating results, which may result in additional charges to goodwill and other asset impairment,<br />
possibly reducing operating results, net worth and stockholders’ equity.<br />
• Government Action: the imposition of additional or different regulatory requirements, such as<br />
manufacturing and labeling, safety requirements, recall of products, new laws and judicial<br />
decisions related to the marketing and distribution of products, the impact of more vigorous<br />
compliance and enforcement activities, the impact of regulatory reviews for state, local and<br />
international tax, customs and export controls and changes in the tax and environmental laws<br />
affecting the Company’s business.<br />
• Legal Disputes: intellectual property rights claims, product liability claims, claims asserting<br />
securities law violations, employee claims, derivative stockholder actions, claims asserting<br />
antitrust violations, and environmental matters, as well as the significant expenses incurred in<br />
defending such claims and the damages that may be collected by plaintiffs pursuant to any such<br />
successful claims.<br />
• Customers and Suppliers: unforeseen interruptions with the Company’s largest customers, suppliers<br />
and distributors resulting from, but not limited to strikes, financial instabilities, computer<br />
malfunctions or inventory excesses; the Company’s ability to obtain timely and adequate delivery<br />
of materials, parts and components from suppliers and internal manufacturing capacity.<br />
• General Economic Conditions: international and domestic business conditions including the<br />
relationships between the U.S., Chinese and other governments; unexpected changes in the laws<br />
or regulations or trade, monetary or fiscal policy, including interest rates, foreign currency<br />
exchange rates, and changes in the rate of inflation in the U.S., China or other foreign countries;<br />
raw material shortages and price increases; political instability in foreign countries; the market<br />
value of investments in other companies.<br />
• Other Factors: natural disasters such as earthquakes, tsunamis, typhoons, or floods, or other<br />
disasters such as fires, explosions, acts of terrorism or war, or failures of the Company’s<br />
management information or other systems.<br />
Item 7A - Quantitative and Qualitative Disclosures About Market Risk<br />
The Company is subject to market risk associated with changes in foreign currency exchange rates,<br />
interest rates and certain commodity prices.<br />
The Company mitigates its foreign currency exchange rate risk principally through the establishment<br />
of local production facilities in the markets it serves. This creates a “natural hedge” since purchases and sales<br />
within a specific country are both denominated in the same currency and therefore no exposure exists to<br />
hedge with a foreign exchange forward or option contract (collectively, “foreign exchange contracts”).<br />
Natural hedges exist in most countries in which the Company operates, although the percentage of natural<br />
33
offsets, as compared with offsets that need to be hedged by foreign exchange contracts, will vary from<br />
country to country.<br />
<strong>Molex</strong> also monitors its foreign currency exposure in each country and implements strategies to<br />
respond to changing economic and political environments. Examples of these strategies include the prompt<br />
payment of intercompany balances utilizing a global netting system, the establishing of contra-currency<br />
accounts in several international subsidiaries, development of natural hedges and use of foreign exchange<br />
contracts to protect or preserve the value of cash flows. No material foreign exchange contracts were in use<br />
at June 30, <strong>2005</strong> and 2004.<br />
The Company has implemented a formalized treasury risk management policy that describes the<br />
procedures and controls over derivative financial and commodity instruments. Under the policy, the<br />
Company does not use derivative financial or commodity instruments for speculative or trading purposes,<br />
and the use of such instruments is subject to strict approval levels by senior management. Typically, the use<br />
of derivative instruments is limited to hedging activities related to specific foreign currency cash flows and net<br />
receivable/payable balances.<br />
The translation of the financial statements of the non-North American operations is impacted by<br />
fluctuations in foreign currency exchange rates. The increase in consolidated net revenue and income from<br />
operations was impacted by the translation of the Company’s international financial statements into U.S.<br />
dollars resulting in increased net revenue of $72.1 million and increased income from operations of $6.4<br />
million for <strong>2005</strong>, compared with the estimated results for <strong>2005</strong> using the average rates for 2004.<br />
The Company’s $187.8 million of marketable securities at June 30, <strong>2005</strong> are principally debt<br />
instruments that generate interest income for the Company on temporary excess cash balances. These<br />
instruments contain embedded derivative features that enhance the liquidity of the portfolio by enabling the<br />
Company to liquidate the instrument prior to the stated maturity date. The Company’s exposure related to<br />
derivative instrument transactions is, in the aggregate, not material to <strong>Molex</strong>’s financial position, results of<br />
operations or cash flows.<br />
Interest rate exposure is limited to marketable securities owned by the Company and long-term debt.<br />
The Company does not actively manage the risk of interest rate fluctuations. However, such risk is mitigated<br />
by the relatively short-term nature of its investments (less than 12 months) and the fixed-rate nature of its<br />
long-term debt.<br />
Due to the nature of its operations, <strong>Molex</strong> is not subject to significant concentration risks relating to<br />
customers, products or geographic locations.<br />
The Company monitors the environmental laws and regulations in the countries in which it operates.<br />
<strong>Molex</strong> has implemented an environmental program to reduce the generation of potentially hazardous<br />
materials during its manufacturing process and believes it continues to meet or exceed local government<br />
regulations.<br />
34
Item 8. Financial Statements and Supplementary Data<br />
<strong>Molex</strong> Incorporated<br />
Index to Consolidated Financial Statements<br />
Consolidated Balance Sheets....................................................................................................................................36<br />
Consolidated Statements of Income.......................................................................................................................37<br />
Consolidated Statements of Cash Flows................................................................................................................38<br />
Consolidated Statements of Stockholders’ Equity................................................................................................39<br />
Notes to Consolidated Financial Statements.........................................................................................................40<br />
Report of Independent Registered Public Accounting Firm..............................................................................64<br />
Report of Independent Registered Public Accounting Firm on Internal Control<br />
Over Financial Reporting .........................................................................................................................................65<br />
35<br />
Page
<strong>Molex</strong> Incorporated<br />
Consolidated Balance Sheets<br />
(in thousands, except per share data)<br />
June 30,<br />
ASSETS<br />
Current assets:<br />
<strong>2005</strong> 2004<br />
Cash and cash equivalents.............................................................................................................. $ 309,756 $ 234,431<br />
Marketable securities.......................................................................................................................<br />
Accounts receivable, less allowances<br />
187,835 104,223<br />
of $20,293 in <strong>2005</strong> and $22,901 in 2004 .................................................................................. 539,533 529,630<br />
Inventories........................................................................................................................................ 290,100 265,344<br />
Deferred income taxes.................................................................................................................... 16,518 20,258<br />
Prepaid expenses ............................................................................................................................. 30,321 14,758<br />
Total current assets ..................................................................................................................... 1,374,063 1,168,644<br />
Property, plant and equipment, net .............................................................................................. 984,237 1,022,378<br />
Goodwill ........................................................................................................................................... 143,872 164,915<br />
Non-current deferred income taxes ............................................................................................. 126,987 119,532<br />
Other assets...................................................................................................................................... 98,513 96,877<br />
Total assets ................................................................................................................................... $ 2,727,672 $ 2,572,346<br />
LIABILITIES AND STOCKHOLDERS’ EQUITY<br />
Current liabilities:<br />
Short-term loans and current portions of long-term debt<br />
and capital leases.......................................................................................................................... $ 5,771 $ 3,694<br />
Accounts payable.............................................................................................................................<br />
Accrued expenses:<br />
252,370 234,823<br />
Salaries, commissions and bonuses .......................................................................................... 73,652 69,006<br />
Other ............................................................................................................................................. 85,407 74,154<br />
Income taxes payable...................................................................................................................... 52,304 46,787<br />
Total current liabilities................................................................................................................ 469,504 428,464<br />
Other non-current liabilities .......................................................................................................... 10,788 10,487<br />
Accrued pension and other postretirement benefits.................................................................. 67,063 52,151<br />
Long-term debt and obligations under capital leases................................................................. 9,975 14,039<br />
Minority interest in subsidiaries..................................................................................................... 2,078 1,211<br />
Total liabilities ............................................................................................................................. 559,408 506,352<br />
Stockholders’ equity:<br />
Common Stock, $0.05 par value; 200,000 shares authorized;<br />
110,814 shares issued at <strong>2005</strong> and 110,415 shares issued at 2004 ....................................... 5,541 5,521<br />
Class A Common Stock, $0.05 par value; 200,000 shares authorized;<br />
104,998 shares issued at <strong>2005</strong> and 104,162 shares issued at 2004 ....................................... 5,250 5,208<br />
Class B Common Stock, $0.05 par value; 146 shares authorized;<br />
94 shares issued at <strong>2005</strong> and 2004 ............................................................................................ 5 5<br />
Paid-in capital................................................................................................................................... 400,173 369,660<br />
Retained earnings............................................................................................................................. 2,286,826 2,160,368<br />
Treasury stock (Common Stock, 10,322 shares at <strong>2005</strong> and 9,857 shares at 2004;<br />
Class A Common Stock, 17,727 shares at <strong>2005</strong> and 15,744 shares at 2004), at cost ........ (568,917) (509,161)<br />
Deferred unearned compensation ................................................................................................ (31,910) (32,180)<br />
Accumulated other comprehensive income................................................................................ 71,296 66,573<br />
Total stockholders’ equity .............................................................................................................. 2,168,264 2,065,994<br />
Total liabilities and stockholders’ equity.................................................................................. $ 2,727,672 $2,572,346<br />
See accompanying notes to consolidated financial statements.<br />
36
<strong>Molex</strong> Incorporated<br />
Consolidated Statements of Income<br />
(in thousands, except per share data)<br />
37<br />
Years Ended June 30,<br />
<strong>2005</strong> 2004 2003<br />
Net revenue......................................................................................................... $ 2,548,652 $ 2,246,715 $ 1,843,098<br />
Cost of sales ........................................................................................................ 1,675,308 1,469,969 1,235,398<br />
Gross profit......................................................................................................... 873,344 776,746 607,700<br />
Selling, general and administrative................................................................... 622,954 555,563 470,412<br />
Restructuring costs............................................................................................. 27,875 − 35,030<br />
Goodwill and other asset impairments ........................................................... 25,169 − −<br />
Total operating expenses............................................................................... 675,998 555,563 505,442<br />
Income from operations.................................................................................... 197,346 221,183 102,258<br />
(Gain) loss on investments .............................................................................. (2,916) (5,406) 5,089<br />
Equity income..................................................................................................... (10,176) (9,555) (4,707)<br />
Interest income, net ........................................................................................... (6,449) (3,748) (8,166)<br />
Total other (income) expense, net............................................................... (19,541) (18,709) (7,784)<br />
Income before income taxes............................................................................. 216,887 239,892 110,042<br />
Income taxes ....................................................................................................... 62,463 63,571 24,762<br />
Minority interest ................................................................................................ (10) 371 362<br />
Net income.......................................................................................................... $ 154,434 $ 175,950 $ 84,918<br />
Earnings per share:<br />
Basic ................................................................................................................. $ 0.82 $ 0.93 $ 0.44<br />
Diluted ............................................................................................................. $ 0.81 $ 0.92 $ 0.44<br />
Average common shares outstanding:<br />
Basic ................................................................................................................. 188,646 190,207 191,873<br />
Diluted ............................................................................................................. 190,572 192,186 193,229<br />
See accompanying notes to consolidated financial statements.
<strong>Molex</strong> Incorporated<br />
Consolidated Statements of Cash Flows<br />
(in thousands)<br />
38<br />
Years Ended June 30,<br />
<strong>2005</strong> 2004 2003<br />
Cash and cash equivalents, beginning of year.................................................... $ 234,431 $ 178,976 $ 213,477<br />
Operating activities:<br />
Net income.............................................................................................................. 154,434 175,950 84,918<br />
Add (deduct) non-cash items included in net income:<br />
Depreciation and amortization......................................................................... 230,722 228,480 228,730<br />
Asset write-downs included in restructuring costs........................................ 12,150 − 23,070<br />
(Gain) loss on investments ............................................................................... (2,916) (5,406) 5,089<br />
Goodwill and other asset impairments ........................................................... 25,169 − −<br />
Deferred income taxes....................................................................................... (3,691) (7,698) (45,102)<br />
Loss on sale of property, plant and equipment ............................................. 11,811 3,983 5,394<br />
Amortization of deferred unearned compensation....................................... 14,913 13,848 12,807<br />
Other non-cash charges .................................................................................... 8,353 387 13,684<br />
Changes in assets and liabilities, excluding effects of foreign<br />
currency adjustments and acquisition:<br />
Accounts receivable ........................................................................................... (938) (93,909) 836<br />
Inventories........................................................................................................... (20,301) (72,159) (6,734)<br />
Accounts payable................................................................................................ 15,567 40,555 (11,730)<br />
Other current assets and liabilities................................................................... (912) 9,319 11,204<br />
Other assets and liabilities................................................................................. (13,526) (1,319) (17,294)<br />
Cash provided from operating activities............................................................. 430,835 292,031 304,872<br />
Investing activities:<br />
Capital expenditures............................................................................................... (230,895) (189,724) (171,193)<br />
Proceeds from sale of property, plant and equipment ..................................... 11,529 7,087 3,851<br />
Purchases of business assets, net of cash acquired............................................ − (37,920) −<br />
Proceeds from sales of marketable securities..................................................... 3,460,220 4,962,242 3,420,878<br />
Purchases of marketable securities ...................................................................... (3,543,679) (4,895,230) (3,492,265)<br />
Other investing activities....................................................................................... 16,593 (4,813) (10,496)<br />
Cash used for investing activities ......................................................................... (286,232) (158,358) (249,225)<br />
Financing activities:<br />
Net decrease in short-term loans ......................................................................... − (656) (794)<br />
Net decrease in long-term debt............................................................................ (852) (3,586) (916)<br />
Cash dividends paid ............................................................................................... (25,965) (19,042) (19,202)<br />
Principal payments on capital leases.................................................................... (3,325) (4,629) (7,087)<br />
Exercise of stock options...................................................................................... 12,038 9,972 8,580<br />
Purchase of treasury stock .................................................................................... (58,217) (70,215) (74,997)<br />
Reissuance of treasury stock................................................................................. 632 2,048 2,085<br />
Cash used for financing activities......................................................................... (75,689) (86,108) (92,331)<br />
Effect of exchange rate changes on cash............................................................ 6,411 7,890 2,183<br />
Net increase (decrease) in cash and cash equivalents ....................................... 75,325 55,455 (34,501)<br />
Cash and cash equivalents, end of year............................................................... $ 309,756 $ 234,431 $ 178,976<br />
Supplemental cash flow information:<br />
Interest paid............................................................................................................. $ 921 $ 842 $ 1,835<br />
Income taxes paid................................................................................................... $ 81,377 $ 82,508 $ 41,776<br />
See accompanying notes to consolidated financial statements.
<strong>Molex</strong> Incorporated<br />
Consolidated Statements of Stockholders’ Equity<br />
(in thousands)<br />
39<br />
Years Ended June 30,<br />
<strong>2005</strong> 2004 2003<br />
Common stock .....................................................................................................<br />
Paid-in capital:<br />
$ 10,796 $ 10,734 $ 10,680<br />
Beginning balance............................................................................................. $ 369,660 $ 341,530 $ 311,631<br />
Stock options granted...................................................................................... 11,554 12,552 12,552<br />
Stock options forfeited.................................................................................... (1,389) (2,022) (939)<br />
Exercise of stock options................................................................................ 13,661 12,057 9,173<br />
Issuance of stock awards................................................................................. 4,597 3,951 6,564<br />
Treasury stock................................................................................................... 79 747 635<br />
Other .................................................................................................................. 2,011 845 1,914<br />
Ending balance .................................................................................................<br />
Retained earnings:<br />
$ 400,173 $ 369,660 $ 341,530<br />
Beginning balance............................................................................................. $ 2,160,368 $ 2,003,440 $ 1,937,488<br />
Net income........................................................................................................ 154,434 175,950 84,918<br />
Cash dividends.................................................................................................. (27,964) (19,042) (19,202)<br />
Other .................................................................................................................. (12) 20 236<br />
Ending balance .................................................................................................<br />
Treasury stock:<br />
$ 2,286,826 $ 2,160,368 $ 2,003,440<br />
Beginning balance............................................................................................. $ (509,161) $ (437,234) $ (362,479)<br />
Purchase of treasury stock .............................................................................. (58,217) (70,215) (74,997)<br />
Reissuance of treasury stock........................................................................... 553 1,301 1,450<br />
Exercise of stock options................................................................................ (1,685) (2,672) (645)<br />
Other .................................................................................................................. (407) (341) (563)<br />
Ending balance .................................................................................................<br />
Deferred unearned compensation:<br />
$ (568,917) $ (509,161) $ (437,234)<br />
Beginning balance............................................................................................. $ (32,180) $ (32,094) $ (27,262)<br />
Stock options granted...................................................................................... (11,554) (12,552) (12,552)<br />
Stock options forfeited.................................................................................... 1,508 2,034 942<br />
Issuance of stock awards................................................................................. (4,597) (3,416) (6,029)<br />
Compensation expense.................................................................................... 14,913 13,848 12,807<br />
Ending balance .................................................................................................<br />
Accumulated other comprehensive income, net of tax:<br />
$ (31,910) $ (32,180) $ (32,094)<br />
Beginning balance............................................................................................. $ 66,573 $ 10,246 $ (42,354)<br />
Translation adjustments .................................................................................. 4,678 51,544 56,982<br />
Minimum pension liability .............................................................................. − 4,503 (4,503)<br />
Unrealized investment gain............................................................................. 45 280 121<br />
Ending balance ................................................................................................. $ 71,296 $ 66,573 $ 10,246<br />
Total stockholders’ equity ................................................................................... $ 2,168,264 $ 2,065,994 $ 1,896,568<br />
Comprehensive income, net of tax:<br />
Net income........................................................................................................ $ 154,434 $ 175,950 $ 84,918<br />
Translation adjustments .................................................................................. 4,678 51,544 56,982<br />
Minimum pension liability .............................................................................. − 4,503 (4,503)<br />
Unrealized investment gain............................................................................. 45 280 121<br />
Total comprehensive income ............................................................................. $ 159,157 $ 232,277 $ 137,518<br />
See accompanying notes to consolidated financial statements.
1. Organization and Basis of Presentation<br />
<strong>Molex</strong> Incorporated<br />
Notes to Consolidated Financial Statements<br />
(dollars in thousands, except per share data)<br />
<strong>Molex</strong> Incorporated manufactures electronic components, including electrical and fiber optic<br />
interconnection products and systems, switches and integrated products in 58 plants in 19 countries on five<br />
continents. As used herein the term “<strong>Molex</strong>” or “Company” includes <strong>Molex</strong> Incorporated and its<br />
subsidiaries.<br />
2. Summary of Significant Accounting Policies<br />
Principles of Consolidation<br />
The consolidated financial statements include the accounts of <strong>Molex</strong> Incorporated and its majorityowned<br />
subsidiaries. All material intercompany balances and transactions are eliminated in consolidation.<br />
Investments in affiliates in which the Company’s ownership is 20% to 50% are reported using the equity<br />
method of accounting.<br />
Use of Estimates<br />
The preparation of financial statements in conformity with accounting principles generally accepted<br />
in the United States requires the use of estimates and assumptions related to the reporting of assets, liabilities,<br />
revenues, expenses and related disclosures. Actual results could differ from these estimates.<br />
Currency Translation<br />
Assets and liabilities of international entities are translated at period-end exchange rates and income<br />
and expenses are translated using weighted-average exchange rates for the period. Translation adjustments<br />
are included as a component of accumulated other comprehensive income.<br />
Cash and Cash Equivalents<br />
The Company considers all liquid investments with original maturities of three months or less to be<br />
cash equivalents.<br />
Marketable Securities<br />
Marketable securities consist of government and municipal debt securities and are carried at fair<br />
value. The Company generally holds these instruments for three to 12 months. These instruments contain<br />
embedded derivative features that enhance the liquidity of the portfolio by enabling the Company to liquidate<br />
the instrument prior to the stated maturity date. Marketable securities are classified as available-for-sale<br />
securities and, accordingly, mark-to-market adjustments are recorded in other comprehensive income.<br />
To date, no mark-to-market adjustments have been required as the carrying value of the securities<br />
approximates the market value. Proceeds from sales of available-for-sales securities, excluding maturities, as<br />
of June 30, <strong>2005</strong>, 2004 and 2003 were $279,586, $295,732 and $103,962 respectively. There were no<br />
associated gains or losses on these sales.<br />
Accounts Receivable<br />
In the normal course of business, the Company extends credit to customers that satisfy pre-defined<br />
credit criteria. The Company believes that it has little concentration of credit risk due to the diversity of its<br />
customer base. Accounts receivable, as shown on the Consolidated Balance Sheets, were net of allowances<br />
and anticipated discounts. An allowance for doubtful accounts is determined through analysis of the aging of<br />
40
accounts receivable at the date of the financial statements, assessments of collectibility based on historical<br />
trends and an evaluation of the impact of current and projected economic conditions. The Company<br />
monitors the collectibility of its accounts receivable on an ongoing basis by analyzing the aging of its<br />
accounts receivable, assessing the credit worthiness of its customers and evaluating the impact of reasonably<br />
likely changes in economic conditions that may impact credit risks.<br />
Inventories<br />
Inventories are valued at the lower of first-in, first-out cost or market value.<br />
Property, Plant and Equipment<br />
Property, plant and equipment are reported at cost less accumulated depreciation. Depreciation is<br />
primarily recorded on a straight-line basis for financial statement reporting purposes and using a combination<br />
of accelerated and straight-line methods for tax purposes.<br />
The estimated useful lives are as follows:<br />
Buildings .................................................................................................................................................... 25–45 years<br />
Machinery and equipment....................................................................................................................... 3–10 years<br />
Molds and dies .......................................................................................................................................... 3–4 years<br />
Costs of leasehold improvements are amortized over the terms of the related leases or the useful life<br />
of the improvement, whichever is shorter. The Company performs reviews for impairment of long-lived<br />
assets whenever adverse events or circumstances indicate that the carrying value of an asset may not be<br />
recoverable. When indicators of impairment are present, the Company evaluates the carrying value of the<br />
long-lived assets in relation to the operating performance and future undiscounted cash flows of the<br />
underlying assets. The Company adjusts the net book value of the underlying assets to fair value if the sum<br />
of the expected future cash flows is less than book value.<br />
Goodwill<br />
Goodwill is recorded when the purchase price paid for an acquisition exceeds the estimated fair<br />
value of the net identified tangible and intangible assets acquired. The Company performs an annual review<br />
in the fourth quarter of each year, or more frequently if indicators of potential impairment exist, to determine<br />
if the carrying value of the recorded goodwill is impaired. The impairment review process compares the fair<br />
value of the reporting unit in which goodwill resides to its carrying value. Reporting units may be operating<br />
segments as a whole or an operation one level below an operating segment, referred to as a component. An<br />
annual review was performed as of May 31, <strong>2005</strong> resulting in an impairment in the value of the Company’s<br />
goodwill related to the <strong>Molex</strong> Premise Network (MPN) reporting unit (see Note 12).<br />
Intangible Assets<br />
Intangible assets consist primarily of the rights acquired under technology licenses and are amortized<br />
over the periods of benefit, not to exceed 10 years, generally on a straight-line basis.<br />
Pension and Other Postretirement Plan Benefits<br />
Pension and other postretirement plan benefits are expensed as employees earn such benefits. The<br />
recognition of expense is significantly impacted by estimates made by management such as discount rates<br />
used to value certain liabilities, expected return on assets and future healthcare costs. The Company uses<br />
third-party specialists to assist management in appropriately measuring the expense associated with pension<br />
and other postretirement plan benefits.<br />
41
Revenue Recognition<br />
Revenue is realized or realizable and earned when (a) persuasive evidence of an arrangement exists,<br />
(b) delivery has occurred or services have been rendered, (c) the seller’s price to the buyer is fixed and<br />
determinable and (d) collectibility is reasonably assured.<br />
The Company recognizes revenue when in the normal course of its business the following<br />
conditions are met: (a) a purchase order has been received from the customer with a corresponding order<br />
acknowledgement sent to the customer confirming delivery, price and payment terms, (b) product has been<br />
shipped (FOB origin) or delivered (FOB destination) and title has clearly transferred to the customer or<br />
customer carrier, (c) the price to the buyer is fixed and determinable for most sales with an estimate of<br />
allowances made based on historical experience and (d) there is reasonable assurance of collectibility.<br />
The Company records revenue on a consignment sale when a customer has taken title of product<br />
which is stored in either the customer’s warehouse or that of a third party.<br />
From time to time, the Company will discontinue or obsolete products that it has formerly sold.<br />
When this is done, an accrual for estimated returns is established at the time of the announcement of product<br />
discontinuation or obsolescence.<br />
The Company typically warrants that (a) its products will conform to <strong>Molex</strong> specifications and (b)<br />
that its products will be free from material defects in materials and manufacturing, and limits its liability to<br />
the replacement of defective parts or the cash value of replacement parts. The Company will not accept<br />
returned goods unless the customer makes a claim in writing and management authorizes the return. Returns<br />
result primarily from defective products or shipping discrepancies. A reserve for estimated returns is<br />
established at the time of sale based on historical return experience and is recorded as a reduction of revenue.<br />
The Company provides certain distributors with an inventory allowance for returns or scrap equal to<br />
a percentage of qualified purchases. A reserve for estimated inventory allowances is established at the time of<br />
the sale based on a fixed percentage of sales to distributors authorized and agreed to by <strong>Molex</strong> and is<br />
recorded as a reduction of revenue.<br />
From time to time the Company in its sole discretion will grant price allowances to customers. A<br />
reserve for estimated price allowances is established at the time of sale based on historical allowances<br />
authorized and approved by <strong>Molex</strong> solely at its discretion and is recorded as a reduction of revenue.<br />
Other allowances include customer quantity and price discrepancies. A reserve for other allowances<br />
is established at the time of sale based on historical experience and is recorded as a reduction of revenue.<br />
The Company believes it can reasonably and reliably estimate the amounts of future allowances.<br />
Shipping, Handling and Advertising Costs<br />
Shipping and handling costs included in selling, general and administrative expenses totaled $30,739,<br />
$22,783 and $19,000 in fiscal <strong>2005</strong>, 2004 and 2003, respectively. In addition, advertising costs are expensed<br />
as incurred and totaled $5,453, $4,661 and $4,535 in fiscal <strong>2005</strong>, 2004 and 2003, respectively.<br />
Research and Development and Patent Costs<br />
Costs incurred in connection with the development of new products and applications are charged to<br />
operations as incurred. Research and development costs are included in selling, general and administrative<br />
expenses.<br />
Stock-Based Compensation<br />
As permitted by SFAS No. 123, “Accounting for Stock-Based Compensation,” the Company has<br />
elected to account for its stock-based compensation programs according to the provisions of Accounting<br />
Principles Board (APB) Opinion No. 25, “Accounting for Stock Issued to Employees.” The Company has<br />
42
adopted the disclosure provisions of SFAS No. 148, “Accounting for Stock-Based Compensation -<br />
Transition and Disclosure.” Had the Company elected to apply the provisions of SFAS No. 123 as amended<br />
by SFAS No. 148 regarding recognition of compensation expense to the extent of the calculated fair value of<br />
stock options granted, the effects on reported net income and earnings per share for the years ended June 30<br />
using the Black-Scholes option-pricing model and the assumptions set forth in Note 22 would have been as<br />
follows:<br />
<strong>2005</strong> 2004 2003<br />
Net income as reported............................................................................. $ 154,434 $ 175,950 $ 84,918<br />
Add: Stock-based compensation included in reported<br />
net income, net of related tax effects .................................................. 10,618 10,179 9,925<br />
Deduct: Stock-based compensation determined under<br />
fair value method, net of related tax effects...................................... (20,977) (21,020) (17,433)<br />
Pro forma net income................................................................................ $ 144,075 $ 165,109 $ 77,410<br />
Earnings per share:<br />
Basic.......................................................................................................... $ 0.82 $ 0.93 $ 0.44<br />
Diluted...................................................................................................... $ 0.81 $ 0.92 $ 0.44<br />
Pro forma earnings per share:<br />
Basic.......................................................................................................... $ 0.76 $ 0.87 $ 0.40<br />
Diluted...................................................................................................... $ 0.76 $ 0.86 $ 0.40<br />
Income Taxes<br />
Deferred tax assets and liabilities are recognized based on differences between the financial<br />
statement and tax bases of assets and liabilities using presently enacted tax rates. The Company has<br />
operations that are subject to income and other similar taxes in foreign countries. The estimation of the<br />
income tax amounts to be recorded by the Company involves the interpretation of complex tax laws and<br />
regulations, evaluation of tax audit findings and assessment of the impact foreign taxes may have on domestic<br />
taxes. A valuation allowance is provided to offset deferred tax assets if, based on available evidence, it is<br />
more likely than not that some or all of the deferred tax assets will not be realized.<br />
Derivative Instruments and Hedging Activities<br />
The use of derivative instruments is limited primarily to hedging activities related to specific foreign<br />
currency cash flows. The Company had no material derivatives outstanding at June 30, <strong>2005</strong>. The impact of<br />
gains and losses on such instruments was not material to the results of operations for years ended June 30,<br />
<strong>2005</strong>, 2004 and 2003.<br />
Reclassifications<br />
Certain reclassifications have been made to the prior years’ financial statements to conform to the<br />
<strong>2005</strong> classifications. For fiscal 2003 pre-tax restructuring costs of $6.5 million previously included in selling,<br />
general and administrative expenses and $29.5 million in cost of sales have been reclassified to reflect<br />
restructuring costs as a separate line item. Certain amounts in the fiscal 2004 and 2003 Consolidated<br />
Statements of Cash Flows have been reclassified within operating activities to reflect other non-cash items as<br />
a separate line item.<br />
New Accounting Pronouncements<br />
The American Jobs Creation Act of 2004 (the Act), which was signed into law on October 22, 2004,<br />
introduces a special one-time dividends received deduction on the repatriation of certain foreign earnings to a<br />
U.S. taxpayer (Repatriation Provision), provided certain criteria are met. The Financial Accounting Standards<br />
Board (FASB) issued Staff Position No. FAS 109-2 in December 2004, which requires the recording of tax<br />
expense if and when an entity decides to repatriate foreign earnings subject to the Act. The Company has<br />
considered the implications of the Act on the repatriation of certain foreign earnings, which reduces the<br />
Federal income tax rate on dividends from non-U.S. subsidiaries. The one-time repatriation provision is<br />
elective, and is applicable to <strong>Molex</strong> Incorporated on certain foreign profit distributions received during either<br />
43
fiscal <strong>2005</strong> or 2006. The Company did not repatriate earnings under the Act in fiscal <strong>2005</strong> and will not<br />
repatriate foreign earnings under the Act in fiscal 2006.<br />
In November 2004, the FASB issued SFAS No. 151, “Inventory Costs, an amendment of ARB No.<br />
43, Chapter 4.” SFAS No. 151 clarifies that abnormal inventory costs such as costs of idle facilities, excess<br />
freight and handling costs, and wasted materials (spoilage) are required to be recognized as current period<br />
charges. The provisions of SFAS No. 151 are effective for fiscal years beginning after June 15, <strong>2005</strong>. The<br />
Company adopted SFAS No. 151 in June, <strong>2005</strong>. The impact on the Company’s consolidated financial<br />
position and results of operations was not material.<br />
In December 2004, the FASB issued SFAS No. 123 (revised 2004), “Share-Based Payment,” which is<br />
a revision of SFAS No. 123, “Accounting for Stock-Based Compensation.” SFAS No. 123(R) supersedes<br />
APB No. 25, “Accounting for Stock Issued to Employees,” and amends SFAS No. 95, “Statement of Cash<br />
Flows.” Generally, the approach in Statement No. 123(R) is similar to the approach described in Statement<br />
No. 123. Statement No. 123(R) requires that all share-based payments to employees, including grants of<br />
employee stock options, be recognized in the income statement based on their fair values. Pro forma<br />
disclosure is no longer an option. The provisions of Statement No. 123(R) are effective for fiscal years<br />
beginning after June 15, <strong>2005</strong>. As permitted by SFAS No. 123, the Company currently accounts for sharebased<br />
payments to employees using APB No. 25’s intrinsic value method. The Company adopted SFAS No.<br />
123(R) on July 1, <strong>2005</strong> using the modified prospective method. The impact of adoption of SFAS 123(R) is<br />
expected to result in an additional pre-tax expense in fiscal 2006 of $11.9 million, for options granted through<br />
June 30, <strong>2005</strong>, plus an amount that has not been determined for options granted in fiscal 2006. Had the<br />
Company adopted SFAS No. 123(R) in prior periods, the impact of that standard would have approximated<br />
the impact of SFAS No. 123 as described in Note 2.<br />
3. Restatement of Cash Flow Activities<br />
In the fourth quarter of fiscal 2004, the Company implemented a new process to capture and analyze<br />
the various financial data used in the preparation of the consolidated statement of cash flows. During the<br />
testing of the new process, the Company discovered an error in the consolidated statement of cash flows for<br />
the year ended June 30, 2003. The Company’s old process was based on a Hyperion-based calculated cash<br />
flow model, which recorded the change in “other assets” as an investing activity. The old process required<br />
manual analysis and adjustment to identify and properly classify changes in other assets, such as deferred<br />
taxes and prepaid pensions, as operating activities. The Company made a clerical error in this process in its<br />
cash flow statement for the fiscal year ended June 30, 2003. The result of this error was an overstatement of<br />
cash provided from operating activities and an overstatement of cash used for investing activities.<br />
In the Form 10-K for fiscal 2004, cash provided from operating activities and cash used for investing<br />
activities were restated in the consolidated statement of cash flows for the year ended June 30, 2003 as<br />
follows:<br />
Originally<br />
Restated Reported<br />
Cash provided from operating activities......................................................... $ 304,872 $ 349,473<br />
Cash used for investing activities..................................................................... $ (249,225) $ (293,826)<br />
Similar errors relating to the classification of other assets occurred in the Company’s quarterly<br />
reports for fiscal 2004 quarters ended March 31, December 31 and September 30. The impact of such errors<br />
on reported cash provided from operating activities and cash used for investing activities was not material.<br />
4. Correction of Prior Years’ Errors<br />
In the first, third and fourth quarters of <strong>2005</strong>, the Company recorded the adjustments discussed<br />
below to correct errors in prior years’ financial statements. The Company has concluded that these<br />
corrections of errors are not material, either individually or in the aggregate, to the trends of the financial<br />
44
statements, or to a fair presentation of the Company’s results of operations and financial position for any of<br />
the years affected. Accordingly, results for fiscal 2004 and prior years have not been restated.<br />
Quarter ended September 30, 2004<br />
Included in the first fiscal quarter of <strong>2005</strong> is a charge of $9,100 ($5,914 after-tax) for the cumulative<br />
effect of an error in prior years. This error related to the inadvertent omission of in-transit intercompany<br />
inventory in the Company’s calculation of profit-in-inventory elimination. The Company recorded this<br />
profit-in-inventory adjustment as a reduction to inventories and a charge to cost of sales.<br />
Also included in the first fiscal quarter of <strong>2005</strong> results is a charge of $4,824 ($3,136 after-tax) for the<br />
cumulative effect of an error in prior years related to the Company’s vacation accrual calculation. Also<br />
included is a charge for the correction of an error of the prior year bonus accrual of $500 ($325 after-tax).<br />
In addition, included in the results of the first fiscal quarter of <strong>2005</strong> are the correction of an error<br />
related to a prior year inventory allowance of $1,142 ($742 after-tax), the correction of an error of a prior year<br />
insurance accrual of $2,700 ($1,755 after-tax), and the cumulative effect of an error related to prior years’<br />
receivable allowance of $3,169 ($2,060 after-tax). These three items had a positive impact on income.<br />
The aggregate effect of these corrections of errors recorded in the first fiscal quarter of <strong>2005</strong> reduced<br />
gross profit by $7,332 and increased selling, general and administrative expenses by $81, resulting in a<br />
reduction of pre-tax income of $7,413 ($4,818 after-tax or $0.03 per share in the quarter).<br />
Quarter ended March 31, <strong>2005</strong><br />
In the third fiscal quarter of <strong>2005</strong>, gross profit was reduced by $2,013 ($1,308 after-tax) to correct<br />
the timing of revenue recognition for certain customers where title passes on receipt of product.<br />
Also included in the third fiscal quarter of <strong>2005</strong> results is an adjustment to deferred income taxes for<br />
state taxes, which reduced <strong>2005</strong> income tax expense by $2,607.<br />
The aggregate effect of these corrections of errors recorded in the third fiscal quarter of <strong>2005</strong><br />
resulted in an increase in net income of $1,299 or $0.01 per share in the quarter.<br />
Quarter ended June 30, <strong>2005</strong><br />
Included in the fourth fiscal quarter of <strong>2005</strong> results are charges of $2,210 ($1,437 after-tax) to correct<br />
errors of prior years’ pension expense outside the United States.<br />
Included in the fourth fiscal quarter of <strong>2005</strong> results are corrections of various prior years’ accruals<br />
and prepaid expenses, which increased <strong>2005</strong> pre-tax income by $1,569 ($1,020 after-tax).<br />
Also included in the fourth fiscal quarter of <strong>2005</strong> results is a correction of a 2004 depreciation<br />
adjustment, which increased <strong>2005</strong> pre-tax income by $642 ($417 after-tax).<br />
In addition, included in the fourth fiscal quarter of <strong>2005</strong> results is a correction of prior years’ equity<br />
income, which reduced pre-tax income by $386 ($251 after tax).<br />
Also included in the fourth fiscal quarter of <strong>2005</strong> results are corrections of prior years’ accruals for<br />
potential income tax exposures and other income tax adjustments that reduced <strong>2005</strong> income tax expense by<br />
$5,668.<br />
The aggregate effect of these corrections of errors recorded in the fourth fiscal quarter of <strong>2005</strong><br />
increased gross profit by $1,383 and increased selling, general and administrative expenses by $1,382, and<br />
reduced equity income by $386 resulting in a decrease in pre-tax income of $385 and an increase in net<br />
income of $5,417 ($0.03 per share).<br />
45
Year ended June 30, <strong>2005</strong><br />
The aggregate effect of the corrections of errors recorded in fiscal <strong>2005</strong> reduced gross profit by<br />
$7,962 and increased selling, general and administrative expenses by $1,463, and reduced equity income by<br />
$386 and reduced income tax expense by $11,709, resulting in a reduction in pre-tax income of $9,811 and an<br />
increase in net income of $1,898 ($0.01 per share). Of those cumulative amounts, pre-tax and net income for<br />
fiscal 2004 should have been reduced by $3,308 and $4,779 ($0.02 per share) respectively; pre-tax income for<br />
fiscal 2003 should have been reduced by $2,697 and net income should have been increased by $2,474 ($0.01<br />
per share); and pre-tax and net income for fiscal 2002 and prior years should have been reduced by $3,806<br />
and increased by $4,203, respectively.<br />
The following table summarizes the correction of prior years’ errors:<br />
Recorded Should Have Been Recorded<br />
In <strong>2005</strong> Increase (Reduce) Income<br />
Income/ Prior to<br />
Pre-tax: (Expense) 2004 2003 2003<br />
Overstatement of profit in inventory................................. $ (9,100) $ (3,200) $ (1,200) $ (4,700)<br />
Overstatement of inventory reserve - software logic ...... 1,142 − − 1,142<br />
Overstatement of accrued insurance.................................. 2,700 − 2,200 500<br />
Understatement of accrued vacation.................................. (4,824) (604) (1,590) (2,630)<br />
Overstatement of reserve for doubtful accounts ............. 3,169 (625) (710) 4,504<br />
Understatement of bonus accrual....................................... (500) (500) − −<br />
Overstatement of gross margin -FOB destination .......... (2,013) 816 (1,183) (1,646)<br />
Understatement of accrued pension................................... (2,210) (693) 124 (1,641)<br />
Adjustment to properly record equity investment........... (386) (43) 511 (854)<br />
Depreciation........................................................................... 642 642 − −<br />
Other ....................................................................................... 1,569 899 (849) 1,519<br />
Total pre-tax .......................................................................... $ (9,811) $ (3,308) $(2,697) $ (3,806)<br />
Tax effect of items above..................................................... 3,434 1,158 944 1,332<br />
Income taxes adjustments.................................................... 8,275 (2,629) 4,227 6,677<br />
Net income............................................................................. $ 1,898 $ (4,779) $ 2,474 $ 4,203<br />
5. Earnings Per Share<br />
Basic earnings per share (EPS) is computed by dividing net income by the weighted-average number<br />
of common shares outstanding during the year. Diluted EPS is computed by dividing net income by the<br />
weighted-average number of common shares and dilutive common shares outstanding, which includes stock<br />
options, during the year. A reconciliation of the basic average common shares outstanding to diluted average<br />
common shares outstanding as of June 30 is as follows:<br />
<strong>2005</strong> 2004 2003<br />
Net income.......................................................................................................... $154,434 $175,950 $ 84,918<br />
Basic average common shares outstanding.................................................... 188,646 190,207 191,873<br />
Effect of dilutive stock options........................................................................ 1,926 1,979 1,356<br />
Diluted average common shares outstanding................................................<br />
Earnings per share:<br />
190,572 192,186 193,229<br />
Basic............................................................................................................... $ 0.82 $ 0.93 $ 0.44<br />
Diluted............................................................................................................ $ 0.81 $ 0.92 $ 0.44<br />
Excluded from the computations above were anti-dilutive shares of 2,367, 1,265 and 2,103 in <strong>2005</strong>,<br />
2004 and 2003 respectively.<br />
46
6. Acquisition<br />
On April 2, 2004, the Company acquired 100% of the assets and assumed certain liabilities of<br />
Connecteurs Cinch S.A. (Cinch) and its subsidiaries in Portugal, India and China. Cinch specializes in<br />
automotive connection technology and with its strong European presence will strengthen <strong>Molex</strong>’s role as a<br />
supplier of innovative interconnection solutions to the major global automotive manufacturers.<br />
This acquisition was accounted for using the purchase method of accounting and the results of<br />
operations from the date of acquisition are included in the consolidated financial statements. Cinch financial<br />
results are not material to the results of operations of the Company and proforma financial data is not<br />
presented. The purchase price of $37,920, net of acquired cash, was allocated to the assets acquired based on<br />
their estimated fair values as follows:<br />
Current assets............................................................................................................................................... $ 26,578<br />
Property, plant and equipment.................................................................................................................. 21,448<br />
Goodwill ...................................................................................................................................................... 4,167<br />
Intangible assets........................................................................................................................................... 1,013<br />
Liabilities assumed....................................................................................................................................... (15,286)<br />
Total purchase price.................................................................................................................................... $ 37,920<br />
7. Restructuring<br />
Restructuring and severance costs reflect the cost reduction programs being implemented by the<br />
Company. These include the closing of facilities and the termination of employees. Severance costs also<br />
include executive severance and charges for the fair value of stock options of certain former employees that<br />
did not expire at termination. Restructuring costs are expensed during the period in which the Company<br />
determines it will incur those costs and all requirements of accrual are met. Because these costs are recorded<br />
based upon estimates, actual expenditures for the restructuring activities may differ from the initially<br />
recorded costs. If the initial estimates are too low or too high, the Company could be required either to<br />
record additional expenses in future periods or to reverse part of the previously recorded charges. Asset<br />
write-downs are principally related to buildings and equipment that will not be used subsequent to the<br />
completion of restructuring plans, and cannot be sold for amounts in excess of carrying value.<br />
Year ended June 30, <strong>2005</strong><br />
During the fourth quarter of fiscal <strong>2005</strong>, the Company decided to close certain operations in the<br />
Americas and European regions in order to reduce operating costs and better align the Company’s<br />
manufacturing capacity with customer needs. The Company recorded pre-tax charges of $27,875 ($21,594<br />
after-tax) related to these actions. In the Americas region, the Company plans to close an industrial<br />
manufacturing facility in New England and cease manufacturing in its Detroit area automotive facility. The<br />
automotive development center also located in the Detroit area will continue in operation. In Europe, the<br />
Company plans to close certain manufacturing facilities in Ireland, Portugal and Slovakia, and reduce the size<br />
of a development center in Germany. Production from these manufacturing facilities is expected to be<br />
transferred to existing plants within the region. Included in the restructuring charge will be costs to reduce<br />
the Company’s selling, general and administrative costs in the Americas, Europe and at the corporate office.<br />
The Company estimates that it will reduce headcount by approximately 600 people after additions at the<br />
facilities where production is being transferred.<br />
The following table summarizes the pre-tax impact in fiscal <strong>2005</strong> of the restructuring programs<br />
described above:<br />
Severance Asset<br />
Costs Write-downs Total<br />
Americas Region...................................................................................... $ 9,141 $ 4,945 $ 14,086<br />
European Region..................................................................................... 3,636 7,205 10,841<br />
Corporate and other................................................................................ 2,948 − 2,948<br />
Total........................................................................................................... $ 15,725 $ 12,150 $ 27,875<br />
47
Year ended June 30, 2003<br />
As a result of continuing weak demand in the telecommunications infrastructure market, the<br />
Company implemented several actions during the fourth quarter of fiscal 2003 to address the competitive<br />
challenges in this market. The Company recorded pre-tax charges totaling $35,030 ($24,751 after-tax) related<br />
to these actions. These charges related to the write-down and impairment of manufacturing assets and for<br />
the severance and other benefits relating to workforce reductions of 537 people. The charges primarily<br />
impacted the Americas region and the European region where the Company had its highest concentration of<br />
telecom business. The Company consolidated manufacturing production that supported the<br />
telecommunications infrastructure market in the Americas and European regions, as well as discontinued the<br />
marketing and production of certain product families. Manufacturing assets were written down to expected<br />
disposal value. Of the 537 people included in the workforce reduction, 376 were directly involved in<br />
manufacturing operations and 161 were involved in manufacturing support, sales and administrative<br />
positions. Some employment reductions occurred during fiscal 2003, and substantially all remaining<br />
employment reductions occurred in the first half of fiscal 2004.<br />
The following table summarizes the pre-tax impact of restructuring programs initiated during the<br />
year ended June 30, 2003:<br />
Severance Asset<br />
Costs Write-downs Total<br />
Americas Region...................................................................................... $ 9,333 $ 18,356 $ 27,689<br />
European Region..................................................................................... 2,127 4,714 6,841<br />
Corporate and other................................................................................ 500 − 500<br />
Total........................................................................................................... $ 11,960 $ 23,070 $ 35,030<br />
Changes in the accrued severance balance are summarized as follows:<br />
<strong>2005</strong> 2003<br />
Charge Charge Total<br />
Balance at June 30, 2002............................................................................ − − −<br />
Charges to expense................................................................................. − $ 11,960 $ 11,960<br />
Cash payments ........................................................................................ − (1,123) (1,123)<br />
Non-cash related costs........................................................................... − (711) (711)<br />
Balance at June 30, 2003............................................................................ − 10,126 10,126<br />
Cash payments ........................................................................................ − (7,447) (7,447)<br />
Balance at June 30, 2004............................................................................ − 2,679 2,679<br />
Charges to expense................................................................................. $ 15,725 − 15,725<br />
Cash payments ........................................................................................ (3,788) (2,049) (5,837)<br />
Non-cash related costs........................................................................... (1,652) − (1,652)<br />
Balance at June 30, <strong>2005</strong>............................................................................ $ 10,285 $ 630 $ 10,915<br />
Substantially all of the remaining restructuring liabilities, currently shown in accrued expenses, are<br />
expected to be paid by June 30, 2006. The payment terms related to these programs varies, usually based on<br />
local customs and laws. Some amounts are paid in a lump sum at termination, while other payments are<br />
structured to be paid in installments.<br />
8. Research and Development and Patent Costs<br />
Research and development costs are included in selling, general and administrative expenses and<br />
totaled $133,595, $119,028 and $116,986 in <strong>2005</strong>, 2004 and 2003, respectively. Patent costs, which are also<br />
included in selling, general and administrative expenses, were $2,640, $3,118 and $3,949 in <strong>2005</strong>, 2004 and<br />
2003, respectively.<br />
48
9. Other (Income) Expense<br />
The Company recorded a pre-tax gain of $10,393 ($7,483 after-tax) for the sale of stock of an<br />
affiliate and a gain reported in equity income resulting from an IPO completed by the affiliate during the<br />
second quarter of fiscal 2004. <strong>Molex</strong> retained a 20% ownership in this affiliate. In addition, in fiscal 2004 the<br />
Company recorded a pre-tax charge of $4,987 ($3,790 after-tax) to exit other investments in start-up<br />
technologies.<br />
During the fourth quarter of fiscal 2003, the Company discontinued the marketing and production<br />
of certain product families dedicated to the telecom industry and wrote off the related licenses. <strong>Molex</strong> also<br />
wrote down its investment in a joint venture that was engaged in the development of similar technology. The<br />
Company recorded a pre-tax charge of $5,089 ($3,830 after-tax) related to these actions.<br />
10. Inventories<br />
Inventories, less allowances of $34,198 at June 30, <strong>2005</strong> and $41,327 at June 30, 2004, consist of the<br />
following:<br />
<strong>2005</strong> 2004<br />
Raw materials ................................................................................................................... $ 43,423 $ 39,743<br />
Work in progress ............................................................................................................. 94,695 91,168<br />
Finished goods................................................................................................................. 151,982 134,433<br />
Total inventories.............................................................................................................. $ 290,100 $ 265,344<br />
11. Property, Plant and Equipment<br />
Property, plant and equipment are reported at cost less accumulated depreciation. Depreciation is<br />
primarily recorded on a straight-line basis for financial statement reporting purposes and using a combination<br />
of accelerated and straight-line methods for tax purposes. At June 30, property, plant and equipment consist<br />
of the following:<br />
<strong>2005</strong> 2004<br />
Land and improvements ............................................................................................... $ 77,246 $ 82,051<br />
Buildings and leasehold improvements ...................................................................... 534,301 548,717<br />
Machinery and equipment............................................................................................. 1,385,074 1,426,090<br />
Molds and dies ................................................................................................................ 606,272 659,571<br />
Construction in progress............................................................................................... 70,815 66,094<br />
Total.................................................................................................................................. $ 2,673,708 $ 2,782,523<br />
Accumulated depreciation............................................................................................. (1,689,471) (1,760,145)<br />
Net property, plant and equipment............................................................................. $ 984,237 $ 1,022,378<br />
Depreciation expense for property, plant and equipment was $227,660, $225,196 and $224,717 in<br />
<strong>2005</strong>, 2004 and 2003, respectively.<br />
12. Goodwill<br />
Goodwill for the years ended June 30, <strong>2005</strong>, 2004 and 2003 was as follows:<br />
<strong>2005</strong> 2004 2003<br />
Beginning balance.................................................................................... $ 164,915 $ 160,732 $ 160,180<br />
Impairments ............................................................................................. (22,876) − −<br />
Additions................................................................................................... 1,800 4,166 539<br />
Other adjustments................................................................................... 33 17 13<br />
Ending Balance........................................................................................ $ 143,872 $ 164,915 $ 160,732<br />
During <strong>2005</strong>, the Company completed its annual impairment review for goodwill. Indicators of<br />
impairment were found in the MPN reporting unit. The MPN business, consisting of products primarily<br />
49
sold into the structured cabling market for data communications, had not performed as management had<br />
expected.<br />
Slower growth in MPN’s markets served and slower-than-expected customer acceptance of its<br />
products in the structured cabling business, as well as a delay in the transition to next-generation data<br />
communication networks, had a negative impact on MPN’s operating results. These factors resulted in lower<br />
growth expectations for the reporting unit, which resulted in the goodwill impairment charge.<br />
A goodwill impairment review requires a two-step process. The first step of the review compares the<br />
estimated fair value of reporting unit against its aggregate carrying value, including goodwill. The<br />
Company estimated the fair value of the MPN reporting unit using the income method of valuation, which<br />
included the use of estimated discounted cash flows. Based on the comparison, the carrying value of the<br />
MPN reporting unit exceeded its fair value.<br />
Accordingly, the Company performed the second step of the test, comparing the implied fair value<br />
of the MPN reporting unit’s goodwill with the carrying value of that goodwill. Based on this assessment, the<br />
Company recorded a non-cash impairment charge of $22,876 in <strong>2005</strong>. The charge is included as a<br />
component of net income in the Corporate and Other segment in Note 23.<br />
The estimated fair market value of the business was based on a valuation by an independent<br />
valuation firm.<br />
Other changes to goodwill are attributable to the Company’s acquisition during fiscal 2004 (see Note<br />
6), contingent purchase payments on a fiscal 2001 acquisition and foreign currency translation adjustments.<br />
13. Other Intangible Assets<br />
Intellectual property assets primarily represent rights acquired under technology licenses and are<br />
amortized over the periods of benefit, not to exceed 10 years, generally on a straight-line basis.<br />
All of the Company’s intangible assets other than goodwill are included in “Other Assets” and are<br />
subject to amortization as follows:<br />
License Fees Patents Total<br />
At June 30, <strong>2005</strong>:<br />
Gross carrying value.................................................................................. $ 11,232 $ 2,340 $ 13,572<br />
Accumulated amortization....................................................................... (6,542) (704) (7,246)<br />
Net carrying value...................................................................................... $ 4,690 $ 1,636 $ 6,326<br />
At June 30, 2004:<br />
Gross carrying value.................................................................................. $ 11,584 $ 2,512 $ 14,096<br />
Accumulated amortization....................................................................... (6,544) (340) (6,884)<br />
Net carrying value...................................................................................... $ 5,040 $ 2,172 $ 7,212<br />
Total amortization expense for intangible assets was $3,062, $3,284 and $4,013 in <strong>2005</strong>, 2004 and 2003,<br />
respectively. Estimated future amortization expense for intangible assets is $2,151, $1,620, $1,086, $799 and $245<br />
in 2006, 2007, 2008, 2009 and 2010, respectively.<br />
14. Income Taxes<br />
Income before income taxes for the years ended June 30, is summarized as follows:<br />
<strong>2005</strong> 2004 2003<br />
United States ............................................................................................... $ 19,252 $ 83,455 $ 11,472<br />
International ................................................................................................ 197,635 156,437 98,570<br />
Income before income taxes .................................................................... $ 216,887 $ 239,892 $ 110,042<br />
50
The components of income tax expense (benefit) for the year ended June 30, were as follows:<br />
<strong>2005</strong> 2004 2003<br />
Current:<br />
U.S. Federal ................................................................................................. $ (3,085) $ 2,187 $ 1,447<br />
State .............................................................................................................. (146) 3,063 (22)<br />
International ................................................................................................ 62,957 66,019 54,749<br />
Total currently payable .............................................................................. $ 59,726 $ 71,269 $ 56,174<br />
Deferred:<br />
U.S. Federal ................................................................................................. $ (1,422) $ (2,035) $ (26,525)<br />
State .............................................................................................................. (2,794) − −<br />
International ................................................................................................ 6,953 (5,663) (4,887)<br />
Total deferred.............................................................................................. 2,737 (7,698) (31,412)<br />
Total income tax expense.......................................................................... $ 62,463 $ 63,571 $ 24,762<br />
The Company’s effective tax rate differs from the U.S. Federal income tax rate for the years ended<br />
June 30, as follows:<br />
<strong>2005</strong> 2004 2003<br />
U.S. Federal income tax rate..................................................................... 35.0% 35.0% 35.0%<br />
Permanent tax exemptions........................................................................ (3.6) (4.3) (8.5)<br />
Repatriation of foreign earnings .............................................................. (4.1) (4.5) (8.7)<br />
Tax examinations and settlements........................................................... (1.2) (2.6) −<br />
Goodwill impairment................................................................................. 3.7 − −<br />
Valuation allowance ................................................................................... 3.2 3.0 9.1<br />
Correction of accruals for income tax exposures<br />
and other adjustments ............................................................................ (2.6) − −<br />
Adjustment for state deferred income taxes .......................................... (1.2) − −<br />
State income taxes, net of Federal tax benefit ....................................... (0.2) 1.3 (2.0)<br />
Foreign tax rates less than U.S. Federal rate (net)................................. (1.2) (1.5) (2.5)<br />
Other ............................................................................................................ 1.0 0.1 0.1<br />
Effective tax rate......................................................................................... 28.8% 26.5% 22.5%<br />
At June 30, <strong>2005</strong>, the Company had approximately $82,000 of non-U.S. net operating loss<br />
carryforwards and $3,000 of U.S. capital loss carryforwards. The capital loss carryforwards can be carried<br />
forward to offset future U.S. capital gains through the year ended June 30, 2007. The non-U.S. net operating<br />
losses can be carried forward indefinitely.<br />
Also at June 30, <strong>2005</strong>, the Company had approximately $27,000 of U.S. foreign tax credit<br />
carryforwards and $2,000 of U.S. research credit carryforwards. The U.S. foreign tax credit carryforwards<br />
will expire in future years through 2014. The U.S. research credit carryforwards will expire in future years<br />
through 2024.<br />
A valuation allowance is provided when it is more likely than not that some portion of the deferred<br />
tax asset will not be realized. As of June 30, <strong>2005</strong> and 2004, the Company has recorded valuation allowances<br />
of $28,700 and $23,076 respectively, against the non-U.S. net operating loss carryforwards.<br />
51
The components of net deferred tax assets and liabilities as of June 30 are as follows:<br />
<strong>2005</strong> 2004<br />
Deferred tax assets:<br />
Pension and other postretirement liabilities.............................................................. $ 25,408 $ 20,717<br />
Stock option and other benefits.................................................................................. 17,617 15,008<br />
Capitalized research and development....................................................................... 27,696 29,829<br />
Foreign tax credits ......................................................................................................... 26,538 29,048<br />
Net operating losses ...................................................................................................... 30,374 23,076<br />
Depreciation and amortization.................................................................................... 14,495 15,520<br />
Inventory......................................................................................................................... 11,013 13,096<br />
Minimum tax credit....................................................................................................... 16,806 10,950<br />
Allowance for doubtful accounts................................................................................ 3,873 4,755<br />
Other, net........................................................................................................................ 14,779 10,730<br />
Total deferred tax assets before valuation allowance .................................................. 188,599 172,729<br />
Valuation allowance....................................................................................................... (28,700) (23,076)<br />
Total deferred tax assets...................................................................................................<br />
Deferred tax liabilities:<br />
159,899 149,653<br />
Investments .................................................................................................................... (16,394) (9,863)<br />
Total net deferred tax assets ............................................................................................ $ 143,505 $ 139,790<br />
The net deferred tax amounts reported in the consolidated balance sheet as of June 30 are as follows:<br />
<strong>2005</strong> 2004<br />
Net deferred taxes:<br />
Current asset................................................................................................................... $ 16,518 $ 20,258<br />
Non-current asset .......................................................................................................... 126,987 119,532<br />
Total..................................................................................................................................... $ 143,505 $ 139,790<br />
The Company has not provided for U.S. deferred income taxes or foreign withholding taxes on<br />
$486,000 of undistributed earnings of certain of its non-U.S. subsidiaries as of June 30, <strong>2005</strong>. These earnings<br />
are intended to be permanently invested.<br />
The Company did not repatriate foreign earnings in fiscal <strong>2005</strong> under the one-time provision of the<br />
American Jobs Creation Act of 2004 (the Act), which reduces the federal income tax rate on dividends from<br />
non-U.S. subsidiaries. This provision is elective and applies to the Company in either fiscal <strong>2005</strong> or 2006.<br />
The Company will not repatriate foreign earnings under the Act in fiscal 2006.<br />
<strong>Molex</strong> has been granted favorable tax status and other incentives in Singapore and Malaysia, subject<br />
to certain conditions. The current Singapore grant is effective through March 2015; the Malaysia grant is<br />
effective through November 2007. <strong>Molex</strong> has also been granted various tax holidays in China, which are<br />
effective for various terms and subject to certain conditions. The impact of these grants was to decrease local<br />
country taxes by $7.8 million, $10.2 million and $5.7 million in <strong>2005</strong>, 2004 and 2003, respectively.<br />
15. Pension Plans<br />
Plan Overview and Assumptions<br />
The Company sponsors and/or contributes to pension plans, including defined benefit plans,<br />
covering substantially all U.S. plant hourly employees and certain employees in international subsidiaries. The<br />
benefits are primarily based on years of service and the employees’ compensation for certain periods during<br />
their last years of employment.<br />
The Company also provides discretionary savings and other defined contribution plans covering<br />
substantially all of its U.S. employees and certain employees in international subsidiaries. Employer<br />
52
contributions to these plans of $14,598, $13,590 and $16,491 were charged to operations during <strong>2005</strong>, 2004<br />
and 2003, respectively.<br />
The Company’s pension obligations are measured as of March 31 for the U.S. plan and as of June 30<br />
for the international plans. International plans are primarily in France, Germany, Ireland, Japan, Korea and<br />
Taiwan. The weighted-average assumptions used in the measurement of the projected benefit obligation<br />
(PBO) as of June 30 and pension expense for the years ended June 30 are as follows:<br />
<strong>2005</strong> 2004 2003<br />
U.S. Plan Int’l Plans U.S. Plan Int’l Plans U.S. Plan Int’l Plans<br />
PBO as of measurement date:<br />
Discount rate....................................................... 5.5% 3.4% 5.75% 3.6% 6.25% 3.1%<br />
Rate of compensation increase......................... 3.5% 3.0% 3.5% 3.6% 3.5% 2.9%<br />
Pension expense for the years ended June 30:<br />
Discount rate....................................................... 5.75% 3.6% 6.25% 3.1% 7.25% 3.6%<br />
Expected return on plan assets ........................ 8.5% 6.6% 8.5% 6.5% 9.0% 6.4%<br />
Rate of compensation increase......................... 3.5% 3.6% 3.5% 2.9% 4.0% 3.2%<br />
The discount rate is determined based on high-quality fixed income investments that match the<br />
duration of expected benefit payments. The Company has typically used the corporate AA/Aa bond rate for<br />
this assumption. The expected return on plan assets noted above represents a forward projection of the<br />
average rate of earnings expected on the pension assets. The Company has estimated this rate based on<br />
historical returns of similarly diversified portfolios. The rate of compensation increase represents the longterm<br />
assumption for expected increases to salaries for pay-related plans.<br />
Pension Expense<br />
The components of pension expense for the Company’s plans consist of the following for the years<br />
ended June 30:<br />
<strong>2005</strong> 2004 2003<br />
U.S. Plan Int’l Plans U.S. Plan Int’l Plans U.S. Plan Int’l Plans<br />
Service cost......................................................... $ 2,805 $ 5,329 $ 2,325 $ 5,007 $ 1,962 $ 4,107<br />
Interest cost........................................................ 2,080 2,953 1,828 2,085 1,613 1,960<br />
Expected return on plan assets ................... (2,892) (2,097) (2,225) (1,727) (1,661) (1,377)<br />
Amortization of prior service cost.................. 204 71 204 − 202 −<br />
Amortization of unrecognized<br />
transition obligation ...................................... − 4 − 59 − 57<br />
Recognized actuarial losses .............................. 399 529 375 1,170 − 286<br />
Other items......................................................... − 285 − 1,422 − −<br />
Pension expense ................................................ $ 2,596 $ 7,074 $ 2,507 $ 8,016 $ 2,116 $ 5,033<br />
53
Benefit Obligations and Plan Assets<br />
The following provides a reconciliation of the PBO, plan assets and funded status of the Company’s<br />
pension plans as of June 30:<br />
<strong>2005</strong> 2004<br />
U.S. Plan Int’l Plans U.S. Plan Int’l Plans<br />
Change in PBO:<br />
PBO at beginning of year........................................................................ $ 36,541 $ 77,492 $ 29,560 $ 66,494<br />
Service cost............................................................................................ 2,805 5,329 2,325 5,007<br />
Interest cost........................................................................................... 2,080 2,953 1,828 2,085<br />
Participant contributions..................................................................... − 302 − 198<br />
Effect of settlement ............................................................................. − − − 1,422<br />
Benefits paid.......................................................................................... (873) (2,625) (748) (5,347)<br />
Liability (gains) losses .......................................................................... 3,287 5,023 3,576 (744)<br />
New plans.............................................................................................. − 4,487 − 3,020<br />
Changes in foreign currency ............................................................... − (775) − 5,357<br />
PBO at end of year................................................................................... $ 43,840 $ 92,186 $ 36,541 $ 77,492<br />
Change in plan assets:<br />
Fair value of plan assets at beginning of year....................................... $ 34,399 $ 30,107 $ 29,065 $ 24,538<br />
Actual return on plan assets................................................................ 1,827 4,738 4,582 3,337<br />
Employer contributions ...................................................................... 3,000 2,503 1,500 4,209<br />
Participant contributions..................................................................... − 302 − 198<br />
Effect of settlement ............................................................................. − − − 1,422<br />
Benefits paid.......................................................................................... (873) (2,030) (748) (5,066)<br />
Changes in foreign currency ............................................................... − (192) − 1,469<br />
Fair value of plan assets at end of year.................................................. $ 38,353 $ 35,428 $ 34,399 $ 30,107<br />
Unfunded status........................................................................................ $ (5,487) $ (56,758) $ (2,142) $ (47,385)<br />
Unrecognized net transition liability...................................................... − 339 − 671<br />
Unrecognized net actuarial loss.............................................................. 11,878 20,301 7,924 18,701<br />
Unrecognized prior service cost............................................................. 143 − 347 −<br />
Net amount recognized........................................................................... $ 6,534 $ (36,118) $ 6,129 $ (28,013)<br />
Amounts recognized in the consolidated balance sheet<br />
consist of:<br />
Prepaid benefit cost ............................................................................. $ 6,534 $ 6,316 $ 6,129 $ 6,544<br />
Accrued benefit liability....................................................................... − (42,434) − (34,557)<br />
Net amount recognized........................................................................... $ 6,534 $ (36,118) $ 6,129 $ (28,013)<br />
The accumulated benefit obligation for the Company’s U.S. plan was $35,218 and $31,058 at June 30,<br />
<strong>2005</strong> and 2004, respectively, and $70,839 and $58,317 for the international plans at June 30, <strong>2005</strong> and 2004,<br />
respectively.<br />
The Company’s overall investment strategy for the assets in the pension funds is to achieve a balance<br />
between the goals of growing plan assets and keeping risks at a reasonable level over a long-term investment<br />
horizon. In order to reduce unnecessary risk, the pension funds are diversified across several asset classes<br />
with a focus on total return. The weighted-average asset allocations for the Company’s pension plans at June<br />
30 are as follows:<br />
<strong>2005</strong> 2004<br />
U.S. Plan Int’l Plans U.S. Plan Int’l Plans<br />
Asset allocation:<br />
Equity........................................................................................................ 63% 68% 62% 67%<br />
Bonds ........................................................................................................ 31% 27% 38% 28%<br />
Real estate and other............................................................................... 6% 5% N/A 5%<br />
The expected benefit payments from the Company’s pension plans are as follows: $3,463 in 2006;<br />
$4,547 in 2007; $5,053 in 2008; $4,556 in 2009; $4,853 in 2010 and $31,140 in 2011 to 2015. The Company<br />
expects to contribute $3,367 in fiscal 2006 to its pension plans.<br />
54
16. Other Postretirement Benefits<br />
Benefits Overview and Assumptions<br />
The Company has retiree health care plans that cover the majority of its U.S. employees. Employees<br />
hired before January 1, 1994 may become eligible for these benefits if they reach age 55, with age plus years<br />
of service equal to 70. Employees hired after January 1, 1994 may become eligible for these benefits if they<br />
reach age 60, with age plus years of service equal to 80. The cost of retiree health care is accrued over the<br />
period in which the employees become eligible for such benefits. The Company continues to fund benefit<br />
costs primarily as claims are paid. There are no significant postretirement health care benefit plans outside of<br />
the U.S.<br />
The Company measures its retiree health care benefit obligations as of March 31. The weightedaverage<br />
assumptions used to determine the accumulated postretirement benefit obligation (APBO) as of<br />
June 30 and benefit expense for the years ended June 30 are as follows:<br />
<strong>2005</strong> 2004 2003<br />
APBO as of June 30:<br />
Discount rate....................................................................................................... 5.5% 5.75% 6.25%<br />
Health care cost trend rate................................................................................ 10.0% 10.0% 10.0%<br />
Ultimate health care cost trend rate................................................................. 5.0% 5.0% 5.0%<br />
Years to ultimate rate......................................................................................... 2010 2009 2008<br />
Benefit expense for the years ended June 30:<br />
Discount rate....................................................................................................... 5.75% 6.25% 7.25%<br />
Health care cost trend rate................................................................................ 10.0% 10.0% 8.0%<br />
Ultimate health care cost trend rate................................................................. 5.0% 5.0% 5.0%<br />
Years to ultimate rate......................................................................................... 2009 2008 2007<br />
The health care cost trend rate assumption has a significant effect on the amount of the APBO and<br />
retiree health care benefit expense. A one-percentage point change in the assumed health care cost trend<br />
rates would have the following effects:<br />
<strong>2005</strong> 2004 2003<br />
Effect on total service and interest cost:<br />
Increase 100 basis points................................................................................... $ 1,073 $ 714 $ 407<br />
Decrease 100 basis points ................................................................................. (908) (600) (317)<br />
Effect on APBO:<br />
Increase 100 basis points................................................................................... $ 8,655 $ 6,277 $ 5,942<br />
Decrease 100 basis points ................................................................................. (7,325) (5,279) (4,654)<br />
Benefit Obligation and Expense<br />
The components of retiree health care benefit expense for the Company’s plans consist of the<br />
following for the years ended June 30:<br />
<strong>2005</strong> 2004 2003<br />
Service cost.......................................................................................................... $ 1,878 $ 1,868 $ 889<br />
Interest cost...................................................................................................... 1,884 1,920 1,071<br />
Amortization of prior service cost................................................................... (262) (262) (262)<br />
Recognized actuarial (gains) losses .................................................................. 635 727 (32)<br />
Other items.......................................................................................................... 773 − 766<br />
Retiree health care benefit expense ................................................................. $ 4,908 $ 4,253 $2,432<br />
55
The following provides a reconciliation of the APBO and the amounts included in the consolidated<br />
balance sheet as of June 30, for the Company’s postretirement benefit plans:<br />
<strong>2005</strong> 2004<br />
Change in APBO:<br />
APBO at beginning of year.............................................................................................. $ 33,212 $ 31,493<br />
Service cost ..................................................................................................................... 1,878 1,868<br />
Interest cost .................................................................................................................... 1,884 1,920<br />
Participant contributions .............................................................................................. 350 276<br />
Special termination benefits......................................................................................... 773 −<br />
Benefits paid................................................................................................................... (1,420) (1,222)<br />
Actuarial (gains) losses.................................................................................................. 7,401 (1,123)<br />
APBO at end of year......................................................................................................... $ 44,078 $ 33,212<br />
Items not yet recognized in the consolidated balance sheet:<br />
Unrecognized net actuarial loss....................................................................................... 19,675 12,909<br />
Unrecognized prior service cost ..................................................................................... (228) (490)<br />
Accrued benefit liability.................................................................................................... $ 24,631 $ 20,793<br />
The Medicare Prescription Drug Improvement and Modernization Act of 2003 (the Act) was<br />
enacted on December 8, 2003. The Act introduced a prescription drug benefit under Medicare (Medicare<br />
Part D), as well as a federal subsidy to sponsors of retiree health care benefit plans that provide a prescription<br />
drug benefit that is at least actuarially equivalent to Medicare Part D. <strong>Molex</strong> has determined that the benefits<br />
provided by its plan are actuarially equivalent to Medicare Part D. The Company elected to use the<br />
retroactive approach to reflect the federal subsidy that will be provided by the Medicare Act and accordingly<br />
remeasured plan liabilities and expense as of December 31, 2003. The impact of the remeasurement due to<br />
the subsidy was a reduction in the benefit obligation of $3,769 as of June 30, 2004 and a reduction in retiree<br />
health care benefit expense for the year ended June 30, 2004 of $175.<br />
The expected benefit payments for the Company’s postretirement benefit plans before the 28%<br />
subsidy are as follows: $1,363 in 2006; $1,578 in 2007; $1,716 in 2008; $1,810 in 2009; $1,899 in 2010 and<br />
$11,669 in 2011 to 2015. The expected 28% subsidy is as follows: $23 in 2006; $105 in 2007; $125 in 2008;<br />
$150 in 2009; $180 in 2010 and $1,420 in 2011 to 2015. The Company expects to contribute $1,340 in fiscal<br />
2006 to its postretirement benefit plans.<br />
17. Debt<br />
The Company had available lines of credit totaling $121,952 at June 30, <strong>2005</strong>, expiring between 2006<br />
and 2012. Long-term debt consists of the following as of June 30:<br />
<strong>2005</strong> 2004<br />
Mortgages ........................................................................................................................... $ 6,187 $ 6,048<br />
Bank loan ............................................................................................................................ 342 515<br />
Industrial development bonds......................................................................................... 4,350 4,331<br />
Other ................................................................................................................................... 200 253<br />
Total debt............................................................................................................................ 11,079 11,147<br />
Less current portion.......................................................................................................... 3,036 904<br />
Total long-term debt......................................................................................................... $ 8,043 $ 10,243<br />
Mortgages consist of four loans that are secured by certain buildings, carry an annual interest rate<br />
ranging from 4.25% to 7.79%, and require periodic principal payments through 2014. The Company has one<br />
bank loan with an annual interest rate of 4.5% payable in periodic installments through May 2007. Industrial<br />
development bonds, secured by certain land, buildings, and equipment, have annual interest rates ranging<br />
from 1.5% to 2.7%, with periodic principal payments through March 2011. The long-term debt as of June<br />
30, <strong>2005</strong> matures as follows: $3,036 in 2006; $1,096 in 2007; $991 in 2008; $1,021 in 2009; $1,079 in 2010;<br />
$3,268 in 2011 and $588 thereafter.<br />
56
18. Leases<br />
The Company rents certain facilities and equipment under lease arrangements classified as both<br />
capital and operating leases. Some of the leases have renewal options. Assets under capital leases consist<br />
primarily of data processing equipment. Future minimum lease payments are presented below:<br />
Capital Operating<br />
Year ending June 30: Leases Leases<br />
2006 ..................................................................................................................................... $ 2,971 $ 9,650<br />
2007 ..................................................................................................................................... 1,877 4,328<br />
2008 ..................................................................................................................................... 514 2,195<br />
2009 ..................................................................................................................................... 82 1,513<br />
2010 ..................................................................................................................................... 8 1,410<br />
2011 and thereafter ........................................................................................................... − 5,136<br />
Total lease payments......................................................................................................... $ 5,452 $24,232<br />
Less amount representing interest, at 6% to 9%.......................................................... 785<br />
Present value of minimum lease payments ................................................................... $ 4,667<br />
Current portion.................................................................................................................. $ 2,735<br />
Long-term portion ............................................................................................................ 1,932<br />
Present value of minimum lease payments ................................................................... $ 4,667<br />
Rental expense was $9,299, $5,390 and $3,066 in <strong>2005</strong>, 2004 and 2003, respectively.<br />
19. Commitments and Contingencies<br />
In the normal course of business, the Company is a party to various matters involving disputes and<br />
litigation. While it is not possible at this time to determine the ultimate outcome of these matters,<br />
management believes that the ultimate liability, if any, will not be material to the consolidated results of<br />
operations or financial condition of the Company.<br />
Between March 2, <strong>2005</strong> and April 22, <strong>2005</strong> seven separate complaints were filed, each purporting to<br />
be on behalf of a class of <strong>Molex</strong> shareholders, against <strong>Molex</strong>, and certain <strong>Molex</strong> officers and employees. The<br />
shareholder actions have been consolidated, and the consolidated amended complaint alleges, among other<br />
things, that during the period from July 27, 2004 to February 14, <strong>2005</strong> the named defendants made or caused<br />
to be made a series of materially false or misleading statements about <strong>Molex</strong>’s business, prospects,<br />
operations, and financial statements which constituted violations of securities laws and rules. As relief, the<br />
complaint seeks, among other things, declaration that the action be certified as a proper class action,<br />
unspecified compensatory damages (including interest) and payment of costs and expenses (including fees for<br />
legal counsel and experts). <strong>Molex</strong> intends to vigorously contest these actions.<br />
20. Capital Stock<br />
The shares of Common Stock, Class A Common Stock and Class B Common Stock are identical<br />
except as to voting rights. Class A Common Stock has no voting rights except in limited circumstances. So<br />
long as more than 50% of the authorized number of shares of Class B Common Stock continues to be<br />
outstanding, all matters submitted to a vote of the stockholders, other than the election of directors, must be<br />
approved by a majority of the Class B Common Stock, voting as a class, and by a majority of the Common<br />
Stock, voting as a class. During such period, holders of a majority of the Class B Common Stock could veto<br />
corporate action, other than the election of directors, which requires stockholder approval. There are 25<br />
million shares of preferred stock authorized, none of which were issued or outstanding during the three years<br />
ended June 30, <strong>2005</strong>.<br />
The Class B Common Stock can be converted into Common Stock on a share-for-share basis at any<br />
time at the option of the holder. The authorized Class A Common Stock would automatically convert into<br />
Common Stock on a share-for-share basis at the discretion of the Board of Directors upon the occurrence of<br />
57
certain events. Upon such conversion, the voting interests of the holders of Common Stock and Class B<br />
Common Stock would be diluted. The Company’s Class B Common Stock outstanding has remained at 94.3<br />
shares during the three years ended June 30, <strong>2005</strong>.<br />
The holders of the Common Stock, Class A Common Stock and Class B Common Stock participate<br />
equally, share-for-share, in any dividends that may be paid thereon if, as and when declared by the Board of<br />
Directors or in any assets available upon liquidation or dissolution of the Company.<br />
Changes in common stock for the years ended June 30 are as follows:<br />
Class A<br />
Common Stock Common Stock Treasury Stock<br />
Shares Amount Shares Amount Shares Amount<br />
Outstanding at June 30, 2002 ............................... 109,451 $ 5,473 103,008 $ 5,150 19,517 $ 362,479<br />
Exercise of stock options.................................. 662 33 377 19 8 645<br />
Purchase of treasury stock ................................ − − − − 3,353 74,997<br />
Issuance of stock awards................................... 11 − − − (82) (1,450)<br />
Other .................................................................... − − 5 − 35 563<br />
Outstanding at June 30, 2003 ............................... 110,124 $ 5,506 103,390 $ 5,169 22,831 $ 437,234<br />
Exercise of stock options.................................. 280 14 772 39 93 2,672<br />
Purchase of treasury stock ................................ − − − − 2,740 70,215<br />
Issuance of stock awards................................... 11 1 − − (73) (1,301)<br />
Other .................................................................... − − − − 10 341<br />
Outstanding at June 30, 2004 ............................... 110,415 $ 5,521 104,162 $ 5,208 25,601 $ 509,161<br />
Exercise of stock options.................................. 399 20 836 42 64 1,685<br />
Purchase of treasury stock ................................ − − − − 2,395 58,217<br />
Issuance of stock awards................................... − − − − (25) (553)<br />
Other .................................................................... − − − − 14 407<br />
Outstanding at June 30, <strong>2005</strong> ............................... 110,814 $ 5,541 104,998 $ 5,250 28,049 $ 568,917<br />
21. Other Comprehensive Income<br />
The components of accumulated other comprehensive income are as follows:<br />
<strong>2005</strong> 2004<br />
Foreign currency translation adjustments ..................................................................... $ 71,059 $ 66,381<br />
Unrealized gains on investments .................................................................................... 237 192<br />
Total..................................................................................................................................... $ 71,296 $ 66,573<br />
22. Stock Incentive Plans<br />
The Company has five stock incentive plans currently in effect, two of which may issue future<br />
grants: the 1990 Stock Option Plan (1990 Plan), the 1991 Incentive Stock Option Plan (1991 Plan), the 1998<br />
Stock Option Plan (1998 Plan), the 2000 Incentive Stock Option Plan (ISO Plan) and the 2000 Long-Term<br />
Stock Plan (LT Plan).<br />
1990 Plan: This plan expired as of June 30, 1999. The most significant terms of this plan provided<br />
that (a) options were authorized to be granted for 6.875 million shares of Common Stock and (b) the option<br />
price was 50% of the fair market value of the stock on the date of grant. The option term was five years to<br />
nine years from the date of grant.<br />
1991 Plan: This plan expired as of June 30, 2000. The most significant terms of this plan provided<br />
that (a) options were authorized to be granted for 3.8 million shares of Common Stock and (b) the option<br />
price was the fair market value of the stock on the date of grant. The option term was five years to 11 years<br />
from the date of grant.<br />
58
Stock option transactions relating to the 1990 and 1991 Plans are summarized as follows (exercise<br />
price represents a weighted-average):<br />
1990 Plan 1991 Plan<br />
Exercise Exercise<br />
Shares Price Shares Price<br />
Outstanding at June 30, 2002 ...................................................................... 1,372 $ 9.16 1,753 $20.30<br />
Exercised .................................................................................................... (650) 7.89 (11) 23.96<br />
Forfeited ..................................................................................................... (2) 12.36 (18) 28.13<br />
Outstanding at June 30, 2003 ...................................................................... 720 $10.31 1,724 $20.20<br />
Exercised .................................................................................................... (114) 7.07 (166) 19.93<br />
Forfeited ..................................................................................................... (18) 11.79 − −<br />
Outstanding at June 30, 2004 ...................................................................... 588 $10.91 1,558 $20.23<br />
Exercised .................................................................................................... (96) 9.92 (303) 13.42<br />
Forfeited ..................................................................................................... (4) 14.68 (7) 30.02<br />
Outstanding at June 30, <strong>2005</strong> ...................................................................... 488 $11.07 1,248 $21.83<br />
Options exercisable at June 30, <strong>2005</strong> ......................................................... 178 $ 9.92 226 $20.80<br />
1998 Plan: The most significant terms of this plan provide that (a) options may be granted for 12.5<br />
million shares of Class A Common Stock and (b) the option price shall be not less than 10% nor more than<br />
100% of the fair market value of the stock on the date of grant. The option term is five years to nine years<br />
from the date of grant. For options granted under this plan, the option price has been at 50% of the fair<br />
market value of the stock.<br />
ISO Plan: This plan expired as of June 30, <strong>2005</strong>. The most significant terms of this plan, available to<br />
executives and directors, provided that (a) options were authorized to be granted for 500,000 shares of Class<br />
A Common Stock and (b) the option price was the fair market value of the stock on the date of grant.<br />
The option term was four years to nine years from the date of grant. Under the ISO Plan, the options<br />
granted were either incentive or nonqualified. Unless specifically stated otherwise, all options granted were<br />
incentive.<br />
LT Plan: The most significant terms of this plan, available to executives and management, provide<br />
that (a) options may be granted for 3.0 million shares of Class A Common Stock and (b) the option price<br />
shall be the fair market value of the stock on the date of grant. The options vest over a four-year term with<br />
an expiration period of seven to 10 years from the date of grant.<br />
Stock option transactions relating to the 1998, ISO and LT Plans are summarized as follows<br />
(exercise price represents a weighted-average):<br />
1998 Plan ISO Plan LT Plan<br />
Exercise Exercise Exercise<br />
Shares Price Shares Price Shares Price<br />
Outstanding at June 30, 2002 ............................... 2,779 $12.12 126 $30.71 1,080 $30.14<br />
Granted................................................................ 1,298 9.67 58 21.57 1,204 21.12<br />
Exercised ............................................................. (327) 11.67 − − − −<br />
Forfeited .............................................................. (83) 11.68 − − − −<br />
Outstanding at June 30, 2003 ............................... 3,667 $11.30 184 $27.84 2,284 $25.38<br />
Granted................................................................ 993 12.66 59 26.47 1,032 25.99<br />
Exercised ............................................................. (612) 11.73 − − (41) 25.92<br />
Forfeited .............................................................. (168) 11.79 − − (38) 19.90<br />
Outstanding at June 30, 2004 ............................... 3,880 $11.56 243 $27.50 3,237 $25.71<br />
Granted................................................................ 1,004 11.51 103 24.89 1,149 24.58<br />
Exercised ............................................................. (685) 12.70 − − − −<br />
Forfeited .............................................................. (123) 11.48 − − − −<br />
Outstanding at June 30, <strong>2005</strong> ............................... 4,076 $11.36 346 $26.73 4,386 $23.28<br />
Options exercisable at June 30, <strong>2005</strong> .................. 915 $11.97 155 $28.96 1,755 $26.98<br />
59
The option price per share for certain options in the 1990 and 1998 plans was less than the fair<br />
market value at the date of grant, thus creating deferred unearned compensation. Deferred unearned<br />
compensation is expensed over the vesting period of the stock option and was $9,660, $10,306 and $10,503<br />
in <strong>2005</strong>, 2004 and 2003, respectively.<br />
The LT Plan also allows for the grant of stock awards to executives and management. The awards<br />
vest over a period of four years and are valued at fair market value at date of grant. Stock awards grants are<br />
summarized as follows:<br />
Grant Number of Total Vesting<br />
Grant Date: Price Shares Date Vested Compensation Period<br />
May <strong>2005</strong>.............................................................. $ 22.80 25 May 2009 $ 570 4 years<br />
August 2004......................................................... 25.51 4 Aug. 2008 94 4 years<br />
July 2004 .............................................................. 24.76 153 July 2008 3,772 4 years<br />
October 2003 ...................................................... 25.99 131 Oct. 2007 3,416 4 years<br />
June 2003 ............................................................. 23.62 118 June 2007 2,775 4 years<br />
July 2002 .............................................................. 19.90 164 July 2006 3,254 4 years<br />
July 2001 .............................................................. 27.10 96 July <strong>2005</strong> 2,610 4 years<br />
The total compensation expense is recorded as deferred unearned compensation and is expensed<br />
over the vesting period of the stock award and was $5,253, $3,542 and $2,304 in <strong>2005</strong>, 2004 and 2003,<br />
respectively.<br />
The following table provides additional information about options outstanding at June 30, <strong>2005</strong><br />
(exercise price represents a weighted-average):<br />
Outstanding Exercisable<br />
Remaining Exercise Exercise<br />
Range of Exercise Price Shares Years Price Shares Price<br />
Common:<br />
$2.56 to $11.80................................................ 457 0.9 $ 10.98 178 $ 9.90<br />
$11.84 to $18.94.............................................. 397 2.2 18.33 − −<br />
$20.80 to $20.80.............................................. 529 3.2 20.80 227 20.80<br />
$23.60 to $23.60.............................................. 78 3.0 23.60 − −<br />
$27.30 to $27.30.............................................. 275 5.1 27.30 − −<br />
Class A Common:<br />
$9.01 to $11.46................................................ 2,159 3.1 $ 8.46 187 $ 9.38<br />
$11.57 to $17.06.............................................. 1,887 3.0 12.58 705 12.44<br />
$17.25 to $24.76.............................................. 2,425 4.2 22.88 601 21.15<br />
$25.18 to $33.00.............................................. 2,318 5.0 28.10 1,317 29.58<br />
$36.30 to $38.19.............................................. 15 0.3 38.15 15 38.15<br />
10,540 3,230<br />
The estimated weighted-average fair values of options granted using the Black-Scholes option-<br />
pricing model and related assumptions were as follows:<br />
Weighted-average fair value of options granted: <strong>2005</strong> 2004 2003<br />
At fair value .................................................................................................... $ 7.25 $ 10.31 $ 7.79<br />
At less than fair value.................................................................................... $ 13.26 $ 12.95 $ 11.89<br />
Dividend yield.................................................................................................... 0.60% 0.40% 0.40%<br />
Expected volatility............................................................................................. 35.88% 44.48% 46.18%<br />
Risk-free interest rate........................................................................................ 3.26% 3.17% 4.48%<br />
Expected life of option (years)........................................................................ 3.98 4.52 3.65<br />
The Company’s directors are eligible to participate in The <strong>Molex</strong> Incorporated Deferred<br />
Compensation Plan and the newly adopted <strong>2005</strong> <strong>Molex</strong> Outside Directors’ Deferred Compensation Plan<br />
60
under which they may elect on a yearly basis to defer all or a portion of the following year’s compensation.<br />
A participant may elect to have the amount deferred (a) accrue interest during each calendar quarter at a rate<br />
equal to the average six month Treasury Bill rate in effect at the beginning of each calendar quarter, or (b)<br />
credited as stock “units” whereby each unit is equal to one share of Common Stock. The cumulative amount<br />
that is deferred for each participating director is subject to the claims of the general creditors of <strong>Molex</strong>.<br />
If a director elects to have his or her director fees deferred as stock units, the fees earned for a given<br />
quarter are converted to stock units at the closing price on the date of record for paying dividends. These<br />
stock units are then marked to market value at the end of each quarter. The liability associated with deferred<br />
director fees for credited stock “units” was $3,728 at June 30, <strong>2005</strong> and $3,903 at June 30, 2004.<br />
Upon termination of service as a director, the accumulated amount will be distributed in a lump sum.<br />
At the time of distribution, any stock units will be converted into cash by multiplying the number of units by<br />
the fair market value of the stock as of the payment date.<br />
23. Segment and Related Information<br />
The Company operates in one product segment: the manufacture and sale of electronic components.<br />
Revenue is recognized based on the location of the selling entity. Management operates the business through<br />
four regions. The Americas region consists primarily of operations in the U.S., Mexico and Brazil. The Far<br />
East North region includes Japan and Korea and a manufacturing operation in northern China. The Far East<br />
South region includes the rest of China, Singapore and the remaining countries in Asia. European operations<br />
are located in both Eastern and Western Europe. Revenue between regions is recorded at market-based<br />
prices. Information by region for the years ended June 30 is summarized in the following table:<br />
Far East Far East Corporate<br />
Americas North South Europe and Other Elims. Total<br />
<strong>2005</strong>:<br />
Customer revenue ........................ $ 701,470 $ 523,717 $ 769,218 $504,453 $ 49,794 $ − $2,548,652<br />
Intercompany revenue................. 184,528 324,294 127,454 44,902 111,153 (792,331) −<br />
Net revenue............................... $ 885,998 $ 848,011 $ 896,672 $549,355 $ 160,947 $ (792,331) $2,548,652<br />
Depreciation and amortization... $ 58,334 $ 84,093 $ 29,905 $ 42,512 $ 15,878 $ − $ 230,722<br />
Income tax expense...................... 17,106 51,677 15,640 (175) (21,785) − 62,463<br />
Net income.................................... 29,196 112,082 81,860 (18,835) (49,869) − 154,434<br />
Assets.............................................. 971,948 634,708 655,033 522,186 360,579 (416,782) 2,727,672<br />
Capital expenditures..................... 36,173 106,389 47,106 29,577 11,650 − 230,895<br />
2004:<br />
Customer revenue ........................ $ 686,129 $ 499,348 $ 623,619 $385,051 $ 52,568 $ − $2,246,715<br />
Intercompany revenue................. 178,692 237,843 100,620 39,684 96,624 (653,463) −<br />
Net revenue............................... $ 864,821 $ 737,191 $ 724,239 $424,735 $ 149,192 $ (653,463) $2,246,715<br />
Depreciation and amortization... $ 69,011 $ 80,607 $ 26,151 $ 36,170 $ 16,541 $ − $ 228,480<br />
Income tax expense...................... 29,761 34,771 5,221 1,680 (7,862) − 63,571<br />
Net income.................................... 55,754 80,875 75,353 (7,980) (28,052) − 175,950<br />
Assets.............................................. 848,035 633,258 524,515 516,404 323,754 (273,620) 2,572,346<br />
Capital expenditures..................... 30,880 80,105 33,304 33,049 12,386 − 189,724<br />
2003:<br />
Customer revenue ........................ $ 641,197 $ 407,821 $ 458,819 $ 291,043 $ 44,218 $ − $1,843,098<br />
Intercompany revenue................. 109,970 153,845 47,918 26,366 95,332 (433,431) −<br />
Net revenue............................... $ 751,167 $ 561,666 $ 506,737 $ 317,409 $ 139,550 $ (433,431) $1,843,098<br />
Depreciation and amortization... $ 78,154 $ 75,282 $ 22,467 $ 29,563 $ 23,264 $ − $ 228,730<br />
Income tax expense...................... 6,719 15,438 13,192 (1,192) (9,395) − 24,762<br />
Net income.................................... 20,500 40,080 62,192 (7,090) (30,764) − 84,918<br />
Assets.............................................. 894,446 489,509 456,620 445,440 221,313 (177,438) 2,329,890<br />
Capital expenditures..................... 37,937 62,538 27,902 24,359 18,457 − 171,193<br />
61
Corporate and Other assets include goodwill, intangible assets and investments. Corporate and<br />
Other net revenue includes revenue from operations that have not yet been assigned to a particular region.<br />
Customer revenue and net property, plant and equipment by significant foreign country within the<br />
Company’s regions are summarized as follows:<br />
<strong>2005</strong> 2004 2003<br />
Customer revenue:<br />
United States .............................................................................................................. $ 674,575 $ 664,954 $ 635,332<br />
Japan............................................................................................................................ 429,742 422,524 338,221<br />
China ........................................................................................................................... 495,926 404,380 276,791<br />
Net property, plant and equipment:<br />
United States .............................................................................................................. $ 301,140 $ 346,388 $ 388,210<br />
Japan............................................................................................................................ 251,429 266,499 252,922<br />
China ........................................................................................................................... 136,798 111,244 98,848<br />
During fiscal <strong>2005</strong>, 2004 and 2003, no customer accounted for more than 10% of consolidated net<br />
revenue.<br />
24. Quarterly Financial Information (Unaudited)<br />
The following is a condensed summary of the Company’s unaudited quarterly results of operations<br />
and quarterly stock price data for fiscal <strong>2005</strong>, 2004 and 2003:<br />
Quarter <strong>2005</strong> 2004 2003<br />
Net revenue 1st $640,230 $496,763 $469,246<br />
2nd 651,818 548,982 454,609<br />
3rd 612,842 569,153 443,177<br />
4th 643,762 631,817 476,066<br />
Gross profit 1st 225,282 168,024 159,039<br />
2nd 221,520 179,297 174,595<br />
3rd 211,408 202,267 144,940<br />
4th 215,134 227,158 129,126<br />
Income before income taxes 1st 72,239 43,978 39,515<br />
2nd 71,661 56,693 37,150<br />
3rd 61,403 62,366 32,737<br />
4th 11,584 76,855 640<br />
Income taxes (benefit) 1st 19,529 11,874 9,483<br />
2nd 19,355 15,314 8,916<br />
3rd 16,587 16,832 7,857<br />
4th 6,992 19,551 (1,494)<br />
Net income 1st 52,484 32,062 29,962<br />
2nd 52,246 41,216 28,188<br />
3rd 44,822 45,471 24,804<br />
4th 4,882 57,201 1,964<br />
Basic earnings per share 1st 0.28 0.17 0.16<br />
2nd 0.28 0.22 0.15<br />
3rd 0.24 0.24 0.13<br />
4th 0.03 0.30 0.01<br />
Diluted earnings per share 1st 0.28 0.17 0.15<br />
2nd 0.27 0.21 0.15<br />
3rd 0.24 0.24 0.13<br />
4th 0.03 0.30 0.01<br />
During the fourth quarter of fiscal <strong>2005</strong>, income from operations was impacted by a pre-tax charge<br />
of $27,875 relating to restructuring costs for employment reductions and facility closures (see Note 7). The<br />
Company also recorded pre-tax asset impairment charges of $25,169 (see Note 12). These combined charges<br />
reduced net income by $45,923, or $0.24 per share. The aggregate effect of corrections of errors recorded in<br />
62
the fourth fiscal quarter of <strong>2005</strong> increased gross profit by $1,383 and increased selling, general and<br />
administrative expenses by $1,382, and reduced equity income by $386, resulting in a decrease in pre-tax<br />
income of $385 and an increase in net income of $5,417 ($0.03 per share). See Note 4.<br />
The aggregate effect of corrections of errors recorded in the third fiscal quarter of <strong>2005</strong> reduced<br />
gross profit and pre-tax income by $2,013, resulting in an increase in net income of $1,299 or $0.01 per share<br />
in the quarter. See Note 4.<br />
The aggregate effect of corrections of errors recorded in the first fiscal quarter of <strong>2005</strong> reduced gross<br />
profit by $7,332 and increased selling, general and administrative expenses by $81, resulting in a reduction of<br />
pre-tax income of $7,413 ($4,818 after-tax or $0.03 per share in the quarter). See Note 4.<br />
During the fourth quarter of fiscal 2003, income from operations was impacted by a pre-tax charge<br />
of $35,030 relating to employment reductions and write-off of manufacturing assets. This charge and a pretax<br />
investment write-down of $5,089 reduced net income by $28,577 (net of tax benefit of $11,539).<br />
63
REPORT OF INDEPENDENT REGISTERED PUBLIC ACCOUNTING FIRM<br />
The Board of Directors and Stockholders, <strong>Molex</strong> Incorporated<br />
We have audited the accompanying consolidated balance sheets of <strong>Molex</strong> Incorporated as of June<br />
30, <strong>2005</strong> and 2004, and the related consolidated statements of income, stockholders’ equity, and cash flows<br />
for each of the three years in the period ended June 30, <strong>2005</strong>. Our audits also included the financial<br />
statement schedule listed in the Index at Part IV, Item 15. These financial statements and schedule are the<br />
responsibility of the Company’s management. Our responsibility is to express an opinion on these financial<br />
statements and schedule based on our audits.<br />
We conducted our audits in accordance with the standards of the Public Company Accounting<br />
Oversight Board (United States). Those standards require that we plan and perform the audit to obtain<br />
reasonable assurance about whether the financial statements are free of material misstatement. An audit<br />
includes examining, on a test basis, evidence supporting the amounts and disclosures in the financial<br />
statements. An audit also includes assessing the accounting principles used and significant estimates made by<br />
management, as well as evaluating the overall financial statement presentation. We believe that our audits<br />
provide a reasonable basis for our opinion.<br />
In our opinion, the consolidated financial statements referred to above present fairly, in all material<br />
respects, the consolidated financial position of <strong>Molex</strong> Incorporated at June 30, <strong>2005</strong> and 2004, and the<br />
consolidated results of its operations and its cash flows for each of the three years in the period ended June<br />
30, <strong>2005</strong>, in conformity with U.S. generally accepted accounting principles. Also, in our opinion, the related<br />
financial statement schedule, when considered in relation to the basic financial statements taken as a whole,<br />
presents fairly in all material respects the information set forth therein.<br />
We also have audited, in accordance with the standards of the Public Company Accounting<br />
Oversight Board (United States), the effectiveness of <strong>Molex</strong> Incorporated’s internal control over financial<br />
reporting as of June 30, <strong>2005</strong>, based on criteria established in Internal Control—Integrated Framework issued<br />
by the Committee of Sponsoring Organizations of the Treadway Commission and our report<br />
dated September 7, <strong>2005</strong> expressed an unqualified opinion thereon.<br />
/s/ ERNST & YOUNG LLP<br />
Chicago, Illinois<br />
September 7, <strong>2005</strong><br />
64
REPORT OF INDEPENDENT REGISTERED PUBLIC ACCOUNTING FIRM ON<br />
INTERNAL CONTROL OVER FINANCIAL REPORTING<br />
The Board of Directors and Stockholders, <strong>Molex</strong> Incorporated<br />
We have audited management’s assessment, included in the accompanying Management Report on<br />
Internal Control Over Financial Reporting, that <strong>Molex</strong> Incorporated maintained effective internal control<br />
over financial reporting as of June 30, <strong>2005</strong>, based on criteria established in Internal Control—Integrated<br />
Framework issued by the Committee of Sponsoring Organizations of the Treadway Commission (the COSO<br />
criteria). <strong>Molex</strong> Incorporated’s management is responsible for maintaining effective internal control over<br />
financial reporting and for its assessment of the effectiveness of internal control over financial reporting.<br />
Our responsibility is to express an opinion on management’s assessment and an opinion on the effectiveness<br />
of the company’s internal control over financial reporting based on our audit.<br />
We conducted our audit in accordance with the standards of the Public Company Accounting<br />
Oversight Board (United States). Those standards require that we plan and perform the audit to obtain<br />
reasonable assurance about whether effective internal control over financial reporting was maintained in all<br />
material respects. Our audit included obtaining an understanding of internal control over financial reporting,<br />
evaluating management’s assessment, testing and evaluating the design and operating effectiveness of internal<br />
control, and performing such other procedures as we considered necessary in the circumstances. We believe<br />
that our audit provides a reasonable basis for our opinion.<br />
A company’s internal control over financial reporting is a process designed to provide reasonable<br />
assurance regarding the reliability of financial reporting and the preparation of financial statements for<br />
external purposes in accordance with generally accepted accounting principles. A company’s internal control<br />
over financial reporting includes those policies and procedures that (1) pertain to the maintenance of records<br />
that, in reasonable detail, accurately and fairly reflect the transactions and dispositions of the assets of the<br />
company; (2) provide reasonable assurance that transactions are recorded as necessary to permit preparation<br />
of financial statements in accordance with generally accepted accounting principles, and that receipts and<br />
expenditures of the company are being made only in accordance with authorizations of management and<br />
directors of the company; and (3) provide reasonable assurance regarding prevention or timely detection of<br />
unauthorized acquisition, use, or disposition of the company’s assets that could have a material effect on the<br />
financial statements.<br />
Because of its inherent limitations, internal control over financial reporting may not prevent or<br />
detect misstatements. Also, projections of any evaluation of effectiveness to future periods are subject to the<br />
risk that controls may become inadequate because of changes in conditions, or that the degree of compliance<br />
with the policies or procedures may deteriorate.<br />
In our opinion, management’s assessment that <strong>Molex</strong> Incorporated maintained effective internal<br />
control over financial reporting as of June 30, <strong>2005</strong>, is fairly stated, in all material respects, based on the<br />
COSO criteria. Also, in our opinion, <strong>Molex</strong> Incorporated maintained, in all material respects, effective<br />
internal control over financial reporting as of June 30, <strong>2005</strong>, based on the COSO criteria.<br />
We also have audited, in accordance with the standards of the Public Company Accounting<br />
Oversight Board (United States), the <strong>2005</strong> consolidated financial statements of <strong>Molex</strong> Incorporated and our<br />
report dated September 7, <strong>2005</strong> expressed an unqualified opinion thereon.<br />
/s/ ERNST & YOUNG LLP<br />
Chicago, Illinois<br />
September 7, <strong>2005</strong><br />
65
Item 9. Changes in and Disagreements with Accountants on Accounting and Financial<br />
Disclosure<br />
The Audit Committee of <strong>Molex</strong>'s Board of Directors engaged Ernst & Young LLP to serve as the<br />
Company's independent registered public accounting firm as of December 9, 2004. Deloitte & Touche LLP,<br />
<strong>Molex</strong>'s former independent registered public accounting firm, resigned on November 13, 2004.<br />
Incorporated herein by reference is Item 4.01 from the Current Report on Form 8-K (Form 8-K) and Item<br />
4.01 from the Form 8-K/A, including the letter of Deloitte & Touche LLP filed as Exhibit 16.1 thereto (8-K<br />
Amendment), filed by <strong>Molex</strong> with the Securities and Exchange Commission on November 18, 2004 and<br />
December 1, 2004, respectively, in connection with the change in the Company's independent auditor as<br />
required by Item 304(a) of Regulation S-K. There were no changes in or disagreements with accountants on<br />
accounting and financial disclosure requiring disclosure pursuant to Item 304(b) of Regulation S-K.<br />
Item 9A. Controls and Procedures<br />
Attached as exhibits to this Form 10-K are certifications of <strong>Molex</strong>’s Chief Executive Officer (CEO)<br />
and Chief Financial Officer (CFO), which are required in accordance with Rule 13a-14 under the Securities<br />
Exchange Act of 1934, as amended (the Exchange Act). This “Controls and Procedures” section includes<br />
information concerning the controls and controls evaluation referred to in the certifications. Immediately<br />
preceding Part II, Item 9 of this Form 10-K is the report of Ernst & Young LLP, <strong>Molex</strong>’s independent<br />
registered public accounting firm, regarding its audit of <strong>Molex</strong>’s internal control over financial reporting and<br />
of management’s assessment of internal control over financial reporting set forth below in this section. This<br />
section should be read in conjunction with the certifications and the Ernst & Young report for a more<br />
complete understanding of the topics presented.<br />
Evaluation of Disclosure Controls and Procedures<br />
Management conducted an evaluation of the effectiveness of the design and operation of the<br />
Company’s disclosure controls and procedures (Disclosure Controls) as of the end of the period covered by<br />
this Form 10-K. The controls evaluation was conducted under the supervision and with the participation of<br />
management, including <strong>Molex</strong>’s CEO and CFO. Disclosure Controls are controls and procedures designed<br />
to reasonably assure that information required to be disclosed in the Company’s reports filed under the<br />
Exchange Act, such as this Form 10-K, is recorded, processed, summarized and reported within the time<br />
periods specified in the U.S. Securities and Exchange Commission’s (SEC’s) rules and forms. Disclosure<br />
Controls are also designed to reasonably assure that such information is accumulated and communicated to<br />
management, including the CEO and CFO, as appropriate to allow timely decisions regarding required<br />
disclosure. <strong>Molex</strong>’s quarterly evaluation of Disclosure Controls includes an evaluation of some components<br />
of its internal control over financial reporting, and internal control over financial reporting is also separately<br />
evaluated on an annual basis for purposes of providing the management report, which is set forth below.<br />
The evaluation of <strong>Molex</strong>’s Disclosure Controls included a review of the controls’ objectives and<br />
design, the Company’s implementation of the controls and the effect of the controls on the information<br />
generated for use in this Form 10-K. In the course of the controls evaluation, management reviews<br />
identified data errors, control problems or acts of fraud, if any, and seeks to confirm that appropriate<br />
corrective actions, including process improvements, were being undertaken. This type of evaluation is<br />
performed on a quarterly basis so that the conclusions of management, including the CEO and CFO,<br />
concerning the effectiveness of the Disclosure Controls can be reported in <strong>Molex</strong>’s periodic reports on Form<br />
10-Q and Form 10-K. Many of the components of the Company’s Disclosure Controls are also evaluated on<br />
an ongoing basis by <strong>Molex</strong>’s Internal Audit Department and by other personnel in the Finance organization.<br />
The overall goals of these various evaluation activities are to monitor the Company’s Disclosure Controls,<br />
and to modify them as necessary. <strong>Molex</strong>’s intent is to maintain the Disclosure Controls as dynamic systems<br />
that change as conditions warrant.<br />
During fiscal <strong>2005</strong>, <strong>Molex</strong>’s management identified a number of errors (described in Note 4 of the<br />
“Notes to Consolidated Financial Statements” in this Form 10-K) with respect to which remedial action was<br />
taken. Disclosure regarding these matters as well as the remedial action taken by the Company was included<br />
in the Controls and Procedures disclosures included in Part I, Item 4 of the Company’s Form 10-Q/A for the<br />
66
first fiscal quarter filed on March 21, <strong>2005</strong>, the Form 10-Q for the second fiscal quarter filed on March<br />
21, <strong>2005</strong> and in the Form 10-Q for the third fiscal quarter filed on May 10, <strong>2005</strong>.<br />
<strong>Molex</strong>’s management analyzed the materiality of the effect of these changes made during the period<br />
covered by the report on <strong>Molex</strong>’s internal control over financial reporting by considering the effect in light of<br />
the materiality standards provided by the relevant case law in accordance with guidance issued by the staff of<br />
the SEC. Management took into consideration that even well designed controls operating as designed cannot<br />
provide absolute assurance and that internal control over financial reporting has inherent limitations because<br />
the process is subject to human error resulting from lapses in judgment and breakdowns resulting from<br />
human failure. Management also considered <strong>Molex</strong>’s response subsequent to discovery of the deficiencies,<br />
including the promptness with which the underlying deficiencies were brought to the attention of the Audit<br />
Committee and the scrutiny under which <strong>Molex</strong>’s internal control environment was reviewed. Additionally,<br />
management considered the fact that many of these deficiencies were identified by management and not by<br />
<strong>Molex</strong>'s independent public accountant. Management also considered the materiality of the recorded<br />
adjustments on <strong>Molex</strong>'s results of operations and earnings trends for fiscal year <strong>2005</strong>. The matters described<br />
above have been discussed with <strong>Molex</strong>’s Audit Committee and independent public accountant.<br />
Based upon the controls evaluation, <strong>Molex</strong>’s CEO and CFO have concluded that, as of the end of<br />
the period covered by this report, the Company’s Disclosure Controls were effective to provide reasonable<br />
assurance that information required to be disclosed in the Company’s Exchange Act reports is recorded,<br />
processed, summarized and reported within the time periods specified by the SEC, and that material<br />
information relating to <strong>Molex</strong> and its consolidated subsidiaries is made known to management, including the<br />
CEO and CFO, during the period when the Company’s periodic reports are being prepared.<br />
Management’s Report on Internal Control Over Financial Reporting<br />
<strong>Molex</strong> management is responsible for establishing and maintaining an adequate system of internal<br />
control over financial reporting as required by the Sarbanes-Oxley Act of 2002 and as defined in Exchange<br />
Act Rule 13a-15(f). A control system can provide only reasonable, not absolute, assurance that the objectives<br />
of the control system are met.<br />
Under management’s supervision, an evaluation of the design and effectiveness of <strong>Molex</strong>’s internal<br />
control over financial reporting was conducted based on the framework in Internal Control—Integrated<br />
Framework issued by the Committee of Sponsoring Organizations of the Treadway Commission (COSO).<br />
Based on this evaluation, management concluded that <strong>Molex</strong>’s internal control over financial reporting was<br />
effective as of June 30, <strong>2005</strong>.<br />
Ernst & Young LLP, an independent registered public accounting firm, as auditors of <strong>Molex</strong><br />
Incorporated’s financial statements, has issued an attestation report on management’s assessment of the<br />
effectiveness of <strong>Molex</strong>’s internal control over financial reporting as of June 30, <strong>2005</strong>. Ernst & Young LLP’s<br />
report, which expresses unqualified opinions on management’s assessment and on the effectiveness of<br />
<strong>Molex</strong>’s internal control over financial reporting, is included herein.<br />
Changes in Internal Control over Financial Reporting<br />
There were no changes in the Company’s internal control over financial reporting that occurred<br />
during the Company’s most recently completed fiscal quarter that have materially affected, or are reasonably<br />
likely to materially affect, the Company’s internal control over financial reporting.<br />
Inherent Limitations on Effectiveness of Controls<br />
The Company’s management, including the CEO and CFO, does not expect that its Disclosure<br />
Controls or its internal control over financial reporting will prevent or detect all error and all fraud. A<br />
control system, no matter how well designed and operated, can provide only reasonable, not absolute,<br />
assurance that the control system’s objectives will be met. The design of a control system must reflect the<br />
fact that there are resource constraints, and the benefits of controls must be considered relative to their costs.<br />
Further, because of the inherent limitations in all control systems, no evaluation of controls can provide<br />
67
absolute assurance that misstatements due to error or fraud will not occur or that all control issues and<br />
instances of fraud, if any, within the Company have been detected. These inherent limitations include the<br />
realities that judgments in decision-making can be faulty and that breakdowns can occur because of simple<br />
error or mistake. Controls can also be circumvented by the individual acts of some persons, by collusion of<br />
two or more people, or by management override of the controls. The design of any system of controls is<br />
based in part on certain assumptions about the likelihood of future events, and there can be no assurance<br />
that any design will succeed in achieving its stated goals under all potential future conditions. Projections of<br />
any evaluation of controls effectiveness to future periods are subject to risks. Over time, controls may<br />
become inadequate because of changes in conditions or deterioration in the degree of compliance with<br />
policies or procedures.<br />
ITEM 9B. Other Information<br />
None.<br />
PART III<br />
Item 10. Directors and Executive Officers of the Registrant<br />
The information under the captions “Information About Corporate Governance and the Board of<br />
Directors,” “Election of Directors” and “Section 16(a) Beneficial Ownership Reporting Compliance” in the<br />
Company’s Proxy Statement for the Annual Meeting of Stockholders to be held on October 28, <strong>2005</strong> is<br />
incorporated herein by reference. The information called for by Item 401 of Regulation S-K relating to the<br />
Executive Officers is furnished in Part I, Item 1 of this Form 10-K and is also incorporated by reference in<br />
this section.<br />
Item 11. Executive Compensation<br />
The information under the captions “Information About Compensation and Executive Officer<br />
Transactions” and “Information About Corporate Governance and the Board of Directors – Directors’<br />
Compensation” in the Company’s <strong>2005</strong> Proxy Statement is incorporated herein by reference.<br />
Item 12. Security Ownership of Certain Beneficial Owners and Management and Related<br />
Stockholder Matters<br />
The information under the captions “Security Ownership of Directors, Management and Certain<br />
Beneficial Owners” and “Equity Compensation Plan Information” in the Company’s <strong>2005</strong> Proxy Statement is<br />
incorporated herein by reference.<br />
Item 13. Certain Relationships and Related Transactions<br />
The information under the captions “Election of Directors,” “Information About Compensation<br />
and Executive Officer Transactions” and “Security Ownership of Directors, Management and Certain<br />
Beneficial Owners” in the Company’s <strong>2005</strong> Proxy Statement is herein incorporated by reference.<br />
Item 14. Principal Accountant Fees and Services<br />
The information under the caption “Independent Auditor’s Fees” in the Company’s <strong>2005</strong> Proxy<br />
Statement is herein incorporated by reference.<br />
68
PART IV<br />
Item 15. Exhibits and Financial Statement Schedules<br />
1. Financial Statements: See Item 8.<br />
2. Financial Statement Schedule: See Schedule II - Valuation and Qualifying Accounts.<br />
All other schedules are omitted because they are inapplicable, not required under the instructions,<br />
or the information is included in the consolidated financial statements or notes thereto.<br />
Separate financial statements for the Company’s unconsolidated affiliated companies, accounted<br />
for by the equity method, have been omitted because they do not constitute significant subsidiaries.<br />
3. Exhibits: Exhibits listed on the accompanying Index to Exhibits are filed or incorporated herein as part<br />
of this annual report on Form 10-K.<br />
69
<strong>Molex</strong> Incorporated<br />
Schedule II - Valuation and Qualifying Accounts<br />
For the Years Ended June 30, <strong>2005</strong>, 2004, and 2003<br />
(in thousands)<br />
Balance at Other/ Balance at<br />
Beginning Charges Currency End<br />
of Period to Income Write-Offs Translation of Period<br />
Receivable Reserves:<br />
Year ended <strong>2005</strong> .................................... $ 22,901 $ 51,126 $ (49,730) $ (4,004) $ 20,293<br />
Year ended 2004..................................... $ 18,404 $ 50,731 $ (48,594) $ 2,360 $ 22,901<br />
Year ended 2003..................................... $ 18,692 $ 46,561 $ (47,363) $ 514 $ 18,404<br />
Inventory Reserves:<br />
Year ended <strong>2005</strong>:<br />
Slow and Excess ..................................... $ 34,900 $ 11,531 $ (15,732) $ (1,188) $ 29,511<br />
Blocked Stock ......................................... 2,114 (488) − − 1,626<br />
Other ........................................................ 4,313 (1,252) − − 3,061<br />
Total.......................................................... $ 41,327 $ 9,791 $ (15,732) $ (1,188) $ 34,198<br />
Year ended 2004:<br />
Slow and Excess ..................................... $ 35,802 $ 9,523 $ (12,149) $ 1,724 $ 34,900<br />
Blocked Stock ......................................... 1,858 256 − − 2,114<br />
Other ........................................................ 2,726 1,587 − − 4,313<br />
Total.......................................................... $ 40,386 $ 11,366 $ (12,149) $ 1,724 $ 41,327<br />
Year ended 2003:<br />
Slow and Excess ..................................... $ 40,016 $ 12,638 $ (18,597) $ 1,745 $ 35,802<br />
Blocked Stock ......................................... 1,969 (111) − − 1,858<br />
Other ........................................................ 4,932 (2,206) − − 2,726<br />
Total.......................................................... $ 46,917 $ 10,321 $ (18,597) $ 1,745 $ 40,386<br />
Deferred tax asset valuation allowance:<br />
Year ended <strong>2005</strong> .................................... $ 23,076 $ 6,849 $ (1,225) − $ 28,700<br />
Year ended 2004..................................... $ 15,794 $ 7,282 − − $ 23,076<br />
Year ended 2003..................................... $ 8,418 $ 7,376 − − $ 15,794<br />
70
<strong>Molex</strong> Incorporated<br />
Index of Exhibits<br />
Exhibit<br />
Number Description<br />
3 3.1 Certificate of Incorporation (as amended and restated)<br />
(incorporated by reference to 2000 Form 10-K, Exhibit 3.1)<br />
3.2 By-laws (as amended and restated)<br />
(incorporated by reference to 2000 Form 10-K, Exhibit 3.2)<br />
4 Instruments defining rights of security holders including indentures. See Exhibit 3.1<br />
10 Material Contracts<br />
10.1 The <strong>Molex</strong> Deferred Compensation Plan (incorporated by reference to 1984<br />
Form 10-K, Exhibit 10.6) *<br />
10.2 The 1990 <strong>Molex</strong> Incorporated Executive Stock Bonus Plan (as amended)<br />
(incorporated by reference to 1998 Form 10-K, Exhibit 10.2) *<br />
10.3 The 1990 <strong>Molex</strong> Incorporated Stock Option Plan (as amended)<br />
(incorporated by reference to 1998 Form 10-K, Exhibit 10.3) *<br />
10.4 The 1991 <strong>Molex</strong> Incorporated Incentive Stock Option Plan (as amended)<br />
(incorporated by reference to 1999 Form 10-K, Exhibit 10.4) *<br />
10.5 The 1998 <strong>Molex</strong> Incorporated Stock Option Plan<br />
(incorporated by reference to 1999 Form 10-K, Exhibit 10.5) *<br />
10.6 The 2000 <strong>Molex</strong> Incorporated Incentive Stock Option Plan<br />
(incorporated by reference to 2001 Form 10-K, Exhibit 10.6) *<br />
10.7 Form of Stock Option Agreement under the 2000 <strong>Molex</strong> Incorporated Incentive<br />
Stock Option Plan (incorporated by reference to Exhibit 10.9 to the Form 10-Q for<br />
the fiscal quarter ended March 31, <strong>2005</strong>) *<br />
10.8 The 2000 <strong>Molex</strong> Incorporated Executive Stock Bonus Plan (as amended)<br />
(incorporated by reference to 2001 Form 10-K, Exhibit 10.7) *<br />
10.9 The 2000 <strong>Molex</strong> Incorporated Long-Term Stock Plan (incorporated by reference to<br />
2001 Form 10-K, Exhibit 10.8) *<br />
10.10 Form of Option/Stock Award Agreement under the 2000 <strong>Molex</strong> Incorporated Long-<br />
Term Stock Plan (incorporated by reference to Exhibit 10.10 to the Form 10-Q for<br />
the fiscal quarter ended March 31, <strong>2005</strong>) *<br />
10.11 Supplemental Executive Retirement Plan (incorporated by reference to Exhibit 99.4<br />
to the Form 8-K filed on August 2, <strong>2005</strong>) *<br />
10.12 <strong>Molex</strong> Outside Directors' Deferred Compensation Plan (incorporated by reference to<br />
Exhibit 99.5 to the Form 8-K filed on August 2, <strong>2005</strong>) *<br />
10.13 Amended and Restated <strong>Molex</strong>-Japan Directors' and Executive Officers' Retirement<br />
Trust (incorporated by reference to Exhibit 99.2 to the Form 8-K filed on June 7,<br />
<strong>2005</strong>) *<br />
71
10.14 <strong>Molex</strong> Cash Merit Bonus Plan (incorporated by reference to Exhibit 99.1 to the Form<br />
8-K filed on September 8, <strong>2005</strong>) *<br />
10.15 Form of memoranda with respect to bonus incentive arrangements (incorporated by<br />
reference to Exhibit 10.11 to the Form 10-Q for the fiscal quarter ended March 31,<br />
<strong>2005</strong>) *<br />
10.16 Summary of Officer Relocation and Expatriate assignment arrangements<br />
(incorporated by reference to Exhibit 10.15 to the Form 10-Q for the fiscal quarter<br />
ended March 31, <strong>2005</strong>) *<br />
10.17 Deferred Compensation Agreement between <strong>Molex</strong> Incorporated and F.A. Krehbiel<br />
(incorporated by reference to Exhibit 10.12 to the Form 10-Q for the fiscal quarter<br />
ended March 31, <strong>2005</strong>) *<br />
10.18 Deferred Compensation Agreement between <strong>Molex</strong> Incorporated and J.H. Krehbiel,<br />
Jr. (incorporated by reference to Exhibit 10.13 to the Form 10-Q for the fiscal<br />
quarter ended March 31, <strong>2005</strong>) *<br />
10.19 Summary of Arrangement with Goro Tokuyama (incorporated by reference to<br />
Exhibit 99.3 to the Form 8-K filed on August 2, <strong>2005</strong>) *<br />
10.20 Employment offer letter from <strong>Molex</strong> Incorporated to David D. Johnson<br />
(incorporated by reference to Exhibit 10.18 to the Form 10-Q for the fiscal quarter<br />
ended March 31, <strong>2005</strong>) *<br />
10.21 Summary of Arrangements with Certain Executives (incorporated by reference to<br />
Exhibit 10.16 to the Form 10-Q for the fiscal quarter ended March 31, <strong>2005</strong>) *<br />
10.22 Summary of Non-Employee Director Compensation (incorporated by reference to<br />
Exhibit 99.1 to the Form 8-K filed on July 6, <strong>2005</strong>) *<br />
10.23 Schedule with respect to Officer Compensation (incorporated by reference to Exhibit<br />
99.1 to the Form 8-K filed on June 7, <strong>2005</strong>) *<br />
10.24 Schedule with respect to Officer Compensation (incorporated by reference to Exhibit<br />
99.1 to the Form 8-K filed on August 2, <strong>2005</strong>) *<br />
16 Letter re Change in Certifying Accountant (incorporated by reference to Exhibit 99.1 to the<br />
Form 8-K/A filed on December 1, 2004)<br />
21 Subsidiaries of registrant<br />
23 Independent Auditors’ Consent<br />
31 Rule 13a-14(a)/15d-14(a) Certifications<br />
31.1 Section 302 certification by Chief Executive Officer<br />
31.2 Section 302 certification by Chief Financial Officer<br />
32 Section 1350 Certifications<br />
32.1 Section 906 certification by Chief Executive Officer and Chief Financial Officer<br />
(All other exhibits are either inapplicable or not required.)<br />
* This exhibit is a management contract or compensatory plan or arrangement.<br />
72
Signatures<br />
Pursuant to the requirements of Section 13 or 15 (d) of the Securities Exchange Act of 1934, the Company<br />
has duly caused this Annual Report to be signed on its behalf by the undersigned, there unto duly authorized.<br />
September 12, <strong>2005</strong><br />
Vice President, Treasurer and<br />
Chief Financial Officer (Principal Financial<br />
Officer and Principal Accounting Officer)<br />
73<br />
MOLEX INCORPORATED<br />
(Company)<br />
By: / S/ DAVID D. JOHNSON<br />
David D. Johnson<br />
Pursuant to the requirements of the Securities Exchange Act of 1934, this report has been signed below by<br />
the following persons on behalf of the registrant and in the capacities and on the dates indicated.<br />
September 12, <strong>2005</strong><br />
September 12, <strong>2005</strong><br />
September 12, <strong>2005</strong><br />
September 12, <strong>2005</strong><br />
September 12, <strong>2005</strong><br />
September 12, <strong>2005</strong><br />
September 12, <strong>2005</strong><br />
September 12, <strong>2005</strong><br />
September 12, <strong>2005</strong><br />
September 12, <strong>2005</strong><br />
September 12, <strong>2005</strong><br />
September 12, <strong>2005</strong><br />
September 12, <strong>2005</strong><br />
September 12, <strong>2005</strong><br />
Co-Chairman of the Board<br />
Co-Chairman of the Board<br />
Vice Chairman of the Board and Chief<br />
Executive Officer (Principal Executive Officer)<br />
Vice President, Treasurer and<br />
Chief Financial Officer (Principal Financial<br />
Officer and Principal Accounting Officer)<br />
Director<br />
Director<br />
Director<br />
Director<br />
Director<br />
Director<br />
Director<br />
Director<br />
Director<br />
Director<br />
/S/ FREDERICK A. KREHBIEL<br />
Frederick A. Krehbiel<br />
/S/ JOHN H. KREHBIEL, JR.<br />
John H. Krehbiel, Jr.<br />
/S/ MARTIN P. SLARK<br />
Martin P. Slark<br />
/S/ DAVID D. JOHNSON<br />
David D. Johnson<br />
/S/ FRED L. KREHBIEL<br />
Fred L. Krehbiel<br />
/S/ MICHAEL J. BIRCK<br />
Michael J. Birck<br />
/S/ DOUGLAS K. CARNAHAN<br />
Douglas K. Carnahan<br />
/S/ MICHELLE L. COLLINS<br />
Michelle L. Collins<br />
/S/ EDGAR D. JANNOTTA<br />
Edgar D. Jannotta<br />
/S/ DAVID L. LANDSITTEL<br />
David L. Landsittel<br />
/S/ JOE W. LAYMON<br />
Joe W. Laymon<br />
/S/ DONALD G. LUBIN<br />
Donald G. Lubin<br />
/S/ MASAHISA NAITOH<br />
Masahisa Naitoh<br />
/S/ ROBERT J. POTTER<br />
Robert J. Potter
74<br />
Exhibit 31.1<br />
CERTIFICATION PURSUANT TO SECTION 302 OF SARBANES-OXLEY ACT OF 2002<br />
I, Martin P. Slark, certify that:<br />
1. I have reviewed this annual report on Form 10-K of <strong>Molex</strong> Incorporated;<br />
2. Based on my knowledge, this report does not contain any untrue statement of a material fact or omit to<br />
state a material fact necessary to make the statements made, in light of the circumstances under which<br />
such statements were made, not misleading with respect to the period covered by this report;<br />
3. Based on my knowledge, the financial statements, and other financial information included in this report,<br />
fairly present in all material respects the financial condition, results of operations and cash flows of the<br />
registrant as of, and for, the periods presented in this report;<br />
4. The registrant’s other certifying officer(s) and I are responsible for establishing and maintaining<br />
disclosure controls and procedures (as defined in Exchange Act Rules 13a-15(e) and 15d-15(e)) and<br />
internal control over financial reporting (as defined in Exchange Act Rules 13a-15(f) and 15d-15(f)) for<br />
the registrant and have:<br />
a. Designed such disclosure controls and procedures, or caused such disclosure controls and<br />
procedures to be designed under our supervision, to ensure that material information relating to the<br />
registrant, including its consolidated subsidiaries, is made known to us by others within those<br />
entities, particularly during the period in which this report is being prepared;<br />
b. Designed such internal control over financial reporting, or caused such internal control over financial<br />
reporting to be designed under our supervision, to provide reasonable assurance regarding the<br />
reliability of financial reporting and the preparation of financial statements for external purposes in<br />
accordance with generally accepted accounting principles;<br />
c. Evaluated the effectiveness of the registrant’s disclosure controls and procedures and presented in<br />
this report our conclusions about the effectiveness of the disclosure controls and procedures, as of<br />
the end of the period covered by this report based on such evaluation; and<br />
d. Disclosed in this report any change in the registrant’s internal control over financial reporting that<br />
occurred during the registrant’s most recent fiscal quarter (the registrant’s fourth quarter in the case<br />
of an annual report) that has materially affected, or is reasonably likely to materially affect, the<br />
registrant’s internal control over financial reporting; and<br />
5. The registrant’s other certifying officer(s) and I have disclosed, based on our most recent evaluation of<br />
internal control over financial reporting, to the registrant’s auditors and the Audit Committee of the<br />
registrant’s Board of Directors (or persons performing the equivalent functions):<br />
a. All significant deficiencies and material weaknesses in the design or operation of internal control<br />
over financial reporting, which are reasonably likely to adversely affect the registrant’s ability to<br />
record, process, summarize and report financial information; and<br />
b. Any fraud, whether or not material, that involves management or other employees who have a<br />
significant role in the registrant’s internal control over financial reporting.<br />
Date: September 12, <strong>2005</strong> By: /S/ MARTIN P. SLARK<br />
Martin P. Slark<br />
Vice Chairman & Chief Executive Officer
75<br />
Exhibit 31.2<br />
CERTIFICATION PURSUANT TO SECTION 302 OF SARBANES-OXLEY ACT OF 2002<br />
I, David D. Johnson, certify that:<br />
1. I have reviewed this annual report on Form 10-K of <strong>Molex</strong> Incorporated;<br />
2. Based on my knowledge, this report does not contain any untrue statement of a material fact or omit to<br />
state a material fact necessary to make the statements made, in light of the circumstances under which<br />
such statements were made, not misleading with respect to the period covered by this report;<br />
3. Based on my knowledge, the financial statements, and other financial information included in this report,<br />
fairly present in all material respects the financial condition, results of operations and cash flows of the<br />
registrant as of, and for, the periods presented in this report;<br />
4. The registrant’s other certifying officer(s) and I are responsible for establishing and maintaining<br />
disclosure controls and procedures (as defined in Exchange Act Rules 13a-15(e) and 15d-15(e)) and<br />
internal control over financial reporting (as defined in Exchange Act Rules 13a-15(f) and 15d-15(f)) for<br />
the registrant and have:<br />
a. Designed such disclosure controls and procedures, or caused such disclosure controls and<br />
procedures to be designed under our supervision, to ensure that material information relating to the<br />
registrant, including its consolidated subsidiaries, is made known to us by others within those entities,<br />
particularly during the period in which this report is being prepared;<br />
b. Designed such internal control over financial reporting, or caused such internal control over financial<br />
reporting to be designed under our supervision, to provide reasonable assurance regarding the<br />
reliability of financial reporting and the preparation of financial statements for external purposes in<br />
accordance with generally accepted accounting principles;<br />
c. Evaluated the effectiveness of the registrant’s disclosure controls and procedures and presented in<br />
this report our conclusions about the effectiveness of the disclosure controls and procedures, as of<br />
the end of the period covered by this report based on such evaluation; and<br />
d. Disclosed in this report any change in the registrant’s internal control over financial reporting that<br />
occurred during the registrant’s most recent fiscal quarter (the registrant’s fourth quarter in the case<br />
of an annual report) that has materially affected, or is reasonably likely to materially affect, the<br />
registrant’s internal control over financial reporting; and<br />
5. The registrant’s other certifying officer(s) and I have disclosed, based on our most recent evaluation of<br />
internal control over financial reporting, to the registrant’s auditors and the Audit Committee of the<br />
registrant’s Board of Directors (or persons performing the equivalent functions):<br />
a. All significant deficiencies and material weaknesses in the design or operation of internal control over<br />
financial reporting, which are reasonably likely to adversely affect the registrant’s ability to record,<br />
process, summarize and report financial information; and<br />
b. Any fraud, whether or not material, that involves management or other employees who have a<br />
significant role in the registrant’s internal control over financial reporting.<br />
Date: September 12, <strong>2005</strong> By: /S/ DAVID D. JOHNSON<br />
David D. Johnson<br />
Vice President, Treasurer & Chief Financial Officer
CERTIFICATION PURSUANT TO<br />
18 U.S.C. SECTION 1350,<br />
AS ADOPTED PURSUANT TO<br />
SECTION 906 OF THE SARBANES-OXLEY ACT OF 2002<br />
76<br />
Exhibit 32.1<br />
In connection with the Annual Report of <strong>Molex</strong> Incorporated (the “Company”) on Form 10-K for the period<br />
ending June 30, <strong>2005</strong> as filed with the Securities and Exchange Commission on the date hereof (the<br />
“Report”), each of the undersigned hereby certifies, pursuant to 18 U.S.C. Sec. 1350, as adopted pursuant to<br />
Sec. 906 of the Sarbanes-Oxley Act of 2002, in his capacity as an officer of <strong>Molex</strong> Incorporated, that to his<br />
knowledge:<br />
1. The Report fully complies with the requirements of Section 13(a) of the Securities Exchange Act of 1934<br />
(15 U.S.C. 78m); and<br />
2. The information contained in the Report fairly presents, in all material respects, the financial condition<br />
and results of operations of the Company.<br />
Date: September 12, <strong>2005</strong> By: /S/ MARTIN P. SLARK<br />
Martin P. Slark<br />
Vice Chairman & Chief Executive Officer<br />
By: /S/ DAVID D. JOHNSON<br />
David D. Johnson<br />
Vice President, Treasurer & Chief Financial Officer<br />
The foregoing certification is being furnished solely pursuant to Section 906 of the Sarbanes-Oxley<br />
Act of 2002 (Section 1350, Chapter 63 of Title 18, United States Code) and is not being filed as part of the<br />
Report or as a separate disclosure document.<br />
A signed original of this written statement required by Section 906 has been provided to <strong>Molex</strong><br />
Incorporated and will be retained by <strong>Molex</strong> Incorporated and furnished to the Securities and Exchange<br />
Commission or its staff upon request.