Sugarcane ethanol: Contributions to climate change - BAFF
Sugarcane ethanol: Contributions to climate change - BAFF
Sugarcane ethanol: Contributions to climate change - BAFF

You also want an ePaper? Increase the reach of your titles
YUMPU automatically turns print PDFs into web optimized ePapers that Google loves.
<strong>Sugarcane</strong><br />
<strong>ethanol</strong><br />
<strong>Contributions</strong> <strong>to</strong> <strong>climate</strong> <strong>change</strong> mitigation and the environment<br />
edited by:<br />
Peter Zuurbier<br />
Jos van de Vooren<br />
Wageningen Academic<br />
P u b l i s<br />
s h e<br />
e r s
ISBN 978-90-8686-090-6<br />
First published, 2008<br />
Wageningen Academic Publishers<br />
�e Netherlands, 2008<br />
All rights reserved.<br />
Nothing from this publication may be<br />
reproduced, s<strong>to</strong>red in a computerised<br />
system or published in any form or in any<br />
manner, including electronic, mechanical,<br />
reprographic or pho<strong>to</strong>graphic, without<br />
prior written permission from the<br />
publisher, Wageningen Academic<br />
Publishers,<br />
P.O. Box 220, NL-6700 AE Wageningen,<br />
�e Netherlands,<br />
www.WageningenAcademic.com<br />
�e individual contributions in this<br />
publication and any liabilities arising<br />
from them remain the responsibility of<br />
the authors.<br />
�e publisher is not responsible for<br />
possible damages, which could be a result<br />
of content derived from this publication.
Table of contents<br />
Foreword 11<br />
José Goldemberg, professor at the University of São Paulo, Brazil<br />
Executive summary 15<br />
Chapter 1 Introduction <strong>to</strong> sugarcane <strong>ethanol</strong> contributions <strong>to</strong> <strong>climate</strong> <strong>change</strong><br />
mitigation and the environment 19<br />
Peter Zuurbier and Jos van de Vooren<br />
1. Introduction 19<br />
2. Biofuels 20<br />
3. Bio<strong>ethanol</strong> 20<br />
4. Production and use of bio<strong>ethanol</strong> 21<br />
5. Where does it come from: the feeds<strong>to</strong>ck for <strong>ethanol</strong> 22<br />
6. Brazil as main exporter 23<br />
7. What makes the <strong>ethanol</strong> attractive? 23<br />
8. �e core of the debate 24<br />
9. Structure of the book 25<br />
References 26<br />
Chapter 2 Land use dynamics and sugarcane production 29<br />
Günther Fischer, Edmar Teixeira, Eva Tothne Hizsnyik and Harrij van Velthuizen<br />
1. His<strong>to</strong>rical scale and dynamics of sugarcane production 29<br />
2. Global potential for expansion of sugarcane production 47<br />
References 59<br />
Chapter 3 Prospects of the sugarcane expansion in Brazil: impacts on direct<br />
and indirect land use <strong>change</strong>s 63<br />
André Meloni Nassar, Bernardo F.T. Rudor�, Laura Barcellos An<strong>to</strong>niazzi, Daniel<br />
Alves de Aguiar, Miriam Rumenos Piedade Bacchi and Marcos Adami<br />
1. Introduction 63<br />
2. �e dynamics of sugarcane expansion in Brazil 65<br />
3. Methodology 66<br />
4. Results and discussions 75<br />
5. Conclusions and recommendations 91<br />
References 92<br />
<strong>Sugarcane</strong> <strong>ethanol</strong> 7
Chapter 4 Mitigation of GHG emissions using sugarcane bio<strong>ethanol</strong> 95<br />
Isaias C. Macedo and Joaquim E.A. Seabra<br />
1. Introduction 95<br />
2. Ethanol production in 2006 and two Scenarios for 2020 95<br />
3. Energy �ows and lifecycle GHG emissions/mitigation 96<br />
4. Land use <strong>change</strong>: direct and indirect e�ects on GHG emissions 102<br />
5. Conclusions 109<br />
References 110<br />
Chapter 5 Environmental sustainability of sugarcane <strong>ethanol</strong> in Brazil 113<br />
Weber Antônio Neves do Amaral, João Paulo Marinho, Rudy Tarasantchi, Augus<strong>to</strong><br />
Beber and Eduardo Giuliani<br />
1. Introduction 113<br />
2. �e Brazilian environmental legal framework regulating <strong>ethanol</strong> production 117<br />
3. Environmental indica<strong>to</strong>rs 120<br />
4. Initiatives <strong>to</strong>wards <strong>ethanol</strong> certi�cation and compliance 132<br />
5. Future steps <strong>to</strong>wards sustainable production of <strong>ethanol</strong> and the role of<br />
innovation 135<br />
References 135<br />
Chapter 6 Demand for bio<strong>ethanol</strong> for transport 139<br />
Andre Faaij, Alfred Szwarc and Arnaldo Walter<br />
1. Introduction 139<br />
2. Development of the <strong>ethanol</strong> market 140<br />
3. Drivers for <strong>ethanol</strong> demand 145<br />
4. Future <strong>ethanol</strong> markets 151<br />
5. Discussion and �nal remarks 153<br />
References 155<br />
Chapter 7 Biofuel conversion technologies 159<br />
Andre Faaij<br />
1. Introduction 159<br />
2. Long term potential for biomass resources. 161<br />
3. Technological developments in biofuel production 164<br />
4. Energy and greenhouse gas balances of biofuels 172<br />
5. Final remarks 177<br />
References 179<br />
8 <strong>Sugarcane</strong> <strong>ethanol</strong>
Chapter 8 �e global impacts of US and EU biofuels policies 181<br />
Wallace E. Tyner<br />
1. Introduction 181<br />
2. Ethanol economics and policy 183<br />
3. Impacts of US and EU policies on the rest of the world 189<br />
4. Conclusions 195<br />
Acknowledgements 196<br />
References 196<br />
Chapter 9 Impacts of sugarcane bio<strong>ethanol</strong> <strong>to</strong>wards the Millennium<br />
Development Goals 199<br />
Annie Dufey<br />
1. Introduction 199<br />
2. Opportunities for sugarcane bio<strong>ethanol</strong> in achieving sustainable<br />
development and the Millennium Development Goals 200<br />
3. Risks and challenges 207<br />
4. Conclusions 220<br />
References 222<br />
Chapter 10 Why are current food prices so high? 227<br />
Martin Banse, Peter Nowicki and Hans van Meijl<br />
1. World agricultural prices in a his<strong>to</strong>rical perspective 227<br />
2. Long run e�ects 229<br />
3. What explains the recent increase in agricultural prices? 232<br />
4. First quantitative results of the analysis of key driving fac<strong>to</strong>rs 238<br />
5. �e future 241<br />
6. Concluding remarks 244<br />
Acknowledgements 246<br />
References 246<br />
Acknowledgements 249<br />
Peter Zuurbier and Jos van de Vooren<br />
Authors 251<br />
Keyword index 253<br />
<strong>Sugarcane</strong> <strong>ethanol</strong> 9
Foreword<br />
José Goldemberg, professor at the University of São Paulo, Brazil<br />
Ethanol, produced from biomass, has been considered as a suitable au<strong>to</strong>mobile fuel since<br />
the beginning of the au<strong>to</strong>motive industry one century ago, particularly for vehicles powered<br />
with spark-ignition engines (technically referred as Ot<strong>to</strong> cycle engines, but commonly<br />
known as gasoline engines). However, the use of <strong>ethanol</strong> was dwarfed by gasoline re�ned<br />
from abundant and cheap oil. �e staggering amounts of gasoline in use <strong>to</strong>day – more than<br />
1 trillion litres per year – eliminated almost all the alternatives.<br />
However environmental as well as security of supply concerns sparked, in the last decades,<br />
renewed interest in <strong>ethanol</strong>. In many countries it is blended with gasoline in small amounts<br />
<strong>to</strong> replace MTBE. In Brazil it has already replaced 50% of the gasoline thanks <strong>to</strong> the use of<br />
�ex-fuel engines or dedicated pure <strong>ethanol</strong> mo<strong>to</strong>rs. Worldwide <strong>ethanol</strong> is replacing already<br />
3% of the gasoline.<br />
Maize (in the US) and sugarcane (in Brazil) account for 80% of all <strong>ethanol</strong> in use <strong>to</strong>day. �e<br />
agricultural area used for that purpose amounts <strong>to</strong> 10 million hectares less than 1% of the<br />
arable land in use in the world.<br />
�ere are three main routes <strong>to</strong> produce <strong>ethanol</strong> from biomass:<br />
•<br />
•<br />
•<br />
fermentation of sugar from sugarcane, sugar beet and sorghum;<br />
sacchari�cation of starch from maize, wheat and manioc;<br />
hydrolysis of cellulosic materials, still in development.<br />
�ere are important di�erences between the fermentation and sacchari�cation routes. When<br />
using sugarcane one does not need an ‘external’ source of energy for the industrial phase of<br />
<strong>ethanol</strong> production since the bagasse supplies all the energy needed. �e fossil fuel inputs<br />
are small (in the form of fertilizers, pesticides, etc.) so basically this route converts solar<br />
energy in<strong>to</strong> <strong>ethanol</strong>. �e �nal product is practically a renewable fuel contributing little <strong>to</strong><br />
greenhouse gas (GHG) emissions.<br />
Ethanol from maize and other feed s<strong>to</strong>cks requires considerable inputs of ‘external’ energy<br />
most of it coming from fossil fuels reducing only marginally GHG emissions.<br />
<strong>Sugarcane</strong> grows only in tropical areas and the Brazilian experience in this area led <strong>to</strong> <strong>ethanol</strong><br />
produced at very low cost and competitive with gasoline through gains in productivity and<br />
economies of scale (Goldemberg, 2007). Ethanol produced from maize in the US cost almost<br />
twice and from wheat, sugar beets, sorghum (mainly in Europe) four times (Worldwatch<br />
Institute, 2006).<br />
<strong>Sugarcane</strong> <strong>ethanol</strong> 11
Foreword<br />
�e use of biofuels as a substitute for gasoline has been recently criticized mainly for:<br />
• sparking a competition between the use of land for fuel ‘versus’ land for food which is<br />
causing famine in the world and<br />
•<br />
leading <strong>to</strong> deforestation in the Amazonia.<br />
�e importance of these concerns was greatly exaggerated and is, generally speaking,<br />
unwarranted.<br />
�e recent rise in prices of agricultural products – a�er several decades of declining real<br />
prices – has given rise <strong>to</strong> the politically laden controversy of fuel ‘versus’ food. �is problem<br />
has been extensively analyzed in many reports, particularly the World Bank (World Bank,<br />
2008), which pointed out that grain prices have risen due <strong>to</strong> a number of individual fac<strong>to</strong>rs,<br />
whose combined e�ect has led <strong>to</strong> an upward price spiral namely: high energy and fertilizer<br />
prices, the continuing depreciation of the US dollar, drought in Australia, growing global<br />
demand for grains (particularly in China), <strong>change</strong>s in import-export policies of some<br />
countries and speculative activity on future commodities trading and regional problems<br />
driven by policies subsidizing production of biofuels in the US and Europe (from maize,<br />
sugar beets and wheat). �e expansion of biofuels production particularly from maize<br />
over areas covered by soybeans in the US contributed <strong>to</strong> price increases but was not the<br />
dominant fac<strong>to</strong>r. �e production of <strong>ethanol</strong> from sugarcane in Brazil has not in�uenced<br />
the prize of sugar.<br />
Despite that, the point has been made that other countries had <strong>to</strong> expand soybean production<br />
<strong>to</strong> compensate for reductions in the US production possibly in the Amazonia, increasing thus<br />
deforestation. Such speculative ‘domino e�ect’ is not borne out by the facts: the area used<br />
for soybeans in Brazil (mainly in the Amazonia) has not increased since 2004 (Goldemberg<br />
and Guardabassi, in press). �e reality is that deforestation in the Amazonia has been going<br />
on for a long time at a rate of approximately 1 million hectares per year and recent increases<br />
are not due <strong>to</strong> soybean expansion but <strong>to</strong> cattle.<br />
Emissions from land use <strong>change</strong>s resulting from massive deforestation would of course<br />
release large amounts of CO 2 but the expansion of the sugarcane plantations in Brazil is<br />
taking place over degraded pastures very far from the Amazonia. Emissions from such land<br />
use <strong>change</strong> have been shown <strong>to</strong> be small (Cerri et al., 2007).<br />
�e present area used of sugarcane for <strong>ethanol</strong> production in Brazil <strong>to</strong>day is approximately<br />
4 million hectares out of 20 million hectares used in the world by sugarcane in almost<br />
100 countries. Increasing the areas used for of sugarcane for <strong>ethanol</strong> production in these<br />
countries by 10 million hectares would result in enough <strong>ethanol</strong> <strong>to</strong> replace 10% of the<br />
gasoline in the world leading <strong>to</strong> a reduction of approximately 50 million <strong>to</strong>ns of carbon<br />
per year. �is would help signi�cantly many OECD countries <strong>to</strong> meet the policy mandates<br />
adopted for the use of biofuels.<br />
12 <strong>Sugarcane</strong> <strong>ethanol</strong>
Foreword<br />
Such course of action would of course require a balanced weighting of the advantages of<br />
replacing gasoline by a renewable fuel and impacts and land use and biodiversity.<br />
�is book analyzes all these aspects of the problem and will certainly be an important<br />
instrument <strong>to</strong> clarify the issues, dispel some myths and evaluate the consequence of di�erent<br />
policy choices.<br />
References<br />
Cerri, C.E.P., M. Easter, K. Paustian, K. Killian, K. Coleman, M. Bernoux, P. Falloon, D.S. Powlson, N.H.<br />
Batjes, E. Milne and C.C. Cerri, 2007. Predicted soil organic carbon s<strong>to</strong>cks and <strong>change</strong>s in the Brazilian<br />
Amazon between 2000 and 2030. Agriculture, Ecosystems and Environment 122: 58-72.<br />
Goldemberg, J., 2007. Ethanol for a Sustainable Energy Future. Science 315: 808-810.<br />
Goldemberg, J., S.T. Coelho and P. Guardabassi, 2008. �e sustainablility of <strong>ethanol</strong> production from<br />
sugarcane. Energy Policy 36: 2086-2097.<br />
Worldwatch Institute, 2006. Biofuels for transport: Global Potential and Implications for Sustainable<br />
Agriculture and Energy in 21 st Century. ISBN 978-1-84407-422-8<br />
World Bank, 2008. Double Jeopardy: Responding <strong>to</strong> high Food and Fuel Prices. G8 Hokkaido – Toyako<br />
Summit. July 2, 2008.<br />
<strong>Sugarcane</strong> <strong>ethanol</strong> 13
Executive summary<br />
Do biofuels help <strong>to</strong> reduce greenhouse gas emissions and do they o�er new sources of<br />
income <strong>to</strong> farmers, by producing biomass? Are biofuels competing with food, animal feed<br />
and contributing <strong>to</strong> higher food prices? And are biofuels directly or indirectly threatening<br />
the environment, biodiversity, causing irreversible or undesirable <strong>change</strong>s in land use and<br />
landscape?<br />
�is publication aims <strong>to</strong> set the stage for the discussion about both challenges and<br />
concerns of sugarcane <strong>ethanol</strong> by providing the scienti�c context, the basic concepts and<br />
the approach for understanding the debate on biofuel-related issues. �is book largely<br />
limits itself <strong>to</strong> sugarcane <strong>ethanol</strong> and its contribution <strong>to</strong> <strong>climate</strong> <strong>change</strong> mitigation and the<br />
environment.<br />
�e main �ndings and conclusions are:<br />
1. �e dominance of Brazil in global sugarcane production and expansion – Brazil<br />
accounted for 75 percent of sugarcane area increase in the period 2000 <strong>to</strong> 2007 and<br />
two-thirds of global production increase in that period – derives from its experience<br />
and capability <strong>to</strong> respond <strong>to</strong> thriving demand for transport fuels, which was recently<br />
triggered by measures <strong>to</strong> mitigate greenhouse gas emissions of the rapidly growing<br />
transport sec<strong>to</strong>r, concerns in developed countries <strong>to</strong> enhance energy security and lessen<br />
dependence on petroleum, and not the least the need of many developing countries <strong>to</strong><br />
reduce import bills for fossil oil.<br />
2. According <strong>to</strong> the IIASA/AEZ assessment, the most suitable <strong>climate</strong>s for rain-fed<br />
sugarcane production are found in south-eastern parts of South America, e.g. including<br />
São Paulo State in Brazil, but also large areas in Central Africa as well as some areas in<br />
Southeast Asia. �e massive further expansion of sugarcane areas, e.g. as forecasted for<br />
Brazil, is expected <strong>to</strong> cause the conversion of pas<strong>to</strong>ral lands in the savannah region.<br />
3. �is study analyzes the land use <strong>change</strong>s (LUC) in Brazil caused by sugarcane expansion,<br />
looking both at the past and expected future dynamics. Remote sensing images have<br />
identi�ed that in 2007 and 2008 Pasture and Agriculture classes <strong>to</strong>gether were responsible<br />
for almost 99% of the <strong>to</strong>tal area displaced for sugarcane expansion which equals an<br />
area of more than 2 million ha. Pasture was responsible for approximately 45% and<br />
Agriculture was responsible for more than 50% of the displaced area for sugarcane.<br />
About 1% of sugarcane expansion <strong>to</strong>ok place over the Citrus class and less than 1% over<br />
the Reforestation and Forest classes <strong>to</strong>gether. Pasture displacement is more important<br />
in São Paulo and Ma<strong>to</strong> Grosso do Sul, while Agriculture is more important in the other<br />
states analyzed.<br />
4. �e shi�-share model using IBGE micro-regional data has analyzed sugarcane expansion<br />
from 2002 <strong>to</strong> 2006 and has identi�ed around 1 million ha in the ten Brazilian states<br />
analyzed. From this <strong>to</strong>tal expansion, 773 thousand ha displaced pasture land and 103<br />
thousands displaced other crops, while only 125 thousand ha were not able <strong>to</strong> be allocated<br />
<strong>Sugarcane</strong> <strong>ethanol</strong> 15
Executive summary<br />
over previous productive areas (meaning new land has been incorporated in<strong>to</strong> agricultural<br />
production, which might be attributed <strong>to</strong> the conversion of forest <strong>to</strong> agriculture or <strong>to</strong><br />
the use of previously idle areas). Total agricultural area growth – the sum of all crops,<br />
including sugarcane, and pastures – in the period was around 3.3 million ha.<br />
5. Projections indicate that harvested sugarcane area in Brazil will reach 11.7 million ha and<br />
other crops 43.8 million ha in 2018, while pasture area will decrease around 3 million<br />
ha. �e <strong>to</strong>tal land area in Brazil is 851.196.500 ha.<br />
6. �e expansion of crops, except sugarcane, and pasture land is taking place despite of the<br />
sugarcane expansion. �is is important because it reinforces that, even recognizing that<br />
sugarcane expansion contributes <strong>to</strong> the displacement of other crops and pasture, there<br />
is no evidence that deforestation caused by indirect land use e�ect is a consequence of<br />
sugarcane expansion.<br />
7. <strong>Sugarcane</strong> <strong>ethanol</strong> from Brazil does comply with the targets of greenhouse gases (GHG)<br />
reduction.<br />
8. �e GHG emissions and mitigation from fuel <strong>ethanol</strong> production/use in Brazil are<br />
evaluated for the 2006/07 season, and for two scenarios for 2020: the 2020 Electricity<br />
Scenario (already being implemented) aiming at increasing electricity surplus with<br />
cane biomass residues; and the 2020 Ethanol Scenario using the residues for <strong>ethanol</strong><br />
production. Emissions are evaluated from cane production <strong>to</strong> <strong>ethanol</strong> end use; process<br />
data was obtained from 40 mills in Brazilian Centre South. Energy ratios grow from 9.4<br />
(2006) <strong>to</strong> 12.1 (2020, the two Scenarios); and the corresponding GHG mitigation increase<br />
from 79% (2006) <strong>to</strong> 86% (2020) if only the <strong>ethanol</strong> is considered. With co-products<br />
(electricity) it would be 120%. LUC derived GHG emissions were negative in the period<br />
2002 – 2008, and very little impact (if any) is expected for 2008 – 2020, due mostly <strong>to</strong> the<br />
large availability of land with poor carbon s<strong>to</strong>cks. Although indirect land use <strong>change</strong>s<br />
(ILUC) impacts cannot be adequately evaluated <strong>to</strong>day, speci�c conditions in Brazil may<br />
lead <strong>to</strong> signi�cant increases in <strong>ethanol</strong> production without positive ILUC emissions.<br />
9. Brazil has achieved very high levels of productivity (on average 7.000 litres of <strong>ethanol</strong>/ha<br />
and 6,1 MWhr of energy/ha), despite its lower inputs of fertilizers and agrochemicals<br />
compared with other biofuels, while reducing signi�cantly the emissions of greenhouse<br />
gases. �e ending of sugarcane burning in 2014 is a good example of improving existing<br />
practices.<br />
10. Production of <strong>ethanol</strong> in Brazil, which has been rising fast, is expected <strong>to</strong> reach 70 billion<br />
litres by the end of 2008. Approximately 80% of this volume will be used in the transport<br />
sec<strong>to</strong>r while the rest will go in<strong>to</strong> alcoholic beverages or will be either used for industrial<br />
purposes (solvent, disinfectant, chemical feeds<strong>to</strong>ck, etc.).<br />
11. When evaluating key drivers for <strong>ethanol</strong> demand, energy security and <strong>climate</strong> <strong>change</strong><br />
are considered <strong>to</strong> be the most important objectives reported by nearly all countries that<br />
engage in bioenergy development activities. A next fac<strong>to</strong>r is the growth in demand for<br />
transport fuels. A third fac<strong>to</strong>r is vehicle technologies that already enable large scale use<br />
of <strong>ethanol</strong>.<br />
16 <strong>Sugarcane</strong> <strong>ethanol</strong>
Executive summary<br />
12. Projections of <strong>ethanol</strong> production for Brazil, the USA and the EU indicate that supply<br />
of 165 billion litres by 2020 could be achieved with the use of a combination of �rst and<br />
second generation <strong>ethanol</strong> production technologies.<br />
13. Compared <strong>to</strong> current average vehicle performance, considerable improvements are<br />
possible in drive chain technologies and their respective e�ciencies and emission pro�les.<br />
IEA does project that in a timeframe <strong>to</strong>wards 2030, increased vehicle e�ciency will play<br />
a signi�cant role in slowing down the growth in demand for transport fuels. With further<br />
technology re�nements, which could include direct injection and regenerative breaking,<br />
fuel <strong>ethanol</strong> economy of 24 km/litre may be possible. Such operating conditions, can<br />
also deliver very low emissions.<br />
14. Future <strong>ethanol</strong> markets could be characterized by a diverse set of supplying and producing<br />
regions. From the current fairly concentrated supply (and demand) of <strong>ethanol</strong>, a future<br />
international market could evolve in<strong>to</strong> a truly global market, supplied by many producers,<br />
resulting in stable and reliable biofuel sources. �is balancing role of an open market and<br />
trade is a crucial precondition for developing <strong>ethanol</strong> production capacities worldwide.<br />
15. However, the combination of lignocellulosic resources (biomass residues on shorter<br />
term and cultivated biomass on medium term) and second generation conversion<br />
technology o�ers a very strong perspective. Also, the economic perspectives for such<br />
second generation concepts are very strong, o�ering competitiveness with oil prices<br />
equivalent <strong>to</strong> some 55 US$/barrel around 2020.<br />
16. First generation biofuels in temperate regions (EU, North America) do not o�er a<br />
sustainable possibility in the long term: they remain expensive compared <strong>to</strong> gasoline and<br />
diesel (even at high oil prices), are o�en ine�cient in terms of net energy and GHG gains<br />
and have a less desirable environmental impact. Furthermore, they can only be produced<br />
on higher quality farmland in direct competition with food production. <strong>Sugarcane</strong> based<br />
<strong>ethanol</strong> production and <strong>to</strong> a certain extent palm oil and Jatropha oilseeds are notable<br />
exceptions <strong>to</strong> this, given their high production e�ciencies and low(er) costs.<br />
17. Especially promising are the production via advanced conversion concepts biomassderived<br />
fuels such as m<strong>ethanol</strong>, hydrogen, and <strong>ethanol</strong> from lignocellulosic biomass.<br />
Ethanol produced from sugarcane is already a competitive biofuel in tropical regions<br />
and further improvements are possible. Both hydrolysis-based <strong>ethanol</strong> production<br />
and production of synthetic fuels via advanced gasi�cation from biomass of around 2<br />
Euro/GJ can deliver high quality fuels at a competitive price with oil down <strong>to</strong> US$55/<br />
barrel. Net energy yields per unit of land surface are high and up <strong>to</strong> a 90% reduction in<br />
GHG emissions can be achieved. �is requires a development and commercialization<br />
pathway of 10-20 years, depending very much on targeted and stable policy support and<br />
frameworks.<br />
18. Global land use <strong>change</strong>s induced by US and EU biofuels mandates show that when it<br />
comes <strong>to</strong> the assessing the impacts of these mandates on third economies, the combined<br />
policies have a much greater impact than just the US or just the EU policies alone, with<br />
crop cover rising sharply in Latin America, Africa and Oceania as a result of the biofuel<br />
<strong>Sugarcane</strong> <strong>ethanol</strong> 17
Executive summary<br />
mandates. �ese increases in crop cover come at the expense of pasturelands (�rst and<br />
foremost) as well as commercial forests.<br />
19. <strong>Sugarcane</strong> based <strong>ethanol</strong> can contribute <strong>to</strong> the achievement of several Millennium<br />
Development Goals through a varied range of environmental, social and economic<br />
advantages over fossil fuels. �ese include enhanced energy security both at national<br />
and local level; improved trade balance by reducing oil imports; improved social wellbeing<br />
through better energy services especially among the poorest; promotion of rural<br />
development and better livelihoods; product diversi�cation leaving countries bettero�<br />
<strong>to</strong> deal with market �uctuations; the creation of new exports opportunities; the<br />
potential <strong>to</strong> help tackling <strong>climate</strong> <strong>change</strong> through reduced emissions of greenhouse<br />
gases as well as other air emissions; and opportunities for investment attraction through<br />
the carbon �nance markets. �e highest impact on poverty reduction is likely <strong>to</strong> occur<br />
where sugarcane <strong>ethanol</strong> production focuses on local consumption, involving the<br />
participation and ownership of small farmers and where processing facilities are near<br />
<strong>to</strong> the cultivation �elds.<br />
20. Development of oil prices is crucial for the development of biofuels. High feeds<strong>to</strong>ck<br />
prices make biofuels less pro�table. Hence, price hikes for commodities have a negative<br />
impact on bio<strong>ethanol</strong> prices. Other fac<strong>to</strong>rs, like s<strong>to</strong>ck level, price speculation, expected<br />
policy measures and natural disasters may add <strong>to</strong> price volatility as well.<br />
�e �nal conclusion is that sugarcane <strong>ethanol</strong> contributes <strong>to</strong> mitigation of <strong>climate</strong> <strong>change</strong>.<br />
�e environmental impacts of sugarcane <strong>ethanol</strong> production are overall positive within<br />
certain conditions, as outlined in this publication, For advancing the sustainable sugarcane<br />
<strong>ethanol</strong> production, it is of importance <strong>to</strong> enhance a process of dialogue in the market place<br />
and between interested stakeholders in society.<br />
18 <strong>Sugarcane</strong> <strong>ethanol</strong>
Chapter 1<br />
Introduction <strong>to</strong> sugarcane <strong>ethanol</strong> contributions <strong>to</strong> <strong>climate</strong><br />
<strong>change</strong> mitigation and the environment<br />
Peter Zuurbier and Jos van de Vooren<br />
1. Introduction<br />
Life is energy. Humankind depends on energy and produces and consumes large volumes of<br />
energy. �e <strong>to</strong>tal �nal energy consumption in industry, households, services and transport<br />
in 2005 was 285 EJ (OECD/IEA, 2008). And the consumption is growing fast. �e growth<br />
of global �nal energy between 1990 and 2005 was 23%. Globally, energy consumption grew<br />
most quickly in the transport and service sec<strong>to</strong>rs. Between 1990 and 2005, global �nal<br />
energy use in transport increased by 37% <strong>to</strong> 75 EJ and according <strong>to</strong> the IEA study, road<br />
transport contributes the most <strong>to</strong> the increase in overall transport energy consumption.<br />
Between 1990 and 2005, road transport energy use increased by 41%. And with this growth,<br />
CO 2 emissions increased as well. �ese emissions grew during that same period with 25%<br />
(IEA, 2008). �e associated CO 2 emissions increased <strong>to</strong> 5.3 Gt CO 2 . �ere is a widely shared<br />
opinion that these emissions contribute <strong>to</strong> global warming and <strong>climate</strong> <strong>change</strong>. Reason<br />
enough for making a <strong>change</strong>.<br />
Another reason for making a <strong>change</strong>, are the fossil oil prices. Fact is that the price increased<br />
from $20 in 2002 <strong>to</strong> a record high of more than $140 a barrel in July 2008. �e price<br />
volatility creates a lot of uncertainty in global markets. So, it is not surprising that the world<br />
is looking for substitutes for petroleum-derived products. Securing a reliable, constant and<br />
sustainable supply of energy demands a diversi�cation of energy sources and an e�cient<br />
use of available energy.<br />
One of the alternatives for fossil fuels is biofuels. And here we enter in <strong>to</strong> the heat of the<br />
debate. Do biofuels help <strong>to</strong> reduce greenhouse gas emissions and o�ering new sources of<br />
income <strong>to</strong> farmers, by producing biomass? Are biofuels competing with food, animal feed<br />
and contributing <strong>to</strong> higher food prices? And are biofuels directly or indirectly threatening<br />
the environment, biodiversity, causing irreversible or undesirable <strong>change</strong>s in land use and<br />
landscape?<br />
In this publication we aim <strong>to</strong> set the stage for the discussion about both challenges and<br />
concerns of sugarcane <strong>ethanol</strong> by providing the scienti�c context, the basic concepts and<br />
the approach for understanding the debate on biofuel-related issues. �is book largely<br />
limits itself <strong>to</strong> sugarcane <strong>ethanol</strong> and its contribution <strong>to</strong> <strong>climate</strong> <strong>change</strong> mitigation and<br />
the environment.<br />
<strong>Sugarcane</strong> <strong>ethanol</strong> 19
Chapter 1<br />
2. Biofuels<br />
Biofuels encompass a variety of feeds<strong>to</strong>ck, conversion technologies, and end uses. �ey are<br />
used mostly for transport and producing electricity. Biofuels for transportation, like <strong>ethanol</strong><br />
and biodiesel, are one of the fastest-growing sources of alternative energy in the world<br />
<strong>to</strong>day. Global production of biofuels amounted <strong>to</strong> 62 billion litres or 36 million <strong>to</strong>nnes of<br />
oil equivalent (Mt) in 2007 - equal <strong>to</strong> about 2 % of <strong>to</strong>tal global transport fuel consumption<br />
in energy terms (OESO, 2008).<br />
3. Bio<strong>ethanol</strong><br />
Global bio<strong>ethanol</strong> production tripled from its 2000 level and reached 52 billion litres<br />
(28.6 Mt) in 2007 (OESO, 2008). Based on the origin of supply, Brazilian <strong>ethanol</strong> from<br />
sugarcane and American <strong>ethanol</strong> from maize are by far leading the <strong>ethanol</strong> production. In<br />
2007 Brazil and the United States <strong>to</strong>gether accounted for almost 90% of the world <strong>ethanol</strong><br />
production.<br />
In Brazil production of <strong>ethanol</strong>, entirely based on sugarcane (Saccharum spp.), started in the<br />
seventies and peaked in the 1980s, then declined as international fossil oil prices fell back,<br />
but increased rapidly again since the beginning of the 21st century. Falling production costs,<br />
higher oil prices and the introduction of vehicles that allow switching between <strong>ethanol</strong> and<br />
conventional gasoline have led <strong>to</strong> this renewed surge in output.<br />
In the crop season 2007/08 Brazil produced 22.24 billion litres of <strong>ethanol</strong>. Conab/AgraFNP<br />
expects another jump for the crop season 2008/09 with an expected production of 26.7<br />
billion litres (AgraFNP, 2008). �is increase is mainly due <strong>to</strong> expansion of the sugarcane<br />
area. In 2007/08 the area for sugarcane was 6.96 million hectare, and is estimated <strong>to</strong> grow<br />
<strong>to</strong> 7.67 million hectare in 2008/09. �e <strong>to</strong>tal sugarcane production will also increase from<br />
549.902 Mt <strong>to</strong> 598.224 Mt.<br />
A typical plant in Brazil crushes 2 million <strong>to</strong>nnes of sugarcane per year and produces<br />
200 million litres of <strong>ethanol</strong> per year (1 million litres per day during 6 months – April <strong>to</strong><br />
November in the south-eastern region). �e size of the planted area required <strong>to</strong> supply the<br />
processing plant is on average 30,000 hectares. Due <strong>to</strong> process of degradation of the quality<br />
of harvested cane the distance <strong>to</strong> the mill is up <strong>to</strong> 70 kilometres at the most.<br />
United States (US) output of <strong>ethanol</strong>, mainly from maize (Zea mays ssp. mays L.), has<br />
increased in recent years as a result of public policies and measures such as tax incentives and<br />
mandates and a demand for <strong>ethanol</strong> as a replacement for methyl-tertiary-butyl-ether (MTBE)<br />
a gasoline-blending component. Between 2001 and 2007, US fuel <strong>ethanol</strong> production capacity<br />
grew 220 from 7.19 billion <strong>to</strong> 26.50 billion litres (OECD, 2008). �e new Energy Bill expands<br />
the mandate for biofuels, such as <strong>ethanol</strong>, <strong>to</strong> 56.8 billion litres in 2015.<br />
20 <strong>Sugarcane</strong> <strong>ethanol</strong>
Introduction <strong>to</strong> sugarcane <strong>ethanol</strong><br />
Although the installed <strong>ethanol</strong> fuel capacity in the European Union (EU) amounts <strong>to</strong> 4.04<br />
billion litres at the moment (OESO, 2008), Europe’s operational capacity is signi�cantly<br />
lower at 2.9-3.2 billion litres as some plants have suspended production. �e bulk of EU<br />
production, however, is biodiesel, which, in turn, accounts for almost two-thirds of world<br />
biodiesel output.<br />
Elsewhere, China with 1.8 billion litres of <strong>ethanol</strong> (Latner et al., 2007), Canada with 0.8<br />
billion litres are relatively smaller producers.<br />
4. Production and use of bio<strong>ethanol</strong><br />
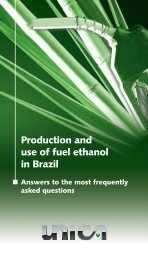
Ethanol is manufactured by microbial conversion of biomass materials through fermentation.<br />
�e production process consists of three main stages:<br />
• conversion of biomass <strong>to</strong> fermentable sugars;<br />
• fermentation of sugars <strong>to</strong> <strong>ethanol</strong>; and<br />
• separation and puri�cation of the <strong>ethanol</strong> (Figure 1).<br />
Fermentation initially produces <strong>ethanol</strong> containing a substantial amount of water. Distillation<br />
removes the major part of the water <strong>to</strong> yield about 95 percent pure <strong>ethanol</strong>. �is mixture<br />
of 95% <strong>ethanol</strong> and water is called hydrous <strong>ethanol</strong>. If the remaining water is removed, the<br />
<strong>ethanol</strong> is called anhydrous <strong>ethanol</strong> and is suitable for blending with gasoline. Ethanol is<br />
‘denatured’ prior <strong>to</strong> leaving the distillery <strong>to</strong> make it un�t for human consumption.<br />
C 4 plants<br />
(Sugar cane and corn)<br />
Solid residues<br />
Feed s<strong>to</strong>ck preparation<br />
washing/separation<br />
Hydrolysis<br />
Fermentation<br />
Use of yeast<br />
Distillation<br />
Dehydration<br />
Figure 1. Production process of <strong>ethanol</strong> (Barriga, 2003).<br />
C 3 plants and starch<br />
(Wheat, barley and beet)<br />
CO 2 and heat<br />
Liquor<br />
<strong>Sugarcane</strong> <strong>ethanol</strong> 21
Chapter 1<br />
Traditional fermentation processes rely on yeasts that convert six-carbon sugars, such<br />
as glucose, in<strong>to</strong> <strong>ethanol</strong>. Ethanol is used primarily in spark-ignition engine vehicles. �e<br />
amount of <strong>ethanol</strong> in the fuel ranges from 100 percent <strong>to</strong> 5 percent or lower, blended with<br />
gasoline. In Brazil the Flex-Fuel-Vehicles (FFV) are �t <strong>to</strong> use the whole range of blends of<br />
<strong>ethanol</strong>, up <strong>to</strong> 100%. �e attractiveness of FFV is shown by the fact that in 2008 of the new<br />
cars sold 87.6% are FFV’s (Anfavea: www.anfavea.com.br/tabelas.html). In other countries,<br />
such as Sweden, a maximum of 85% (E85) is used.<br />
Anhydrous <strong>ethanol</strong> is used in a gasoline-<strong>ethanol</strong> blend. For example, of the <strong>to</strong>tal Brazilian<br />
<strong>ethanol</strong> production in the crop-season 2007/08, 8.38 billion litres are anhydrous and the<br />
rest, 13.86 billion litres hydrous <strong>ethanol</strong> (AgraFNP, 2008). Aside from FFV’s manufactured<br />
<strong>to</strong> run on hydrous <strong>ethanol</strong>, non-FFV’s in Brazil run on a 25 % mixture of a gasoline-<strong>ethanol</strong><br />
blend and hydrous <strong>ethanol</strong>.<br />
Another application of <strong>ethanol</strong> is as a feeds<strong>to</strong>ck <strong>to</strong> make ethers, most commonly ethyl<br />
tertiary-butyl ether (ETBE), an oxygenate with high blending octane used in gasoline. ETBE<br />
contains 44 percent <strong>ethanol</strong>. A last application, that we mention here, is the use of <strong>ethanol</strong> in<br />
diesel engines. Take for example Scania: Scania’s compression-ignition (CI) <strong>ethanol</strong> engine is<br />
a modi�ed 9-liter diesel with a few modi�cations. Scania raised the compression ratio from<br />
18:1 <strong>to</strong> 28:1, added larger fuel injection nozzles, and altered the injection timing. �e fuel<br />
system also needs di�erent gaskets and �lters, and a larger fuel tank since the engine burns<br />
65% <strong>to</strong> 70% more <strong>ethanol</strong> than diesel. �e thermal e�ciency of the engine is comparable<br />
<strong>to</strong> a diesel, 43% compared <strong>to</strong> 44% (http://gas2.org/2008/04/15).<br />
5. Where does it come from: the feeds<strong>to</strong>ck for <strong>ethanol</strong><br />
�e term feeds<strong>to</strong>ck refers <strong>to</strong> the raw material used in the conversion process. �e main<br />
types of feeds<strong>to</strong>ck for <strong>ethanol</strong> are described below.<br />
1. Sugar and starch-based crops: As mentioned earlier bio<strong>ethanol</strong> is mainly produced of<br />
sugarcane and maize. Other major crops being used are wheat, sugar beet, sorghum and<br />
cassava. Starch consists of long chains of glucose molecules. Hydrolysis, a reaction of<br />
starch with water, breaks down the starch in<strong>to</strong> fermentable sugars (see Figure 1).<br />
�e co-products include bagasse (the residual woody �bre of the cane obtained<br />
a�er crushing cane), which can be used for heat and power generation in the case of<br />
sugarcane; distiller’s dried grains sold as an animal feed supplement from maize in dry<br />
mill processing plants; and high-fruc<strong>to</strong>se maize syrup, dextrose, glucose syrup, vitamins,<br />
food and feed additives, maize gluten meal, maize gluten feed, maize germ meal and<br />
maize oil in wet mill processing plants. In all cases, commercial carbon dioxide (CO 2 )<br />
can be captured for sale.<br />
2. Wastes, residues and cellulosic material: according <strong>to</strong> Kim and Dale (2005), there are<br />
about 73.9 million <strong>to</strong>nnes of dry wasted crops and about 1.5 billion <strong>to</strong>nnes of dry<br />
lignocellulosic biomass.<br />
22 <strong>Sugarcane</strong> <strong>ethanol</strong>
Introduction <strong>to</strong> sugarcane <strong>ethanol</strong><br />
Cellulose is the substance that makes up the cell walls of plant matter along with<br />
hemicellulose and lignin. Cellulose conversion technologies will allow the utilization of<br />
nongrain parts of crops like maize s<strong>to</strong>ver, rice husk, straws, sorghum stalk, bagasse from<br />
sugarcane and wood and wood residues. Among the cellulosic crops perennial grasses<br />
like switchgrass (Panicum virgatum L.) and Miscanthus are two crops considered <strong>to</strong> hold<br />
enormous potential for <strong>ethanol</strong> production. Perennial crops o�er other advantages like<br />
lower rates of soil erosion and higher soil carbon sequestration (Khanna et al., 2007;<br />
Schuman et al, 2002) However, technologies for conversion of cellulose <strong>to</strong> <strong>ethanol</strong> are<br />
just emerging and not yet technically or commercially mature.<br />
Furthermore, lignin-rich fermentation residue, which is the co-product of <strong>ethanol</strong><br />
made from crop residues and sugarcane bagasse, can potentially generate electricity<br />
and steam.<br />
6. Brazil as main exporter<br />
Brazil has been by far the largest exporter of <strong>ethanol</strong> in recent years. In the crop season<br />
2007/08, its hydrated <strong>ethanol</strong> exports amounted <strong>to</strong> 3.7 billion litres, of the 5 billion litres<br />
of <strong>ethanol</strong> traded globally (excl. intra-EU trade) (AgraFNP, 2008). �e US imported more<br />
than half the <strong>ethanol</strong> traded in 2006. Of the 2.7 billion litres imported by the US in 2006,<br />
about 1.7 billion litres were imported directly from Brazil, while much of the remainder<br />
was imported from countries which are members of the Caribbean Basin Initiative (CBI)<br />
which enjoy preferential access <strong>to</strong> the US market and import (hydrated) <strong>ethanol</strong> from Brazil,<br />
dehydrate it and re-export <strong>to</strong> the US.<br />
China, <strong>to</strong>o, has been a net exporter of <strong>ethanol</strong> over the last several years, though at<br />
signi�cantly lower levels than Brazil. Despite some exports <strong>to</strong> the US as well as <strong>to</strong> CBI<br />
countries, most of the larger destinations for Chinese <strong>ethanol</strong> are within the Asian region,<br />
in particular South Korea and Japan (OESO, 2008). �e EU is also a net importer.<br />
7. What makes the <strong>ethanol</strong> attractive?<br />
One may observe a variety of reasons for the recent bio<strong>ethanol</strong> interest. From the market<br />
point of view, there is an increasing consensus about the end of cheap oil and the volatility<br />
in world oil prices. Nowhere is the need for alternative <strong>to</strong> fossil oil felt more than in the<br />
transport sec<strong>to</strong>r. Transport consumes 30% of the global energy, 98 % of which is supplied<br />
by fossil oils (IEA, 2007).<br />
From a policy point of view, other fac<strong>to</strong>rs are mentioned, such as assuring energy security,<br />
reducing greenhouse gas emissions, increase and diversi�cation of incomes of farmers and<br />
rural communities and rural development. And next there are arguments that <strong>ethanol</strong> is<br />
replenishable, that the <strong>ethanol</strong> industry can create new jobs, and that feeds<strong>to</strong>ck for <strong>ethanol</strong><br />
can be made easily available considering already existing technologies.<br />
<strong>Sugarcane</strong> <strong>ethanol</strong> 23
Chapter 1<br />
However the debate on biofuels in general and bio<strong>ethanol</strong> in particular shows a lot of<br />
counterarguments. �ey include that production of feeds<strong>to</strong>ck for <strong>ethanol</strong> might have<br />
negative environmental impacts on GHG, land use <strong>change</strong>, water consumption, biodiversity<br />
and air quality; also indirect negative environmental impacts are mentioned as a result of<br />
the interactions between di�erent land uses. �e development of biofuels, it is said, may<br />
also have both direct and indirect negative social and socio-economic impacts.<br />
A third point of view comes from developing countries being motivated <strong>to</strong> diversify energy<br />
sources. Speci�cally net importing countries, may consider enhancing their energy security<br />
by domestically produced <strong>ethanol</strong>. Quality of air might be another argument for countries<br />
where the vehicle �eet is old, causing huge polluting emissions. However, also for these<br />
countries the counterarguments are widely discussed. Will the bio<strong>ethanol</strong> production<br />
contribute <strong>to</strong> small farmers? And what will be the impact of production for bio<strong>ethanol</strong> on<br />
the food production in those countries. Next <strong>to</strong> possible environmental impacts, developing<br />
countries might decide <strong>to</strong> take irreversible decisions that might, according <strong>to</strong> this point of<br />
view, create more instead o� less poverty (Oxfam, 2008).<br />
8. The core of the debate<br />
�e debate on sugarcane <strong>ethanol</strong> contains several major issues. �e �rst one is impact of<br />
sugarcane production on land use <strong>change</strong> and <strong>climate</strong>. Here the assumption is made that<br />
land use for sugarcane implies serious impacts on the carbon s<strong>to</strong>ck, GHG emissions, and<br />
water and soil conditions. (Macedo et al., 2004). Also, the reallocation of land or land cleared<br />
for <strong>ethanol</strong> may have unforeseen impacts on biodiversity. �e main question here is, can<br />
production of sugarcane <strong>ethanol</strong> be sustainable?<br />
Second, the demand side of the sugarcane <strong>ethanol</strong> may have impacts on the au<strong>to</strong>motive<br />
industry, as happened in Brazil by the introduction of FFV’s. Here the assumption is that<br />
demand will not so much be geared by balanced growth of the supply, but by the price and<br />
attractiveness of new au<strong>to</strong>motive solutions. And this may have unintended consequences<br />
for sustainable production of sugarcane <strong>ethanol</strong> (Von Braun, 2006).<br />
�ird issue is the impact of new technologies on the e�ciency of biomass for biofuels and the<br />
conversion of biomass for <strong>ethanol</strong>. Here the assumption is that new technologies may provide<br />
not only higher e�ciency, but also the need for larger scale of operations, asking more land<br />
<strong>to</strong> be cleared for <strong>ethanol</strong> with possible negative environmental e�ects (Faaij, 2006).<br />
Fourth, the public policies may have positive e�ects on balanced growth of the <strong>ethanol</strong><br />
industry. However, these policies may also contribute <strong>to</strong> numerous dis<strong>to</strong>rtions in trade,<br />
consumption, supply and technology development and on the environment as well (Hertel<br />
et al., 2008).<br />
24 <strong>Sugarcane</strong> <strong>ethanol</strong>
Introduction <strong>to</strong> sugarcane <strong>ethanol</strong><br />
Fi�h, the debate also addresses the impacts of biofuels on developing countries. �ese<br />
societies may bene�t greatly by diversifying the energy matrix. However, unbalanced growth<br />
may have unintended consequences for the food security domestically and land use (Teixeira<br />
Coelho, 2005; Kojima and Johnson, 2005; Dufey et al., 2007).<br />
Sixth, the last issue deals with the food prices hike. How do biofuels rank as fac<strong>to</strong>r for<br />
explaining the food prices in 2007-2008 and, possibly, the coming years (Banse, 2008; Maros<br />
and Martin, 2008)? And how does <strong>ethanol</strong> �t in<strong>to</strong> this explanation and projection?<br />
�e impact studies are conducted from a multidisciplinary point of view. Also, the impacts<br />
are observed on di�erent scale levels: global, regional and on value chain level. Hence, the<br />
analysis focuses on land use dynamics, market demand, technology development and public<br />
policies. �ese four main fac<strong>to</strong>rs are assumed <strong>to</strong> contribute <strong>to</strong> the understanding of impacts<br />
of sugarcane <strong>ethanol</strong> on <strong>climate</strong> <strong>change</strong> mitigation and the environment. �e debate asks<br />
understanding based on the latest science based insights (�e Royal Society, 2008). �is<br />
book aims <strong>to</strong> contribute <strong>to</strong> present these insights.<br />
9. Structure of the book<br />
In Chapter 2 the debate on sugarcane <strong>ethanol</strong> focuses on land use from a global point of<br />
view. �ere are many competing demands for land: <strong>to</strong> grow crops for food, feed, �bre and<br />
fuel, for nature conservation, urban development and other functions. �e objective of the<br />
chapter is <strong>to</strong> analyze current and potential sugarcane production in the world and <strong>to</strong> provide<br />
an assessment of land suitable for sugarcane production.<br />
Considering the particular situation in Brazil, Chapter 3 discusses the prospects of the<br />
sugarcane production, considering land use allocation and the land use dynamics. It shows<br />
on an empirical basis the expected sugarcane land expansion. �is expansion is supposed<br />
<strong>to</strong> convert annual crops, permanent crops, pasture areas, natural vegetation and degraded<br />
areas. �e chapter presents substitution patterns based on a reference scenario for sugarcane<br />
and <strong>ethanol</strong> production.<br />
What are the impacts of sugarcane <strong>ethanol</strong> for the mitigation of GHG emissions? Chapter 4<br />
goes in<strong>to</strong> this debate. �e chapter compares the <strong>ethanol</strong> production in 2006 with a scenario<br />
for 2020. Next energy �ows and a life cycle analysis is presented. �en the e�ects on land<br />
use <strong>change</strong> on GHG emissions on global scale are discussed. Finally the chapter discusses<br />
the indirect e�ects of land use <strong>change</strong> in the Brazil.<br />
Chapter 5 addresses the question on environmental sustainability of the sugarcane <strong>ethanol</strong><br />
production in Brazil. Sustainable production is discussed worldwide. For bio<strong>ethanol</strong><br />
sustainability criteria vary among countries and institutions. Criteria that are pertinent in the<br />
debate are use of agricultural inputs, air quality and burning of sugarcane vs. mechanization,<br />
<strong>Sugarcane</strong> <strong>ethanol</strong> 25
Chapter 1<br />
use of water, soil, farm inputs such as fertilizer and the energy and carbon balance. �e<br />
chapter ends with the discussion on certi�cation and compliance<br />
Chapter 6 starts with the assessment of studies on the market potential of <strong>ethanol</strong>. �e<br />
demand predictions will be considered, taking in<strong>to</strong> consideration technological development<br />
and innovation. �e study provides an overview of the main issues and challenges related<br />
<strong>to</strong> the current and potential use of <strong>ethanol</strong> in the transport sec<strong>to</strong>r.<br />
In Chapter 7 the technology developments for bioenergy will be analyzed. It gives a state of<br />
the art overview of technologies for bioenergy production from biomass. Next the chapter<br />
highlights some challenges in developing technologies from biomass. Further it sheds light<br />
on some scenarios for technologies <strong>to</strong> be developed in the 10-15 years <strong>to</strong> come.<br />
As described earlier, public policies play a major role in the biofuel industry. What are the<br />
policies, what measures are implemented and what are the impacts? �is Chapter 8 will<br />
deal speci�cally with the policies originating from the United States of America and the<br />
European Union. �e chapter starts with an overview of policies and policy instruments of<br />
both. Next, these policies will be evaluated from an economic point of view. Based on this<br />
analysis, the impacts on the global biofuel industry will be considered.<br />
�ere is much debate on the impacts of biofuels on developing countries. Just positive, only<br />
negative? In Chapter 9 the impact will be discussed within the framework of the Millennium<br />
Development Goals (MDG). �e chapter will deal with the question: How can global biofuels<br />
industry support sustainable development and poverty reduction?<br />
�e book ends with the probably most heated debate: the impacts of bio fuels production<br />
on food prices. Chapter 10 covers the following questions: what is the state of the art: what<br />
are the relations between production of food and food prices and bio-fuels? �en the main<br />
drivers for the hike in food prices are discussed. Based on quantitative model studies some<br />
core �ndings will be presented. Finally, the chapter ends with the impacts of bio<strong>ethanol</strong> on<br />
food production and prices.<br />
References<br />
AgraFNP, 2008. June 24. Ethanol consumption and exports continue <strong>to</strong> increase.<br />
Banse, M., P. Nowicki and H. van Meijl, 2008. Why are current world food prices so high? A memo. LEI<br />
Wageningen UR, �e Hague, the Netherlands.<br />
Barriga, A., 2003. Energy System II. University of Calgary/OLADE, Qui<strong>to</strong>.<br />
Dufey, A., S. Vermeulen and B. Vorley, 2007. Biofuels: Strategic Choices for Commodity Dependent<br />
Developing Countries. Common Fund for Commodities Amsterdam, the Netherlands.<br />
Faaij, A., 2006. Modern Biomass Conversion Technologies. Mitigation and Adaptation Strategies for Global<br />
Change 11: 335-367.<br />
26 <strong>Sugarcane</strong> <strong>ethanol</strong>
Introduction <strong>to</strong> sugarcane <strong>ethanol</strong><br />
Hertel, T., W. W.E. Tyner and D.K. Birur, 2008. Biofuels for all? Understanding the Global Impacts of<br />
Multinational. Center for Global Trade Analysis Department of Agricultural Economics, Purdue<br />
University GTAP Working Paper No. 51, 2008.<br />
IEA, 2007. Bioenergy Potential contribution of bioenergy <strong>to</strong> the world’s future energy demand, International<br />
Energy Agency, Paris.<br />
IEA, 2008. Worldwide Trends in Energy Use and E�ciency Key Insights from IEA Indica<strong>to</strong>r Analysis,<br />
Paris, France.<br />
Khanna, M., H. Onal, B. Dhungana and M. Wander, 2007. Economics of Soil Carbon Sequestration �rough<br />
Biomass Crops. Association of Environmental and Resource Economists; Workshop Valuation and<br />
Incentives for Ecosystem Services, June 7-9, 2007.<br />
Kim, S. and B.E. Dale, 2005. Life cycle assessment of various cropping systems utilized for producing biofuels:<br />
Bio<strong>ethanol</strong> and biodiesel. Biomass and Bioenergy 29: 426-439.<br />
Kojima, M. and T. Johnson, 2005. Potential for biofuels for transport in developing countries. ESMAP,<br />
World Bank Copyright �e International Bank for Reconstruction and Development/�e World Bank,<br />
Washing<strong>to</strong>n D.C., USA.<br />
Latner, K., O. Wagner and J. Junyang, 2007. China, Peoples Republic of Bio-Fuels Annual 2007. GAIN Report<br />
Number: CH7039. USDA Foreign Agricultural Service, January 2007.<br />
Macedo, I.C., M.R.L.V. Leal and J.E.A.R. da Silva, 2004. Assessment of Greenhouse Gas Emissions in the<br />
Production and Use of Fuel Ethanol in Brazil. Report <strong>to</strong> the Government of the State of São Paulo, 2004.<br />
Maros, I. and W. Martin, 2008. Implications of Higher Global Food Prices for Poverty in Low-Income<br />
Countries. �e World Bank Development Research Group Trade Team April, Washing<strong>to</strong>n, USA.<br />
OECD, 2008. Economic assessment of biofuel support policies. Paris, France.<br />
OECD/IEA, 2008. Worldwide Trends in Energy Use and E�ciency Key Insights from IEA Indica<strong>to</strong>r Analysis.<br />
Paris, France.<br />
OESO, 2008. Economic assessment of biofuel support policies. Paris, France.<br />
Oxfam, 2008. Inconvenient Truth How biofuel policies are deepening poverty and accelerating <strong>climate</strong><br />
<strong>change</strong> Oxfam Brie�ng Paper, June 2008.<br />
Schuman, G.E., H.H. Janzen and J.E. Herrick, 2002. Soil carbon dynamics and potential carbon sequestration<br />
by rangelands. Environmental Pollution 116: 391-396.<br />
Teixeira Coelho, S., 2005. Biofuels- advantages and trade barriers. UNCTAD/DITC/TED/2005/1.<br />
�e Royal Society, 2008. Sustainable biofuels: prospects and challenges. London, United Kingdom. ISBN<br />
9780854036622.<br />
Von Braun, J., 2006. When Food Makes Fuel: �e Promises and Challenges of Biofuels. Ifpri. Washing<strong>to</strong>n, USA.<br />
<strong>Sugarcane</strong> <strong>ethanol</strong> 27
Chapter 2<br />
Land use dynamics and sugarcane production<br />
Günther Fischer, Edmar Teixeira, Eva Tothne Hizsnyik and Harrij van Velthuizen<br />
1. His<strong>to</strong>rical scale and dynamics of sugarcane production<br />
<strong>Sugarcane</strong> originates from tropical South- and Southeast Asia. Crystallized sugar, extracted<br />
from the sucrose s<strong>to</strong>red in the stems of sugarcane, was known 5000 years ago in India. In<br />
the 7 th century, the knowledge of growing sugarcane and producing sugar was transferred<br />
<strong>to</strong> China. Around the 8 th century sugarcane was introduced by the Arabs <strong>to</strong> Mesopotamia,<br />
Egypt, North Africa and Spain, from where it was introduced <strong>to</strong> Central and South<br />
America. Chris<strong>to</strong>pher Columbus brought sugarcane <strong>to</strong> the Caribbean islands, <strong>to</strong>day’s<br />
Haiti and Dominican Republic. Driven by the interests of major European colonial powers,<br />
sugarcane production had a great in�uence on many tropical islands and colonies in the<br />
Caribbean, South America, and the Paci�c. In the 20 th century, Cuba played a special role<br />
as main supplier of sugar <strong>to</strong> the countries of the Former USSR. In the last 30 years, Brazil<br />
wrote a new chapter in the his<strong>to</strong>ry of sugarcane production, the �rst time not driven by<br />
colonial powers and the consumption of sugar, but substantially driven by domestic policies<br />
fostering bio<strong>ethanol</strong> production <strong>to</strong> increase energy self-reliance and <strong>to</strong> reduce the import<br />
bill for petroleum.<br />
1.1. Regional distribution and dynamics of sugarcane production<br />
World crop and lives<strong>to</strong>ck statistics collected and published by the Food and Agriculture<br />
Organization (FAO) of the United Nation are available for years since 1950. According <strong>to</strong><br />
these data, world production of sugarcane at the mid of last century was about 260 million<br />
<strong>to</strong>ns produced on around 6.3 million hectares, i.e. an average yield of just over 40 <strong>to</strong>ns per<br />
hectare. Only 30 years later, in 1980, the global harvest of sugarcane had reached a level of<br />
some 770 million <strong>to</strong>ns cultivated on about 13.6 million hectares of land with an average yield<br />
of 57 <strong>to</strong>ns per hectare. Another nearly 30 years later, the estimates of sugarcane production<br />
for 2007 indicate more than doubling of outputs <strong>to</strong> 1525 million <strong>to</strong>ns from some 21.9 million<br />
hectares harvested sugarcane. In summary, the global harvest of sugarcane had a nearly sixfold<br />
increase from 1950 <strong>to</strong> 2007 while harvested area increased 3.5 times. During the same<br />
period average global sugarcane yield increased from 41.4 <strong>to</strong>ns per hectare in 1950 <strong>to</strong> 69.6<br />
<strong>to</strong>ns per hectare in 2007, i.e. a sustained average yield increase per annum of nearly 1%.<br />
Figure 1 shows the time development and broad regional distribution of sugarcane<br />
production and area harvested.<br />
<strong>Sugarcane</strong> <strong>ethanol</strong> 29
Chapter 2<br />
Production (million <strong>to</strong>ns)<br />
1600<br />
1400<br />
1200<br />
1000<br />
800<br />
600<br />
400<br />
200<br />
0<br />
1960<br />
1965<br />
1970<br />
1975<br />
1980<br />
1985<br />
1990<br />
1995<br />
2000<br />
2005<br />
Figure 1. Global sugarcane production 1960-2007, by broad geographic region. a: production (million<br />
<strong>to</strong>ns); b: area harvested (million hectares). Source: FAOSTAT, online database at http://www.fao.org,<br />
accessed July 2008.<br />
Table 1 indicates the main global players in sugarcane production. �e countries shown<br />
are listed in decreasing order of their sugarcane production in 2007. �e table includes all<br />
those countries, which ranked at least once among the 10 largest global producers in past<br />
decades since 1950, and shows their global production rank for each period.<br />
Table 2 indicates for the same countries level of production for respectively 1950 (three-year<br />
average for 1949-1951), 1960, etc., <strong>to</strong> 2000 (three-year average for 1999-2001), and for 2007.<br />
Table 3 presents associated harvested sugarcane areas.<br />
In 1950, and still in 1960, India and Cuba were the two largest sugarcane producers in the<br />
world. India continued <strong>to</strong> dominate sugarcane production until 1980, when Brazil <strong>to</strong>ok<br />
over the �rst rank both in terms of area harvested and sugarcane output. Cuba maintained<br />
rank three among global sugarcane producers until 1991. �en, however, with the collapse<br />
of the USSR, Cuba’s guaranteed sugar export market, the sugar industry in Cuba collapsed<br />
rapidly as well. As a result, sugarcane production in 2007 was only about one-eighth of the<br />
peak reached in 1990. Another example for the decline of Caribbean sugarcane industry<br />
is Puer<strong>to</strong> Rico, the world’s seventh largest producer in 1950, where sugarcane cultivation<br />
became uneconomical and was completely abandoned in recent years.<br />
�ough the FAO lists more than 100 countries where sugarcane is cultivated, Table 2 and 3<br />
indicate that global sugarcane production is fairly concentrated in only a few countries. �e<br />
15 <strong>to</strong>p countries listed in Table 1 account for about 85 percent of the harvested sugarcane<br />
area in 2007, and for a similar level in 1950 and the other periods shown. �e �rst three<br />
30 <strong>Sugarcane</strong> <strong>ethanol</strong><br />
Area harvested (million hectares)<br />
C.America<br />
Europe<br />
Oceania<br />
N.America<br />
22<br />
20<br />
18<br />
16<br />
14<br />
12<br />
10<br />
8<br />
6<br />
4<br />
2<br />
0<br />
1960<br />
Asia<br />
Africa<br />
S.America<br />
Caribbean<br />
1965<br />
1970<br />
1975<br />
1980<br />
1985<br />
1990<br />
1995<br />
2000<br />
2005
Table 1. Rank of major producers of sugarcane, 1950-2007.<br />
Land use dynamics and sugarcane production<br />
2007 1999-01 1989-91 1979-81 1969-71 1959-61 1949-51<br />
Brazil 1 1 1 1 1 2 3 3<br />
India 3 2 2 2 2 1 1 1<br />
China 1 3 3 4 5 8 6 8<br />
Thailand 1 4 4 6 12 20 27 43<br />
Pakistan 1 5 5 7 7 6 9 12<br />
Mexico 3 6 6 5 4 4 4 6<br />
Colombia 3 7 9 9 8 11 7 5<br />
Australia 1 8 7 12 10 9 12 11<br />
United States 2 9 10 10 9 7 5 4<br />
Philippines 3 10 11 11 6 5 8 10<br />
Indonesia 1 11 12 8 11 12 11 18<br />
South Africa 3 12 13 13 13 10 15 13<br />
Argentina 2 13 14 14 14 13 10 9<br />
Cuba 2 17 8 3 3 3 2 2<br />
Puer<strong>to</strong> Rico 2 >100 88 56 40 21 13 7<br />
Source: FAOSTAT, online database at http://www.fao.org, accessed July 2008; FAO, 1987.<br />
1 Countries that have significantly improved their rank in global production during the last five<br />
decades.<br />
2 Countries that have lost global importance in sugarcane production.<br />
3 Countries that occupied a rank in 2007 similar <strong>to</strong> their position in the 1950s.<br />
countries – Brazil, India and China – produced more than 60 percent of the global sugarcane<br />
harvest in 2007; Brazil alone contributed about one-third. Somewhat lower, but similar<br />
ratios hold for sugarcane area harvested in 2007: the <strong>to</strong>p three countries accounted for 58<br />
percent of land harvested, Brazil for about 30%, which indicates that these countries enjoy<br />
sugarcane yields above the world average.<br />
�e dominance of Brazil in global sugarcane production and expansion – Brazil accounted<br />
for 75 percent of sugarcane area increases in the period 2000 <strong>to</strong> 2007 and two-thirds of<br />
global production increases in that period – derives from its experience and capability <strong>to</strong><br />
respond <strong>to</strong> thriving international demand for transport fuels, which was recently triggered<br />
by measures <strong>to</strong> mitigate greenhouse gas emissions of the rapidly growing transport sec<strong>to</strong>r,<br />
concerns in developed countries <strong>to</strong> enhance energy security and lessen dependence on<br />
petroleum, and not the least the need of many developing countries <strong>to</strong> reduce import bills<br />
for fossil oil.<br />
<strong>Sugarcane</strong> <strong>ethanol</strong> 31
Chapter 2<br />
Table 2. <strong>Sugarcane</strong> production (million <strong>to</strong>ns) of major producers, 1950-2007.<br />
2007 1999-01 1989-91 1979-81 1969-71 1959-61 1949-51<br />
Brazil 514.1 335.8 258.6 147.8 78.5 56.6 32.2<br />
India 322.9 297.0 223.2 144.9 128.7 87.3 52.0<br />
China 105.7 75.1 63.9 33.8 19.6 15.0 8.0<br />
Thailand 64.4 51.3 37.0 17.7 5.4 1.9 0.3<br />
Pakistan 54.8 48.4 36.2 29.1 23.8 11.6 6.4<br />
Mexico 50.7 46.1 40.8 34.4 33.3 18.8 9.8<br />
Colombia 40.0 33.1 27.4 24.7 13.2 12.5 11.1<br />
Australia 36.0 35.3 24.2 23.4 17.6 9.4 6.5<br />
United States 27.8 32.1 26.6 24.5 21.4 16.0 13.5<br />
Philippines 25.3 25.6 25.2 31.5 25.3 12.0 7.1<br />
Indonesia 25.2 24.2 27.6 19.5 10.3 9.6 3.1<br />
South Africa 20.5 22.1 18.9 17.3 14.6 8.2 4.7<br />
Argentina 19.2 17.9 15.9 15.6 10.2 10.4 7.6<br />
Cuba 11.1 34.2 80.8 69.3 60.5 58.3 44.5<br />
Puer<strong>to</strong> Rico 0.0 0.1 0.9 2.0 5.0 9.4 9.7<br />
Sum of above 1,317.5 1,078.2 907.1 635.5 467.1 337.0 216.5<br />
World 1,524.4 1,259.4 1,053.5 768.1 576.3 413.0 260.8<br />
Source: FAOSTAT, online database at http://www.fao.org, accessed July 2008; FAO, 1987.<br />
Tables 1 <strong>to</strong> 3 point <strong>to</strong> two main fac<strong>to</strong>rs that underlie the dynamics of sugarcane cultivation<br />
during the last four decades: a four-fold expansion of sugarcane acreage in South America<br />
between 1960 and 2007, and a collapse of sugarcane cultivation in the Caribbean sugar<br />
islands, especially important Cuba and Puer<strong>to</strong> Rico, which still held a substantial production<br />
share until the late 1980s. Solid growth of production and about three-fold expansion of<br />
sugarcane acreage since 1960 occurred in Asia mainly fuelled by rapid domestic demand<br />
increases for sugar in China and India. Fuel <strong>ethanol</strong> production from sugarcane has<br />
played a minor role in these dynamics with the exception of Brazil where it caused a large<br />
expansion.<br />
An additional fac<strong>to</strong>r promoting the global expansion of sugarcane cultivation is the plant’s<br />
e�cient agronomic performance and its comparative advantage relative <strong>to</strong> sugar beets.<br />
While post-war self-reliance policies and protection of agriculture in developed countries<br />
supported an expansion of sugar beet cultivation areas until the late 1970s, the last three<br />
decades witnessed a gradual decline in harvested areas of sugar beet and increasingly a<br />
substitution of temperate sugar beets as a raw material for sugar production with tropical<br />
sugarcane (Figure 2). Regional <strong>change</strong>s of sugarcane cultivation are shown in Figure 3.<br />
32 <strong>Sugarcane</strong> <strong>ethanol</strong>
Land use dynamics and sugarcane production<br />
Table 3. <strong>Sugarcane</strong> area harvested (million hectares) in major producing countries, 1950-2007.<br />
2007 1999-01 1989-91 1979-81 1969-71 1959-61 1949-51<br />
Brazil 6,712 4,901 4,092 3,130 1,830 1,400 1,307<br />
India 4,830 4,197 3,699 3,073 2,486 2,428 2,011<br />
China 1,225 1,171 1,230 722 566 279 414<br />
Thailand 1,010 903 897 549 159 62 53<br />
Pakistan 1,029 1,042 888 894 574 407 418<br />
Mexico 680 628 556 520 483 352 325<br />
Colombia 450 400 344 270 260 294 280<br />
Australia 420 412 333 314 234 159 131<br />
United States 358 412 374 306 282 184 176<br />
Philippines 400 365 367 409 446 240 205<br />
Indonesia 350 381 392 234 77 75 62<br />
South Africa 420 392 272 252 181 96 110<br />
Argentina 290 282 258 314 242 218 264<br />
Cuba 400 1,015 1,372 1,246 1,254 1,218 1,097<br />
Puer<strong>to</strong> Rico 0 3 16 25 61 129 133<br />
Sum of above 18,574 16,504 15,089 12,257 9,134 7,539 6,986<br />
World 21,896 19,476 17,729 14,708 11,025 8,946 8,302<br />
Source: FAOSTAT, online database at http://www.fao.org, accessed July 2008; FAO, 1987.<br />
1.2. Global significance of <strong>ethanol</strong> production from sugarcane<br />
As shown in the previous analysis, for most of the 20 th century sugarcane production <strong>to</strong>ok<br />
place in response <strong>to</strong> global demand for sugar, was largely conditioned by the heritage of<br />
colonial structures, and was greatly in�uenced by policy and trade agreements. With the<br />
launching of the PROALCOOL program in Brazil in the mid 1970s another important<br />
demand fac<strong>to</strong>r entered the scene, initially of national importance only. As a consequence<br />
of the program however Brazil became the largest sugarcane producer in the world and by<br />
now the largest exporter of transport bio<strong>ethanol</strong>.<br />
Figure 4 shows the dynamics of area expansion for sugarcane cultivation in Brazil and<br />
indicates the signi�cant amount of land dedicated <strong>to</strong> <strong>ethanol</strong> production and the important<br />
role of the <strong>ethanol</strong> program in this process. �e �gure illustrates three phases that characterize<br />
the last three decades. In the �rst decade a�er launching the PROALCOOL program, i.e.<br />
during 1975 <strong>to</strong> 1986, there was a sharp increase in Brazilian sugarcane area, which is entirely<br />
due <strong>to</strong> the domestic feeds<strong>to</strong>ck demand of the <strong>ethanol</strong> program. �en, during 1986 <strong>to</strong> 2000,<br />
the �gure suggests a growth of sugar production but a phase of stagnation in <strong>ethanol</strong><br />
<strong>Sugarcane</strong> <strong>ethanol</strong> 33
Chapter 2<br />
Harvested area (million hectares)<br />
30<br />
25<br />
20<br />
15<br />
10<br />
5<br />
0<br />
1960<br />
1965<br />
1970<br />
1975<br />
1980<br />
1985<br />
1990<br />
1995<br />
2000<br />
2005<br />
Cane<br />
Beet<br />
Yields (<strong>to</strong>ns per hectare)<br />
Figure 2. Harvested area and yields of sugarcane and sugar beet, 1960-2007. Source: FAOSTAT,<br />
online database at http://www.fao.org, accessed July 2008.<br />
production, which has been attributed <strong>to</strong> various national and international fac<strong>to</strong>rs, not<br />
the least a low price of petroleum. Finally, the most rapid expansion of sugarcane harvested<br />
areas occurred a�er 2000 and in particular during 2005 <strong>to</strong> 2008. �is time <strong>ethanol</strong> demand<br />
<strong>to</strong> substitute for gasoline consumption became a driving force at the global level, with many<br />
countries seeking ways <strong>to</strong> cut greenhouse gas emissions and reducing dependence of their<br />
economies on imported fossil oil.<br />
In recent years, biofuels have re-emerged as a possible option in response <strong>to</strong> <strong>climate</strong> <strong>change</strong>,<br />
and also <strong>to</strong> concerns over energy security. At the same time, many concerns among experts<br />
worldwide have been raised about the e�ectiveness <strong>to</strong> achieve these goals and the possible<br />
negative impacts on the poor, in particular regarding food security (Scharlemann and<br />
Laurance, 2008) and environmental consequences.<br />
Recent sharp increases of agricultural prices have partly been blamed on rapid growth of<br />
biofuel production, especially maize-based <strong>ethanol</strong> production in the United States, which<br />
in 2007 absorbed more than a quarter of the US maize harvest. How important is sugarcane<br />
in this respect, and what fraction of the global sugar harvest is currently used for <strong>ethanol</strong><br />
production?<br />
Figure 5 shows world fuel <strong>ethanol</strong> production, which is dominated by two producers, the<br />
USA and Brazil. In 2008 these two countries contribute nearly 90 percent of <strong>to</strong>tal fuel<br />
<strong>ethanol</strong> production. �ough detailed data on used feeds<strong>to</strong>cks are di�cult <strong>to</strong> obtain, it can<br />
be concluded that 45-50% of the world fuel <strong>ethanol</strong> production is based on sugarcane,<br />
requiring some 280 <strong>to</strong> 300 million <strong>to</strong>ns of sugarcane from an estimated 3.75 million hectares<br />
harvested area (Table 4).<br />
34 <strong>Sugarcane</strong> <strong>ethanol</strong><br />
80<br />
70<br />
60<br />
50<br />
40<br />
30<br />
20<br />
10<br />
0<br />
1960<br />
1965<br />
1970<br />
1975<br />
1980<br />
1985<br />
1990<br />
1995<br />
2000<br />
2005<br />
Cane<br />
Beet
A 8<br />
B<br />
3.0<br />
million hectares<br />
million hectares<br />
7<br />
6<br />
5<br />
4<br />
3<br />
2<br />
1<br />
0<br />
10<br />
9<br />
8<br />
7<br />
6<br />
5<br />
4<br />
3<br />
2<br />
1<br />
0<br />
Other<br />
Argentina<br />
Colombia<br />
Brazil<br />
Other<br />
Indonesia<br />
Thailand<br />
Pakistan<br />
China<br />
India<br />
million hectares<br />
Land use dynamics and sugarcane production<br />
Figure 3. Change in sugarcane cultivation 1960-2007, by broad geographic region. a: South America<br />
(million hectares); b: Central America & Caribbean; c: Asia (million hectares); d: Africa (million<br />
hectares). Source: FAOSTAT, online database at http://www.fao.org, accessed July 2008.<br />
Table 4 and 5 summarize the available data for two time points, 1969-71 and 2007. Apart<br />
from basic sugarcane statistics, the regional land-use signi�cance of sugarcane is shown in<br />
terms of percentage of cultivated land used for sugarcane cultivation. For 1970, the region<br />
of Central America & Caribbean had the highest share where an estimated 7 percent of<br />
cultivated land was used for growing sugarcane. At that time, Brazil devoted 4.4 percent of<br />
cultivated land <strong>to</strong> sugarcane. In comparison, in year 2007 just over 10 percent of cultivated<br />
land were in use in Brazil <strong>to</strong> serve the sugar and <strong>ethanol</strong> industries. As a consequence, at the<br />
regional scale South America shows the highest share in 2007, now allocating 6.6 percent<br />
<strong>Sugarcane</strong> <strong>ethanol</strong> 35<br />
2.5<br />
2.0<br />
1.5<br />
1.0<br />
0.5<br />
0.0<br />
C D 1.8<br />
1960<br />
1960<br />
1965<br />
1970<br />
1975<br />
1980<br />
1985<br />
1990<br />
1995<br />
1965<br />
1970<br />
1975<br />
1980<br />
1985<br />
1990<br />
1995<br />
2000<br />
2005<br />
2000<br />
2005<br />
million hectares<br />
1.6<br />
1.4<br />
1.2<br />
1.0<br />
0.8<br />
0.6<br />
0.4<br />
0.2<br />
0.0<br />
1960<br />
1965<br />
1970<br />
1975<br />
1980<br />
1985<br />
1990<br />
1995<br />
2000<br />
2005<br />
Other<br />
Guatemala<br />
Cuba<br />
Mexico<br />
1960<br />
1965<br />
1970<br />
1975<br />
1980<br />
1985<br />
1990<br />
1995<br />
2000<br />
2005<br />
Northern<br />
Western<br />
Middle<br />
Southern<br />
Eastern
Chapter 2<br />
million hectares<br />
8<br />
7<br />
6<br />
5<br />
4<br />
3<br />
2<br />
1<br />
Phase 1: 1:<br />
rapid expansion<br />
driven by policy<br />
Phase 3: 3:<br />
rapid expansion driven by<br />
domestic and intern. demand<br />
Phase 2: 2:<br />
stagnation of<br />
<strong>ethanol</strong> program<br />
0<br />
1960 1964 1968 1972 1976 1980 1984 1988 1992 1996 2000 2004 2008<br />
Ethanol<br />
Sugar<br />
Figure 4. Use of Brazilian sugarcane land for <strong>ethanol</strong> and sugar production. Source: FAOSTAT, 2008;<br />
Conab, 2008a; Licht, 2007, 2008; calculation by authors.<br />
billion litres/year<br />
70<br />
60<br />
50<br />
40<br />
30<br />
20<br />
10<br />
0<br />
1975 1978 1981 1984 1987 1990 1993 1996 1999 2002 2005 2008<br />
Others<br />
China<br />
EU<br />
USA<br />
Brazil<br />
Figure 5. World fuel <strong>ethanol</strong> production (billion liters/year). Source: Licht, 2007 and 2008.<br />
of <strong>to</strong>tal cultivated land <strong>to</strong> sugarcane. In comparison, the countries holding rank two and<br />
three in global production, India and China, devoted respectively 2.8 and 1.0 percent of<br />
cultivated land <strong>to</strong> sugarcane. �e estimate for the global level amounts <strong>to</strong> 1.4 percent, i.e.<br />
36 <strong>Sugarcane</strong> <strong>ethanol</strong>
Table 4. Global significance of sugarcane production in 2007.<br />
Ethanol<br />
% of sugarcane<br />
<strong>Sugarcane</strong><br />
<strong>ethanol</strong> land<br />
<strong>Sugarcane</strong> Cultivated<br />
land 1<br />
percent<br />
million ha<br />
<strong>Sugarcane</strong><br />
% of <strong>to</strong>tal<br />
cultivated<br />
percent<br />
million ha<br />
Yield<br />
<strong>to</strong>ns/ha<br />
Production<br />
million <strong>to</strong>ns<br />
Harvested<br />
million ha<br />
North America 0.4 28 77.6 229.3 0.2 0 0<br />
Europe & Russia < 0.1 < 1 61.4 296.4 0.0 0 0<br />
Oceania & Polynesia 0.5 40 79.9 54.8 0.9 0 0<br />
Asia 9.6 639 66.4 577.1 1.7 < 0.1 < 1<br />
Africa 1.6 92 56.8 239.3 0.7 < 0.1 < 1<br />
Centr. Am. & Carib. 1.8 114 63.4 42.9 4.2 < 0.1 1<br />
South America 8.0 611 76.5 121.9 6.6 3.6 45<br />
Developed 0.9 67 78.9 580.4 0.1 0 0<br />
Developing 21.0 1457 69.2 981.3 2.1 3.8 17.8<br />
World 21.9 1524 69.6 1561.7 1.4 3.8 17.1<br />
Land use dynamics and sugarcane production<br />
Brazil 6.7 514 76.6 66.6 10.1 3.5 50<br />
India 4.8 323 72.6 169.7 2.8 < 0.1 n.a.<br />
China 1.4 106 86.2 140.0 1.0 < 0.2 n.a.<br />
Thailand 1.0 64 63.7 17.8 5.7 < 0.1 3<br />
Pakistan 1.0 55 53.2 22.1 4.7 0 n.a.<br />
Source: FAOSTAT, 2008; Licht, 2007, 2008; calculation by the authors.<br />
1 Estimates of cultivated land refer <strong>to</strong> year 2005.<br />
<strong>Sugarcane</strong> <strong>ethanol</strong> 37
Chapter 2<br />
Table 5. Global significance of sugarcane production in 1969-71.<br />
<strong>Sugarcane</strong> Cultivated<br />
land<br />
Harvested<br />
million ha<br />
Production<br />
million <strong>to</strong>ns<br />
Yield<br />
<strong>to</strong>ns/ha<br />
million ha<br />
North America 0.2 21 89.8 243.4 0.1<br />
Europe & Russia < 0.1 < 1 72.1 378.3 0.0<br />
Oceania & Polynesia 0.3 20 75.0 46.2 0.6<br />
Asia 4.6 227 49.5 448.7 1.0<br />
Africa 0.7 47 66.2 180.5 0.4<br />
Centr. Am. & Carib. 2.5 132 53.9 34.9 7.0<br />
South America 2.5 128 51.7 90.6 2.7<br />
Developed 0.5 42 82.8 667.9 0.1<br />
Developing 10.2 534 52.2 754.6 1.4<br />
World 10.7 576 53.7 1422.6 0.8<br />
Brazil 1.8 78 45.9 41.3 4.4<br />
India 2.5 129 48.9 164.7 1.5<br />
China 0.6 20 41.3 102.5 0.6<br />
Thailand 0.1 5 44.5 13.7 0.4<br />
Pakistan 0.6 24 39.9 19.3 3.0<br />
Source: FAOSTAT, 2008.<br />
<strong>Sugarcane</strong><br />
% of <strong>to</strong>tal<br />
cultivated<br />
percent<br />
sugarcane harvested was 22 million hectares out of 1562 million <strong>to</strong>tal cultivated land. In<br />
comparison, the share of sugarcane in global cultivated land was 0.8 percent in 1970, which<br />
means that nearly a doubling of the global signi�cance of sugarcane has occurred in the<br />
last three decades.<br />
At �rst glance, the rather low percentage of global cultivated land occupied by sugarcane<br />
suggests that sugarcane area expansion and associated land competition has had little<br />
in�uence on food supply. Yet, this may be misleading for two reasons: (1) sugarcane is<br />
cultivated either under irrigation (e.g. India and Pakistan) or in rain-fed tropical areas with<br />
ample rainfall. Hence land productivity in areas suitable for rain-fed sugarcane production<br />
is typically much higher than for cultivated land in cooler <strong>climate</strong>s or arid sub-tropical and<br />
tropical agriculture; and (2) large parts of the world cannot grow sugarcane for climatic<br />
reasons and the impact in climatically suitable areas is therefore more signi�cant, as shown<br />
in Table 6.<br />
38 <strong>Sugarcane</strong> <strong>ethanol</strong>
Table 6. Global significance of sugarcane production in 2007 revisited.<br />
<strong>Sugarcane</strong><br />
harvested<br />
area<br />
million ha<br />
Land use dynamics and sugarcane production<br />
�e global analysis clearly shows that the most signi�cant and relevant land use <strong>change</strong><br />
dynamics related <strong>to</strong> sugarcane in the last decades have taken place in Brazil. In the following<br />
we take a short look at the Brazilian development and some issues and questions this<br />
development has raised.<br />
1.3. <strong>Sugarcane</strong> and land use <strong>change</strong> dynamics in Brazil<br />
Cultivated land <strong>Sugarcane</strong> harvested<br />
Total<br />
million ha<br />
With<br />
sugarcane<br />
potential<br />
million ha<br />
% of <strong>to</strong>tal<br />
cultivated<br />
land<br />
percent<br />
% of<br />
cultivated<br />
land with<br />
sugarcane<br />
potential<br />
percent<br />
North America 0.4 229.3 17.6 0.2 2.0<br />
Europe & Russia < 0.1 296.4 0.8 0.0 0.1<br />
Oceania & Polynesia 0.5 54.8 2.5 0.9 19.5<br />
Asia 9.6 577.1 213.3 1.7 4.5<br />
Africa 1.6 239.3 81.6 0.7 2.0<br />
Centr. Am. & Carib. 1.8 42.9 28.0 4.2 6.4<br />
South America 8.0 121.9 90.2 6.6 8.9<br />
Developed 0.9 580.4 19.5 0.1 4.4<br />
Developing 21.0 981.3 414.4 2.1 5.1<br />
World 21.9 1561.7 434.0 1.4 5.0<br />
Brazil 6.7 66.6 57.3 10.1 11.7<br />
India 4.8 169.7 70.1 2.8 6.8<br />
China 1.4 140.0 12.4 1.0 11.3<br />
Thailand 1.0 17.8 17.0 5.7 5.9<br />
Pakistan 1.0 22.1 15.6 4.7 6.4<br />
Source: FAOSTAT, 2008; Fisher et al., 2008.<br />
Brazil has the largest area under sugarcane cultivation in the world, being responsible for<br />
approximately one third of the global harvested area and production. For the year 2007,<br />
6.7 million hectares were harvested with a production of 514 million <strong>to</strong>ns of sugarcane<br />
<strong>Sugarcane</strong> <strong>ethanol</strong> 39
Chapter 2<br />
(FAOSTAT, 2008). �e land use <strong>change</strong> in<strong>to</strong> sugarcane production is part of the his<strong>to</strong>ry of<br />
the country, dating short a�er Portuguese colonization during the 16 th century. Since then,<br />
the crop has maintained its characteristic of a monoculture with high elasticity of supply,<br />
expanding rapidly in response <strong>to</strong> market stimuli (Tercil et al., 2007). �e �rst establishment<br />
phase of the crop over native vegetation aimed <strong>to</strong> provide sugar <strong>to</strong> the growing European<br />
market during colonial times, during this period plantations were established in the North-<br />
East and South-East of the country where agro-ecological conditions are highly favorable<br />
for the growth of tropical grasses such as sugarcane (e.g. see Figure 2.10 in next section).<br />
From 2000 <strong>to</strong> 2007, an impressive pace of approximately 300 thousand hectares of land was<br />
converted in<strong>to</strong> sugarcane every year (FAOSTAT, 2008). �is already phenomenal rate of<br />
conversion is being surpassed by recent projections for the 2007/08 harvest season, which<br />
indicate an expansion of 650 thousand hectares in Brazil (Conab, 2008a). Most of the recent<br />
expansion in sugarcane area has occurred in São Paulo state (Conab, 2008a). From 1995 <strong>to</strong><br />
2007, there was a 70% enlargement of the sugarcane area in São Paulo, from 2.26 million<br />
ha <strong>to</strong> 3.90 million ha, which represents 58% of the Brazilian area under sugarcane (IEA,<br />
2007). In response <strong>to</strong> a greater demand for <strong>ethanol</strong>, São Paulo is also the region where most<br />
of the land use <strong>change</strong> in<strong>to</strong> sugarcane plantation is expected <strong>to</strong> take place in the near future<br />
(Goldemberg et al., 2008). �e projected expansion of sugarcane for the 2007/08 harvest<br />
season is 350 thousand hectares, i.e. 54% of the Brazilian <strong>to</strong>tal (Conab, 2008b). �erefore, we<br />
further discuss the aspects of land use <strong>change</strong> in Brazil with special attention on São Paulo<br />
as an example of intensive conversion of other land uses in<strong>to</strong> sugarcane monocultures.<br />
�e basis for the success of the crop in the South-East of Brazil is the favorable environmental<br />
conditions in terms of temperature, radiation, precipitation, soil characteristics and relief that<br />
match the crop physiological requirements. �e potential <strong>to</strong> achieve high yields, <strong>to</strong>day an<br />
average near 80 t/ha (Conab 2008b), has diluted �xed production costs and has established<br />
Brazilian <strong>ethanol</strong> as one of the most competitive bio-fuel options with an estimated cost of<br />
US$ 0.21/liter (Goldemberg, 2007).<br />
1.4. What are the drivers for these <strong>change</strong>s in Brazil?<br />
�e main drivers for the recent expansion of sugarcane in Brazil, particularly São Paulo, were<br />
market opportunities created by the international demand for sugar and <strong>ethanol</strong> in conjunction<br />
with national policies that promoted <strong>ethanol</strong> production and commercialization. During<br />
these periods, intense and initially heavily subsidized investments (e.g. PROALCOOL in mid<br />
70’s) allowed the development of a solid industrial capacity and know-how (Goldemberg,<br />
2006). �e his<strong>to</strong>rical background of sugarcane as a traditional land use and the investments<br />
in the <strong>ethanol</strong> production chain created ideal conditions for the development of indigenous<br />
technologies on agronomical (e.g. plant nutrition, management and high yielding genetic<br />
material) and industrial aspects of production. For example, the �exibility <strong>to</strong> shi� between<br />
sugar and <strong>ethanol</strong> production (mixed production units) mitigates �uctuations on the<br />
40 <strong>Sugarcane</strong> <strong>ethanol</strong>
Land use dynamics and sugarcane production<br />
demand side, which makes the business highly attractive as a land use option. Currently,<br />
mixed production units process 85.4% of Brazil’s industrialized sugarcane (Conab, 2008b).<br />
Another aspect that favors rapid expansion of sugarcane in Brazil is the current land tenure<br />
structure in this agri-business. �ere is a large concentration of land in the hands of the<br />
industry, 67% of Brazilian sugarcane producing areas (Conab, 2008b). �e operation<br />
of extensive sugarcane farms reduces the cost of production through economy of scale<br />
(Goldemberg, 2006) contributing <strong>to</strong> the overall competitiveness of sugarcane production<br />
in relation <strong>to</strong> other land uses options. Finally, the environmental conditions in vast areas<br />
of Brazil’s arable land are adequate not only for achieving high sugarcane yields (see Figure<br />
10) but also high sucrose concentrations, i.e. a cool and dry winter period in São Paulo<br />
favors accumulation of sugar, which increases industrial e�ciency (Conab, 2008b). In<br />
combination, these favorable biophysical conditions and socio-economical his<strong>to</strong>rical aspects<br />
produced a setting for e�ective response <strong>to</strong> political and market stimuli explaining the rapid<br />
expansion of sugarcane monoculture in Brazil.<br />
1.5. What have been the impacts on environmental parameters?<br />
�e recent boom of <strong>ethanol</strong> production has drawn international attention <strong>to</strong> the environmental<br />
impacts of land conversion in<strong>to</strong> sugarcane monocultures. Site-speci�c biophysical and socioeconomical<br />
aspects largely determine the impacts of land use <strong>change</strong>. �e conversion of land<br />
use, its susceptibility <strong>to</strong> land degradation and the choice of agronomic and agro-processing<br />
technologies for sugarcane production and conversion determine the magnitude of impacts<br />
on environmental quality at the local level. Major areas of concern include deforestation and<br />
threats <strong>to</strong> biodiversity, environmental pollution and competition with food crops.<br />
1.5.1. Deforestation and threats <strong>to</strong> biodiversity<br />
�e expansion of sugarcane could increase deforestation rates either ‘directly’ by intruding<br />
in areas of native non-protected forest areas or ‘indirectly’ by forcing other land uses (e.g.<br />
displaced lives<strong>to</strong>ck production and agricultural crops such as soybeans) <strong>to</strong> open up new<br />
land. Past surges of sugarcane expansion in Brazil are not regarded as a major cause of<br />
deforestation (Martinelli and Filoso, 2008). �e current sugarcane area represents only<br />
2.5% of the 264 million ha of agricultural land use in Brazil, of which nearly 200 million<br />
ha are pas<strong>to</strong>ral lands. �e hotspots of deforestation in the Amazon region, however have<br />
a low suitability for sugarcane production and are not directly threatened by the current<br />
sugarcane expansion (Smeets et al., 2008). Amazon deforestation has been caused mainly by<br />
conversion <strong>to</strong> pas<strong>to</strong>ral lands for lives<strong>to</strong>ck production and, more recently, also for expansion<br />
of soybean production (Fearnside, 2005).<br />
From 1988 <strong>to</strong> 2007 the average rate of expansion of sugarcane was 0.14 million ha/year when<br />
rates of Amazon deforestation ranged from ~1.1 <strong>to</strong> 2.9 million ha per year (Fearnside, 2005)<br />
<strong>Sugarcane</strong> <strong>ethanol</strong> 41
Chapter 2<br />
indicating that sugarcane expansion is by far insu�cient <strong>to</strong> have forced ‘direct’ or the ‘indirect’<br />
reallocation of pasture and soybeans northwards intruding in<strong>to</strong> Amazon rainforests.<br />
Currently, the savannah region (‘Cerrados’), considered a world bio-diversity hotspot (Myers<br />
et al., 2000), is the ecosystem most threatened by sugarcane expansion in Brazil as it is<br />
situated on the frontier of agricultural expansion and has at least partly excellent cultivation<br />
potentials (Klink and Machado 2005; Smeets et al. 2008). �e Cerrado is characterized by<br />
high biodiversity (e.g. >6.5 thousand plants species from which 44% are endemic <strong>to</strong> the<br />
biome) and has su�ered rates of conversion <strong>to</strong> either cultivated pasture land or <strong>to</strong> crop<br />
cultivation land that are higher than the deforestation rates in Amazon (Conservation<br />
International, 2008; Klink and Machado, 2005). In 2002, nearly 40% of a <strong>to</strong>tal of about<br />
205 million ha of Cerrado had already been converted (Table 7), mainly in<strong>to</strong> pastures and<br />
cash-crops such as soybeans (Machado et al., 2004; Sano et al., 2008).<br />
From the early 1970s <strong>to</strong> 2000 around 0.36 million ha of Cerrado vegetation were lost in<br />
São Paulo (Florestar, 2005). However, from 2001 <strong>to</strong> 2005, <strong>to</strong>tal native vegetation areas in<br />
this state were maintained at about 3.15 million ha suggesting that more recent sugarcane<br />
expansion was not a major lever of deforestation during this period. Nevertheless, speci�c<br />
ecological systems such as riparian forests were highly a�ected in regions of intensive<br />
sugarcane production <strong>to</strong> give way <strong>to</strong> cropping areas (Martinelli and Filoso, 2008). In major<br />
watersheds in São Paulo State, where pastures and sugarcane are the main land uses, it is<br />
Table 7. Land use shares of the Brazilian Cerrado region in 2002 (Adapted from Sano et al., 2008<br />
and Ministério do Meio Ambiente, 2007).<br />
Land use classes Area (million ha) Percent of <strong>to</strong>tal<br />
Native areas 124 60%<br />
Native forest 75 37%<br />
Native non-forest 1 48 24%<br />
Anthropic areas 80 39%<br />
Cultivated pastures 54 26%<br />
Agriculture 21 10%<br />
Reforestation 3 2%<br />
Urbanized plus mining 1
Land use dynamics and sugarcane production<br />
shown that 75% of the riparian vegetation (a reservoir of biodiversity and a bu�er against<br />
sedimentation of water bodies) had disappeared (Silva et al., 2007).<br />
1.5.2. Air, water and soil pollution and degradation<br />
During the past surges of sugarcane expansion, cases of environmental pollution were<br />
identi�ed at di�erent stages of production and industrialization. �e impacts on air, water<br />
and soil quality largely depend on the choices of technologies applied in agronomic and<br />
agro-processing practices. Beyond carbon releases and biodiversity losses caused by land<br />
conversion (discussed above), the main environmental e�ects concern air pollution from<br />
pre-harvest sugarcane burning, water pollution from cultivation and processing of sugarcane,<br />
and soil erosion and compaction as a consequence of sugarcane cultivation.<br />
For example, air quality is highly compromised by the common practice of sugarcane<br />
burning, a technique used before harvest <strong>to</strong> facilitate manual cutting. �e emission of<br />
pollutants during the dry months of the year, when harvest occurs in São Paulo, has direct<br />
negative impacts on health (e.g. respira<strong>to</strong>ry disorders mainly in children and elderly<br />
citizens). It promotes erosion of <strong>to</strong>psoil, causes loss of nutrients and leads <strong>to</strong> soil compaction<br />
(Tominaga et al., 2002; Cançado et al., 2006; Ribeiro, 2008).<br />
Soil degradation through erosion and compaction are also considered a problem in sugarcane<br />
�elds, which are under intense mechanization during soil cultivation and harvesting<br />
(Martinelli and Filoso, 2008). Soil compaction is a consequence of the tra�c of heavy<br />
machinery in conjunction with the lack of implementation of best management cultivation<br />
practices (Naseri et al., 2007). Compaction exacerbates erosion problems because soil<br />
porosity is reduced, which decreases water in�ltration and increases runo� (Oliveira et al.,<br />
1995; Martinelli and Filoso 2008). �e main periods when soil remains bare and subjected <strong>to</strong><br />
erosive forces by rain and winds are (1) during the process of land conversion, (2) between<br />
crop harvesting and subsequent canopy closure, and (3) during re-planting of sugarcane<br />
�elds every 5-6 years. �e conversion of natural vegetation and extensive pastures (which<br />
are less intensively managed) in<strong>to</strong> sugarcane increases the risk soil degradation (Politano<br />
and Pissarra, 2005). Erosion rates of 30 Mg of soil/ha.year were estimated for sugarcane<br />
�elds in the São Paulo State in comparison with less than 2 Mg/ha.year for pastures and<br />
other natural vegetation (Sparovek and Schnug, 2001). Soil erosion in poorly managed<br />
sugarcane areas also causes sediment deposition in<strong>to</strong> water reservoirs, wetlands, streams<br />
and rivers (Politano and Pissarra, 2005). �is is aggravated by the transport of fertilizer and<br />
agro-chemical residues that directly compromise water quality (Corbi et al., 2006).<br />
Water pollution has been a severe environmental problem in sugarcane production regions<br />
until early 80’s in Brazil when legislation was implemented <strong>to</strong> ban direct discharge of<br />
vinasse (Martinelli and Filoso, 2008; Smeets et al., 2008). �e main industrial sources of<br />
pollutants of sugarcane industry are wastewater from washing of stems before processing<br />
<strong>Sugarcane</strong> <strong>ethanol</strong> 43
Chapter 2<br />
and vinasse produced during distillation. �ese by-products have a large potential of<br />
water contamination due <strong>to</strong> a high concentration of organic matter, which increases the<br />
biochemical oxygen demand (BOD 5 ) of water bodies receiving such e�uents (Gunkel et al.,<br />
2007). While the Brazilian standards for wastewater emission are BOD 5 of 60 mg/l, values<br />
for wastewater from cane washing are up <strong>to</strong> 500 mg/l and > 1.000 mg/l for vinasse (Gunkel<br />
et al., 2007; Smeets et al., 2008). In addition, agro-chemicals residues have been found as a<br />
important component of water pollution in areas of intense sugarcane production (Corbi<br />
et al., 2006; Silva et al., 2008).<br />
1.5.3. Land use and competition with food crops<br />
A major area of concern is the threat <strong>to</strong> food security (Goldemberg et al., 2008). Rapid<br />
expansion of sugarcane areas could potentially reduce the availability of arable land for the<br />
cultivation of food and feed crops causing a reduction in their supply and increase of food<br />
prices. Fast rates of expansion of sugarcane in São Paulo state in the mid 70s at the expense<br />
of maize and rice cropping areas seem <strong>to</strong> have had a short-term impact on regional food<br />
supply and prices (Saint, 1982). However, the recent sugarcane expansion in São Paulo from<br />
mid 90’s has not compromised food crop production as most of the expansion intruded in<br />
pas<strong>to</strong>ral lands (Figure 6).<br />
For Brazil as a whole, in the 2006/07 season, nearly two thirds of sugarcane expansion<br />
occurred at the expense of pastures (0.42 million ha) in comparison with one quarter coming<br />
from land under crop cultivation (Conab, 2008b). �is conversion of pastures in<strong>to</strong> sugarcane<br />
Area (million hectares)<br />
16<br />
14<br />
12<br />
10<br />
8<br />
6<br />
4<br />
2<br />
0<br />
1983 1988 1993 1998 2003<br />
Grain crops<br />
<strong>Sugarcane</strong><br />
Pasture natural<br />
Pasture cultivated<br />
Figure 6. Evolution of areas of sugarcane, pasture and grain crops in São Paulo State. Source: IEA,<br />
2007; Conab, 2008c. Note: The <strong>to</strong>tal area of São Paulo State is 24.8 million ha.<br />
44 <strong>Sugarcane</strong> <strong>ethanol</strong>
Land use dynamics and sugarcane production<br />
areas is explained by their relative abundance (200 million ha) as well as occurrence adjacent<br />
<strong>to</strong> existing sugarcane estates (Goldemberg et al., 2008).<br />
�e area of main grain crops has decreased by 0.9 million ha in the State of São Paulo from<br />
early 80’s <strong>to</strong> 2005 (Conab, 2008c), while sugarcane area expanded nearly 1.7 million ha (IEA<br />
2007), Figure 7. At the national level the magnitude of these regional land use <strong>change</strong>s is<br />
diluted (Figure 8) as the <strong>to</strong>tal area of major crops, including sugarcane, is about 50 million<br />
ha (Conab, 2008c). By far more important than sugarcane has been the rapid expansion<br />
of soybeans in Brazil, from less than 10 million hectares in the early 1980s <strong>to</strong> around 23<br />
million hectares, more than a third of all cropping land.<br />
1.6. Lessons from Brazilian sugarcane land development dynamics<br />
�e learning experience with deploying sugarcane based <strong>ethanol</strong> production in Brazil<br />
during the last 30 years has put the country in a unique position <strong>to</strong> respond <strong>to</strong> the current<br />
wave of energy systems developments, particularly renewable transport fuels. As <strong>to</strong> land<br />
use, the following conclusions can be summarized:<br />
• �ere was a very rapid and large land use <strong>change</strong> in<strong>to</strong> sugarcane production in Brazil in<br />
the last 30 years, particularly in São Paulo State.<br />
• Main drivers for the expansion of sugarcane areas were a combination of favorable<br />
biophysical conditions, a his<strong>to</strong>rical foundation of logistical and technological conditions<br />
<strong>to</strong> respond <strong>to</strong> market opportunities, national policies giving incentives <strong>to</strong> the sugarcane<br />
Harvested area (million hectares)<br />
6<br />
5<br />
4<br />
3<br />
2<br />
1<br />
0<br />
1983 1988 1993 1998 2003 2008<br />
Figure 7. Area of selected crops in São Paulo. Source: Conab, 2008c.<br />
sugarcane<br />
wheat<br />
cot<strong>to</strong>n<br />
rice<br />
beans<br />
maize<br />
soybean<br />
<strong>Sugarcane</strong> <strong>ethanol</strong> 45
Chapter 2<br />
•<br />
•<br />
•<br />
•<br />
Harvested area (million hectares)<br />
50<br />
45<br />
40<br />
35<br />
30<br />
25<br />
20<br />
15<br />
10<br />
5<br />
0<br />
1977 1980 1983 1986 1989 1992 1995 1998 2001 2004 2007<br />
Figure 8. Area of selected crops in Brazil. Source: Conab, 2008c.<br />
sugarcane<br />
wheat<br />
cot<strong>to</strong>n<br />
rice<br />
beans<br />
maize<br />
soybean<br />
agri-business, and a growing demand for sugar and bio<strong>ethanol</strong>, setting favorable<br />
conditions <strong>to</strong> bene�t from economies of scale.<br />
�e trend in sugarcane area expansion continues at record rates, now fostered by both<br />
the domestic and international demand for <strong>ethanol</strong>.<br />
�e savannah ecosystem (Brazilian ‘Cerrados’) is the current frontier of sugarcane<br />
expansion.<br />
�ere are risks of environmental degradation in di�erent stages of sugarcane production<br />
and processing. Negative impacts have been caused by the lack of implementation of best<br />
management practices and ine�ective legislation and control. Examples from São Paulo<br />
state indicate that environmental sustainability of sugarcane production and processing<br />
has been substantially improved during the last three decades. Nevertheless, further<br />
improvements are necessary.<br />
While more e�ective and environmentally less harmful technologies are now available,<br />
there is nevertheless a risk of a�ecting biodiverse ecosystems of the savannah region.<br />
Strict regulation and enforcement are needed <strong>to</strong> safeguard against environmental losses,<br />
for example by guaranteeing the protection and recuperation of speci�c biomes such as<br />
the Cerrado and riparian forests.<br />
46 <strong>Sugarcane</strong> <strong>ethanol</strong>
2. Global potential for expansion of sugarcane production<br />
2.1. Future land requirements for food and feed<br />
Land use dynamics and sugarcane production<br />
Several inter-linked processes determine the dynamics of world food demand and supply.<br />
Agro-climatic conditions, availability of land resources and their management are clearly key<br />
aspects, but they are critically in�uenced by regional and global socio-economic pressures<br />
including current and projected trends in population growth, availability and access <strong>to</strong><br />
technology, market demands and overall economic development.<br />
While <strong>climate</strong> and farm management are key determinants of local food production, agroeconomics<br />
and world trade combine <strong>to</strong> signi�cantly shape regional and global agricultural<br />
land use. Catering <strong>to</strong> consumers and industries in OECD countries is an important driver<br />
for agricultural activities in well-resourced developing countries. Computations of current<br />
and future cultivated land were carried out by assessing land potential with the global Agroecological<br />
Zones model (GAEZ) and economic utilization with IIASA’s world food system<br />
model (Fischer et al., 2002; Fischer et al., 2005). In 2000 about 1.5 billion hectares of arable<br />
land were in use for food, �ber and fodder crop production, or roughly 10% of all available<br />
land on earth. Of these, about 900 million hectares were in developing countries. By 2050,<br />
under a IIASA designed plausible global socio-economic development scenario (Grübler et<br />
al., 2006; Tubiello and Fischer, 2006; Fischer et al., 2006), for developed countries a slightly<br />
lower level of cultivated land use was projected compared <strong>to</strong> 2000, i.e. a modest net decrease<br />
in land under cultivation for food and feed crops was projected, while additional production<br />
resulted from increased productivity and input use. In developing countries, by contrast,<br />
cultivated land in 2050 was projected <strong>to</strong> increase by roughly 190 million ha (+21%) relative<br />
<strong>to</strong> year 2000. In the scenario, most of this additional cropland is brought in<strong>to</strong> use in Africa<br />
(+85 million ha, or +42%) and Latin America (70 million ha, or +41%).<br />
From a range of alternative scenario runs predicting world food system development<br />
(Fischer et al., 2002; 2005) it can be concluded that global food and feed demand will require<br />
some additional land <strong>to</strong> be used for cultivation, depending on socioeconomic scenario in<br />
the range of 120-180 million hectares, notably in developing countries. �erefore, when<br />
adopting a ‘food �rst’ paradigm, <strong>to</strong> realize a substantial contribution of agricultural biomass<br />
<strong>to</strong> energy sources would necessitate (1) focused e�orts of national and international R&D<br />
institutions and extension services <strong>to</strong> enable sustainable agricultural production increases<br />
on current agricultural land, which go beyond ‘business as usual’ trends and expectations,<br />
in particular <strong>to</strong> mobilize undeveloped agricultural potentials on the African continent, and<br />
(2) tapping in<strong>to</strong> resources currently not or only extensively used for cultivation or lives<strong>to</strong>ck<br />
production, e.g. certain grass, scrub and woodland areas where environmental and social<br />
impacts might be regarded as acceptable. For this reason, we next look in<strong>to</strong> the question as<br />
<strong>to</strong> how much land, where and under what current uses, could be potentially available for<br />
expanding global sugarcane production.<br />
<strong>Sugarcane</strong> <strong>ethanol</strong> 47
Chapter 2<br />
2.2. AEZ assessment of land suitable for sugarcane production<br />
2.2.1. AEZ background<br />
�e range of uses that can be made of land for human needs is limited by environmental<br />
fac<strong>to</strong>rs including <strong>climate</strong>, <strong>to</strong>pography and soil characteristics, and is <strong>to</strong> a large extent<br />
determined by demographic and socioeconomic drivers, cultural practices, and political<br />
fac<strong>to</strong>rs, e.g. such as land tenure, markets, institutions, and agricultural policies.<br />
�e Food and Agriculture Organization of the United Nations (FAO) with the collaboration<br />
of IIASA, has developed a system that enables rational land-use planning on the basis of<br />
an inven<strong>to</strong>ry of land resources and evaluation of biophysical limitations and production<br />
potentials of land. �is is referred <strong>to</strong> as the Agro-ecological Zones (AEZ) methodology.<br />
�e AEZ methodology follows an environmental approach; it provides a standardized<br />
framework for the characterization of <strong>climate</strong>, soil and terrain conditions relevant <strong>to</strong><br />
agricultural production. Crop modeling and environmental matching procedures are used<br />
<strong>to</strong> identify crop-speci�c limitations of prevailing <strong>climate</strong>, soil and terrain resources, under<br />
assumed levels of inputs and management conditions. �is part of the AEZ methodology<br />
provides maximum potential and agronomically attainable crop and biomass yields globally<br />
at 5-minute latitude/longitude resolution grid-cells.<br />
2.2.2. Land suitability for sugarcane<br />
<strong>Sugarcane</strong> belongs <strong>to</strong> the crops with C4 pho<strong>to</strong>synthetic pathway; it is adapted <strong>to</strong> operate<br />
best under conditions of relatively high temperatures and, in comparison <strong>to</strong> C3 pathway<br />
crops, has high rates of CO 2 ex<strong>change</strong> and pho<strong>to</strong>synthesis, in particular at higher light<br />
intensities.<br />
<strong>Sugarcane</strong> is a perennial with determinate growth habit; its yield is located in the stem as<br />
sucrose and the yield formation period is about two-thirds <strong>to</strong> three quarters of its cultivated<br />
life span. Climatic adaptability attributes of sugarcane qualify it as being most e�ective in<br />
tropical lowland and warm subtropical <strong>climate</strong>s; it does particularly well in somewhat drier<br />
zones under irrigation, but is sensitive <strong>to</strong> frost. A short dry and moderately cool period at<br />
the end of its cultivation cycle signi�cantly increases sugar content at harvest.<br />
Ecological requirements of sugarcane include warm, sunny conditions and adequate soil<br />
moisture supply during most of its cultivation cycle. <strong>Sugarcane</strong> prefers deep, well drained,<br />
well structured and aerated loamy <strong>to</strong> clayey fertile soils. Ideal pH ranges are between 5.5<br />
and 7.5.<br />
48 <strong>Sugarcane</strong> <strong>ethanol</strong>
2.2.3. AEZ procedures applied for sugarcane<br />
Land use dynamics and sugarcane production<br />
Box 1 summarizes the AEZ methodology and information �ow as applied for the assessment<br />
of global sugarcane potentials.<br />
Box 1. AEZ procedures (see Figure 9).<br />
Land Utilization Type (LUT): The AEZ procedures have been used <strong>to</strong> derive by grid-cell potential<br />
biomass and yield estimates for rain-fed sugarcane production under high level inputs/<br />
advanced management, which includes main socio-economic and agronomic/farm-management<br />
components:<br />
The farming system is (1) market oriented; (2) commercial production of sugar and bio<strong>ethanol</strong><br />
are management objectives, and (3) production is based on currently available yielding cultivars,<br />
is fully mechanized with low labor intensity, and assumes adequate applications of nutrients and<br />
chemical pest, disease and weed control.<br />
<strong>Sugarcane</strong><br />
land utilization<br />
definition<br />
<strong>Sugarcane</strong><br />
catalog<br />
adaptability characteristics<br />
biomass and yield parameters<br />
partitioning coefficients,<br />
ecological requirements<br />
Climatic and<br />
edaphic<br />
matching<br />
procedures<br />
Land use/land cover<br />
shares<br />
Climate database<br />
CRU/GPC<br />
Climate analysis<br />
Biomass and yield<br />
calculation<br />
Biomass and yield<br />
potentials<br />
by grid-cell<br />
Agro-ecological<br />
bio-<strong>ethanol</strong> production potential<br />
(energy equivalent)<br />
by grid-cell and<br />
by land use/land cover class<br />
Figure 9. AEZ methodology: information flow and integration.<br />
GIS Layers<br />
Terrain slopes<br />
Land use/land cover<br />
Protected areas<br />
Administrative areas<br />
Land resources<br />
database<br />
Harmonized<br />
world soil database<br />
<strong>Sugarcane</strong> <strong>ethanol</strong> 49<br />
Soils<br />
Conversion<br />
sugarcane yields<br />
<strong>to</strong><br />
bio<strong>ethanol</strong><br />
(energy equivalent)
Chapter 2<br />
The quantified description of sugarcane LUTs include characteristics such as vegetation period,<br />
ra<strong>to</strong>on practices, pho<strong>to</strong>synthetic pathway, pho<strong>to</strong>synthesis in relation <strong>to</strong> temperature, maximum<br />
leaf area index, partitioning coefficients, and parameters describing ecological requirements of<br />
sugarcane produced under rain-fed conditions.<br />
Climatic data: Climate data are from the Climate Research Unit (CRU CL 2.0 (New et al.,<br />
2002, CRU TS 2.1; Mitchell and Jones, 2005), and precipitation data from VASClimO (Global<br />
Precipitation Clima<strong>to</strong>logy Centre - GPCC). Average <strong>climate</strong> and his<strong>to</strong>rical databases were used<br />
<strong>to</strong> quantify: (1) the length of growing period parameters, including year-<strong>to</strong>-year variability, and<br />
(2) <strong>to</strong> estimate for each grid-cell by crop/LUT, average and individual years agro-climatically<br />
attainable sugarcane yields.<br />
Soils data: Spatial soil information and attributes data is used from the recently published<br />
Harmonized World Soil Database (FAO, IIASA, ISRIC, ISSCAS & JRC, 2008)<br />
Terrain data: Global terrain slopes are estimated on the bases of elevation data available from<br />
the Shuttle Radar Topography Mission (SRTM) at 3 arc-second resolution<br />
Land use/land cover: Potential yields, suitable areas and production were quantified for<br />
different major current land cover categories (Fischer et al., 2008). The estimation procedures<br />
for estimating seven major land-use and land cover categories are as follows: Cultivated land<br />
shares in individual 5’ grid cells were estimated with data from several land cover datasets: (1)<br />
the GLC2000 land cover regional and global classifications (http://www-gvm.jrc.it/glc2000), (2)<br />
the global land cover categorization, compiled by IFPRI (IFPRI, 2002), based on a reinterpretation<br />
of the Global Land Cover Characteristics Database (GLCC) ver. 2.0, EROS Data Centre (EDC,<br />
2000) (3) the Forest Resources Assessment of FAO (FAO, 2001), and global 5’ inven<strong>to</strong>ries of<br />
irrigated land (GMIA version 4.0; FAO/University of Frankfurt, 2006). Interpretations of these land<br />
cover data sets at 30-arc-sec. were used <strong>to</strong> quantify shares of seven main land use/land cover,<br />
consistent with land use estimates of published statistics. These shares are: cultivated land,<br />
subdivided in<strong>to</strong> (1) rain-fed and (2) irrigated land, (3) forest, (4) pasture and other vegetation,<br />
(5) barren and very sparsely vegetated land, (6) water, and (7) urban land and land required for<br />
housing and infrastructure.<br />
Protected areas: The principal data source of protected areas is the World Database of Protected<br />
Areas (WDPA) (http://www.unep-wcmc.org/wdpa/index.htm.) Two main categories of protected<br />
areas are distinguished: (1) protected areas where restricted agricultural use is permitted, and<br />
(2) strictly protected areas where agricultural use is not permitted.<br />
Land resources database: Spatial data linked with attribute information from soils, terrain, land<br />
use and land cover, and protected areas are combined with an administrative boundary GIS layer<br />
in the land resources database<br />
Climate analysis: Monthly reference evapotranspiration (ETo) has been calculated according <strong>to</strong><br />
Penman-Monteith. A water-balance model provides estimations of actual evapotranspiration (ETa)<br />
and length of growing period (LGP). Temperature and elevation are used for the characterization of<br />
thermal conditions, e.g. thermal <strong>climate</strong>s, temperature growing periods (LGP t ), and accumulated<br />
temperatures. Temperature requirements of sugarcane were matched with temperature<br />
profiles prevailing in individual grid-cells. For grid-cells with an optimum or sub-optimum match,<br />
calculations of biomass and yields were performed.<br />
50 <strong>Sugarcane</strong> <strong>ethanol</strong>
Land use dynamics and sugarcane production<br />
Edaphic modifiers: The edaphic suitability assessment is based on matching of soil and terrain<br />
requirements of the assumed sugarcane production systems with prevailing soil and terrain<br />
conditions.<br />
Land productivity for rain-fed sugarcane: The combination of climatic and edaphic suitability<br />
classification provides by grid-cell potential biomass and yield estimates for assumed production<br />
conditions<br />
2.3. Agro-ecological suitability of sugarcane – risks and opportunities of expansion<br />
Figure 10 presents a map of climatically attainable relative yields for rain-fed conditions,<br />
normalized <strong>to</strong> a range of 0 (i.e. no yield possible) <strong>to</strong> 1 (i.e. geographical locations where<br />
highest rain-fed yields would be obtained). According <strong>to</strong> the AEZ assessment, the most<br />
suitable <strong>climate</strong>s are found in the southeastern parts of South America, e.g. including<br />
São Paulo State in Brazil, but also large areas in Central Africa as well as some regions in<br />
Southeast Asia. Very wet areas with low temperature seasonality such as parts of the Amazon<br />
basin 1 produce substantially lower yields due <strong>to</strong> lower sugar content, high pest and disease<br />
incidence combined with lower e�cacy of control, and in extreme wet areas di�culties with<br />
�eld operations and harvest. Note that in India and Pakistan, the world’s second and ��h<br />
largest producers of sugarcane, irrigation is needed <strong>to</strong> exploit the thermal and radiation<br />
resources in these countries for sugarcane cultivation.<br />
1 Conditions in the equa<strong>to</strong>rial parts of Africa di�er substantially in wetness as compared <strong>to</strong> parts of the Amazon<br />
basin and provide from <strong>climate</strong> viewpoint better sugar yields.<br />
0.15<br />
Figure 10. Normalized agro-climatically attainable yield of rain-fed sugarcane. Source: Fisher et al.,<br />
2008, IIASA. Note: Maximum attainable yields in this global map are about 15 <strong>to</strong>ns sugar per hectare.<br />
<strong>Sugarcane</strong> <strong>ethanol</strong> 51
Chapter 2<br />
Table 8 summarizes by region the current distribution of cultivated land, the land harvested<br />
for sugarcane in 2007, and the area of current cultivated land assessed as very suitable (VS),<br />
suitable (S) and moderately suitable (MS). Globally, the currently harvested 22 million<br />
hectares of land for sugarcane compare <strong>to</strong> the potential of 28 million hectares VS-land<br />
and 92 million hectares rain-fed S-land. In other words, of currently 1550 million hectares<br />
cultivated land about 120 million hectares is very suitable or suitable for rain-fed sugarcane<br />
cultivation, with the majority of this land located in developing countries of Africa (28<br />
million hectares), Asia (34 million hectares) and South America (40 million hectares).<br />
�e Brazilian experience has shown that a major land source of sugarcane expansion<br />
was from pastures. �e assessment of sugarcane suitability in current grass, scrub, wood<br />
land concluded that some 130 million hectares of this land would be very suitable or<br />
suitable for rain-fed sugarcane production, of which 48 million hectares were found in<br />
Sub-Saharan Africa and 69 million hectares in South America; Brazil accounts for nearly<br />
half this potential (Table 9). �ere is only very little potential of this kind, about 7 million<br />
hectares, in Asia as all the vast grasslands of Central Asia are <strong>to</strong>o cold and <strong>to</strong>o dry for rainfed<br />
sugarcane production.<br />
�e maps for South America and Africa shown in Figure 11 indicate the suitability of<br />
<strong>climate</strong>, soil and terrain conditions for rain-fed sugarcane production. �e respective<br />
suitability class is shown for areas where 50 percent or more of a grid-cell of 5’ by 5’ latitude/<br />
longitude is currently used as cultivated land and/or is covered by grass, scrub or woodland<br />
ecosystems. Hence, it shows the suitability of land where a substantial fraction is nonforest<br />
ecosystems. �is geographical �lter was used <strong>to</strong> indicate the distribution of land for<br />
potential sugarcane expansion, i.e. areas where further expansion of sugarcane would not<br />
cause direct deforestation and, provided the biodiverse native Cerrado ecosystem can be<br />
protected, would not create associated major risks for biodiversity and substantial carbon<br />
debts as is the case with forest conversion.<br />
�e maps shown in Figure 12 indicate the suitability of <strong>climate</strong>, soil and terrain conditions<br />
for rain-fed sugarcane production in areas where 50 percent or more of each grid-cell of<br />
5’ by 5’ latitude/longitude is classi�ed as forest or protected land, highlighting land at risk<br />
of undesirable conversion ‘hot spots’ due <strong>to</strong> its suitability for sugarcane expansion. Unlike<br />
the areas shown in Figure 11, conversion of these forest and protected areas would likely<br />
be associated with high environmental impacts.<br />
While legally protected areas, both forests and non-forest ecosystems, are less exposed<br />
<strong>to</strong> conversion, unprotected forest areas with good suitability for rain-fed sugarcane<br />
cultivation are of particular concern due <strong>to</strong> possible severe environmental impacts. �e<br />
AEZ methodology was therefore used <strong>to</strong> assess the magnitude and geographical distribution<br />
of unprotected forest areas. A summary of results by region is provided in Table 10.<br />
52 <strong>Sugarcane</strong> <strong>ethanol</strong>
Table 8. Suitability of current cultivated land for rain-fed sugarcane production.<br />
<strong>Sugarcane</strong><br />
harvested (2007)<br />
Cultivated land<br />
million ha<br />
Land potentially suitable, of which Share of VS+S in<br />
cultivated land<br />
Very suitable (VS) Suitable (S) Moderately suitable<br />
million ha million ha million ha<br />
percent<br />
million ha<br />
North America 230 2.7 4.6 7.7 3.1 0.4<br />
Europe & Russia 305 0 0 0 0.0 0.0<br />
Oceania & Polynesia 53 0.4 0.6 0.6 1.9 0.5<br />
Asia 559 5.7 28.6 70.6 6.1 9.6<br />
Africa 244 6.8 20.6 27.0 11.2 1.6<br />
Centr. Am. & Carib. 43 3.1 7.3 5.7 24.1 1.8<br />
South America 129 9.7 30.3 30.6 31.0 8.0<br />
Developed 591 2.7 4.8 7.9 1.3 0.9<br />
Developing 972 25.6 87.1 134.3 11.6 21.0<br />
World 1563 28.3 91.9 142.2 7.7 21.9<br />
Land use dynamics and sugarcane production<br />
Brazil 66 5.0 19.6 18.0 37.4 6.7<br />
India 167 0.7 2.9 8.1 2.1 4.8<br />
China 139 1.6 4.1 11.1 4.1 1.2<br />
Thailand 19 0.1 0.6 6.3 3.0 1.0<br />
Pakistan 21 0.1 0.5 1.1 2.5 1.0<br />
<strong>Sugarcane</strong> <strong>ethanol</strong> 53<br />
Source: Fisher et al., 2008, IIASA; FAOSTAT, 2008; calculation by the authors. Suitability classes are mutually exclusive, i.e. do not overlap.
Chapter 2<br />
Table 9. Suitability of unprotected grass/scrub/wood land for rain-fed sugarcane production.<br />
Unprotected<br />
grass/scrub/<br />
wood land<br />
million ha<br />
In <strong>to</strong>tal, globally some 3.2 billion hectares of land are classi�ed as unprotected forests, of<br />
which 7.3 percent were regarded as very suitable (49 million hectares) or as suitable (some<br />
185 million hectares; see Table 10) for rain-fed sugarcane cultivation. Of the suitable extents<br />
in both of these prospective suitability classes, Africa and South America contribute about<br />
85 percent of the <strong>to</strong>tal.<br />
2.4. Sustainability of land use <strong>change</strong>s<br />
Land potentially suitable, of which VS+S in grass<br />
& wood land<br />
Very suitable Suitable Moderately<br />
suitable<br />
million ha million ha million ha percent<br />
North America 566 1.1 2.1 3.7 0.6<br />
Europe & Russia 666 0 0 0.0 0.0<br />
Oceania & Polynesia 519 0.4 1.6 3.2 0.4<br />
Asia 699 1.3 5.7 22.5 1.0<br />
Africa 973 11.9 36.0 65.0 4.9<br />
Centr. Am. & Carib. 98 1.1 2.4 3.5 3.6<br />
South America 613 22.0 47.2 90.8 11.3<br />
Developed 1741 1.2 2.5 4.5 0.2<br />
Developing 2394 36.6 92.5 184.2 5.4<br />
World 4135 37.8 95.0 188.7 3.2<br />
Brazil 260 7.7 26.5 49.9 13.2<br />
India 26 0.0 0.1 0.2 0.3<br />
China 268 0.7 1.4 2.9 0.8<br />
Thailand 12 0.0 0.1 1.2 0.6<br />
Pakistan 14 0.0 0.0 0.0 0.0<br />
Source: Fisher et al., 2008; calculation by authors. Suitability classes are mutually exclusive, i.e. do<br />
not overlap.<br />
<strong>Sugarcane</strong> is widely accepted as one of the most promising – economically and with regard<br />
<strong>to</strong> greenhouse gas saving potential – bioenergy feeds<strong>to</strong>ck options currently available.<br />
For instance, the fossil energy ratio (output biofuel energy per unit of fossil fuel input<br />
energy) of sugarcane <strong>ethanol</strong> was 9.3 in 2006 and is projected <strong>to</strong> reach 11.6 by 2020 with<br />
54 <strong>Sugarcane</strong> <strong>ethanol</strong>
Land use dynamics and sugarcane production<br />
SI >75: high<br />
SI 50-75: good<br />
SI 20-50: moderate<br />
SI 0-20: marginal<br />
Not suitable, protected<br />
and cultivated + grass 75: high<br />
SI 50-75: good<br />
SI 20-50: moderate<br />
SI 0-20: marginal<br />
Not suitable, not protected<br />
and forest
Chapter 2<br />
Table 10. Suitability of unprotected forest land for rain-fed sugarcane production.<br />
Unprotected<br />
forest<br />
million ha<br />
Land potentially suitable, of which VS+S in<br />
unprotected<br />
Very suitable Suitable Moderately<br />
suitable<br />
forest<br />
million ha million ha million ha percent<br />
North America 496 3.1 8699 16.1 2.4<br />
Europe & Russia 910 0 0 0.0 0.0<br />
Oceania & Polynesia 121 0.8 4.6 8.2 4.5<br />
Asia 476 1.7 10.5 41.4 2.6<br />
Africa 444 28.0 79.5 81.4 24.2<br />
Centr. Am. & Carib. 81 1.9 3.7 5.2 6.9<br />
South America 694 13.1 78.2 266.9 13.2<br />
Developed 1516 3.5 10.2 18.0 0.9<br />
Developing 1706 45.2 175.0 401.2 12.9<br />
World 3222 48.7 185.2 419.2 7.3<br />
Brazil 414 4.4 45.0 174.8 11.9<br />
India 61 0.3 0.6 2.0 1.4<br />
China 158 0.5 1.2 2.7 1.1<br />
Thailand 9 0.0 0.1 1.3 0.6<br />
Pakistan 2 0.0 0.0 0.1 0.8<br />
Source: Fisher et al., 2008; calculation by authors. Suitability classes are mutually exclusive, i.e. do<br />
not overlap.<br />
with other �rst generation biofuels; as reviewed in several studies, bio<strong>ethanol</strong> based on<br />
sugarcane can achieve greenhouse gas reductions of more than 80% compared <strong>to</strong> fossil fuel<br />
use (e.g. Macedo (2002); Macedo et al. (2004); De Oliveira et al. (2005)).<br />
�e rapid further expansion of sugarcane areas forecasted for Brazil is expected <strong>to</strong> continue<br />
at the expense of current crop land and extensively managed pas<strong>to</strong>ral land in the Cerrado<br />
region. �is expansion may directly or indirectly a�ect parts of the Cerrado area with native<br />
vegetation and unprotected forest where biophysical, infrastructural and socio-economic<br />
conditions are favorable for sugarcane cultivation. Most threatened are those lands adjacent<br />
<strong>to</strong> current production areas. Environmental consequences of sugarcane expansion might<br />
range from quite acceptable (conversion of crop land and managed pastures) <strong>to</strong> very negative<br />
where sugarcane expands directly or indirectly in unprotected areas, which still have native<br />
56 <strong>Sugarcane</strong> <strong>ethanol</strong>
Land use dynamics and sugarcane production<br />
vegetation with high bio-diversity or in<strong>to</strong> unprotected native forest areas. Apart from<br />
the question, which land will be converted, environmental impacts will be molded by<br />
agricultural and industrial technologies applied in newly converted areas.<br />
Current concerns regarding sustainable expansion of the sugarcane industry in Brazil (see<br />
Box 2) have been recently investigated (Goldemberg et al., 2008; Martinelli and Filoso,<br />
2008; Smeets et al. 2008).<br />
Pressure on native ecosystems and threats <strong>to</strong> biodiversity can be avoided by e�ective<br />
environmental regulation and control and by implementation of agricultural policies<br />
supporting intensi�cation of production. Increasing demand for food and lives<strong>to</strong>ck<br />
products will require replacement of the land converted <strong>to</strong> sugarcane, leading <strong>to</strong> substantial<br />
shi�s of crop land and pastures <strong>to</strong> other regions, causing pressure on the ecosystems there.<br />
Such indirect land use <strong>change</strong>s would negatively a�ect the greenhouse gas e�ciency of<br />
sugarcane production.<br />
So far sugarcane in Brazil has mostly intruded in the cultivated and pasture areas of São<br />
Paulo State. For this state, the estimated remaining area of pastures, of which many are<br />
bordering on the sugarcane production expansion front, is 7.6 million ha (IEA, 2007). In<br />
the entire Cerrado region (205 million ha) there are currently about 54 million ha of these<br />
pastures (Ministério do Meio Ambiente, 2007).<br />
Assuming that cultivated pastures will continue <strong>to</strong> be converted in<strong>to</strong> sugarcane and that on <strong>to</strong>p<br />
of this, demand for lives<strong>to</strong>ck products further increases, substantially higher s<strong>to</strong>cking rates<br />
will be required. �is implies adoption of new technologies (Corsi, 2004) for intensi�cation<br />
of pas<strong>to</strong>ral management (e.g. use of fertilizers, rotational grazing) with consequent increases<br />
of agro-chemical inputs, production costs and greenhouse gas emissions. �e remaining<br />
124 million ha of Cerrado with native vegetation (see Table 7), which are susceptible <strong>to</strong> loss<br />
Box 2. What are key concerns and environmental issues with sugarcane expansion?<br />
•<br />
•<br />
•<br />
•<br />
•<br />
•<br />
•<br />
Deforestation and habitat loss.<br />
Land competition with food and feed production.<br />
Indirect effects of land conversion because of strong expansion of sugarcane production outcompeting<br />
other crop and lives<strong>to</strong>ck activities, which in turn encroach on natural habitats.<br />
Water pollution and eutrophication.<br />
Soil erosion and soil compaction (mainly during land preparation and early growth phases<br />
when soil is barren combined with sub-optimal tillage methods and relative high rainfall and<br />
the use of steep slopes).<br />
Air pollution (mainly through burning of sugarcane before harvest)<br />
Possible extensive use of transgenic sugarcane types<br />
<strong>Sugarcane</strong> <strong>ethanol</strong> 57
Chapter 2<br />
of bio-diversity and land degradation are an imminent target for sugarcane expansion and<br />
needs therefore serious attention. Expansion of protected areas, zero deforestation policies<br />
for native forest land as well as reforestation of already deforested areas are important<br />
elements of a sustainable agricultural development (Machado et al., 2004; Durigan et al.,<br />
2007). Currently, less than 6% of the Cerrado region is legally protected. A share of 20% of<br />
natural vegetation is required as a ‘legal reserve’ by the Brazilian Forest Code in this region,<br />
in comparison <strong>to</strong> 80% in the Amazon rainforest (Conservation International, 2008; Klink<br />
and Machado, 2005).<br />
�e use of genetically modi�ed sugarcane, with associated risks of impacting biodiversity or<br />
becoming invasive in natural habitats, has been identi�ed as an additional area of concern for<br />
future expansion of sustainable sugarcane production (Smeets et al., 2008). �e sequencing<br />
of sugarcane genes and development of transgenic varieties has been pursued in Brazil as a<br />
means of conferring disease resistance, stress <strong>to</strong>lerance and e�ciency of nutrient use in the<br />
plant, which could contribute <strong>to</strong> sustainable expansion in the future (Cardoso Costa et al.<br />
2006). �e country has a well-established research in the biotechnology �eld with reported<br />
successes in developing disease and herbicide resistant agricultural and horticultural crops.<br />
Although potential bene�ts are high, there is still a lack of understanding of the potential<br />
impacts of genetically modi�ed organisms on environmental parameters (Smeets et al.,<br />
2008), which prompted the removal of permits for commercial trials with transgenic<br />
sugarcane a�er public concerns.<br />
Pollution problems require strict enforcement of legislation and inspection of agricultural<br />
and industrial activities. Strict regulation and control of the disposal of nutrient-rich waste<br />
from industrial processes (e.g. vinasse) is required <strong>to</strong> avoid deterioration of water quality<br />
near production areas (Gunkel et al., 2007). Recycling of byproducts of sugarcane in the �elds<br />
reduces chemical fertilizers application rates; however, there is a risk of excess application<br />
in particular at close distance <strong>to</strong> the processing plants (Smeets et al., 2008).<br />
Various technologies have been identi�ed for immediate increases in the e�ciency and<br />
sustainability of current and future sugarcane mills, e.g. reducing water consumption with<br />
closure of water-processing circuits and the use of bagasse (�brous residue le� a�er cane<br />
milling) <strong>to</strong> generate electricity, improving the energy balance of <strong>ethanol</strong> production; as well<br />
as in production and harvesting processes. Air pollution caused by sugarcane burning can<br />
be e�ectively avoided by the adoption of mechanized harvesting. In São Paulo, where more<br />
than one third of the area of sugarcane is already harvested mechanically (Conab, 2008b),<br />
a schedule of phasing out burning is in place. Targets are that by 2020 all land with slopes<br />
Land use dynamics and sugarcane production<br />
replaced by one mechanical harvester (Conab, 2008a). In 2007, about three quarters of the<br />
Brazilian sugarcane area was still manually harvested and some 300,000 workers depend<br />
for their livelihood on manual cutting of cane. �e pace of introduction of mechanized<br />
harvesting will therefore be a�ected by the cost/bene�t of substituting manual labor and<br />
on suitable socio-economic conditions <strong>to</strong> reallocate the current contingent of sugarcanecutting<br />
workers.<br />
Adequate know-how and well developed technology is available <strong>to</strong> achieve sustainable<br />
sugarcane production and expansion (Goldemberg et al., 2008). However, the adoption of<br />
new technologies requires a favorable economic and political environment that facilitates<br />
investments in clean technologies. While Brazil has accumulated considerable experience<br />
on sustainable sugarcane production through its PROALCOOL program, it will be critical<br />
<strong>to</strong> share and transfer this knowledge and ensure application of new technologies and<br />
of ‘best practices’ in other regions of the Americas, Asia and especially Africa, where<br />
large expansion potentials may materialize quickly due <strong>to</strong> the current urgency <strong>to</strong> develop<br />
bioenergy resources.<br />
References<br />
Cançado, J.E.D., P.H.N. Saldiva, L.A.A. Pereira, L.B.L.S. Lara, P. Artaxo, L.A. Martinelli, M.A. Arbex, A.<br />
Zanobetti and A.L.F. Bragal, 2006. �e Impact of <strong>Sugarcane</strong>-Burning Emissions on the Respira<strong>to</strong>ry<br />
System of Children and the Elderly. Environmental Health Perspectives 114: 725-729.<br />
Cardoso Costa, M.G., A. Xavier and W. Campos O<strong>to</strong>ni, 2006. Horticultural biotechnology in Brazil. Acta<br />
Hort. 725: 63-72.<br />
Conab, 2008a. Companhia Nacional de Abastecimen<strong>to</strong>. Acompanhamen<strong>to</strong> da safra brasileira. Abril 2008.<br />
Available at: http://www.conab.gov.br/conabweb/index.php?PAG=131. Retrieved 13 August, 2008.<br />
Conab, 2008b. Companhia Nacional de Abastecimen<strong>to</strong>. Per�l do Se<strong>to</strong>r de Açúcar e de Alcool no Brasil.<br />
Available at: http://www.conab.gov.br/conabweb/index.php?PAG=131. Retrieved 13 August, 2008.<br />
Conab, 2008c. Companhia Nacional de Abastecimen<strong>to</strong>. Séries Históricas. Available at: http://www.conab.<br />
gov.br.<br />
Conservation International, 2008. Biodiversity hot spots. Conservation International. Washing<strong>to</strong>n DC, USA.<br />
Available at: http://www.biodiversityhotspots.org/xp/hotspots/cerrado/Pages/default.aspx.<br />
Corbi, J.J., S.T. Strixino, A. San<strong>to</strong>s and M. Grande, 2006. Diagnóstico ambiental de metais e organoclorados<br />
em córregos adjacentes a áreas de cultivo de cana-de-açúcar (Estado de São Paulo, Brasil). Quimica<br />
Nova 29: 61-65.<br />
Corsi, M., 2004. Impact of grazing management on the productivity of tropical grasses. International Grassland<br />
Congress. Available at: http://www.internationalgrasslands.org/publications/pdfs/tema22_2.pdf<br />
De Oliveira, M., B. Vaughan and E. Rykiel Jr., 2005. Ethanol as a Fuel: Energy, Carbon Dioxide Balances and<br />
Ecological Footprint. Bioscience 55: 593-602.<br />
Durigan, G., M.F. d. Siqueira and G.A.D.C. Franco, 2007. �reats <strong>to</strong> the Cerrado remnants of the state of<br />
São Paulo, Brazil. Scientia Agricola 64: 355-363.<br />
EDC, 2000. Global Land Cover Charateristics Database version.2.0 (http://edcwww.cr.usgs.gov).<br />
<strong>Sugarcane</strong> <strong>ethanol</strong> 59
Chapter 2<br />
FAO, 1987. 1948-1985 World Crop and Lives<strong>to</strong>ck Statistics. Food and Agriculture Organization of the<br />
United Nations, Rome, Italy.<br />
FAO, 2001. Global Forest Resources Assessment 2000, FAO, Rome, Italy.<br />
FAO/IIASA/ISRIC/ISSCAS/JRC, 2008. Harmonized World Soil Database (version 1.0). FAO, Rome, Italy<br />
and IIASA, Laxenburg, Austria.<br />
FAOSTAT, 2008. Production. Available at: http://faostat.fao.org.<br />
Fearnside, P.M., 2005. Deforestation in Brazilian Amazonia: His<strong>to</strong>ry, rates, and Consequences. Conservation<br />
Biology 19: 680-688.<br />
Fischer, G., M. Shah and H. van Velthuizen, 2002. Climate Change and Agricultural Vulnerability. Special<br />
Report as contribution <strong>to</strong> the World Summit on Sustainable Development, Johannesburg 2002.<br />
International Institute for Applied Systems Analysis, Laxenburg, Austria. pp 152.<br />
Fischer, G., M. Shah, F.N. Tubiello and H van Velhuizen, 2005. Socio-economic and <strong>climate</strong> <strong>change</strong> impacts<br />
on agriculture: an integrated assessment, 1990–2080. Philosophical Transactions of the Royal Society<br />
B: Biological Sciences 360: 2067-2083.<br />
Fischer, G., F.N. Tubiello, H. van Velthuizen and D. Wiberg, 2006. Climate <strong>change</strong> impacts on irrigation<br />
water requirements: E�ects of mitigation, 1990–2080. Technological Forecasting & Social Change 74:<br />
1083-1107.<br />
Fischer, G., F. Nachtergaele, S. Prieler, E.Teixeira, H.T. van Velthuizen, L. Verelst, D. Wiberg, 2008. Global<br />
Agro-ecological Zones Assessment for Agriculture (GAEZ 2008). IIASA, Laxenburg, Austria and FAO,<br />
Rome, Italy.<br />
Florestar, 2005. Florestar Estatistico - Fundo de Desenvolvimen<strong>to</strong> Florestal. Cobertura Florestal em São<br />
Paulo. Available at: http://www.�oresta.org.br/index.php?interna=estatisticas/�orestarestatistico&gru<br />
po=3. Retrieved 13 August, 2008.<br />
Goldemberg, J., 2006. �e <strong>ethanol</strong> program in Brazil. Environmental Research Letters 1: 5.<br />
Goldemberg, J., 2007. Ethanol for a Sustainable Energy Future. Science 315: 808-810.<br />
Goldemberg, J., S.T. Coelho and P. Guardabassi, 2008. �e sustainability of <strong>ethanol</strong> production from<br />
sugarcane. Energy Policy 36: 2086-2097.<br />
Grübler, A., B. O’Neill, K. Riahi, V. Chirkov, A. Goujon, P. Kolp, I. Prommer and E. Slen<strong>to</strong>e, 2006. Regional,<br />
national and spatially explicit scenarios of demographic and economic <strong>change</strong> based on SRES.<br />
Technological Forecasting & Social Change 74: 980-1029.<br />
Gunkel, G., J. Kosmol, M. Sobral, H. Rohn, S. Montenegro and J. Aureliano, 2007. <strong>Sugarcane</strong> Industry as<br />
a Source of Water Pollution - Case Study on the Situation in Ipojuca River, Pernambuco, Brazil. Water<br />
Air Soil Pollution 180: 261-269.<br />
IEA, 2007. Institu<strong>to</strong> de Economia Agrícola. Área e Produção dos Principais Produ<strong>to</strong>s da Agropecuária-São<br />
Paulo. Available at: http://www.iea.sp.gov.br/out/banco/menu.php. Retrieved 12 August, 2008.<br />
IFPRI, 2002. Global agricultural extent: Reinterpretation of global land cover characteristics database<br />
(GLCCD v. 2.0), EROS data center (EDC), 2000. International Food Policy Research Institute,<br />
Washing<strong>to</strong>n DC, USA.<br />
Klink, C.A. and R.B. Machado, 2005. Conservation of the Brazilian Cerrado. Conservation Biology 19:<br />
707-713.<br />
Licht, F.O., 2007. World Ethanol and Biofuels Report, Oct 23, 2007.<br />
Licht, F.O., 2008. World Ethanol and Biofuels Report, May 5, 2008.<br />
60 <strong>Sugarcane</strong> <strong>ethanol</strong>
Land use dynamics and sugarcane production<br />
Macedo, I.C., J.E.A. Seabra and J.E.A.R. Silva, 2008. Green house gases emissions in the production and<br />
use of <strong>ethanol</strong> from sugarcane in Brazil: �e 2005/2006 averages and a prediction for 2020. Biomass<br />
and Bioenergy 32: 582-595.<br />
Macedo, I., 2002. Energia da Cana no Brasil. Unicamp – São Paulo, 2002. Available at: http://www.cgu.rei.<br />
unicamp.br/energia2020/papers/paper_Macedo.pdf<br />
Macedo, I., M.R.L.V. Leal and J.E.A.R.d. Silva, 2004. Greenhouse gas emissions in the production and use of<br />
<strong>ethanol</strong> in Brazil: present situation (2002). Secretaria de Meio-Ambiente do Estado de São Paulo, Brazil.<br />
Machado, R.B., M.B. Ramos Ne<strong>to</strong>, P. Pereira, E. Caldas, D. Goncalves, N. San<strong>to</strong>s, K. Tabor and M. Steiniger, 2004.<br />
Estimativa de perda do Cerrado brasileiro. Conservation International do Brazil, Brasilia, DF, Brazil.<br />
Martinelli, L.A. and S. Filoso, 2008. Expansion of sugarcane <strong>ethanol</strong> production in Brazil: environmental<br />
and social challenges. Ecological Applications 18: 885-898.<br />
Ministério do Meio Ambiente, 2007. Mapeamen<strong>to</strong> de Cobertura Vegetal do Bioma Cerrado. Relatório Final.<br />
Brasília/DF. Junho 2007. Available at: http://www.mma.gov.br/index.php?ido=conteudo.monta&idEstr<br />
utura=72&idMenu=3813&idConteudo=5978.<br />
Mitchell, T.D. and P.D. Jones, 2005. An improved method of constructing a database of monthly <strong>climate</strong><br />
observations and associated high resolution grids. Climatic Research Unit, School of Environmental<br />
Sciences, University of East Anglia, Norwich, United Kingdom.<br />
Myers, N., R.A. Mittermeier, C.G. Mittermeier, G.A.B. da Fonseca and J. Kent, 2000. Biodiversity hotspots<br />
for conservation priorities. Nature 403: 853-858.<br />
Naseri, A.A., S. Jafari and M. Alimohammadi, 2007. Soil Compaction Due <strong>to</strong> <strong>Sugarcane</strong> (Saccharum<br />
o�cinarum) Mechanical Harvesting and the E�ects of Subsoiling on the Improvement of Soil Physical<br />
Properties. Journal of Applied Sciences 7: 3639-3648.<br />
New, M., D. Lister, M. Hulme and I. Makin, 2002. A high-resolution data set of surface <strong>climate</strong> over global<br />
land areas. Climate Research 21: 1-25.<br />
Oliveira, J.C.M., C.P.M. Vaz and K. Reichardt, 1995. Efei<strong>to</strong> do cultivo continuo da cana de acucar em<br />
propriedades �sicas de um la<strong>to</strong>ssolo vermelho escuro. Scientia Agricola 52: 50-55.<br />
Politano, W. and T.C.T. Pissarra, 2005. Avaliação por fo<strong>to</strong>interpretação das áreas de abrangência dos<br />
diferentes estados da erosão acelerada do solo em canaviais e pomares de citros. Engenharia Agrícola<br />
25: 242-252.<br />
Ribeiro, H., 2008. <strong>Sugarcane</strong> burning in Brazil: respira<strong>to</strong>ry health e�ects. Rev. Saúde Pública 42: 1-6.<br />
Saint, W.S., 1982. Farming for energy: social options under Brazil’s National Alcohol Programme. World<br />
Development 10: 223-238.<br />
Sano, E.E., R. Rosa, J.L.S. Bri<strong>to</strong> and L.G. Ferreira, 2008. Mapeamen<strong>to</strong> semidetalhado do uso da terra do<br />
Bioma Cerrado. Pesquisa Agropecuária Brasileira 43: 153-156.<br />
Scharlemann, J.P.W. and W.F. Laurance, 2008. Environmental Science: How Green Are Biofuels? Science<br />
319: 43-44.<br />
Silva, A.M.d., M.A. Nalon, F.J.d.N. Kronka, C.A. Alvares, P.B.d. Camargo and L.A. Martinelli, 2007. His<strong>to</strong>rical<br />
land-cover/use in di�erent slope and riparian bu�er zones in watersheds of the state of São Paulo, Brazil.<br />
Scientia Agricola 64: 325-335.<br />
Silva, D.M.L.d., P.B.d. Camargo, L.A. Martinelli, F.M. Lanças, J.S.S. Pin<strong>to</strong> and W.E.P. Avelar, 2008.<br />
Organochlorine pesticides in Piracicaba river basin (São Paulo/Brazil): a survey of sediment, bivalve<br />
and �sh. Quimica Nova 31: 214-219.<br />
<strong>Sugarcane</strong> <strong>ethanol</strong> 61
Chapter 2<br />
Smeets, E., M. Junginger, A. Faaij, A. Walter, P. Dolzan and W. Turkenburg, 2008. �e sustainability of<br />
Brazilian <strong>ethanol</strong>-An assessment of the possibilities of certi�ed production. Biomass and Bioenergy<br />
32: 781-813.<br />
Sparovek, G. and E. Schnug, 2001. Temporal Erosion-Induced Soil Degradation and Yield Loss. Soil Sci<br />
Soc Am J, 65: 1479-1486.<br />
Tercil, E.T., A.M.d.P. Peres, M.T.M. Peres, S.N.R. Guedes, P.F.A. Shikida and A.M.C.J. Corrêa, 2007. Os<br />
Mercados de Terra e trabalho na (re)estruturação da categoria social dos fornecedores de cana do Estado<br />
de São Paulo: análise de dados de campo. REDES, Santa Cruz do Sul 12: 142-167.<br />
Tominaga, T.T., F.A.M. Cássaro, O.O.S. Bacchi, K. Reichardt, J.C.M. Oliveira and L.C. Timm, 2002.<br />
Variability of soil water content and bulk density in a sugarcane �eld. Australian Journal of Soil<br />
Research 40: 605-614.<br />
Tubiello, F.N. and G. Fischer, 2006. Reducing <strong>climate</strong> <strong>change</strong> impacts on agriculture: Global and regional<br />
e�ects of mitigation, 2000–2080. Technological Forecasting & Social Change 74: 1030-1056.<br />
62 <strong>Sugarcane</strong> <strong>ethanol</strong>
Chapter 3<br />
Prospects of the sugarcane expansion in Brazil: impacts on<br />
direct and indirect land use <strong>change</strong>s<br />
André Meloni Nassar, Bernardo F.T. Rudor�, Laura Barcellos An<strong>to</strong>niazzi, Daniel Alves de<br />
Aguiar, Miriam Rumenos Piedade Bacchi and Marcos Adami<br />
1. Introduction<br />
<strong>Sugarcane</strong> has been an important crop since the initial colonization period of Brazil and<br />
is nowadays expanding considerably its cultivated area, particularly due <strong>to</strong> strong <strong>ethanol</strong><br />
demand. Ethanol demand has been increasing in the internal market since 2003 - due <strong>to</strong> the<br />
expansion of the �ex-fuel car �eet - and is also facing good perspectives in the international<br />
market. From 2000 <strong>to</strong> 2007 the cultivated sugarcane area increased by about 3 million ha,<br />
reaching about 7.9 million ha based on information from IBGE (2008a). �e South-Central<br />
region was responsible for 95.7% of this <strong>to</strong>tal growth.<br />
Sustainability of agricultural based biofuels has turned in<strong>to</strong> a central question once the use<br />
of biofuels with the aim <strong>to</strong> reduce greenhouses gases’ (GHG) emissions increases. �e full<br />
life cycle analysis of the production process of every feeds<strong>to</strong>ck, based on carbon equivalent<br />
emissions, is the essential measure for assessing the sustainability of biofuels.<br />
�e agricultural component of the biofuel production is, therefore, a key variable for<br />
determining the avoided carbon emissions. Agricultural products are, by its nature, large<br />
land users. Crops - annual and permanent - and cattle - for dairy and beef - occupy about<br />
77 and 172 million ha, respectively, in Brazil (IBGE, 2008b). Land use <strong>change</strong>s due <strong>to</strong> the<br />
competition between crops and cattle may raise concerns in terms of GHG emissions and<br />
it becomes even more important when land with natural vegetation (mainly forests and<br />
Cerrado) is converted in<strong>to</strong> cattle raising or agricultural production. �ere is no recognized<br />
and unquestionable methodology <strong>to</strong> measure the amount of deforestation caused by<br />
agricultural expansion. However, the amount of land allocated <strong>to</strong> pastures and crops in the<br />
frontier are indica<strong>to</strong>rs that both processes are correlated.<br />
Given that sustainability of Brazilian <strong>ethanol</strong> is intrinsically associated <strong>to</strong> the sugarcane<br />
expansion’s e�ects on land use <strong>change</strong>s, this paper aims <strong>to</strong> analyze past and expected<br />
sugarcane expansion in Brazil and <strong>to</strong> understand the land use <strong>change</strong> process. Competition<br />
between food and biofuel increases the importance of this issue and has been adding<br />
also social and economic concerns about land use <strong>change</strong> caused by biofuels’ expansion.<br />
Di�erent opinions from many international organizations, national governments, NGOs<br />
and researchers are putting this debate in the centre of media and public opinion worldwide.<br />
<strong>Sugarcane</strong> <strong>ethanol</strong> 63
Chapter 3<br />
Considering that this debate has not yet been explored in depth in Brazil, this paper aims<br />
<strong>to</strong> support these discussions with technical and scienti�c arguments.<br />
Land use <strong>change</strong>, as a consequence of the expansion of agricultural production as well as<br />
due <strong>to</strong> the competition for land among agricultural activities, is an issue under development<br />
in Brazil in terms of economic analysis and modeling. With exception of the analysis<br />
focused on land use <strong>change</strong>s related <strong>to</strong> deforestation in the Brazilian Amazon, which<br />
is well moni<strong>to</strong>red by Brazilian government agencies and environmentalists non-pro�t<br />
organizations, there is not regular moni<strong>to</strong>ring of the conversion of natural landscapes in<strong>to</strong><br />
agricultural uses. Furthermore, there is a lack of economic models that are able <strong>to</strong> explain<br />
and predict land allocation and land use <strong>change</strong> as a consequence of the dynamics of crops<br />
and pasture land. �is paper is a result of one of the initiatives under development in Brazil<br />
in order <strong>to</strong> clarify this issue.<br />
However, the complexity associated <strong>to</strong> measure land use <strong>change</strong> in the context of assessing<br />
biofuel’s carbon life cycle is largely related <strong>to</strong> the extension of the concept. Two approaches<br />
are under scrutiny: direct land use <strong>change</strong> (LUC); and indirect land use <strong>change</strong> (ILUC). �e<br />
objectives of the present study are <strong>to</strong> measure and evaluate direct <strong>change</strong>s of land use caused<br />
by the sugarcane expansion over the last years as well as the consequences of future expected<br />
expansion. Land use <strong>change</strong>s are measured in terms of crops and pasture directly displaced<br />
by the sugarcane expansion. �e study also aims <strong>to</strong> discuss indirect land use <strong>change</strong> related<br />
<strong>to</strong> Brazilian sugarcane expansion. Information and data are presented in order <strong>to</strong> evaluate<br />
e�ect-cause relationships between sugarcane and other agricultural expansion areas.<br />
�e measurement of land use <strong>change</strong>s as a consequence of agricultural production<br />
expansion, looking <strong>to</strong> the past and forecasting the future, is a very dynamic and complex<br />
process. �is paper searches for support on di�erent methodologies <strong>to</strong> understand this<br />
process: (1) when measuring the past land use <strong>change</strong>, primary data based on remote sensing<br />
images and environmental licensing reports as well as secondary data based on planted<br />
and harvested area are used; (2) with respect of projections of land allocated <strong>to</strong> sugarcane,<br />
a partial equilibrium model based on pro�tability and demand/supply responses <strong>to</strong> price<br />
variations is developed.<br />
�e paper is organized as follows. Section two introduces the discussion of the dynamics of<br />
the sugarcane expansion in Brazil and shows that the expansion is highly concentrated in the<br />
South-Central region. Section three presents the di�erent methodologies used in this study<br />
<strong>to</strong> measure land use <strong>change</strong> due <strong>to</strong> past and future expansion of sugarcane. Section four is<br />
also divided in two perspectives, past and future expansion, and presents the results of the<br />
assessment of the sugarcane expansion and the consequent crop and pasture displacement.<br />
Conclusions and recommendations are presented in section �ve.<br />
64 <strong>Sugarcane</strong> <strong>ethanol</strong>
2. The dynamics of sugarcane expansion in Brazil<br />
Prospects of the sugarcane expansion in Brazil<br />
Before discussing land use <strong>change</strong>s caused by the sugarcane expansion, it is important <strong>to</strong><br />
know how the sugarcane crop is spatially distributed in Brazil. Almost all of the sugarcane<br />
in Brazil is produced in the South-Central and Northeast regions. �ese two regions are<br />
considered separately due <strong>to</strong> its di�erent harvest seasons: the �rst is from April <strong>to</strong> Oc<strong>to</strong>ber<br />
and the second from November <strong>to</strong> March.<br />
Based on data from the Canasat Project for the states of São Paulo, Minas Gerais, Paraná,<br />
Ma<strong>to</strong> Grosso, Ma<strong>to</strong> Grosso do Sul and Goiás and from the IBGE (Brazilian Institute of<br />
Geography and Statistics) for all other states, it is estimated that in 2008 the cultivated area<br />
in the South-Central region was 7.4 million ha (85.0%) and in the Northeast region was<br />
1.3 million ha (14.7%).<br />
Figure 1 presents the evolution of sugarcane area for three regions: South-Central (comprising<br />
its six most important states) 2 , Northeast and all the other states. According <strong>to</strong> the statistics<br />
of IBGE the Northeast region has a relative steady sugarcane area, presenting a mean annual<br />
growth rate of only 2%; while in the South-Central region the annual growth rate was 16%<br />
over the last four years being responsible for 95.4% of the <strong>to</strong>tal sugarcane area expansion in<br />
Brazil from 2005 <strong>to</strong> 2008. During this period the sugarcane area in Brazil expanded by an<br />
annual rate of 13% (2.6 million ha) going from 6.1 <strong>to</strong> 8.7 million ha (Figure 1).<br />
São Paulo is the most important state for sugarcane, representing 55.7% of the <strong>to</strong>tal sugarcane<br />
area in Brazil in 2008. �e four states with the largest sugarcane area are São Paulo, Paraná,<br />
Minas Gerais and Goiás which are responsible for 75.2% of <strong>to</strong>tal sugarcane area in Brazil.<br />
Coincidently, these states plus Ma<strong>to</strong> Grosso and Ma<strong>to</strong> Grosso do Sul have experienced<br />
the greatest sugarcane expansion area over the last years. A new and promising region for<br />
sugarcane is located in the states of Maranhão, Piauí and Tocantins, in the Cerrado biome,<br />
commonly known in Brazil as the MAPITO region; however, in 2008 these states were<br />
responsible for only 0.25% of the cultivated sugarcane area in Brazil.<br />
South-Central, including MAPITO region, is here called Expanded South-Central and is<br />
considered <strong>to</strong> be a relevant region for sugarcane expansion analysis. �e sugarcane area<br />
in the Expanded South-Central in 2008 was 7.5 million hectares (84% of <strong>to</strong>tal area) and<br />
represents 97% of the <strong>to</strong>tal sugarcane expansion. In all other Brazilian states not included<br />
in the Expanded South-Central and Northeast regions, which accounts for 3% of the <strong>to</strong>tal<br />
sugarcane area, a reduction of 13.7 thousand hectares was observed from 2005 <strong>to</strong> 2008.<br />
2 Although South-Central region is commonly de�ned as the states in South, Southeast and Centre-West political<br />
regions, this paper refers <strong>to</strong> the South-Central as a region comprising São Paulo, Minas Gerais, Paraná, Goiás,<br />
Ma<strong>to</strong> Grosso do Sul and Ma<strong>to</strong> Grosso. �is de�nition is in line with the satellite images moni<strong>to</strong>red by the Canasat<br />
Project, due <strong>to</strong> the fact they are the most important states in terms of sugarcane expansion.<br />
<strong>Sugarcane</strong> <strong>ethanol</strong> 65
Chapter 3<br />
1,000 ha<br />
9,000<br />
8,000<br />
7,000<br />
6,000<br />
5,000<br />
4,000<br />
3,000<br />
2,000<br />
1,000<br />
0<br />
Figure 1. <strong>Sugarcane</strong> area cultivated in Brazil according <strong>to</strong> production regions (2005 <strong>to</strong> 2008).<br />
Sources: (a) Canasat/INPE, comprising São Paulo, Minas Gerais, Paraná, Goiás, Ma<strong>to</strong> Grosso and<br />
Ma<strong>to</strong> Grosso do Sul; (b) PAM/IBGE (2005 and 2006) and LSPA/IBGE (2007 and 2008).<br />
�erefore, for this work the evaluation of the conversion of land use and occupation for<br />
sugarcane is restricted <strong>to</strong> a reduced South-Central region that comprises the states of São<br />
Paulo, Minas Gerais, Goiás, Paraná, Ma<strong>to</strong> Grosso do Sul and Ma<strong>to</strong> Grosso (or South-Central<br />
region minus the states of Rio de Janeiro, Espíri<strong>to</strong> San<strong>to</strong>, Santa Catarina and Rio Grande<br />
do Sul) 3 in Sections 3.1 and 4.1 and these states plus Maranhão, Piauí, Tocantins and Bahia<br />
in Sections 3.2 and 4.2. As a means of illustration, a detailed visualization of the sugarcane<br />
distribution in the South-Central region is presented in Figure 2.<br />
3. Methodology<br />
Annual growth rate (2005 <strong>to</strong> 2008)<br />
South-Central 16% p.a.<br />
Northeast 2% p.a.<br />
Other 2% p.a.<br />
Brazil 13% p.a.<br />
2005 2006 2007 2008<br />
South-Central (a)<br />
Northeast (b)<br />
Other (b)<br />
�is papers divides the analysis of land use <strong>change</strong>s (LUC) caused by sugarcane expansion<br />
basically in observed LUC (past trend) and projected LUC (future trend). �ree di�erent<br />
methods were used <strong>to</strong> estimate past land use dynamics, and another one <strong>to</strong> project future<br />
trend. For observed LUC and sugarcane expansion, we used the information extracted from<br />
remote sensing images, secondary data by IBGE, and �eld research through environmental<br />
licensing studies. �e satellite image analysis was carried out for São Paulo, Minas Gerais,<br />
Paraná, Goiás, Ma<strong>to</strong> Grosso and Ma<strong>to</strong> Grosso do Sul. Using IBGE data, all these states plus<br />
Tocantins, Maranhão, Piauí and Bahia were analyzed due <strong>to</strong> their potentiality for future<br />
expansion of agricultural area in Brazil. For the �eld research, the analyzed states were São<br />
3 �e states of Rio de Janeiro, Espíri<strong>to</strong> San<strong>to</strong>, Santa Catarina and Rio Grande do Sul are part of the South-Central<br />
region but represent only 3.2% of the cultivated sugarcane area in 2008 and have not shown relevant sugarcane<br />
expansion over the last years (Table 3).<br />
66 <strong>Sugarcane</strong> <strong>ethanol</strong>
Prospects of the sugarcane expansion in Brazil<br />
Figure 2. Spatial distribution of sugarcane crop in 2007 in the South-Central region of Brazil. Source:<br />
INPE (www.dsr.inpe.br/canasat/).<br />
Paulo, Minas Gerais, Ma<strong>to</strong> Grosso, Ma<strong>to</strong> Grosso do Sul, Goiás and Tocantins, capturing<br />
both past and near future trends. A deeper description of each method follows below.<br />
It is important <strong>to</strong> clarify the available sources of data regarding sugarcane area in Brazil, since<br />
di�erent ones are used for di�erent purposes here. �e Brazilian Institute for Geography<br />
and Statistics (IBGE) is the Brazilian o�cial organization which provides data on crops<br />
area, production, yield, and several others variables. For estimation of planted and harvested<br />
sugarcane area, two IBGE databases can be used: one from the systematical survey on<br />
agricultural production (LSPA – Levantamen<strong>to</strong> Sistemático da Produção Agrícola) and<br />
the other from the agricultural production by municipality (PAM – Produção Agrícola<br />
Municipal). While the former includes all area occupied with sugarcane – which consists of<br />
areas <strong>to</strong> be harvested and new areas, <strong>to</strong> be harvested only next year – the latter just includes<br />
harvested area in a certain year 4 . PAM data is available for all geographic scales, from 1990<br />
<strong>to</strong> 2006 while LSPA data are forecasts from previous and current years subjected <strong>to</strong> <strong>change</strong>.<br />
4 <strong>Sugarcane</strong> crop is harvested yearly for 5 or 6 consecutive years. In general, a�er that period the sugarcane �eld is<br />
renewed and generally rotated for soil improvement during one season with a crop from the Leguminosae family.<br />
Planted area (or <strong>to</strong>tal land occupied by sugarcane), therefore, is the area available for harvest of sugarcane plus<br />
the area of sugarcane that is being renewed.<br />
<strong>Sugarcane</strong> <strong>ethanol</strong> 67
Chapter 3<br />
Another source of data on sugarcane planted area is the National Food Supply Company<br />
(CONAB). CONAB data, which are presented in a crop assessment reports, are not used<br />
in this study.<br />
<strong>Sugarcane</strong> planted area is also provided on the Canasat Project, coordinated by the National<br />
Institute for Space Research (INPE). Canasat Project moni<strong>to</strong>rs the most important producing<br />
states and estimates the planted area from remote sensing satellite images. A summary of<br />
data available in Brazil is presented in the Table 1.<br />
Table 1. <strong>Sugarcane</strong> area in Brazil (sources of data available).<br />
Source Data gathering Period available Data presented Aggregation level<br />
IBGE LSPA survey 1990-2006 planted area and<br />
harvested area<br />
state (Brazil)<br />
PAM survey 1990-2006 harvested area municipality (Brazil)<br />
CONAB crop assessment 2005, 2007-2008 planted area state (Brazil)<br />
INPE/Canasat satellite images 2003/2005 - 2008 planted area municipality (South-<br />
Centre)<br />
3.1. Measuring the LUC using remote sensing images<br />
Remote sensing satellite images from the Earth surface are an important source of information<br />
<strong>to</strong> evaluate the fast land use <strong>change</strong>s observed by the dynamic agricultural activity. Brazil,<br />
through its National Institute for Space Research (INPE), acquires remote sensing images<br />
from both Landsat and CBERS satellites since 1973 and 1999, respectively. In 2003, INPE<br />
started the Canasat Project <strong>to</strong>gether with UNICA (<strong>Sugarcane</strong> Industry Association), CEPEA<br />
(Center for Advanced Studies on Applied Economics) and CTC (Center of <strong>Sugarcane</strong><br />
Technology) <strong>to</strong> map the cultivated sugarcane area in the South-Central region of Brazil<br />
using remote sensing images (www.dsr.inpe.br/canasat/).<br />
�e mapping began in São Paulo State in 2003 and in 2005 it was extended <strong>to</strong> the states of<br />
Minas Gerais, Goiás, Ma<strong>to</strong> Grosso do Sul and Ma<strong>to</strong> Grosso where sugarcane production<br />
has been most intensi�ed over the last years. In order <strong>to</strong> obtain an accurate thematic map,<br />
multitemporal images were acquired at speci�c periods <strong>to</strong> correctly identify the sugarcane<br />
�elds and <strong>to</strong> clearly distinguishing them from other targets (Rudor� and Sugawara,<br />
2007). �e mapping procedure was mainly performed through visual interpretation on<br />
the computer screen using the SPRING so�ware (www.dpi.inpe.br/spring/), which is a<br />
Geographic Information System (GIS) with digital image processing capabilities.<br />
68 <strong>Sugarcane</strong> <strong>ethanol</strong>
Prospects of the sugarcane expansion in Brazil<br />
Results from the thematic maps of the Canasat Project presented in Section 4.1 refer <strong>to</strong> the<br />
<strong>to</strong>tal cultivated sugarcane area which includes the �elds being renewed with the 18 months<br />
sugarcane plant, the �elds planted in new areas (expansion) and the �elds of sugarcane<br />
ra<strong>to</strong>ons (Sugawara et al., 2008). Prior land use identi�cation for the expanded sugarcane<br />
plantations in each year was carried out using remote sensing images acquired before the<br />
land use <strong>change</strong> <strong>to</strong> sugarcane. �is evaluation was accomplished in São Paulo for the years<br />
of 2005 <strong>to</strong> 2008, and for the years of 2007 and 2008 for the States of Minas Gerais, Goiás,<br />
Paraná, Ma<strong>to</strong> Grosso do Sul and Ma<strong>to</strong> Grosso.<br />
Four classes of land use and occupation were de�ned, as follows: Agriculture, for cultivated<br />
and bare soil �elds; Pasture, for natural and anthropogenic pasture land; Reforestation, for<br />
reforested areas with Pinus and Eucalyptus; and Forest, for riparian forests and other forests<br />
no matter the stage of succession. In São Paulo State the Citrus class was also considered<br />
due <strong>to</strong> its relevance in terms of land occupation and <strong>change</strong> <strong>to</strong> sugarcane. �ese �ve classes<br />
were responsible for almost all of the <strong>change</strong>s <strong>to</strong> sugarcane. Figure 3 illustrates each of these<br />
classes over some Landsat images acquired at two di�erent dates prior <strong>to</strong> the <strong>change</strong> and<br />
one date a�er the <strong>change</strong> <strong>to</strong> sugarcane. Figure 3a highlights a �eld classi�ed as Agriculture.<br />
On Date 1 (March of 2003), the �eld has the appearance of bare soil (medium-gray), and<br />
on Date 2 (May of 2003), it is covered with a winter crop - probably maize. On Date 3 (April<br />
of 2008), a well grown sugarcane �eld can be clearly identi�ed (light-gray with well de�ned<br />
pathways). An example for the Pasture class is illustrated in Figure 3b where it appears as<br />
a mixture of di�erent amounts of vegetation and soil (medium/light-gray). On Date 1, the<br />
vegetation amount is dominant (end of rain season) whereas on Date 2 the soil becomes<br />
dominant due <strong>to</strong> a reduction in the green vegetation amount in response <strong>to</strong> less available<br />
water <strong>to</strong> the plant (mid dry season). On Date 3, a sugarcane �eld can be observed in<br />
substitution <strong>to</strong> the pasture �eld. Figure 3c illustrates the Citrus class with its typical pattern<br />
on Date 1 and 2, and a sugarcane �eld on Date 3. Figure 3d presents a typical �eld for the<br />
Forest class (Dates 1 and 2) that was <strong>change</strong>d <strong>to</strong> sugarcane (Date 3). A �eld <strong>change</strong>d from<br />
the Reforestation class <strong>to</strong> sugarcane is illustrated in Figure 3e.<br />
It is worth <strong>to</strong> mention that Figure 3 only illustrates, in a simpli�ed way, part of the whole<br />
procedure used <strong>to</strong> identify the di�erent land use classes that were displaced <strong>to</strong> sugarcane<br />
in each year over the analyzed period. In several occasions a greater number of images<br />
were necessary <strong>to</strong> clearly identify the classes that were <strong>change</strong>d <strong>to</strong> sugarcane. �e SPRING<br />
so�ware allows coupling images acquired at di�erent dates <strong>to</strong> alternate views of the same<br />
area facilitating the visual interpretation resulting in a better extraction of the correct<br />
information registered in the coloured multispectral satellite images.<br />
<strong>Sugarcane</strong> <strong>ethanol</strong> 69
Chapter 3<br />
Figure 3. Different land use classes over multispectral (bands 3, 4 and 5) black and white Landsat<br />
images acquired in March of 2003 (date 1), May of 2003 (date 2), and April of 2008 (date 3).<br />
3.2. Measuring the LUC using micro-regional secondary data<br />
�e objective of this method is <strong>to</strong> analyze the o�cial secondary data about sugarcane and<br />
other agricultural land uses in order <strong>to</strong> verify how substitution among these uses have taken<br />
place over the last years, in di�erent areas all over Brazil. Knowing how sugarcane expansion<br />
has occurred and how other land uses have behaved is a �rst step <strong>to</strong> make considerations<br />
about LUC and ILUC caused by <strong>ethanol</strong> production.<br />
�e analysis developed here was based on the Shi�-share model adapted for the purposes of<br />
this study. �e Shi�-share model looks at the mix of activities and whether they are shi�ing<br />
<strong>to</strong>wards or away from the area being studied (Oliveira et al., 2008).<br />
�e Shi�-share model decomposes the growth area of an agriculture activity in a region<br />
over a given period of time in<strong>to</strong> two components: (1) growth e�ect, which is the part of the<br />
<strong>change</strong> attributed <strong>to</strong> the growth rate of the agriculture as a whole; and (2) an agriculture<br />
70 <strong>Sugarcane</strong> <strong>ethanol</strong>
Prospects of the sugarcane expansion in Brazil<br />
mix e�ect (substitution e�ect), which is the <strong>change</strong> in each crop share of the <strong>to</strong>tal cultivated<br />
area. �e sum of the two e�ects equals <strong>to</strong> the actual <strong>change</strong> in <strong>to</strong>tal sugarcane area within<br />
a region over a time period.<br />
We have used sugarcane and other crops harvested area data from IBGE, by ‘micro-region’,<br />
which is an aggregated number of some closely located municipalities with geographic<br />
similarities. �e main advantage of using data by ‘micro-region’ is that it is a su�cient<br />
small unit so that land substitution is captured in a more direct way, avoiding leakages.<br />
Furthermore, the same method using data by municipality has presented some problems,<br />
probably due <strong>to</strong> the fact that municipalities have correlated productive relations and<br />
sometimes municipality data are not very accurate.<br />
We have considered 2002 as the baseline year when the last signi�cant sugarcane expansion<br />
began and 2006 as the last year of available data from PAM-IBGE. Since expanded sugarcane<br />
area, harvested in a certain year, was planted about 12 or 18 months before, the prior land<br />
use needs <strong>to</strong> be observed still another year before. For example, 2006 sugarcane data regards<br />
sugarcane harvested in 2006 and most likely planted in the beginning of 2005; therefore,<br />
land use prior <strong>to</strong> the 2005 sugarcane plantation should be observed in the data from 2004.<br />
�us we have compared sugarcane expansion from 2002 <strong>to</strong> 2006 <strong>to</strong> other land occupation<br />
from 2001 <strong>to</strong> 2005.<br />
�e three land use categories are: (a) sugarcane; (b) other crops (annual and permanent<br />
crops, excluding sugarcane and second crops); and (c) pasture. Pasture land was estimated<br />
by using cattle s<strong>to</strong>cking rate because data on pasture area are available only on the IBGE<br />
Agricultural Census of 1996 and 2006, while cattle herd data is available annually. �us,<br />
s<strong>to</strong>cking rate for 1996 and 2006 were calculated and an annual average growth for this<br />
period was considered. Pasture area for the analyzed years – 2001 <strong>to</strong> 2005 – were obtained<br />
dividing herd by the s<strong>to</strong>cking rate. Total agricultural area is the sum of these three categories,<br />
and should represent agricultural dynamics in general. �e data used for analysis was the<br />
di�erence between the �nal period and the baseline, thus positive numbers mean that there<br />
was an increase in the period while negative numbers mean that the area has decreased.<br />
Following a logic tree of land use dynamics for the period, the ‘micro-regions’ were divided<br />
in six categories (Figure 4). We have only considered for analysis those ‘micro-regions’ where<br />
sugarcane area has increased, which means groups 2, 3 and 6. �us expansion of sugarcane<br />
was distributed proportionally through decreased areas of pasture land and crops. When<br />
it was not possible <strong>to</strong> allocate sugarcane expansion over these land uses, it was considered<br />
not allocated over previous productive areas, meaning whether already anthropized areas<br />
not used, such as idle areas, or natural landscapes. Using shi�-share terminology, sugarcane<br />
expansion over pasture and crops is considered substitution e�ect, while those over not<br />
productive areas are considered growth e�ect.<br />
<strong>Sugarcane</strong> <strong>ethanol</strong> 71
Chapter 3<br />
1-Pastureand<br />
crops<br />
expansion<br />
Figure 4. Land use dynamics’ categories used for micro-regional secondary data analysis.<br />
3.3. Case studies through environmental licensing reports (past and near future trend)<br />
�is third method is an empirical study which aims <strong>to</strong> collect �eld data from sugarcane mills<br />
in six states where the crop is under strong expansion or is expected <strong>to</strong> be in near future:<br />
São Paulo, Minas Gerais, Ma<strong>to</strong> Grosso, Ma<strong>to</strong> Grosso do Sul, Goiás and Tocantins 5 .<br />
Environmental Impact Assessments presented in �les of environmental licenses in<br />
governmental bodies can be a useful source of information about many environmental,<br />
social and economic impacts caused by any business venture. Environmental licensing is<br />
an important instrument present in the Brazilian Environmental Policy and all sugarcane<br />
mills are required <strong>to</strong> have this license <strong>to</strong> operate. Governmental agencies responsible for<br />
issuing environmental licenses - state bodies in this case – de�ne which type of study<br />
will be necessary for the entrepreneur <strong>to</strong> present. �e most complex type of study would<br />
be the Environmental Impact Study (EIA, in Portuguese acronym) and the respective<br />
Environmental Impact Report (RIMA, which is a synthesis of EIA in a non-technical<br />
language). �is study, made by the entrepreneur, contains a full characterization of the<br />
business venture, a diagnosis of the surrounding area (here including information on land<br />
use), and the impacts it will cause (natural vegetation suppression included). Even in the<br />
less complex studies, this kind of information is generally available.<br />
5 State of Paraná was excluded due <strong>to</strong> research restrictions imposed by the environmental authority of the state<br />
government.<br />
Increased (+)<br />
Pasture land<br />
and crops<br />
+ + - +<br />
-<br />
-<br />
2-Agricultural<br />
expansion<br />
Total used area<br />
(sugarcane + pasture + crops)<br />
- + -<br />
+<br />
Pasture land<br />
and crops<br />
3-<strong>Sugarcane</strong><br />
expansion<br />
Pasture land<br />
and crops<br />
4-Other activities<br />
expansion<br />
Decreased (-)<br />
<strong>Sugarcane</strong> <strong>Sugarcane</strong><br />
Pasture land<br />
and crops<br />
5-Declining<br />
agriculture<br />
6-<strong>Sugarcane</strong><br />
over other<br />
activities<br />
72 <strong>Sugarcane</strong> <strong>ethanol</strong>
Prospects of the sugarcane expansion in Brazil<br />
�rough the environmental studies used <strong>to</strong> get this license, and through the governmental<br />
agencies’ database, one can obtain the exact location of mills and the economically feasible<br />
surrounding area where sugarcane is or will be cultivated. Knowing current land use in<br />
these areas by the time of the study, one can know land use prior <strong>to</strong> sugarcane plantations,<br />
as well as the type of original natural landscape when this is present.<br />
Brazilian environmental licensing system is composed of three di�erent phases, each of<br />
them resulting in a di�erent license. �e environmental study required by the appropriate<br />
governmental agency has <strong>to</strong> be submitted and approved <strong>to</strong> obtain the Previous License (LP,<br />
in Portuguese). �e LP certi�es the environmental viability of the project at that speci�c<br />
location, and it means the entrepreneur can ask for the Installation License (LI). Just with<br />
the LI it is legal <strong>to</strong> start the construction of the mill plant, but <strong>to</strong> initiate operation and<br />
production, the Operation License (LO) is required. �e LP analysis generally takes long,<br />
because the agency must analyze deep studies, such as EIA-RIMAs, while <strong>to</strong> issue the other<br />
two licenses the approval periods are usually smaller.<br />
By knowing which phase of the environmental licensing a mill project is ongoing or<br />
when the LO was issued, one can know when the mill will start or has started production.<br />
Furthermore, the environmental study speci�es the business plan, which includes expected<br />
date <strong>to</strong> start-up. Field research was conduced between May and June, 2008.<br />
3.4. Projecting sugarcane expansion and <strong>change</strong>s in land use<br />
�e approach used for projecting land allocation for sugarcane is based on a partial<br />
equilibrium model that is under development by the Institute for International Trade<br />
Negotiations (ICONE). �e model is based on demand response <strong>to</strong> price <strong>change</strong>s and<br />
supply response <strong>to</strong> market returns (pro�tability) <strong>change</strong>s. National and regional prices are<br />
calculated according <strong>to</strong> a basic assumption of microeconomics: they are achieved when<br />
supply and demand prices for each coincide, generating a market equilibrium.<br />
�e model comprises 11 categories of products (sugarcane, soybean, maize, cot<strong>to</strong>n, rice,<br />
dry beans, milk, beef, chicken, eggs and pork) and 6 regions: South (states of Rio Grande<br />
do Sul, Santa Catarina and Paraná), Southeast (states of São Paulo, Minas Gerais, Rio de<br />
Janeiro and Espíri<strong>to</strong> San<strong>to</strong>), Central-West Cerrados (states of Goiás, Ma<strong>to</strong> Grosso do Sul<br />
and Ma<strong>to</strong> Grosso under the Cerrados ecosystem), North-northeast Cerrados (states of<br />
Tocantins, Bahia, Piauí and Maranhão under the Cerrado ecosystem), Amazon Biome<br />
(states of Acre, Amazonas, Rondônia, Roraima, Amapá, Pará and Ma<strong>to</strong> Grosso under the<br />
Amazon ecosystem) and Northeast Coast (states of Ceará, Rio Grande do Norte, Paraíba,<br />
Pernambuco, Alagoas and Sergipe). Estimated projections are performed on a yearly basis<br />
over a period of 10 years.<br />
<strong>Sugarcane</strong> <strong>ethanol</strong> 73
Chapter 3<br />
Given that the model is under development, a reduced version, comprising only the land<br />
allocation components, is used for projections presented here. Domestic demand and<br />
expected net trade are calculated exogenously, using world prices contained in the Fapri’s<br />
2008 Outlook (Fapri, 2008). Production is calculated in order <strong>to</strong> meet demand and net<br />
trade needs.<br />
Total national area allocated for grains and sugarcane is calculated according <strong>to</strong> yields trends.<br />
In the case of pasture, <strong>to</strong>tal national area is the sum of regional areas. For each region, land<br />
allocation equations were speci�ed according <strong>to</strong> the competition among crops and cattle.<br />
�e allocation of land on the six regions and between product’s categories is calculated<br />
on the model’s land use component. �e amount of land <strong>to</strong> be allocated for each activity<br />
is de�ned according <strong>to</strong> the required production <strong>to</strong> meet the domestic demand and net<br />
trade projections and yields trends. Allocated land is calculated by region, and crops and<br />
pasture compete according <strong>to</strong> the expected market returns per hectare. For each region and<br />
activity, speci�c competition equations were de�ned and elasticities were calculated. Land<br />
use <strong>change</strong> is measured comparing, in each region, the amount of land allocated for each<br />
activity. Absolute annual variation indicates activities that are incorporating land and the<br />
ones that are being displaced.<br />
�e competition matrix used for the speci�cation of the land allocation regional models is<br />
described in Table 2. �e competition matrix was de�ned according <strong>to</strong> trends in harvested<br />
area observed from 1997 <strong>to</strong> 2008 and comparing market returns per hectare. Activities<br />
with higher market returns tend <strong>to</strong> have a lower number of competi<strong>to</strong>rs. His<strong>to</strong>rical market<br />
returns also indicate activities that are land taker and land releaser. Cattle, for example, is a<br />
typical land releaser activity and, therefore, all crops compete with pasture.<br />
It is important <strong>to</strong> mention that the regional area allocated <strong>to</strong> pastures is calculated<br />
independently of the herd projections. Projections on regional herd and pasture must<br />
be compared <strong>to</strong> evaluate whether they are compatible with s<strong>to</strong>cking rate (number of<br />
animals per hectare) trends. Although this is a limitation, because the s<strong>to</strong>cking rate is<br />
not endogenous on the model, the results presented in this study are in line with the past<br />
trends in s<strong>to</strong>cking rate.<br />
Regional data, however, is <strong>to</strong>o aggregate for the objective of evaluating direct land use<br />
e�ect of sugarcane expansion. Regional projections are breakdown by micro-regional<br />
level, in order <strong>to</strong> obtain the same level of disaggregation used in the section 3.3. Products<br />
categories are aggregated in sugarcane, pastures and grains 6 . Projected land use for each<br />
category is disaggregated according <strong>to</strong> the evolution of market share of each micro-region<br />
in the region.<br />
6 Grains, for the objective of the projections, comprise the following activities: soybean, maize, cot<strong>to</strong>n, rice and<br />
dry beans.<br />
74 <strong>Sugarcane</strong> <strong>ethanol</strong>
Table 2. Regional land competition matrix.<br />
Region and competing product<br />
South<br />
Southeast<br />
Centerwest<br />
Cerrados<br />
Amazon<br />
biome<br />
Northeast<br />
coastal<br />
Northnortheast<br />
Cerrados<br />
Cot<strong>to</strong>n<br />
soybean<br />
maize<br />
soybean<br />
maize<br />
soybean<br />
maize<br />
rice<br />
dry beans<br />
Prospects of the sugarcane expansion in Brazil<br />
�e calculation of the substitution of crops and pastures by sugarcane is executed following<br />
a similar methodology of the Shi� share model presented in the section 3.2. Given that the<br />
projected period used was 2008 <strong>to</strong> 2018, sugarcane expansion is calculated as the absolute<br />
variation from 2018 <strong>to</strong> 2008 and crops and pastures expansion is calculated using a one<br />
year lag.<br />
As well as the secondary data analysis for past expansion, the model is using harvested area<br />
rather than planted area. �erefore, the <strong>to</strong>tal area occupied with sugarcane is necessarily<br />
higher than the amount presented in the projections.<br />
4. Results and discussions<br />
<strong>Sugarcane</strong><br />
soybean<br />
maize<br />
soybean<br />
maize<br />
soybean<br />
maize<br />
Product (dependant variable)<br />
Soybean<br />
sugarcane<br />
maize<br />
�e results are discussed following the same structure of the methodology section: (a) Subsection<br />
4.1 presents the past expansion measured through remote sensing techniques; (b)<br />
Sub-section 4.2 brings the results based on secondary data; (c) Sub-section 4.3 is devoted<br />
<strong>Sugarcane</strong> <strong>ethanol</strong> 75<br />
Maize<br />
sugarcane<br />
soybean<br />
sugarcane sugarcane<br />
maize soybean<br />
cot<strong>to</strong>n cot<strong>to</strong>n<br />
sugarcane sugarcane<br />
maize soybean<br />
cot<strong>to</strong>n cot<strong>to</strong>n<br />
maize soybean<br />
Rice<br />
Dry beans<br />
soybean<br />
maize<br />
rice<br />
Cattle/pasture<br />
all crops<br />
all crops<br />
soybean all crops<br />
soybean all crops<br />
maize maize all crops<br />
cot<strong>to</strong>n<br />
maize<br />
cot<strong>to</strong>n<br />
soybean<br />
soybean<br />
soybean<br />
maize<br />
rice<br />
all crops
Chapter 3<br />
<strong>to</strong> the case studies; (d) Sub-section 4.4 presents the projections on land use for sugarcane;<br />
and (e) Sub-section 4.5 discusses options for analyzing ILUC.<br />
A summary of the results obtained from the three di�erent methodologies used in this study<br />
is presented in Table 3. Detailed results are discussed in the sub-sections.<br />
Table 3. Land use classes converted <strong>to</strong> sugarcane: comparative results in the South-Central region<br />
(1000 ha).<br />
Period/measurement method<br />
2002-2006<br />
(harvested area) 1<br />
4.1. LUC evaluation through remote sensing images<br />
2007-2008<br />
(planted area) 2<br />
2008-2018<br />
(harvested area) 3<br />
<strong>Sugarcane</strong> expansion 1,030 2,184 3,848<br />
Agriculture 122 (12%) 1,152 (53%) 1,455 (38%)<br />
Pasture 793 (77%) 991 (45%) 2,369 (62%)<br />
Other 114 (11%) 42 (2%) 24 (1%)<br />
1 Source: secondary data from IBGE.<br />
2 Source: satellite images.<br />
3 Source: projection model.<br />
�is sub-section analysis the expanded sugarcane area harvested for the �rst time and is<br />
divided in three parts: (1) analysis comprising the years of 2007 and 2008 for the states of<br />
Minas Gerais, Goiás, Paraná Ma<strong>to</strong> Grosso do Sul and Ma<strong>to</strong> Grosso; (2) analysis comprising<br />
the period from 2005 <strong>to</strong> 2008 for the State of São Paulo; and (3) analysis comparing the years<br />
of 2007 and 2008 for the reduced South-Central region 3 (or South-Central region minus<br />
the states of Rio de Janeiro, Espíri<strong>to</strong> San<strong>to</strong>, Santa Catarina and Rio Grande do Sul).<br />
4.1.1. Analysis for the years of 2007 and 2008 in the states of Minas Gerais, Goiás,<br />
Paraná, Ma<strong>to</strong> Grosso do Sul and Ma<strong>to</strong> Grosso<br />
Figure 5 shows the results for the Pasture, Agriculture, Reforestation and Forest classes which<br />
were displaced for the expansion of sugarcane crop harvested for the �rst time in 2007 and<br />
2008. Most of the expansion of sugarcane area <strong>to</strong>ok place over the Agriculture and Pasture<br />
classes. �e Agriculture class registered the largest displaced area <strong>to</strong> sugarcane except for<br />
76 <strong>Sugarcane</strong> <strong>ethanol</strong>
1,119<br />
2%<br />
1,892<br />
8%<br />
25,656<br />
21%<br />
25,703<br />
30%<br />
35,039<br />
33%<br />
18,395<br />
40%<br />
8,440<br />
33%<br />
2007<br />
739<br />
1%<br />
93,883<br />
78%<br />
59,442<br />
70%<br />
71,883<br />
67%<br />
26,823<br />
58%<br />
15,134<br />
59%<br />
Minas Gerais<br />
Total expansion:<br />
2007 120,306<br />
2008 141,190<br />
Goiás<br />
Total expansion:<br />
2007 85,559<br />
2008 143,155<br />
Paraná<br />
Total expansion:<br />
2007 107,350<br />
2008 97,719<br />
Ma<strong>to</strong> Grosso du Sul<br />
Total expansion:<br />
2007 46,446<br />
2008 87,434<br />
Prospects of the sugarcane expansion in Brazil<br />
2,385<br />
Ma<strong>to</strong> Grosso<br />
8%<br />
Total expansion:<br />
2007 25,524<br />
2008 30,735<br />
48,284<br />
34%<br />
34,514<br />
24%<br />
42,336<br />
43%<br />
48,465<br />
55%<br />
10,555<br />
34%<br />
forest<br />
agriculture<br />
pasture 2008<br />
91,959<br />
65%<br />
108,072<br />
76%<br />
55,159<br />
57%<br />
38,908<br />
45%<br />
17,761<br />
58%<br />
Figure 5. Area in hectares and percentages of the land use classes converted <strong>to</strong> sugarcane in 2007<br />
and 2008 in the states of Minas Gerais, Goiás, Paraná, Ma<strong>to</strong> Grosso do Sul and Ma<strong>to</strong> Grosso.<br />
<strong>Sugarcane</strong> <strong>ethanol</strong> 77<br />
876<br />
1%
Chapter 3<br />
Ma<strong>to</strong> Grosso do Sul in 2008 when the Pasture and Agriculture classes <strong>to</strong>ok place over 55.4<br />
and 44.5% of the sugarcane expansion, respectively.<br />
For the analyzed states in this section it was veri�ed that the Agriculture class decreased<br />
its contribution of displaced area for sugarcane expansion from 69.3% in 2007 <strong>to</strong> 62.2% in<br />
2008. Conversely the Pasture class increased its contribution from 29.4% in 2007 <strong>to</strong> 37% in<br />
2008 suggesting a trend of increasing sugarcane expansion over the Pasture class.<br />
In Minas Gerais, Goiás and Paraná more than 99% of the sugarcane expansion was observed<br />
over the classes of Agriculture and Pasture. In Ma<strong>to</strong> Grosso do Sul, 2.41% (1,119 ha) of the<br />
area of sugarcane expansion <strong>to</strong>ok place over the Forest class in 2007; while in 2008 it was<br />
insigni�cant (61 ha). In the state of Ma<strong>to</strong> Grosso the sugarcane expansion over the Forest<br />
class was 7.4% (1,892 ha) in 2007 and 7.8% (2,385 ha) in 2008.<br />
4.1.2. Analysis for the period from 2005 <strong>to</strong> 2008 in the state of São Paulo<br />
Figure 6 shows the results for Pasture, Agriculture, Reforestation, Forest and Citrus classes<br />
which were displaced for the expansion of the sugarcane crop harvested for the �rst time<br />
from 2005 <strong>to</strong> 2008 in São Paulo State. During the analyzed period a sugarcane expansion<br />
of 1,810 million ha was observed. Pasture (53%; 960,000 ha) and Agriculture (44.6%;<br />
808,000 ha) were responsible for 97.7% (1,768 million ha) of the <strong>change</strong>. About 2% (36,900<br />
ha) of sugarcane expansion <strong>to</strong>ok place over the Citrus class and 0.31% (5,500 ha) over the<br />
Reforestation and Forest classes <strong>to</strong>gether. Based on the data shown in Figure 6 it is not<br />
possible <strong>to</strong> conclude that the Pasture class tends <strong>to</strong> increase its contribution in displaced<br />
area for sugarcane expansion in relation <strong>to</strong> the Agriculture class. Nevertheless in 2008 the<br />
Pasture class contribution is the largest (56.1%) and the Agriculture class is the smallest<br />
(40.6%) in the four analyzed years.<br />
4.1.3. Analysis for the years of 2007 and 2008 in the South-Central region<br />
Figure 7 shows the results that refer <strong>to</strong> the classes of land use that were displaced for sugarcane<br />
expansion in the most relevant producing states of the South-Central region in 2007 and<br />
2008. In both years, Pasture and Agriculture classes were <strong>to</strong>gether responsible for 98.1%<br />
of the <strong>to</strong>tal area displaced for sugarcane expansion (2,184 thousand ha). �e Pasture class<br />
was responsible for 45.4% (0.991 million ha) and the Agriculture class was responsible for<br />
52.7% (1,152 thousand ha) of the displaced area for sugarcane (Table 3). About 1.3% of<br />
sugarcane expansion <strong>to</strong>ok place over the Citrus class (28,916 ha) and 0.58% (12,623 ha) over<br />
the Reforestation and Forest classes <strong>to</strong>gether (others in Figure 7). Figure 7 shows that the<br />
Agriculture class was more displaced than the Pasture class for sugarcane expansion; however,<br />
78 <strong>Sugarcane</strong> <strong>ethanol</strong>
1,429<br />
1%<br />
8,997<br />
1%<br />
107,352<br />
52%<br />
321,119<br />
51%<br />
2005<br />
2007<br />
96,940<br />
47%<br />
304,625<br />
48%<br />
6,523<br />
2%<br />
19,919<br />
3%<br />
160,540<br />
53%<br />
371,262<br />
56%<br />
2006<br />
2008<br />
Prospects of the sugarcane expansion in Brazil<br />
137,456<br />
45%<br />
268,633<br />
41%<br />
citrus<br />
agriculture<br />
pasture<br />
Total expansion: 2005 205,958<br />
2006 305,603<br />
2007 636,814<br />
2008 661,969<br />
Figure 6. Area in hectares and percentages of the classes of land use that were displaced for<br />
sugarcane expansion in São Paulo State from 2005 <strong>to</strong> 2008.<br />
8,997<br />
1%<br />
434,330<br />
42%<br />
2007<br />
6,863<br />
1%<br />
571,810<br />
56%<br />
19,919<br />
2%<br />
556,703<br />
48%<br />
5,760<br />
0%<br />
others<br />
citrus<br />
agriculture<br />
pasture<br />
Figure 7. Area in hectares and percentages of the classes of land use displaced for the expansion<br />
of sugarcane in the most relevant sugarcane producing states in the South-Central region in 2007<br />
and 2008.<br />
<strong>Sugarcane</strong> <strong>ethanol</strong> 79<br />
2008<br />
579,821<br />
50%<br />
Total expansion: 2007 1,022,000<br />
2008 1,162,203
Chapter 3<br />
the Pasture class increased from 42.5 <strong>to</strong> 47.9% its relative contribution, while the Agriculture<br />
class decreased its relative contribution from 55.9 <strong>to</strong> 49.9% from 2007 <strong>to</strong> 2008. 7<br />
Finally we can conclude that the remote sensing images obtained systematically by<br />
the Landsat and CBERS satellites enabled an accurate identi�cation of land use classes<br />
de�ned in this work, which were displaced for the recent and most relevant sugarcane<br />
expansion observed in Brazil. �e visual interpretation of the remote sensing images on<br />
a computer screen is hard-working, but it allows an accurate classi�cation of the areas of<br />
interest producing a reliable thematic classi�cation through an objective and measurable<br />
procedure.<br />
4.2. Micro-regional secondary data<br />
�e dynamics of agricultural area and sugarcane in particular is presented in Table 4.<br />
<strong>Sugarcane</strong> expansion from 2002 <strong>to</strong> 2006 in the ten states analyzed reached 1,077 thousand<br />
ha, and more than half of this number occurred in São Paulo State. From this <strong>to</strong>tal expansion,<br />
773 thousand ha displaced pasture land and 103 thousand ha displaced other crops, while<br />
only 125 thousand ha were not able <strong>to</strong> be allocated over previous productive areas. Total<br />
agricultural area growth – the sum of all crops, including sugarcane, and pastures – in the<br />
period was 3,376 thousand ha.<br />
By looking at Table 4 it is possible <strong>to</strong> state that sugarcane expansion is relatively small<br />
comparing <strong>to</strong> <strong>to</strong>tal agricultural expansion in many states, particularly in Ma<strong>to</strong> Grosso and<br />
Tocantins (about 1% of <strong>to</strong>tal agricultural expansion) and Paraná and Ma<strong>to</strong> Grosso do Sul<br />
(about 16% of <strong>to</strong>tal agricultural expansion). Expansion of agriculture as a whole means<br />
new areas are converted <strong>to</strong> productive uses, which were former natural landscapes (forests,<br />
Cerrado savannah, natural pastureland, and so on) or idle areas. In those states where <strong>to</strong>tal<br />
agricultural area decreased over the analyzed period (Minas Gerais, Goiás, Maranhão<br />
and Piauí), there is no clear evidence that sugarcane expansion had taken place over non<br />
anthropized areas.<br />
It is also important <strong>to</strong> state the signi�cant proportion of sugarcane expansion over pasture,<br />
which represents 72% of <strong>to</strong>tal sugarcane expansion. By state level, also 72% of sugarcane<br />
increased over pasture in São Paulo, while in Minas Gerais, Paraná and Goiás these numbers<br />
were 51, 63, and 90%, respectively. �is result is quite di�erent from the one presented in<br />
Section 4.1 and a possible reason <strong>to</strong> explain this dis<strong>to</strong>rtion is presented in Section 4.3.<br />
7 A recent study published by CONAB (2008), stated that the sugarcane expansion in the 2007 harvest in Brazil,<br />
<strong>to</strong>taling 653,722 ha, has occurred mainly over pastureland, 64.7%, followed by maize and soybean, 21.8%. New<br />
areas were responsible for 2.4% of area used for sugarcane expansion. �ese data were collected through 343<br />
interviews with sugarcane mill managers.<br />
80 <strong>Sugarcane</strong> <strong>ethanol</strong>
Prospects of the sugarcane expansion in Brazil<br />
Table 4. Area of crops and pasture displaced for sugarcane expansion by State, from 2002 <strong>to</strong> 2006<br />
(1,000 hectares).<br />
State Total agricultural<br />
expansion<br />
It is important <strong>to</strong> note that the shi�-share methodology is not su�ciently robust <strong>to</strong> explain the<br />
re-allocation of land in regions that are subjected <strong>to</strong> expansions in all categories of products.<br />
In those regions, new land has been incorporated in<strong>to</strong> agricultural production, which might<br />
be attributed <strong>to</strong> the conversion of forest <strong>to</strong> agriculture or <strong>to</strong> the use of previous idle areas.<br />
However, the model is not able <strong>to</strong> identify this conversion since data on deforestation are<br />
not necessarily available for the same period of time and for the same geographical unit.<br />
Even if we could assume that 100 percent of the expanded area results in natural vegetation<br />
conversion, it would not be possible <strong>to</strong> isolate the contribution of the sugarcane for this<br />
process. One possible alternative <strong>to</strong> explain the not allocated area presented above would<br />
be <strong>to</strong> assume a partial indirect e�ect at a micro-regional level. �e indirect e�ect is partial<br />
because the amount of not allocated area of sugarcane would be allocated in the amount<br />
of new area proportionally of the share of sugarcane expansion <strong>to</strong> the <strong>to</strong>tal agriculture<br />
expansion. �e assumption that sugarcane is expanding in not anthropized area, however,<br />
is not corroborated by satellite images as discussed in the previous section.<br />
4.3. Environmental licensing reports<br />
<strong>Sugarcane</strong> expansion<br />
Total growth Over pasture Over other<br />
crops<br />
N.A. 1<br />
São Paulo 146 639 460 115 65<br />
Minas Gerais -1,251 160 157 2 1<br />
Paraná 535 92 58 2 32<br />
Goiás -775 63 56 0.1 6<br />
Ma<strong>to</strong> Grosso do Sul 281 45 44 0.6 0.1<br />
Ma<strong>to</strong> Grosso 4,945 31 18 3 10<br />
Bahia 124 27 19 5 3<br />
Maranhão -655 16 12 0 5<br />
Piauí -122 3 0.2 0 2<br />
Tocantins 148 1 0.5 0 0.6<br />
Total 3,376 1,077 773 103 125<br />
1 N.A. means not allocated over previous productive area.<br />
As a �rst result of this �eld research, it was possible <strong>to</strong> count and locate new mills projects in<br />
six di�erent states (Table 5). Goiás is the state that has more projects under analysis, which<br />
<strong>Sugarcane</strong> <strong>ethanol</strong> 81
Chapter 3<br />
Table 5. Number of sugarcane mills in selected states and sampled mills information on land use <strong>change</strong>.<br />
State Number of mills Mills sampled<br />
Previous land use (1,000 ha) 2<br />
<strong>Sugarcane</strong><br />
area<br />
(1,000 ha)<br />
Sampled Crushing<br />
capacity<br />
(1,000 <strong>to</strong>n/<br />
year)<br />
Under analysis/<br />
<strong>to</strong>tal 1<br />
Natural<br />
vegetation<br />
Pasture Grains Permanent<br />
crops<br />
Goiás 53/72 4 13,000 130 37.5 32.5 no no<br />
Tocantins 2/4 4 7,100 91 24 12 no 10<br />
Ma<strong>to</strong> Grosso do Sul 36/47 13 40,610 494 101 yes no no<br />
Ma<strong>to</strong> Grosso 4/14 8 15,000 200 yes 32.5 no 0.8<br />
Minas Gerais3 22/52 2 3,822 47 yes yes no yes<br />
São Paulo3 37/205 3 8,000 108 50.5 yes yes no<br />
1 Under analysis means the project mill is under environmental analysis.<br />
2 The numbers refer <strong>to</strong> those studies which presented land use <strong>change</strong>s numbers, while ‘yes/no’ refer <strong>to</strong> those studies which did not quantified<br />
land use.<br />
3 Minas Gerais and São Paulo <strong>to</strong>tal mills are preliminary data.<br />
82 <strong>Sugarcane</strong> <strong>ethanol</strong>
Prospects of the sugarcane expansion in Brazil<br />
means sugarcane is expanding signi�cantly there. �e projects under analysis correspond <strong>to</strong><br />
more than 70% of <strong>to</strong>tal projects, while in São Paulo, traditional producer state, it represents<br />
about 18%.<br />
Ma<strong>to</strong> Grosso do Sul is another state where new mills are majority, and where sugarcane<br />
expansion is very recent. Although the state production represents less than 3% of sugarcane<br />
production in 2007, this share is expected <strong>to</strong> increase considerably over next years. �irty six<br />
new projects are under environmental analysis, while just eleven are already in operation,<br />
and from the thirteen new projects’ Environmental Studies analyzed no forest is expected <strong>to</strong><br />
be suppressed. All new projects needs <strong>to</strong> present EIA-RIMA and public hearings take place<br />
in the local <strong>to</strong>wn, where the environmental agency team helps <strong>to</strong> divulgate and motivate<br />
community <strong>to</strong> participate.<br />
Minas Gerais is currently the third biggest sugarcane producer right a�er Paraná State and<br />
has a signi�cant number of new mills that are being projected. �e regions concentrating<br />
the majority of new projects are mainly in the south and south-eastern – the later including<br />
a traditional cattle raising region denominated Triângulo Mineiro. In spite of the fact that<br />
sugar mills need environmental licenses, the state law doesn’t require EIA-RIMA, which<br />
means that simpler studies are made in order <strong>to</strong> get the license. �ese studies don’t include<br />
land use <strong>change</strong>s impacts and public hearings are not necessary.<br />
In Ma<strong>to</strong> Grosso State, expansion dynamics is di�erent. During the 80’s, some sugarcane mills<br />
were implemented in order <strong>to</strong> produce <strong>ethanol</strong>, as part of PROALCOOL Plan. A�er decline<br />
in governmental supports and the crisis in the sec<strong>to</strong>r, some mills have been closed down<br />
while others have started <strong>to</strong> produce sugar as well, and thus have kept business pro�table.<br />
Recently, two mills that used <strong>to</strong> be no longer in operation are requesting licenses <strong>to</strong> come<br />
back <strong>to</strong> business. Nevertheless, sugarcane production is relatively small in this state, and<br />
only two new mill projects are under analysis.<br />
�e State of Tocantins is not under important sugarcane expansion now, but it is expected <strong>to</strong><br />
be in near future if demand for land for this crop keeps increasing. �e state Environmental<br />
Agency estimates that a�er the implementation of North-South railway the regional<br />
transportation problem will be solved and about 50 sugar mills will be constructed. �us,<br />
the state government wants <strong>to</strong> get ready for this huge demand over environmental licensing<br />
and planning for this land use <strong>change</strong>.<br />
São Paulo is the most important Brazilian state for sugarcane production and the most<br />
industrialized, urbanized and occupied state. Many of existing mills are requesting licenses<br />
<strong>to</strong> expand crushing capacity and some new mills projects are also under licenses analysis.<br />
Some studies analyze the impact of this recent sugarcane expansion over other crops in this<br />
state, resulting especially in reduction of pastures, citrus and maize areas (Coelho et al.,<br />
2007). Camargo et al. (2008) state that land rental for sugarcane has increased by an average<br />
<strong>Sugarcane</strong> <strong>ethanol</strong> 83
Chapter 3<br />
of 12.6% from 2001 <strong>to</strong> 2006 in São Paulo, contributing <strong>to</strong> diminish expansion in São Paulo,<br />
which in turn can boost sugarcane expansion in other states.<br />
Two signi�cant facts regarded <strong>to</strong> land use <strong>change</strong> caused by sugarcane were veri�ed during<br />
this �eld research. First, many of the projects which were considering <strong>to</strong> use pasture <strong>to</strong><br />
cultivate sugarcane mentioned the necessity of one or two years cultivating other crops, such<br />
as soybean prior <strong>to</strong> the planting of sugarcane, in order <strong>to</strong> improve the soil quality of the low<br />
productive pasture land (regarding structure and/or fertility). �is fact may partially explain<br />
the relative big proportion of sugarcane expansion over the Agriculture class detected in<br />
the remote sensing image analyses (Section 4.1). Since data presented in this paper are not<br />
able <strong>to</strong> verify this fact, deeper analysis are necessary <strong>to</strong> evaluate whether these crops were<br />
cultivated just <strong>to</strong> prepare the soil under pasture for sugarcane, meaning that the Agriculture<br />
class could possibly be overestimated (and therefore the Pasture class underestimated).<br />
�e other signi�cant fact is the common use of crop rotation during sugarcane renovation<br />
process. A�er a number of harvests – generally �ve <strong>to</strong> six – sugarcane yield decreases<br />
and, therefore, the sugarcane �eld should be renovated. �is is usually performed with<br />
an ‘18 months’ sugarcane plant. In this case an annual food crop such as soybeans can be<br />
cultivated during the summer season. Potentially, this means that about 15 <strong>to</strong> 20% of the<br />
cultivated sugarcane area can be cultivated with an annual crop in order <strong>to</strong> improve soil<br />
quality, prevent soil erosion and contribute <strong>to</strong> food production. Although this practice is<br />
not used in all sugarcane �elds, it has been disseminating fast and it is likely <strong>to</strong> be used in<br />
the majority of areas all over Brazil.<br />
4.4. Expected sugarcane expansion and implied land use <strong>change</strong>s<br />
Projections developed for this study are indicating that harvested sugarcane area in Brazil<br />
will reach 11.7 million ha in 2018, departing from 7.8 million ha in 2008. Area allocated for<br />
crops (soybean, maize, cot<strong>to</strong>n, rice and dry beans) is expected <strong>to</strong> grow from 37.8 million<br />
ha <strong>to</strong> 43.8 million ha. Pasture area will move <strong>to</strong> the opposite direction, being reduced from<br />
165 <strong>to</strong> 162 million ha.<br />
Projections on regional level are presented in the Figure 8. �e �gure shows that the<br />
South-Central region, comprising the regions South, Southeast and Center-west Cerrados,<br />
will continue <strong>to</strong> be the most relevant and dynamic. North-northeast region is also very<br />
important but, as described in the methodology section, it is not a dynamic region in terms<br />
of growth.<br />
Table 6 summarizes the expected growth in the South-Central region. Results show that<br />
the expansion of grains and sugarcane are fully compensated by the reduction on pasture<br />
area. Projections also con�rm that cattle production is improving in terms of productivity<br />
given that the herd is increasing despite of the reduction on pasture area.<br />
84 <strong>Sugarcane</strong> <strong>ethanol</strong>
Northeast coastal<br />
18,000<br />
16,000<br />
14,000<br />
12,000<br />
10,000<br />
8,000<br />
6,000<br />
4,000<br />
2,000<br />
0<br />
Central-west Cerrados<br />
South region<br />
60,000<br />
35,000<br />
50,000<br />
30,000<br />
40,000<br />
25,000<br />
20,000<br />
30,000<br />
15,000<br />
20,000<br />
10,000<br />
10,000<br />
5,000<br />
0<br />
0<br />
18(p)<br />
16(p)<br />
14(p)<br />
12(p)<br />
10(p)<br />
08(e)<br />
18(p)<br />
16(p)<br />
14(p)<br />
12(p)<br />
10(p)<br />
08(e)<br />
18(p)<br />
16(p)<br />
14(p)<br />
12(p)<br />
10(p)<br />
08(e)<br />
North-northeast Cerrados<br />
Amazon biome<br />
Southeast region<br />
40,000<br />
Prospects of the sugarcane expansion in Brazil<br />
35,000<br />
30,000<br />
25,000<br />
20,000<br />
15,000<br />
10,000<br />
5,000<br />
0<br />
45,000<br />
40,000<br />
35,000<br />
30,000<br />
25,000<br />
20,000<br />
15,000<br />
10,000<br />
5,000<br />
0<br />
45,000<br />
40,000<br />
35,000<br />
30,000<br />
25,000<br />
20,000<br />
15,000<br />
10,000<br />
5,000<br />
0<br />
<strong>Sugarcane</strong> <strong>ethanol</strong> 85<br />
18(p)<br />
16(p)<br />
14(p)<br />
12(p)<br />
10(p)<br />
08(e)<br />
18(p)<br />
16(p)<br />
14(p)<br />
12(p)<br />
10(p)<br />
08(e)<br />
18(p)<br />
16(p)<br />
14(p)<br />
12(p)<br />
10(p)<br />
08(e)<br />
Pasture Grains <strong>Sugarcane</strong><br />
Figure 8. Projected evolution of sugarcane, grains and pasture area in agricultural regions (1,000 ha).
Chapter 3<br />
Table 6. South-Centre: expected land allocation for sugarcane, grains and pastures (1,000 ha and<br />
heads).<br />
2008 2018 Net growth<br />
<strong>Sugarcane</strong> (ha) 6,359 9,654 3,295<br />
Grains (ha) 26,332 29,529 3,198<br />
Pasture (ha) 92,328 86,215 -6,113<br />
Total (ha) 125,018 125,398 380<br />
Cattle herd (hd) 119,399 125,501 6,102<br />
Detailed analysis on sugarcane, crops and pasture expansion was developed for the South-<br />
Central region, in order <strong>to</strong> standardize the producing regions with the past land use <strong>change</strong><br />
presented in the previous sections. Figure 9 shows the results obtained for São Paulo, Minas<br />
Gerais, Paraná, Goiás, Ma<strong>to</strong> Grosso do Sul and Ma<strong>to</strong> Grosso. <strong>Sugarcane</strong> expansion will<br />
follow trends in terms of land use <strong>change</strong> similar <strong>to</strong> the ones observed in the past.<br />
�e absolute variation shows that expansion will be larger in São Paulo, with 1.9 million<br />
ha expansion. However, the relative variation shows that Minas Gerais (98 percent growth<br />
in comparison <strong>to</strong> 2008), Paraná (98 percent expansion), Goiás (118 percent expansion)<br />
and Ma<strong>to</strong> Grosso do Sul (105 percent) are the states where sugarcane will present the most<br />
dynamic expansion.<br />
Apart from Minas Gerais, pasture is losing area in all states, while crops area is decreasing<br />
only in São Paulo. Due <strong>to</strong> this strong reduction in pasture and simultaneous growth in<br />
sugarcane and crops, the results indicate that both categories are displacing pasture. Microregional<br />
data in states such as Paraná and Goiás allow us <strong>to</strong> conclude that crops area displaced<br />
by sugarcane is partially compensated over pastures areas. �e reduction on pastures area,<br />
as already shown in Table 6, is expected <strong>to</strong> be compensated by yields improvement. Even in<br />
states where cattle herd tend <strong>to</strong> fall, such as São Paulo and Paraná, pasture area reduction<br />
does not compromise beef and dairy production. In the Centre-West states, Goiás, Ma<strong>to</strong><br />
Grosso do Sul and Ma<strong>to</strong> Grosso, pastures areas are declining and projected cattle herd is<br />
increasing, showing strong productivity gains.<br />
It is also important <strong>to</strong> say that pasture area is expected <strong>to</strong> increase only in the Amazon Biome<br />
region. However, this expansion is taken place independently of the other regions, because<br />
cattle herd is increasing in the South-Central region, which is the sugarcane expansion<br />
region. Projections also con�rm results observed by satellite images: as soon as the sugarcane<br />
increases its expansion, more pasture is displaced in comparison <strong>to</strong> grains. Pasture land<br />
displacement is majority in Minas Gerais and Centre-West states. In Paraná sugarcane<br />
expansion will push grains production <strong>to</strong> pastures area. We probably will see the same<br />
86 <strong>Sugarcane</strong> <strong>ethanol</strong>
9,051<br />
2%<br />
2,842<br />
1%<br />
910,312<br />
47%<br />
331,232<br />
58%<br />
São Paulo<br />
Paraná<br />
1,027,675<br />
53%<br />
233,516<br />
40%<br />
248,177<br />
99%<br />
Ma<strong>to</strong> Grosso do Sul<br />
57,421<br />
10%<br />
Minas Gerais<br />
113,223<br />
30%<br />
40,269<br />
29%<br />
Goiás<br />
14,611<br />
3%<br />
499,969<br />
87%<br />
261,014<br />
70%<br />
98,498<br />
71%<br />
Ma<strong>to</strong> Grosso<br />
Prospects of the sugarcane expansion in Brazil<br />
N.A.<br />
crops<br />
pasture<br />
Total expansion:<br />
São Paulo 1,938,211<br />
Minas Gerais 572,000<br />
Paraná 573,799<br />
Goiás 374,237<br />
Ma<strong>to</strong> Grosso do Sul 251,018<br />
Ma<strong>to</strong> Grosso 138,767<br />
Figure 9. Projection of crops and pasture displacement due <strong>to</strong> sugarcane expansion, from 2008 <strong>to</strong><br />
2018 in selected Brazilian states (in ha).<br />
Note: N.A. means not allocated over previous productive area.<br />
process in São Paulo, although not only pasture but also grains are strongly releasing land<br />
for sugarcane.<br />
Grains are releasing 1.6 million ha for sugarcane but, as can be observed in the Table 6,<br />
<strong>to</strong>tal area is expanding by 3.9 million ha, more than compensating the losses for sugarcane.<br />
Pasture area will be reduced by 6.1 million ha and sugarcane is contributing with 2.4 million<br />
ha of this <strong>to</strong>tal.<br />
<strong>Sugarcane</strong> <strong>ethanol</strong> 87
Chapter 3<br />
4.5. Options for approaching indirect effect<br />
Indirect Land Use Change analysis is still under development, both in terms of proper<br />
de�nitions and methods <strong>to</strong> measure it. Regarding <strong>to</strong> its de�nitions, Gnansounou et al. (2008)<br />
classify four di�erent sources of ILUC: spatial ILUC (displacement of prior production <strong>to</strong><br />
other location); temporal ILUC (shi�ing land-use in the same location); use ILUC (shi�ing<br />
biomass use in the same location); and displaced activity/use ILUC (avoiding national landuse<br />
<strong>change</strong> by shi�ing previous activity <strong>to</strong> other country).<br />
According <strong>to</strong> the authors, ILUC is market driven, global e�ect, spatial dependent and time<br />
dependent. �e �rst two items must be analyzed in a global scale, while the last two need<br />
down-scaling analysis. Considering local analysis, although there is no consensual method<br />
in specialized literature, it is possible <strong>to</strong> use available land use data <strong>to</strong> clarify some points.<br />
Notwithstanding that the sources of ILUC can be formally de�ned from a theoretical<br />
perspective, the di�culties associated <strong>to</strong> isolate and <strong>to</strong> separate the contribution of each<br />
source <strong>to</strong> the indirect e�ect make empirical analysis much less promising than what it<br />
appears <strong>to</strong> be. �us, even though it is reasonable <strong>to</strong> state that the displacement of one<br />
activity as a result of the expansion of other activity may lead <strong>to</strong> an indirect land use<br />
<strong>change</strong>, as argued by Searchinger et al. (2008), such as deforestation, this incorporation<br />
of additional land may be happening despite of the expansion of biofuel’s feeds<strong>to</strong>cks<br />
production. Additionally, when the expansion of biofuel’s feeds<strong>to</strong>cks is taking place in<br />
conjunction with the expansion of agricultural products for food production, it is hard <strong>to</strong><br />
prove e�ect-cause relations between biofuel’s expansion and deforestation. �is is exactly<br />
one of the fragilities of Searchinger’s paper.<br />
It is beyond of the objectives of this paper <strong>to</strong> address ILUC in a worldwide perspective.<br />
However, due <strong>to</strong> the fact that sugarcane is expanding in Brazil, it is necessary <strong>to</strong> search<br />
for arguments and data supporting the idea that sugarcane expansion is leading <strong>to</strong> an<br />
increase in the land productivity, rather than promoting incorporation of new land for food<br />
production, as grains and pasture land are displaced. Both projections and observed data<br />
give indication that this process is taking place in Brazil. As presented in Tables 6 and 7, the<br />
strong increase in pasture productivity, measured by the s<strong>to</strong>cking ratio, make the Brazilian<br />
case a strong example of how hard it is <strong>to</strong> empirically prove the ILUC e�ect associated <strong>to</strong><br />
the expansion of sugarcane.<br />
As discussed in previous sections, sugarcane expansion is taking place in anthropized areas.<br />
Although this paper has no evidences regarding deforestation in Brazil, it is well known<br />
that deforestation is observed in the agricultural frontier. Brazil has two most important<br />
frontiers: the Amazon Biome region, where the Amazon Forest is located, and the Northnortheast<br />
Cerrados region (also called as MAPITO region), where the larger s<strong>to</strong>ck of<br />
savannah land is located. Both past data and projections have shown that sugarcane is not<br />
88 <strong>Sugarcane</strong> <strong>ethanol</strong>
Prospects of the sugarcane expansion in Brazil<br />
signi�cantly expanding in these regions. Moreover, the expansion of pastures and grains<br />
area in the Amazon Biome region, which one would argue that it is happening due <strong>to</strong> the<br />
indirect e�ect, are lower than the area displaced by sugarcane in the South-Central region.<br />
As presented in the Table 6, we project that pasture will lose 6 million ha for sugarcane<br />
and grains in the South-Central region for the period of 2008 <strong>to</strong> 2018. Projections for the<br />
Amazon Biome region indicate that pasture area will increase by 4 million ha for the same<br />
period (Figure 8). �ose numbers show that one unity of pasture land lost does not have <strong>to</strong> be<br />
fully compensated in the frontier because productivity of the cattle production is increasing.<br />
Results of this study, therefore, support the idea that both pasture land improvement and<br />
increasing s<strong>to</strong>cking rate can more than compensate land released for sugarcane and even for<br />
other crops. Regional herd data presented in Table 7 reinforces even more this evidence.<br />
In the states where sugarcane area increased from 2002 <strong>to</strong> 2006, other crops area have also<br />
increased (exception for São Paulo), which means there is no clear reason <strong>to</strong> state that<br />
sugarcane has displaced crops which in turn could occupy natural vegetation (Table 7). A<br />
similar rational can be made for pasture land, but now including yield improvement. �e<br />
Table 7. Net growth of sugarcane, other crops, pasture land, <strong>to</strong>tal used area, and cattle herd from<br />
2002 <strong>to</strong> 2006 in selected Brazilian states (1,000 ha and heads).<br />
State Net growth 2002-06<br />
<strong>Sugarcane</strong><br />
(ha)<br />
Other crops<br />
(ha)<br />
Pasture land<br />
(ha)<br />
Total used<br />
area (ha)<br />
Cattle herd<br />
(heads)<br />
São Paulo 622 -224 -882 -484 -909<br />
Minas Gerais 153 390 -625 -82 1,644<br />
Paraná 74 850 -636 287 -284<br />
Ma<strong>to</strong> Grosso do Sul 41 734 -985 -210 558<br />
Goiás 34 576 -2,041 -1,431 545<br />
Bahia 27 492 143 661 912<br />
Ma<strong>to</strong> Grosso 25 1,634 -1,437 222 3,881<br />
Maranhão 16 298 -463 -148 1,835<br />
Pará 3 115 2,502 2,620 5,311<br />
Piauí 3 206 -112 97 34<br />
Rondônia 1 124 -364 -239 3,444<br />
Tocantins 0.9 238 -595 -355 778<br />
Acre 0.7 13 109 123 635<br />
Total 1,000 5,446 -5,385 1,061 18,383<br />
Source: PAM/IBGE, Agricultural Census/IBGE and PPM/IBGE.<br />
<strong>Sugarcane</strong> <strong>ethanol</strong> 89
Chapter 3<br />
states that have lost pasture land have also increased cattle herd (exception for São Paulo and<br />
Paraná), meaning there was an improvement in the cattle sec<strong>to</strong>r. �erefore, it is important<br />
<strong>to</strong> state that biofuels produced from biomass grown on unused arable land or resulting from<br />
yield improvements (as much of the pasture land displaced for sugarcane) have no indirect<br />
e�ects according <strong>to</strong> the Roundtable on Sustainable Biofuels (2008).<br />
�us, yields improvements in crops can be considered as area’s release, meaning that the<br />
same amount of cereals, for example, is produced on a smaller area, leaving area available for<br />
other uses. Ceteris paribus, i.e. not considering other variables such as increase in demands,<br />
yield improvements alleviate area for other purposes. <strong>Sugarcane</strong> cultivated over these areas<br />
does not compete with land and has no indirect e�ects. For a <strong>to</strong>tal of about 1,390 thousand<br />
ha of agricultural area displaced for sugarcane veri�ed by satellite images in the six states<br />
analyzed, 572 thousands ha were released by crops yields improvements (Table 8).<br />
Grains, cereals and oilseeds area displaced, besides yields improvements, necessarily<br />
have <strong>to</strong> be compensated in a non-sugarcane area, although food production would be<br />
compromised. However, crops re-allocation could also take place in pastures areas, being<br />
partially compensated by cattle yield improvements. Moreover, if the expansion of food<br />
Table 8: Agricultural area displaced by sugarcane and agricultural area compensated by yield<br />
improvement from 2005 <strong>to</strong> 2008 (São Paulo) and 2007 <strong>to</strong> 2008 for the other States.<br />
State Agricultural area<br />
displaced by<br />
sugarcane 1<br />
(1,000 ha)<br />
Average annual<br />
yield growth 2<br />
Minas Gerais 186 4.4% 118<br />
Goiás 168 1.9% 46<br />
Paraná 127 4.8% 231<br />
Ma<strong>to</strong> Grosso do Sul 66 5.8% 30<br />
Ma<strong>to</strong> Grosso 33 9.5% 44<br />
São Paulo 808 3.4% 103<br />
Total 1,387 572<br />
Agricultural area<br />
compensated by<br />
yield improvement 3<br />
(1,000 ha)<br />
1 Source: Figures 5 and 6.<br />
2 Averages are calculated from CONAB data for soybeans, maize, rice, dry beans and cot<strong>to</strong>n, for the<br />
period of 1991 <strong>to</strong> 2008 (www.conab.gov.br).<br />
3 The baseline agricultural area (2005 for São Paulo and 2007 for the remaining states) for the<br />
selected crops were discounted by the area ‘saved’ due <strong>to</strong> those yield growth.<br />
90 <strong>Sugarcane</strong> <strong>ethanol</strong>
Prospects of the sugarcane expansion in Brazil<br />
crops is larger than the amount of land displaced by sugarcane, indirect e�ect cannot be<br />
quanti�ed. �is is also the situation taking place in Brazil.<br />
For global scale considerations for ILUC, however, the analysis is much more complex. In<br />
this case, it is even more di�cult <strong>to</strong> determine the proper scale pertinent, considering that<br />
many countries produce and trade di�erent products that can be related <strong>to</strong> ILUC analysis.<br />
Regarding <strong>to</strong> shi�ing biomass use, Brazilian sugar production has also increased from 2002<br />
<strong>to</strong> 2006, from 22.5 <strong>to</strong> 29.6 million <strong>to</strong>ns, according <strong>to</strong> UNICA (2008). Meats and all grains<br />
production have also increased signi�cantly in the period and in the last years. �erefore,<br />
there was no need <strong>to</strong> convert land in other countries due <strong>to</strong> increase in <strong>ethanol</strong> production<br />
in Brazil. Nevertheless, all ILUC considerations can be considered preliminary and subject<br />
<strong>to</strong> improvements since the <strong>to</strong>pic has been developing fast recently.<br />
5. Conclusions and recommendations<br />
�is work was an e�ort <strong>to</strong> analyze land use <strong>change</strong>s due <strong>to</strong> sugarcane expansion in Brazil,<br />
contributing <strong>to</strong> the global debate about social and especially environmental bene�ts of<br />
<strong>ethanol</strong>. A careful look of the distribution of sugarcane shows that the crop is located and is<br />
expanding in regions that are devoted <strong>to</strong> agricultural production since a long time. Projections<br />
indicated that sugarcane expansion will continue <strong>to</strong> take place on these areas. �is means<br />
that there is no sugarcane expansion in the agricultural frontier, which is the place where<br />
agricultural production has been converting natural landscapes. �us, results are indicating<br />
that sugarcane is not directly pressing natural vegetation in any region in Brazil.<br />
�e use of di�erent methods gives consistency <strong>to</strong> the analysis, since each one has its<br />
weakness and strengths. Remote sensing images can be considered the most reliable source<br />
of information, however they focused only in areas where sugarcane expansion <strong>to</strong>ok place,<br />
neglecting dynamics of other crops and pasture land. Secondary data from IBGE cover<br />
all signi�cant productive land uses, nevertheless the data is subject <strong>to</strong> accuracy problems,<br />
especially those relating <strong>to</strong> areas dedicated <strong>to</strong> pasture. Case studies through environmental<br />
licensing reports can o�er profound analysis <strong>to</strong> understand the dynamics of the mill,<br />
although they are limited in scope of coverage. �e land use model projects future trends<br />
of land substitution among crops, based on past trends, but it relies on many economic<br />
assumptions.<br />
Both remote sensing and secondary data analysis have generated similar results regarding<br />
direct land use <strong>change</strong>s promoted by sugarcane expansion. Although results are di�erent<br />
in terms of crops and pasture land displacement, they both corroborate that sugarcane<br />
expansion has taken place with no direct e�ect on natural vegetation land. Furthermore,<br />
pasture is increasing its participation on the area displaced by sugarcane, and this pattern<br />
is expected <strong>to</strong> continue or even become more relevant in the future.<br />
<strong>Sugarcane</strong> <strong>ethanol</strong> 91
Chapter 3<br />
It is important <strong>to</strong> contextualize the LUC caused by sugarcane within the entire Brazilian<br />
debate regarding land use and occupation and other fac<strong>to</strong>rs correlated, including agricultural<br />
and environmental public policies, international commodity markets and technology<br />
development. ILUC issues, in turn, are even more complex and correlated <strong>to</strong> many other<br />
fac<strong>to</strong>rs. <strong>Sugarcane</strong> is concentrated in the most densely occupied state, São Paulo, which has<br />
been presented signals of saturation many years ago. In a lack of clear land use and occupation<br />
policy, sugarcane, as well as many other agricultural activities, has been expanding around<br />
close states according <strong>to</strong> local conditions, both agronomic and economic. �is movement<br />
presses land valorization and thus contributes <strong>to</strong> improvements on agricultural yields (crops<br />
and pasture), as it is happening in almost all regions in Brazil.<br />
�is study concludes that the expansion of crops, except sugarcane, and pasture land is<br />
taking place despite of the sugarcane expansion. �is is important because it reinforces<br />
that, even recognizing that sugarcane expansion contributes <strong>to</strong> the displacement of other<br />
crops and pasture, there is no evidence that deforestation caused by indirect land use e�ect<br />
is a consequence of sugarcane expansion. Results on past data and projections show that<br />
increasing cattle herd s<strong>to</strong>cking rate is able <strong>to</strong> o�set pasture land reduction in regions where<br />
competition for land is taking place. Increasing productivity on cattle production, therefore,<br />
also reinforces that the expansion of pasture land on the Amazon Biome is not directly<br />
promoted by the expansion of crops and sugarcane in the non-frontier regions.<br />
It is strongly recommended that the analysis here presented continues on a regular base<br />
in order <strong>to</strong> guarantee that sugarcane activity continues <strong>to</strong> respect natural landscapes. As<br />
any other agricultural product, sugarcane also contributes <strong>to</strong> land use <strong>change</strong>s. However,<br />
as discussed here, these <strong>change</strong>s do not undermine sugarcane’s environmental bene�ts as<br />
a renewable agricultural-based biofuel.<br />
References<br />
Camargo, A.M.M.P., D.V. Caser, F.P. Camargo, M.P.A. Olivette, R.C.C. Sachs and S.A. Torqua<strong>to</strong>, 2008.<br />
Dinâmica e tendência da cana-de-acucar sobre as demais atividades agropecuárias, Estado de São Paulo,<br />
2001-2006. Informações Econômicas 38: 47-66.<br />
Coelho, S.T., P.M. Guardabassi, B.A. Lora, M.B.C.A. Monteiro and R. Gorren, 2007. A Sustentabilidade da<br />
expansão da cultura canavieira. Centro de Referencia em Biomassa – CENBIO – USP. Cadernos Técnicos<br />
da Associação Nacional de Transportes Públicos, v. 6.<br />
Companhia Nacional de Abastecimen<strong>to</strong> (CONAB), 2008. Per�l do Se<strong>to</strong>r de Açúcar e Álcool no Brasil.<br />
Brasília: CONAB.<br />
Food and Agricultural Policy Research Institute (FAPRI), 2008. FAPRI 2008: U.S. and World Agricultural<br />
Outlook. FAPRI Sta� Report 08-FSR 1. Available at: www.fapri.org (accessed in Oc<strong>to</strong>ber 4 th , 2008).<br />
Gnansounou, E., L. Panichelli, A. Dauriat and J.D. Villegas, 2008. Accounting for indirect land-use <strong>change</strong>s<br />
in GHG balances of biofuels: review of current approaches. École Polytechnique Fédérale de Lausanne,<br />
Working Paper 437.101, March 2008.<br />
92 <strong>Sugarcane</strong> <strong>ethanol</strong>
Prospects of the sugarcane expansion in Brazil<br />
Institu<strong>to</strong> Brasileiro de Geogra�a e Estatística (IBGE), 2008b. Censo Agropecuário de 2008. Available at:<br />
www.sidra.ibge.gov.br (accessed in July 10 th , 2008).<br />
Institu<strong>to</strong> Brasileiro de Geogra�a e Estatística, (IBGE), 2008a. Levantamen<strong>to</strong> Sistemático da Produção<br />
Agrícola. Available at: www.sidra.ibge.gov.br (accessed in July 10 th , 2008).<br />
Oliveira, A.A., M.F.M. Gomes, J. Dos San<strong>to</strong>s, L. Ru�no, A.G. Da Silva Júnior, and S.T. Gomes, 2008. Estrutura<br />
e dinâmica da cafeicultura em Minas Gerais. Revista de Economia Agrícola 34: 121-142.<br />
Roundtable on Sustainable Biofuels, 2008. Background paper (teleconference June 3 rd , 2008) of the Expert<br />
advisory group and working group on GHG. Available at: http://cgse.ep�.ch/page65660.html (accessed<br />
in August 2 nd , 2008).<br />
Rudor�, B.F.T and L.M. Sugawara, 2007. Mapeamen<strong>to</strong> da cana-de-açúcar na Região Centro-Sul via imagens<br />
de satélites. Informe Agropecuário. Geotecnologias, Belo Horizonte, 241: 79-86.<br />
Searchinger, T., R. Heimlich, R.A. Hough<strong>to</strong>n, F. Dong, A., Elobeid, J. Fabiosa, S., Tokgoz, D., Hayes and T.<br />
Yu, 2008. Land clearing and the biofuels carbon debt. Sciencexpress. Feb., 2008.<br />
Sugawara, L.M.S., B.F.T. Rudor�, R.M.S.P., Vieira, A.G. Afonso, T.L.I.N. Aulicino, M.A. Moreira, V. Duarte<br />
and W.F. Silva, 2008. Imagens de satélites na estimativa de área plantada com cana na safra 2005/2006<br />
– Região Centro-Sul. São José dos Campos: INPE (15254-RPQ/815). 74 p.<br />
União da Indústria de Cana-de-Açucar (ÚNICA), 2008. Estatísticas de produção de açúcar no Brasil.<br />
Available at: www.unica.com.br (accessed in July 29 th , 2008).<br />
<strong>Sugarcane</strong> <strong>ethanol</strong> 93
Chapter 4<br />
Mitigation of GHG emissions using sugarcane bio<strong>ethanol</strong><br />
Isaias C. Macedo and Joaquim E.A. Seabra<br />
1. Introduction<br />
�e implementation of the Brazilian sugarcane <strong>ethanol</strong> program always included a<br />
continuous assessment of its sustainability. �e possibilities for increasing production in<br />
the next years must consider the exciting promises of new technologies (that may lead <strong>to</strong><br />
50% more commercial energy/ha, from sugarcane) as well as environmental restrictions.<br />
�e greenhouse gases emissions associated with the expansion are analyzed in the next<br />
sections.<br />
2. Ethanol production in 2006 and two Scenarios for 2020<br />
A�er the initial growth with the Pro-Álcool program (~12 M m 3 , from 1975 <strong>to</strong> 1984)<br />
<strong>ethanol</strong> production in Brazil stabilized at this level until 2002, when the implementation of<br />
the Flex Fuel cars led <strong>to</strong> a new period of strong growth (from 12.5 M m 3 in 2002 <strong>to</strong> ~24 M<br />
m 3 in 2008; internal demand scenarios point <strong>to</strong> 40 M m 3 in 2020, with exportation in the<br />
10-15 M m 3 range) (Carvalho, 2007; CEPEA, 2007; MAPA, 2007; EPE, 2007). Environmental<br />
legislation phasing out sugarcane burning practices, the internal demand for electricity<br />
and the opportunity with the large number of new sugarcane mills (Carvalho, 2007) are<br />
leading <strong>to</strong> a fast transition from the ‘energy self-su�cient’ industrial unit <strong>to</strong> a much better<br />
use of cane biomass (bagasse and trash), turning the sugarcane industry in<strong>to</strong> an important<br />
electricity supplier.<br />
�e evaluation of the GHG emissions (and mitigation) from the sec<strong>to</strong>r in the last years<br />
(2002-2008) and the expected <strong>change</strong>s in the expansion from 2008 <strong>to</strong> 2020 must consider<br />
technology (the continuous evolution and selected more radical <strong>change</strong>s), both in cane<br />
production as in cane processing. Two (alternative) technology paths were selected:<br />
• �e Electricity Scenario follows the technology trends <strong>to</strong>day, with commercially available<br />
technologies: the use of trash (40% recovery) and surplus bagasse (35%) <strong>to</strong> produce<br />
surplus electricity in conventional high pressure co-generation systems (Seabra, 2008).<br />
•<br />
�e Ethanol Scenario considers advanced <strong>ethanol</strong> production with the hydrolysis of<br />
lignocellulosic cane residues; <strong>ethanol</strong> would be produced from sucrose but also in an<br />
annexed plant with the surpluses of bagasse and of the 40% trash recovered (Seabra,<br />
2008). �is condition would lead <strong>to</strong> a smaller area (29% smaller, for the same <strong>ethanol</strong><br />
production) than the Electricity Scenario; technologies may be commercial in the next<br />
ten years.<br />
<strong>Sugarcane</strong> <strong>ethanol</strong> 95
Chapter 4<br />
�e 2006 results are based on 2005/2006 average conditions, with the best available and<br />
comprehensive data for the Brazilian Center-South Region (Macedo et al., 2008). Note that<br />
GHG emissions/mitigation are evaluated for each Scenario speci�c conditions; Scenario<br />
implementation schedules are not presented (or needed) for the objective of this study.<br />
However, it must be said that the Electricity Scenario implementation is occurring now<br />
in all Green�eld operations, and already in some retro�t of existing units. �e Ethanol<br />
Scenario as proposed still depends on technological development of the biomass hydrolysis/<br />
fermentation processes, and it would take longer <strong>to</strong> be implemented <strong>to</strong> a signi�cant level in<br />
the context of the Brazilian <strong>ethanol</strong> production (Seabra, 2008).<br />
�e essential parameters for 2006 and the two 2020 Scenarios are presented in Table 1 (Cane<br />
production) and Table 2 (Cane processing). �e data used for 2006 is for a sample of 44 mills<br />
(100 M t cane/season), all in the Brazilian Center South. Data have been collected/processed<br />
for the last 15 years, for agriculture and industry, for the CTC ‘mutual benchmarking’.<br />
�e <strong>ethanol</strong> transportation (sugar mill <strong>to</strong> gas station) energy needs are (Seabra, 2008):<br />
2006: 100% road (trucks), 340 km (average), 0.024 l diesel/(m 3 .km) (energy consumption).<br />
2020: 80% road, with average transport distance and diesel consumption as in 2006; 20%<br />
pipeline, 1000 km (average), 130 kJ/(m 3 .km) (pipeline energy consumption).<br />
�e hydrolysis/fermentation parameters in the Ethanol Scenario correspond <strong>to</strong> a SSCF<br />
process, expected <strong>to</strong> be commercial before 2020, as seen in Table 3.<br />
3. Energy flows and lifecycle GHG emissions/mitigation<br />
�e systems boundaries considered for the energy �ows and GHG emissions and mitigation<br />
include the sugarcane production, cane transportation <strong>to</strong> the industrial conversion unit,<br />
the industrial unit, <strong>ethanol</strong> transportation <strong>to</strong> the gas station, and the vehicle engine<br />
(performance). Methodologies use data and experimental coe�cients as indicated in the<br />
tables, and in some cases IPCC (IPCC, 2006) defaults; details are presented in Macedo et al.<br />
(2008), Seabra (2008) and Macedo (2008). �e CO2 (and other GHG) related �uxes are:<br />
• CO2 absorption (pho<strong>to</strong>synthesis) in sugarcane; its release in trash and bagasse burning,<br />
residues, sugar fermentation and <strong>ethanol</strong> end use. �ese �uxes are not directly measured<br />
(not needed for the net GHG emissions).<br />
• CO2 emissions from fuel use in agriculture and industry (including input materials); in<br />
<strong>ethanol</strong> transportation; and in equipment/buildings production and maintenance.<br />
• Other GHG �uxes (N2O and methane): trash burning, N2O soil emissions from Nfertilizer<br />
and residues (including stillage, �lter cake, trash)<br />
•<br />
GHG emissions mitigation: <strong>ethanol</strong> and surplus bagasse (or surplus electricity)<br />
substitution for gasoline, fuel oil or conventional electricity.<br />
96 <strong>Sugarcane</strong> <strong>ethanol</strong>
Table 1. Basic data: sugarcane production.<br />
Mitigation of GHG emissions using sugarcane bio<strong>ethanol</strong><br />
Item Units 2006 a 2020 scenarios b<br />
Sucrose content % cane stalks 14.22 15.25 c<br />
Fiber content % cane stalks 12.73 13.73 d<br />
Trash (db) e % cane stalks 14 14<br />
Cane productivity<br />
Fertilizer utilization<br />
t cane/ha 87.1 95.0<br />
f<br />
P2O5 kg/(ha.year) 25 32<br />
K2O kg/(ha.year) 37 32<br />
Nitrogen kg/(ha.year) 60 50<br />
Lime g t/ha 1.9 2.0<br />
Herbicide h kg/ha 2.2 2.2<br />
Insecticide h kg/ha 0.16 0.16<br />
Filter cake application t (db)/ha (% area) i 5 (70%) 5 (70%)<br />
Stillage application m³/ha (% area) j,k 140 (77%) 140 (77%) l<br />
Mechanical harvesting % area 50 100 m<br />
Unburned cane harvesting % area 31 100 m<br />
Diesel consumption L/ha 230 314<br />
a CTC’s database (44 mills in Center-South of Brazil, equivalent <strong>to</strong> ~100 Mt cane/year) (CTC,<br />
2006a).<br />
b Author’s projections; Scenarios are Electricity and Ethanol.<br />
c 2020: increasing 1 point (%) in 15 years (variety development and better allocation).<br />
d Apparent fiber increasing with increase in green cane harvesting (trash).<br />
e Hassuani et al. (2005).<br />
f Total averages, including: fertilizer use in plant and ra<strong>to</strong>on cane, in areas with and without stillage;<br />
full description in Macedo et al. (2008). For Scenario 2020 Ethanol averages are slightly lower (~4%)<br />
due <strong>to</strong> larger stillage production/utilization.<br />
g Utilized essentially at planting.<br />
h Macedo (2005a).<br />
i Reforming areas: areas where sugarcane is re-planted, after the 6 year cycle.<br />
j Ra<strong>to</strong>on areas: areas where sugarcane is cut <strong>to</strong> grow again, without re-planting<br />
k It is considered that all stillage is used only in the ‘<strong>ethanol</strong> cane area’, but keeping the suitable<br />
level of application (~140 m³/ha). For 2020 Ethanol scenario, see Note l.<br />
l In the 2020 Ethanol scenario more stillage would be produced, from the <strong>ethanol</strong> derived from<br />
hydrolysis. Stillage application would reach larger ra<strong>to</strong>on areas.<br />
m Considering the legislation and phase out schedules for cane trash burning in SãoPaulo.<br />
<strong>Sugarcane</strong> <strong>ethanol</strong> 97
Chapter 4<br />
Table 2. Basic data: sugarcane processing.<br />
Item Units 2006 a 2020<br />
electricity b<br />
Bagasse use Low pressure<br />
cogeneration<br />
Advanced<br />
cogeneration<br />
2020<br />
<strong>ethanol</strong> b<br />
Electricity demand kWh/t cane 14.0 30 c<br />
Mechanical drivers kWh/t cane 16.0 0 0<br />
Electricity surplus kWh/t cane 9.2 d 135 e 44 f<br />
Trash recovery % <strong>to</strong>tal 0 40 40<br />
Bagasse surplus % <strong>to</strong>tal 9.6 0 g 0 g<br />
Ethanol yield l/t cane 86.3 92.3 h 129<br />
Biochemical<br />
conversion<br />
a CTC information (CTC, 2006b).<br />
b Authors’ projections.<br />
c 30 kWh/t cane + 130 kWh/t hydrolyzed biomass (dry basis).<br />
d Cogen’s data; only 10% of the mills use higher pressure boilers, and the remaining 90% still use<br />
21 bar/300°C, with very low electricity surplus.<br />
e All mills operating at 65 bar/480°C, CEST systems; process steam consumption ~340 kg steam/t<br />
cane, and using recovered trash (40%).<br />
f A hypothetical mill operating at 65 bar/480°C, ‘pure’ cogeneration; using ~340 kg steam/t cane.<br />
g All biomass (bagasse and 40% trash) is used for power generation or <strong>ethanol</strong> production.<br />
h Only the increase in sucrose % cane was considered.<br />
Table 3. Bioconversion parameters (SSCF process with dilute acid pretreatment) a .<br />
Hydrolysis 95 % (cellulose); 90% (hemicellulose)<br />
Fermentation 95% (glucose); 85% (other sugars)<br />
Energy demand<br />
Electricity 130 kWh/t (db)<br />
Steam<br />
Pre-treatments (kg/kg db) 0.45 (13 bar); 0.25 (4.4 bar)<br />
Distillation (kg/l et) 3.0 (2.5 bar); 0.05 (22 bar)<br />
Concentration (kg/l et.) 0.2 (1.7 bar)<br />
a Based on Aden et al. (2002); details in Seabra (2008).<br />
98 <strong>Sugarcane</strong> <strong>ethanol</strong>
Mitigation of GHG emissions using sugarcane bio<strong>ethanol</strong><br />
�e GHG emissions associated with direct land use <strong>change</strong> (LUC) are estimated separately<br />
in the next section, where the possible indirect impacts of land use <strong>change</strong> (ILUC) are also<br />
discussed for the speci�c case of the expansion of <strong>ethanol</strong> production in Brazil. �e energy<br />
use/conversion for 2006 and for each 2020 Scenario is presented in Table 4.<br />
�e corresponding GHG emissions for are in Table 5. Note that the di�erences in <strong>to</strong>tal<br />
emissions are strongly dependent on the co-products credits. �e large di�erence between<br />
2006 and the 2020 Electricity Scenario is due <strong>to</strong> an actual increase in the system energy<br />
e�ciency (much larger energy output). An analogous increase in energy output occurred<br />
between 2006 and the 2020 Ethanol Scenario, but note that the <strong>change</strong> is an increase in<br />
<strong>ethanol</strong> output (rather than in electricity) and also the emissions are presented in kg CO 2<br />
eq/m 3 <strong>ethanol</strong>. In the 2020 Ethanol Scenario the volume of <strong>ethanol</strong> produced/unit area (or<br />
<strong>ethanol</strong>/ t cane) is 1.4 times larger than in the 2020 Electricity Scenario.<br />
It is important <strong>to</strong> remember that the 2006 data (and results) correspond <strong>to</strong> the average<br />
values of the parameters; even for a homogeneous set of producers (Brazil Center South<br />
region) di�erences in processes (agricultural and industrial) impact energy �ows and<br />
GHG emissions. For the sample used, the variation of main production parameters and the<br />
Table 4. Energy balance in anhydrous <strong>ethanol</strong> production (MJ/t cane).<br />
2006 2020 electricity 2020 <strong>ethanol</strong><br />
Energy input 235 262 268<br />
Agriculture 211 238 238<br />
Cane production 109 142 143<br />
Fertilizers 65 51 50<br />
Transportation 37 45 45<br />
Industry 24 24 31<br />
Inputs 19 20 25<br />
Equip./buildings 5 4 6<br />
Energy output 2,198 3,171 3,248<br />
Ethanol a 1,926 2,060 2,880<br />
Electricity surplus b 96 1,111 368<br />
Bagasse surplus a 176 0.0 0.0<br />
Energy ratio 9.4 12.1 12.1<br />
a Based on LHV (Low Heating Value).<br />
b Considering the substitution of biomass-electricity for natural gas-electricity, generated with 40%<br />
(2006) and 50% (2020) efficiencies (LHV).<br />
<strong>Sugarcane</strong> <strong>ethanol</strong> 99
Chapter 4<br />
Table 5. Total emission in <strong>ethanol</strong> life cycle (kg CO 2 eq/m 3 anhydrous) a .<br />
2006 2020 electricity 2020 <strong>ethanol</strong><br />
Cane production 416.8 326.3 232.4<br />
Farming 107.0 117.2 90.6<br />
Fertilizers 47.3 42.7 23.4<br />
Cane transportation 32.4 37.0 26.4<br />
Trash burning 83.7 0.0 0.0<br />
Soil emissions 146.3 129.4 92.0<br />
Ethanol production 24.9 23.7 21.6<br />
Chemicals 21.2 20.2 18.5<br />
Industrial facilities 3.7 3.5 3.2<br />
Ethanol distribution 51.4 43.3 43.3<br />
Credits<br />
Electricity surplus b -74.2 -802.7 -190.0<br />
Bagasse surplus c -150.0 0.0 0.0<br />
Total 268.8 -409.3 107.3<br />
a Emissions for hydrous <strong>ethanol</strong>/m3 are about 5% less than values verified for anhydrous <strong>ethanol</strong>.<br />
b Considering the substitution of biomass-electricity for natural gas-electricity, generated with 40%<br />
(2006) and 50% (2020) efficiencies (LHV).<br />
c Considering the substitution of biomass fuelled boilers (efficiency = 79%; LHV) for oil fuelled boilers<br />
(efficiency = 92%; LHV).<br />
corresponding response <strong>to</strong> each single parameter variation in GHG emissions are shown<br />
in Figure 1.<br />
Note that the electricity surplus and the bagasse surplus show very large variation now,<br />
when a few mills have started <strong>to</strong> export large amounts of electricity. �e net GHG avoided<br />
emissions, including the <strong>ethanol</strong> substitution for gasoline and considering the engines<br />
performances in Brazil (based on the experience with the �eet of 23 M vehicles, in the last<br />
30 years, with E-24, E-100 and Flex Fuel engines) is shown in Table 6.<br />
�e use of the allocation (energy) criterion for the co-products (with the whole GHG<br />
emissions associated with cane and <strong>ethanol</strong> production being distributed among <strong>ethanol</strong>,<br />
electricity and surplus bagasse according <strong>to</strong> their energy content, and with no co-product<br />
credits considered in the net emission) is compared <strong>to</strong> the use of the substitution criterion<br />
(with the mitigation derived from <strong>ethanol</strong>, electricity and surplus bagasse use being<br />
considered as well as all emissions from cane and <strong>ethanol</strong> production) in Figure 2; the<br />
substitution criterion results are detailed in Table 6.<br />
100 <strong>Sugarcane</strong> <strong>ethanol</strong>
GHG emission (kg CO 2 eq/m 3 etOH)<br />
500<br />
400<br />
300<br />
200<br />
100<br />
0<br />
Mitigation of GHG emissions using sugarcane bio<strong>ethanol</strong><br />
-100<br />
-200% -100% 0% 100% 200% 300% 400% 500%<br />
Parameter variation<br />
N-fertilizer use Trucks' energy efficiency<br />
Average distance (cane) Mechanical harvesting<br />
Unburned cane Cane productivity<br />
Ethanol yield Bagasse surplus<br />
Electricity surplus Other diesel consumption<br />
Average distance (<strong>ethanol</strong>)<br />
Figure 1. GHG emissions variation in response <strong>to</strong> single parameter variation; including co-product<br />
credits (2006 only).<br />
Table 6. Avoided emissions due <strong>to</strong> <strong>ethanol</strong> use (t CO 2 eq/m 3 hydrous or anhydrous; substitution<br />
criterion for the co-products).<br />
Ethanol use a Avoided emission b Net emission c<br />
2006 E100 -2.0 -1.7<br />
E25 -2.1 -1.8<br />
2020 electricity E100 -2.0 -2.4<br />
FFV -1.8 -2.2<br />
E25 -2.1 -2.5<br />
2020 <strong>ethanol</strong> E100 -2.0 -1.9<br />
FFV -1.8 -1.7<br />
E25 -2.1 -2.0<br />
a E100, or HDE: hydrous <strong>ethanol</strong> in dedicated engines; FFV: hydrous <strong>ethanol</strong> in flex-fuel engines;<br />
E25: anhydrous <strong>ethanol</strong> (25% volume) and gasoline blend.<br />
b Avoided emission (negative values) due <strong>to</strong> the substitution of <strong>ethanol</strong> for gasoline; fuel<br />
equivalencies verified for each application in Brazil (Macedo et al., 2008).<br />
c Net emission = (avoided emission due <strong>to</strong> <strong>ethanol</strong> use) + (<strong>ethanol</strong> life cycle emission). Co-products<br />
credits are included.<br />
<strong>Sugarcane</strong> <strong>ethanol</strong> 101
Chapter 4<br />
0%<br />
-20%<br />
-40%<br />
-60%<br />
-80%<br />
-100%<br />
-120%<br />
-140%<br />
2006 2020 electricity 2020 <strong>ethanol</strong><br />
HDE E25 HDE FFV E25 HDE FFV E25<br />
Allocation Co-products credits<br />
Figure 2. GHG mitigation with respect <strong>to</strong> gasoline: allocation or co-products credits.<br />
As expected from the energy balances, the use of <strong>ethanol</strong> from sugarcane substituting for<br />
gasoline leads <strong>to</strong> a very important GHG emissions mitigation; this is due mostly <strong>to</strong> the<br />
use of cane residues as the source of energy for processing sucrose <strong>to</strong> <strong>ethanol</strong>. However,<br />
the much more e�cient use of the cane residues is leading <strong>to</strong> entirely o�set the gasoline<br />
emissions, and beyond that, as shown in Figure 2 for the 2020 Electricity scenario. A separate<br />
accounting of the gains with electricity and <strong>ethanol</strong> (with allocation of the emissions) still<br />
shows gains in the 2020 Scenarios, due <strong>to</strong> increase e�ciencies/productivity in both cane<br />
production and processing.<br />
4. Land use <strong>change</strong>: direct and indirect effects on GHG emissions<br />
�e variation in carbon s<strong>to</strong>cks (both in soils and above ground) due <strong>to</strong> <strong>change</strong>s in the land<br />
use is included in the national carbon inven<strong>to</strong>ries, and evaluation methodologies have been<br />
established. �e large number of parameters (culture type; soil; cultivation practices; local<br />
<strong>climate</strong>) and the lack of su�cient and adequate information for many cases lead <strong>to</strong> large<br />
error estimates for the default values, both for the basic soil type/<strong>climate</strong> carbon s<strong>to</strong>cks for<br />
native vegetation and for the relative (main parameters) s<strong>to</strong>ck <strong>change</strong> fac<strong>to</strong>rs (IPCC, 2006).<br />
�e use of adequate local data is recommended.<br />
Recently the so called indirect land use <strong>change</strong> (ILUC) impact in emissions is being discussed;<br />
the debate shows that we do not have suitable <strong>to</strong>ols (methodologies) or su�cient data <strong>to</strong><br />
reach acceptable, quanti�ed conclusions about ILUC impacts on GHG emissions, globally.<br />
102 <strong>Sugarcane</strong> <strong>ethanol</strong>
Mitigation of GHG emissions using sugarcane bio<strong>ethanol</strong><br />
However, local conditions in Brazil indicate a good possibility of signi�cant increases in<br />
<strong>ethanol</strong> production without increasing ILUC emissions. Both LUC and ILUC impacts on<br />
emissions for <strong>ethanol</strong> are considered below.<br />
4.1. Land use <strong>change</strong> with the <strong>ethanol</strong> production in Brazil: past and trends<br />
Brazil has 28.3% (~440 M ha) of all original forests in the world, over a <strong>to</strong>tal surface of 850<br />
M ha. From the agricultural land, only 46.6 M ha are used for grain; 199 M ha correspond<br />
<strong>to</strong> ‘pasture’; large fraction of this is somewhat degraded land (extensive grazing, not planted<br />
pasture).<br />
<strong>Sugarcane</strong> for <strong>ethanol</strong> <strong>to</strong>day (2008) uses only 4 M ha, slightly more than 1% of the arable<br />
land in Brazil. Ethanol production increased fast with the Pro-Alcool Program until 1985,<br />
when it reached 11.8 M m 3 ; stabilized at this level, and in 2002 the production was 12.5 M<br />
m 3 . �ere was no land use <strong>change</strong> with cane for <strong>ethanol</strong> in the period from 1984 <strong>to</strong> 2002.<br />
Ethanol production growth re-started only in 2002, <strong>to</strong> an expected value of 26 M m 3 in<br />
2008 (MAPA, 2007; CONAB, 2008). �e expansion area (sugar and <strong>ethanol</strong>) from 2005 <strong>to</strong><br />
2008 was 2.2 M ha in the Center-South (Nassar, 2008); <strong>ethanol</strong> used 49% of the sugarcane<br />
in 2002, and 55% in 2008.<br />
�e patterns of land use <strong>change</strong>, as well as the <strong>change</strong>s in cane culture procedures determine<br />
the associated impacts on GHG emissions. For land use <strong>change</strong>, a recent analysis (Nassar<br />
et al, 2008) uses satellite images (Landsat and CBERS) available since 2003 for State of São<br />
Paulo, and 2005 for other States; and secondary data (based on IBGE data, for the whole<br />
region, from 2002 <strong>to</strong> 2006) is also analyzed for each micro-region using a Shi� Share model.<br />
A comprehensive �eld survey was reported by CONAB (CONAB, 2008) for the LUC<br />
involving sugarcane from 2007 <strong>to</strong> 2008. Data was also obtained from the Environmental<br />
impact reports (EIA – RIMA) needed for licensing new increases in sugarcane area (Nassar<br />
et al, 2008); they refer also <strong>to</strong> the next years expected LUC.<br />
Some of the main conclusions for the <strong>change</strong>s from 2002 <strong>to</strong> 2008 are:<br />
1. <strong>Sugarcane</strong> always substitutes for established crops, or pasture lands; for economic<br />
reasons, and with the large availability of low productivity pasture lands associated <strong>to</strong><br />
some pasture area conversion <strong>to</strong> higher e�ciency systems, very small advances in native<br />
vegetation (forests, cerrados) areas are observed. In some cases degraded pasture lands<br />
are cultivated for one or two years with soybeans, <strong>to</strong> improve soil conditions before using<br />
for sugarcane. Intercropping (rotation of sugarcane every �ve or six years, before a new<br />
planting, with other crops) is becoming a widespread practice. Satellite data for the last<br />
two years (2007/08 and 2008/09) for the cane expansion areas in the six Center South<br />
cane producer states (<strong>to</strong>tal 2.18 M ha) indicates their origin: 53% from Agriculture; 45%<br />
from Pastures; 1.3% from Citrus plantations; and only 0.5% from Arboreal Vegetation<br />
<strong>Sugarcane</strong> <strong>ethanol</strong> 103
Chapter 4<br />
(native or anthropic), including wood plantations (eucalyptus or pinus). �e CONAB<br />
survey (CONAB, 2008) indicates for ‘new areas’ (not all related <strong>to</strong> native vegetation) only<br />
1.5% of the expansion, in 2007/08. All studies indicate that Pasture lands utilization is<br />
surpassing Agriculture land utilization (for cane) in the last years, in many areas.<br />
2. �e �eld survey (CONAB, 2008) indicates for 2007/08 LUC the largest Agriculture area<br />
substituted was soybean, followed by maize. �e use of Pasture lands is also related <strong>to</strong><br />
the conversion from low productivity pasture (both native and some planted pasture:<br />
degradation from inadequate management, and no fertilizers) (Macedo, 2005b), <strong>to</strong> high<br />
productivity pastures, liberating areas. Estimates indicate <strong>to</strong>day 150 M ha of cultivated<br />
pasture land, and 70 M ha of ‘natural’ pastures.<br />
3. Most of the expansion (94%) for sugar from 1992 <strong>to</strong> 2003 occurred around the existing<br />
sugar mills, in the Center South; now sugarcane moves <strong>to</strong> the West and North of the<br />
region, in the States of Goiás, Ma<strong>to</strong> Grosso, Minas Gerais and Ma<strong>to</strong> Grosso do Sul. �is<br />
is the trend for the next decade.<br />
�e analysis (Nassar et al., 2008) included the projected patterns of land use <strong>change</strong> for the<br />
sugarcane expansion <strong>to</strong> 2020, considering land availability, biomes and reserved areas; the<br />
response <strong>to</strong> prices/costs, demand and competition in Brazil and outside.<br />
4.2. Soil and above ground carbon s<strong>to</strong>cks<br />
A recent study (Amaral et al., 2008) on <strong>ethanol</strong> production sustainability included data<br />
on below and above ground carbon s<strong>to</strong>cks for sugarcane (both burned and green cane<br />
harvesting conditions) in Brazil, as well as for the most important replaced crops and<br />
vegetation. �e data was obtained from more than 80 reports in the last 8 years; a selection<br />
was made <strong>to</strong> yield comparable results (for soil types, soil depths, methodology, cultural<br />
practices).<br />
Table 7 shows some results for soil carbon from the survey, as well as the default values<br />
calculated with the IPCC recommendations (IPCC, 2006). �e IPCC based values<br />
correspond <strong>to</strong> the speci�c soil types (High or Low activity clay, HAC or LAC), <strong>climate</strong>,<br />
crop type and cultivation practices for each crop. �e experimental data indicates the soil<br />
types (HAC, LAC or Sandy) and some cultural practices, always for 20 cm depth. Selected<br />
values were used <strong>to</strong> evaluate the soil carbon s<strong>to</strong>ck <strong>change</strong> with land use <strong>change</strong>, for each<br />
speci�c case (last column).<br />
Table 8 (Amaral et al., 2008) shows the experimental values for the sugarcane and the main<br />
replaced crops/pasture above ground carbon.<br />
104 <strong>Sugarcane</strong> <strong>ethanol</strong>
Table 7. Soil carbon content for different crops (t C/ha).<br />
Mitigation of GHG emissions using sugarcane bio<strong>ethanol</strong><br />
Crop IPCC defaults a Experimental b Selected<br />
values<br />
LAC HAC HAC Other<br />
Degraded pasturelands 33 46 41 16 c 41<br />
Natural pasturelands 46 63 56 56<br />
Cultivated pasturelands 55 76 52 24 c 52<br />
Soybean cropland 31 42 53 53<br />
Maize cropland 31 42 40 40<br />
Cot<strong>to</strong>n cropland 23 31 38 38<br />
Cerrado 47 65 46 46<br />
Campo Limpo 47 65 72 72<br />
Cerradão 47 65 53 53<br />
Burned cane 23 31 35-37 35 d 36<br />
Unburned cane 60 83 44-59 51<br />
a Based on IPCC parameters indicated, IPCC, 2006<br />
b Amaral et al., 2008 (all 0-20 cm).<br />
c Sandy soils.<br />
d LAC soils.<br />
Table 8. Above ground carbon s<strong>to</strong>cks (t C/ha) a .<br />
Degraded pasturelands 1.3<br />
Cultivated pasturelands 6.5 b<br />
Soybean croplands 1.8 c<br />
Maize croplands 3.9<br />
Cot<strong>to</strong>n croplands 2.2 d<br />
Cerrado sensu strictu 25.5 e<br />
Campo Limpo 8.4 f<br />
Cerradão 33.5 g<br />
Unburned cane 17.8<br />
a Amaral et al. (2008).<br />
b LAC soils.<br />
c HAC soils.<br />
d General value.<br />
e Areas with more than 20 years without burning.<br />
d Areas with 3 years without burning.<br />
e Areas with 21 years without burning.<br />
<strong>Sugarcane</strong> <strong>ethanol</strong> 105
Chapter 4<br />
4.3. Estimated emissions from LUC<br />
For the <strong>change</strong>s from 2002 <strong>to</strong> 2006 (areas closer <strong>to</strong> the existing mills) soil types were<br />
frequently HAC, and some of the cane was burned; for the expansion now and in next<br />
decade, soils will be closer <strong>to</strong> LAC (and for 2020, 100% green cane harvesting is assumed).<br />
�e trends for land use <strong>change</strong> until 2020 are discussed in the next sections.<br />
It is assumed that at least 70% of the pasture land used for cane is not planted pasture,<br />
with varying degrees of degradation. Using the values in Tables 7 and 8, and the areas<br />
for each type of vegetation replaced with sugarcane, the <strong>to</strong>tal carbon s<strong>to</strong>ck <strong>change</strong> was<br />
evaluated and divided by a 20 year period. For the above ground carbon s<strong>to</strong>ck, only the<br />
values corresponding <strong>to</strong> perennial vegetation were considered. Results are in Table 9.<br />
Note that in all Scenarios there is a net reduction in emissions (close <strong>to</strong> 100 kg CO 2 eq/m 3<br />
<strong>ethanol</strong>); this was expected, since the expansion areas for sugarcane include a very small<br />
fraction of native lands with high carbon s<strong>to</strong>cks, and some degraded land. �e speci�c<br />
situation for land availability, the environmental restrictions and local economic conditions<br />
(relative crop values and implementation costs), discussed in the section Ethanol in the<br />
Table 9. Emissions associated with LUC <strong>to</strong> unburned cane.<br />
Reference crop Carbon s<strong>to</strong>ck<br />
<strong>change</strong> a<br />
(t C/ha)<br />
Emissions (kg CO 2 eq./m 3 )<br />
2006 2020 electricity 2020 <strong>ethanol</strong><br />
Degraded pasturelands 10 -302 -259 -185<br />
Natural pasturelands -5 157 134 96<br />
Cultivated pasturelands -1 29 25 18<br />
Soybean cropland -2 61 52 37<br />
Maize cropland 11 -317 -272 -195<br />
Cot<strong>to</strong>n cropland 13 -384 -329 -236<br />
Cerrado -21 601 515 369<br />
Campo Limpo -29 859 737 527<br />
Cerradão -36 1,040 891 638<br />
LUC emissions b -118 -109 -78<br />
a Based on measured values for below and above ground (only for perennials) carbon s<strong>to</strong>cks.<br />
b Considering the following LUC distribution – 2006: 50% pasturelands (70% degraded<br />
pasturelands; 30% natural pasturelands), 50% croplands (65% soybean croplands; 35% other<br />
croplands); 2020: 60% pasturelands (70% degraded pasturelands; 30% natural pasturelands); 40%<br />
croplands (65% soybean croplands; 35% other croplands). Cerrados were always less than 1%.<br />
106 <strong>Sugarcane</strong> <strong>ethanol</strong>
Mitigation of GHG emissions using sugarcane bio<strong>ethanol</strong><br />
speci�c Brazilian context, indicate that LUC motivated GHG emissions will not impact<br />
<strong>ethanol</strong> production growth in Brazil in the time frame considered (2020).<br />
It must be noted that the above ground carbon in the sugarcane plant is relatively high, and<br />
even with its annual harvesting the <strong>change</strong> from any of the other crop, or even a campo<br />
limpo, <strong>to</strong> sugarcane will produce an additional carbon capture (corresponding <strong>to</strong> di�erences<br />
in the ‘average’ above ground carbon in the plants). �is was not included here, since it has<br />
not been considered in the IPCC methodology.<br />
4.4. Indirect land use <strong>change</strong> effects on GHG emissions of biofuels worldwide<br />
For most land use <strong>change</strong>s anywhere some impacts (including in GHG emissions) may<br />
happen; and in our increasingly globalized economy indirect LUC impacts may occur.<br />
However some of the hypotheses and <strong>to</strong>ols leading <strong>to</strong> the initial quanti�cation of the<br />
impacts of biofuels production (Gnansounou et al., 2008), as presented <strong>to</strong>day, are clearly<br />
not suitable:<br />
• A key issue for the models is the correct description of the drivers <strong>to</strong> LUC, everywhere;<br />
but many agricultural products are inter<strong>change</strong>able, and (increasingly) traded globally;<br />
and the drivers of LUC vary in time and regionally. ‘Equilibrium’ conditions are not<br />
reached. Drivers are established by local culture, economics, environmental conditions,<br />
land policies and development programs. �e development of a range of methodologies<br />
and the acquisition/selection of suitable data are needed <strong>to</strong> reach acceptable, quanti�ed<br />
conclusions on ILUC e�ects. �e growing consensus over this problem is summarized in<br />
the recent letter from 28 scientists <strong>to</strong> the CARB (M.D. Nichols, personal communication):<br />
‘…a severe lack of hard empirical data’… (the need <strong>to</strong>) ‘further study highly controversial<br />
and speculative indirect land use <strong>change</strong>s… (for the) necessary time over the next �ve<br />
years… before incorporating any of these indirect impacts in (the LCFS) standard’.<br />
Simplifying methodologies (looking <strong>to</strong> ‘regions’ in the world, therefore losing the global<br />
implications; or relying on indexes for <strong>to</strong>o large areas, <strong>to</strong> by-pass the lack of data; or<br />
distributing the <strong>to</strong>tal ‘estimated’ ILUC emissions equally among all biofuels) would lead<br />
<strong>to</strong> still less accurate results.<br />
• �e land used for agriculture <strong>to</strong>day is ~1300 M ha, excluding pasture lands; biofuels use<br />
less than 1.5% of that; and possibly less than 4% in 2030 (IEA, 2006). Today’s distribution<br />
of production among regions/countries has never considered GHG emissions; it was<br />
determined by the local/time dependent drivers (including subsidies and food security<br />
considerations). �e better knowledge of those drivers and their e�ects, and its use <strong>to</strong><br />
re-direct land use as possible over all the agricultural and pasture lands worldwide, would<br />
be much more e�ective than just <strong>to</strong> work on the ‘marginal’ biofuels growth areas. We<br />
should not simply take as ‘un<strong>change</strong>able’ the huge context of <strong>to</strong>day’s agriculture.<br />
•<br />
Increases in agricultural productivity, energy end-use e�ciencies and the use of other<br />
energy renewable resources in the next decades may be expected, changing energy<br />
<strong>Sugarcane</strong> <strong>ethanol</strong> 107
Chapter 4<br />
demand and required areas for energy production, and they can entirely <strong>change</strong> the<br />
‘future’ ILUC impacts of biofuels.<br />
4.5. ILUC effects from <strong>ethanol</strong> in the specific Brazilian context<br />
In general, exceptions (biofuel sources with no LUC indirect GHG emissions) have been<br />
considered: waste or residues; use of marginal or degraded land; unused or fallow arable<br />
land; or improving yields in currently used land. Looking at the scenarios for <strong>ethanol</strong><br />
production in Brazil, and the land use in Brazil <strong>to</strong>day (in the context of the available land)<br />
we note that:<br />
Most scenarios (based on Internal Demand plus some hypotheses for Exports) indicate<br />
a <strong>to</strong>tal of ~ 60 M m3 <strong>ethanol</strong> in 2020 (CEPEA, 2007; Carvalho, 2007; EPE, 2007),<br />
corresponding <strong>to</strong> 36 M m3 •<br />
more than in 2008. For the 2020 conditions, the additional<br />
area needed will be only 4.9 M ha (Scenario Electricity) or 3.5 M ha (Scenario Ethanol).<br />
Since the Scenario Ethanol would not be implemented (even if technically successful,<br />
and competitive) in time, we may expect ~5.1 M ha of new cane area, until 2020.<br />
• Agricultural production (crops) uses a small fraction of the <strong>to</strong>tal area, and only 18.5 %<br />
of the arable land (Table 10). Pasture land (200 M ha) is nearly 60% of the arable land.<br />
<strong>Sugarcane</strong> for <strong>ethanol</strong> uses only 1% of the arable land, and the Land Available (not<br />
including the conversion of pasture lands) is twenty times larger. �e new area needed<br />
for sugarcane until 2020 (5.1 M ha) is only 8% of the <strong>to</strong>tal crop area <strong>to</strong>day, or 2.5% of<br />
the pasture area <strong>to</strong>day.<br />
• �e conversion of low quality pasture land <strong>to</strong> higher e�ciency productive pasture is<br />
liberating areas for other crops. �e average heads/ha in Brazil was 0.86 (1996); and<br />
0.99 (2006), with nearly 50% planted pasture (IBGE, 2006). In the State of São Paulo the<br />
average was 1.2-1.4 in the last years. �e conversion of low grade pasture could release<br />
~30 M ha for other uses.<br />
•<br />
<strong>Sugarcane</strong> expansion is smaller than the expansion of pasture and crops; and in the<br />
places where sugarcane expands the eventual competition products (crops and cattle)<br />
also expand. �e expansion for other agricultural crops and pasture is taking place<br />
independently of sugarcane expansion. In the period from 2002 <strong>to</strong> 2008 the sugarcane<br />
expansion displaced Pasture and Crops (CONAB, 2008; Nassar, 2008) as follows: crop<br />
area displaced, 0.5% (but crop area increased 10%, and cereal + oilseeds production<br />
increased 40%); pasture area displaced, 0.7%; <strong>to</strong>tal pasture area decreased 1.7% (but<br />
beef production grew 15%).<br />
Within its soil and <strong>climate</strong> limitations, the strict application of the environmental legislation<br />
for the new units, and the relatively small areas needed, the expansion of sugarcane until<br />
2020 is not expected <strong>to</strong> contribute <strong>to</strong> ILUC GHG emissions.<br />
108 <strong>Sugarcane</strong> <strong>ethanol</strong>
5. Conclusions<br />
Mitigation of GHG emissions using sugarcane bio<strong>ethanol</strong><br />
Table 10. Land use in Brazil: selected uses (2006) (UNICA, 2008; Scolari, 2006; FAO, 2005; IBGE,<br />
2005).<br />
Land use Area, M ha % of arable land % cultivated land<br />
Total land 850<br />
Forests 410<br />
Arable land 340 (40%) 100.0<br />
Pasture land 200 58.8<br />
Cultivated land (all crops) 63 18.5 100.0<br />
Soybean 22 6.5 34.9<br />
Maize 13 3.8 20.6<br />
<strong>Sugarcane</strong> (<strong>to</strong>tal) 7 2.1 11.1<br />
<strong>Sugarcane</strong> for <strong>ethanol</strong> 3.5 1.0 5.6<br />
Available land 77 22.6 122.2<br />
�e analyses of the GHG emissions (and mitigation) with <strong>ethanol</strong> from sugarcane in Brazil<br />
in the last years (2002-2008) and the expected <strong>change</strong>s in the expansion from 2008 <strong>to</strong> 2020<br />
show that:<br />
�e large energy ratios (output renewable/input fossil) may still grow from the 9.4 value<br />
(2006) <strong>to</strong> 12.1 (2020) in two Scenarios: the better use of cane biomass <strong>to</strong> generate surplus<br />
electricity (2020 Electricity Scenario: already under implementation) or <strong>to</strong> produce more<br />
<strong>ethanol</strong> (2020 Ethanol Scenario: depending on technology development). �e Ethanol<br />
Scenario, if fully implemented, would reduce the area needed by 29%.<br />
�e corresponding GHG mitigation (with respect <strong>to</strong> gasoline), for <strong>ethanol</strong> use in Brazil,<br />
would increase from the 79% (2006) <strong>to</strong> 86% (2020) if only the <strong>ethanol</strong> is considered<br />
(with emissions allocation <strong>to</strong> co-products), or from 86% (2006) <strong>to</strong> 95% or 120% (2020:<br />
Ethanol or Electricity Scenarios) if all co-products credits and emissions are considered<br />
for <strong>ethanol</strong> (substitution criterion).<br />
LUC due <strong>to</strong> <strong>ethanol</strong> expansion started in 2002 (<strong>ethanol</strong> production was constant at the 12<br />
M m3 level, since 1984). In the expansion, land availability, the environmental restrictions,<br />
the relatively small area used for expansion and the local economic conditions (relative<br />
crop values and implementation costs) led <strong>to</strong> very small use of native vegetation lands<br />
(
Chapter 4<br />
•<br />
Suitable evaluations (even estimates) of ILUC impact in emissions are far from possible<br />
<strong>to</strong>day, due <strong>to</strong> the lack of adequate methodologies and corresponding (global) data.<br />
However local conditions in Brazil indicate a good possibility of signi�cant increases<br />
in <strong>ethanol</strong> production without increasing ILUC GHG emissions:<br />
– �e area needed for expansion (~5 M ha, until 2020) is very small when compared<br />
with the areas liberated with increased cattle raising e�ciency (30 M ha) and other<br />
non used arable lands.<br />
–<br />
<strong>Sugarcane</strong> expansion has been independent of (and much smaller than) the growth<br />
of other agricultural crops, in the same areas. In all sugarcane expansion areas the<br />
eventual competition products (crops and beef production) also expanded.<br />
References<br />
Aden, A., M. Ruth, K. Ibsen, J. Jechura, K. Neeves, J. Sheehan, B. Wallace, L. Montague, A. Slay<strong>to</strong>n and J.<br />
Lukas, 2002. Lignocellulosic biomass <strong>to</strong> <strong>ethanol</strong> process design and economics utilizing co-current<br />
dilute acid prehydrolysis and enzymatic hydrolysis for maize s<strong>to</strong>ver. Technical report TP-510-32438,<br />
NREL, Golden, CO, USA.<br />
Amaral, W.A.N., 2008. Environmental sustainability of sugarcane <strong>ethanol</strong> in Brazil. In: P. Zuurbier and J. van<br />
de Vooren (eds.) <strong>Sugarcane</strong> <strong>ethanol</strong>, Wageningen Academic Publishers, Wageningen, the Netherlands,<br />
pp. 113-138.<br />
Carvalho, E.P., 2007. Etanol como Alternativa Energética. UNICA: presentation <strong>to</strong> the Casa Civil, Presidência<br />
da República, Brasília, Brazil.<br />
CEPEA, 2007. Cenários (oferta e demanda) para o se<strong>to</strong>r de cana de açúcar. CEPEA (Internal Report), Esalq,<br />
Piracicaba, Brazil.<br />
CONAB, 2008. Acompanhamen<strong>to</strong> da safra Brasileira: Cana de Açúcar. Companhia Nacional de<br />
Abastecimen<strong>to</strong>, MAPA, Brasilia, Brazil.<br />
CTC, 2006a. Controle mútuo agrícola anual - safra 2005/2006. Centro de Tecnologia Canavieira, Piracicaba,<br />
Brazil, 126 p. + anexos.<br />
CTC, 2006b. Technical information provided by scientists and engineers <strong>to</strong> I Macedo and J Seabra. Piracicaba:<br />
<strong>Sugarcane</strong> Technology Centre, Brazil.<br />
EPE, 2007. Plano Nacional de Energia 2030. Empresa de Planejamen<strong>to</strong> Energético, MME, Brazil.<br />
FAO, 2005. Food and Agriculture Organization, U.N. Statistical Databases, Agriculture. http://www.fao.<br />
org/faostat.<br />
Gnansounou, E., L. Panichelli, A. Dauriat and J.D. Villegas, 2008. Accounting for indirect land-use <strong>change</strong>s<br />
in GHG balances of biofuels: review of current approaches. École Polytechnique Fédérale de Lausanne,<br />
Working Paper 437.101.<br />
Hassuani, S.J., M.R.L.V. Leal and I.C. Macedo, 2005. Biomass power generation: sugarcane bagasse and trash.<br />
Série Caminhos para Sustentabilidade. Piracicaba: PNUD-CTC, Brazil.<br />
IBGE, 2005. Indicadores Agropecuários 2005. Institu<strong>to</strong> Brasileiro de Geogra�a e Estatistica. Available at:<br />
http://www.ibge.org.br.<br />
IBGE, 2006. Produção Agrícola Municipal, v. 33. Institu<strong>to</strong> Brasileiro de Geogra�a e Estatistica. Available<br />
at: http://www.ibge.org.br.<br />
110 <strong>Sugarcane</strong> <strong>ethanol</strong>
Mitigation of GHG emissions using sugarcane bio<strong>ethanol</strong><br />
IEA, 2006. Alternative Energy Scenarios. World Energy Outlook 2006. International Energy Agency.<br />
IPCC, 2006. IPCC guidelines for national greenhouse gas inven<strong>to</strong>ries, Prepared by the National Greenhouse<br />
Gas Inven<strong>to</strong>ries Programme. In: H.S. Eggles<strong>to</strong>n, L. Buendia, K. Miwa, T. Ngara and K. Tanabe (eds.)<br />
Japan: IGES.<br />
Macedo, I.C. (ed.) 2005. <strong>Sugarcane</strong>’s Energy – Twelve studies on Brazilian sugarcane agribusiness and its<br />
sustainability. São Paulo: Berlendis & Vertecchia: UNICA, Brazil.<br />
Macedo, I.C., 2008. GHG mitigation and cost analyses for expanded production and use of fuel <strong>ethanol</strong> in<br />
Brazil. Final Report, prepared for Center for Clean Air Policy – CCAP. Washing<strong>to</strong>n, USA.<br />
Macedo, I.C., J.E.A. Seabra and J.E.A.R. Silva, 2008. Green house gases emissions in the production and<br />
use of <strong>ethanol</strong> from sugarcane in Brazil: �e 2005/2006 averages and a prediction for 2020. Biomass<br />
and Bioenergy, 32: 582-595.<br />
MAPA, 2007. Projeções do Agronegócio – Mundo e Brasil, 2006/07 a 2017/18. Ministério da Agricultura,<br />
Pecuária e Abastecimen<strong>to</strong> (MAPA), Assessoria de Gestão Estratégica, Brazil.<br />
Nassar, 2008. Sustainability considerations for <strong>ethanol</strong>. Food, Fuel and Forests: A Seminar in Climate Change,<br />
Agriculture and Trade. Bogor, Indonesia.<br />
Nassar, A.M., B.F.T. Rudor�, L.B. An<strong>to</strong>niazzi, D. Alves de Aguiar, M.R.P. Bacchi and M. Adami, 2008.<br />
Prospects of the sugarcane expansion in Brazil: impacts on direct and indirect land use <strong>change</strong>s. In: P.<br />
Zuurbier and J. van de Vooren (eds.) <strong>Sugarcane</strong> <strong>ethanol</strong>, Wageningen Academic Publishers, Wageningen,<br />
the Netherlands, pp. 63-93.<br />
Seabra, J.E.A., 2008. Avaliação técnico-econômica de opções para o aproveitamen<strong>to</strong> integral da biomassa<br />
de cana no Brasil. Campinas, Faculdade de Engenharia Mecânica, Universidade Estadual de Campinas,<br />
PhD �esis, 273 p.<br />
Scolari, D., 2006. Produção Agricola Mundial: o potencial do Brasil. Embrapa (Empresa Brasileira de<br />
Pesquisa Agopecuária), Brasilia, Brazil.<br />
UNICA, 2008. Frequently asked questions about the Brazilian sugarcane industry. UNICA, S Paulo,<br />
Brazil.<br />
<strong>Sugarcane</strong> <strong>ethanol</strong> 111
Chapter 5<br />
Environmental sustainability of sugarcane <strong>ethanol</strong> in Brazil<br />
Weber Antônio Neves do Amaral, João Paulo Marinho, Rudy Tarasantchi, Augus<strong>to</strong> Beber and<br />
Eduardo Giuliani<br />
1. Introduction<br />
Brazil’s economy is performing well during the last few year reaching international<br />
investment grade levels, while at the same time providing quanti�able reductions of<br />
greenhouse gases, specially through its renewable energy matrix and the large scale use<br />
of <strong>ethanol</strong> in transportation. It is well-known that the quality of life in the world increases<br />
with economic growth, which increases demand for energy (Figure 1). If one considers the<br />
externalities created by burning fossil fuels, then economic growth becomes a major threat<br />
<strong>to</strong> the global well being; reinforcing the need <strong>to</strong> explore alternatives <strong>to</strong> improve the e�ciency<br />
of energy use and diversi�cation of energy sources, and especially from renewable ones.<br />
Brazil’s commitment <strong>to</strong> sustainability in the agribusiness for example can be assessed by<br />
concrete examples such as the development and implemental of stringent legal environmental<br />
frameworks, agricultural zoning, massive investments in research and development and<br />
rural social policies, being the <strong>ethanol</strong> business a good example from which best practices<br />
could be disseminated.<br />
�e bene�ts of the production and use of <strong>ethanol</strong> in Brazil can also serve as a platform and<br />
model for further acceptance and deployment of renewable sources of biomass as feeds<strong>to</strong>ck<br />
for sustainable production of biofuels in the World. However there are several drivers that<br />
currently a�ect the supply and demand for biofuels and their sustainable production: land<br />
use <strong>change</strong>s, environmental concerns, competition with other sources of energy, food<br />
security, agricultural subsidies, innovation and technological development, public policies,<br />
oil prices, energy security policies, etc.<br />
�e Proalcool program (the Brazilian program for the production of <strong>ethanol</strong>) started in 1975,<br />
33 years ago, is a good example of a pro-active public policy supporting the development of<br />
biofuels with a focus on sugarcane <strong>ethanol</strong>. It made Brazil the second largest producer of<br />
<strong>ethanol</strong> (expected production of 23 billion liters in 2008), with the lowest production costs<br />
in the World (US$ 0.22/l – Table 1).<br />
<strong>Sugarcane</strong> <strong>ethanol</strong> 113
Chapter 5<br />
Oil reserves<br />
-<br />
Gasoline/diesel/<br />
querosene<br />
+<br />
GHGs<br />
+<br />
Climate<br />
<strong>change</strong><br />
+<br />
Global<br />
awareness<br />
-<br />
-<br />
Hydraulic<br />
-<br />
+<br />
+<br />
Nuclear<br />
-<br />
Wind<br />
+<br />
+<br />
Energy<br />
supply<br />
Energy<br />
demand<br />
-<br />
+<br />
+<br />
Environmental<br />
taxes and<br />
policies<br />
Native<br />
forests<br />
Land use<br />
patterns<br />
+<br />
+<br />
-<br />
Hydrogen<br />
+<br />
+<br />
+<br />
Food<br />
-<br />
-<br />
Consumption<br />
Ethanol &<br />
biodiesel<br />
+<br />
+<br />
+<br />
+<br />
Quality of<br />
life and<br />
livelihoods<br />
+<br />
+<br />
Jobs<br />
+<br />
+<br />
+<br />
Food<br />
security<br />
+<br />
Economic<br />
growth<br />
Roles and functions of<br />
government, private<br />
sec<strong>to</strong>r and ONGs<br />
114 <strong>Sugarcane</strong> <strong>ethanol</strong><br />
Quality<br />
of jobs<br />
Reinforcing loop<br />
+<br />
+<br />
Diversity of jobs Biodiversity<br />
Balanced loop<br />
-<br />
Figure 1. Social-economical-environmental dynamic structure. Source: Venture Partners do Brasil.
Table 1. Production costs of different biofuels (US$/liter) 1 .<br />
Environmental sustainability of sugarcane <strong>ethanol</strong> in Brazil<br />
Costs item United States Brazil EU<br />
Maize wet<br />
milling<br />
Maize dry<br />
milling<br />
<strong>Sugarcane</strong><br />
Sugar<br />
beets<br />
�e long track record of Brazilian sugarcane <strong>ethanol</strong> proved its economic sustainability<br />
over time, while improving its social and environmental indica<strong>to</strong>rs, involving technology<br />
transfer from Europe, US and other regions and developing several innovations at national<br />
level. �is program no longer exists, however it has contributed signi�cantly <strong>to</strong> improve the<br />
productivity of sugarcane and <strong>ethanol</strong> extraction rates (Figure 2).<br />
Due <strong>to</strong> the increasing internal demands and the possibility of future exports, it is expected<br />
that the Brazilian production might increase <strong>to</strong> 47 billion liters of <strong>ethanol</strong> by 2015, with an<br />
estimated annual growth rate of 10-13% (Table 2).<br />
Several steps will be necessary <strong>to</strong> achieve these production targets, including sustainable<br />
planning of the sugarcane expansion in<strong>to</strong> new areas, improving the logistics, the development<br />
of global markets and continuously developing new technological innovations, while at<br />
the same time improving the environmental performance of existing brown �elds (areas<br />
with already established sugarcane �elds and industry either/or sugar mills/distilleries)<br />
and especially from new green �elds (new areas for expansion of sugarcane �elds and<br />
new industrial plants), which are being implemented using cutting edge technologies<br />
in the agriculture and in the industry. With more than 360 mills in operation, there is a<br />
gap between the best practices available and the average performance of Brazilian mills,<br />
however due <strong>to</strong> recent developments in the <strong>ethanol</strong> business, with the consolidation of<br />
economic groups, capacity building programs, companies going public, new investments<br />
<strong>Sugarcane</strong> <strong>ethanol</strong> 115<br />
Molasses 3<br />
Raw sugar 3<br />
Refined<br />
sugar 3<br />
Feeds<strong>to</strong>ck 2 0.11 0.14 0.40 0.43 0.25 0.84 0.97 0.08 0.26<br />
Processing 0.17 0.14 0.25 0.21 0.10 0.10 0.10 0.14 0.52<br />
Total 0.28 0.28 0.65 0.63 0.34 0.94 1.07 0.22 0.78<br />
Source: USDA (2007).<br />
1 Excludes capital costs.<br />
2 Feeds<strong>to</strong>ck costs for US maize wet and dry milling are net feeds<strong>to</strong>ck costs; feeds<strong>to</strong>ck costs for US<br />
sugarcane and sugar beets are gross feeds<strong>to</strong>ck costs.<br />
3 Excludes transportation costs.<br />
4 Average of published estimates.<br />
<strong>Sugarcane</strong> 4<br />
Sugarbeets 4
Chapter 5<br />
in research and development the speed of this dissemination is increasing signi�cantly<br />
from previous decades.<br />
�is chapter addresses the following:<br />
•<br />
•<br />
•<br />
•<br />
Liter of <strong>ethanol</strong>/<strong>to</strong>n of cane<br />
80<br />
70<br />
60<br />
50<br />
40<br />
30<br />
75/76<br />
77/78<br />
79/80<br />
81/82<br />
83/84<br />
productivity gain = 2.8% CA GR<br />
85/86<br />
87/88<br />
Figure 2. Evolution of productivity of Brazilian <strong>ethanol</strong>. Source: Itaú Corre<strong>to</strong>ra (2007).<br />
89/90<br />
the Brazilian environmental legal frameworks;<br />
key environmental indica<strong>to</strong>rs: carbon, water, soil, agrochemicals, biodiversity, air and<br />
by-products;<br />
di�erent biofuels certi�cations regimes and compliance;<br />
the future steps and the role of innovation.<br />
116 <strong>Sugarcane</strong> <strong>ethanol</strong><br />
91/92<br />
93/94<br />
liter of <strong>ethanol</strong>/<strong>to</strong>n of cane (LHS)<br />
<strong>to</strong>n of cane/ha (LHS)<br />
Table 2. Future projections of <strong>ethanol</strong> production in Brazil.<br />
95/96<br />
97/98<br />
99/00<br />
01/02<br />
03/04<br />
80<br />
70<br />
60<br />
50<br />
40<br />
30<br />
Ton of cane/ha<br />
2007/08 2015/16 2020/21<br />
<strong>Sugarcane</strong> Production (M-<strong>to</strong>n) 493 829 1,038<br />
Area (M-ha) 7.8 11.4 13.9<br />
Sugar (M-<strong>to</strong>n) 30.8 41.3 45<br />
Internal 12.2 11.4 12.1<br />
Export 18.6 29.9 32.9<br />
Ethanol (B-liters) 22.5 46.9 65.3<br />
Internal 18.9 34.6 49.6<br />
Export 3.6 12.3 15.7<br />
Bioelectricity (GW average) 1.8 11.5 14.4<br />
Source: Unica (2008).
Environmental sustainability of sugarcane <strong>ethanol</strong> in Brazil<br />
2. The Brazilian environmental legal framework regulating <strong>ethanol</strong> production<br />
�e Brazilian environmental legal framework is complex and one of the most stringent<br />
and advanced in the World. As an agribusiness activity, the <strong>ethanol</strong>/sugar industry has<br />
several environmental restrictions that require appropriate legislation or general policies<br />
for its operation. Some of them are pioneers in the area which de�ne principles in order <strong>to</strong><br />
maintain the welfare of living beings and <strong>to</strong> provide resources for future generations: the<br />
�rst version of the Brazilian forest code dated from 1931, already addressed the need <strong>to</strong><br />
combine forest cover with quality of life and livelihoods.<br />
Brazil has wide range of federal and state laws regarding environmental protection (Table 3),<br />
aiming at combining the social economic development with environmental preservation,<br />
which the <strong>ethanol</strong> business need <strong>to</strong> comply with for its proper operation.<br />
They also involve frameworks such as the Environmental Impact Assessment and<br />
Environmental Licensing, among others (Figure 3), especially for the implementation of<br />
new project: i.e. new green �eld projects in Brazil are being stringently assessed (Nassar et<br />
al., this book) using these frameworks.<br />
Volunteer adherence <strong>to</strong> Environmental Pro<strong>to</strong>cols represents also a major breakthrough for<br />
the sugar business. For example �e ‘Pro<strong>to</strong>colo Agroambiental do Se<strong>to</strong>r Sucroalcooleiro’<br />
(Agriculture and Environmental Pro<strong>to</strong>col for the <strong>ethanol</strong>/sugar industry) signed by UNICA<br />
and the Government of the State of São Paulo in June 2007 deals with issues such as:<br />
conservation of soil and water resources, protection of forests, recovery of riparian corridors<br />
and watersheds, reduction of greenhouse emissions and improve the use of agrochemicals<br />
and fertilizers. But its main focus is anticipating the legal deadlines for ending sugarcane<br />
burning by 2014 from previous deadline of 2021. In February 2008, the State Secretariat<br />
of Environment reported that 141 industries of sugar and alcohol had already signed the<br />
Pro<strong>to</strong>col, receiving the ‘Certi�cado de Conformidade Agroambiental’ (Agricultural and<br />
Environmental Certi�cate of Compliance). �ese adherences correspond for more than<br />
90% of the <strong>to</strong>tal sugarcane production in São Paulo. A similar initiative is happening in the<br />
State of Minas Gerais with the ‘Pro<strong>to</strong>colo de Intenções de Eliminação da Queima da Cana<br />
no Se<strong>to</strong>r Sucroalcooleiro de Minas Gerais’ from August 2008.<br />
<strong>Sugarcane</strong> <strong>ethanol</strong> 117
Chapter 5<br />
Table 3. Summary of main environmental laws.<br />
Law Objective P.S.<br />
No. 4,771, September 15th, 1965 Forest Code Permanent preservation areas<br />
No. 997, May 31st, 1976 Environment Polution Control Environmental Permission<br />
Portaria do Ministério do Interior No. 323, It prohibits release of vinho<strong>to</strong> in the water<br />
November 29th, 1981<br />
No. 6,938, August 31st, 1981 Environment National Policy Mechanisms and instruments (environmental<br />
zoning, Environmental Impact Assessment)<br />
CONAMA deliberation No.001/7986 General Guidelines for the Evaluation of<br />
For ‘industrial complex and units and agro-<br />
Environmental Impact<br />
industrial’<br />
No. 6,171, July 04th, 1988 The use, conservation and preservation of<br />
agricultural soil<br />
No. 11,241, September 19th, 2002 Gradual elimination of burning the straw of Elimination of the use of fire as a unstraw method<br />
sugarcane<br />
and facilita<strong>to</strong>r of cutting the sugarcane<br />
No. 12183/05 Use of water charge<br />
No. 50,889, June 16th, 2006 Legal Reserve of landed property in the State of Obligation of reserving an area equivalent <strong>to</strong> 20%<br />
São Paulo<br />
of each rural property<br />
SMA deliberation 42, Oc<strong>to</strong>ber 14th, 2006 Environmental prior license <strong>to</strong> distilleries of alcohol, It defines criteria and procedures<br />
sugar plants and units of production of spirits<br />
Deliberation No. 382, December 26th, It sets the maximum emission of air pollutants <strong>to</strong> Annex III: Emission limits for air pollutants from<br />
2006<br />
sources.<br />
processes of heat generation from the external<br />
combustion of sugarcane’s mulch<br />
Agricultural and Environmental Pro<strong>to</strong>col of Prominence <strong>to</strong> anticipate the legal period <strong>to</strong> the Government of the State of São Paulo and UNICA<br />
sugar/<strong>ethanol</strong> industry<br />
end of the harvest of sugarcane with the previous<br />
use of fire in the areas cultivated by plants<br />
Elimination intentions of burning Removal of burnt by 2014 SIAMIG/SINDAÇÚCAR-MG and Government of the<br />
sugarcane in the <strong>ethanol</strong>/sugar sec<strong>to</strong>r of<br />
State of Minas Gerais<br />
Minas Gerais pro<strong>to</strong>col<br />
118 <strong>Sugarcane</strong> <strong>ethanol</strong><br />
Source: Brazilian and State laws.
Sugar and <strong>ethanol</strong> agribusiness undertaking<br />
Activity 5:<br />
support<br />
Activity 4:<br />
industrial<br />
process<br />
Activity 3:<br />
harvesting<br />
Activity 2:<br />
planting, crop<br />
treatments<br />
Activity 1:<br />
preliminary<br />
Environment<br />
Environmental sustainability of sugarcane <strong>ethanol</strong> in Brazil<br />
Anthropic:<br />
jobs, economy, sociocultural<br />
aspects<br />
Biological:<br />
flora,<br />
fauna<br />
Physical:<br />
atmosphere,<br />
land, water<br />
<strong>Sugarcane</strong> <strong>ethanol</strong> 119<br />
Changes<br />
Impacts<br />
Mitigating measures<br />
Preventive Corrective Valorization Compensa<strong>to</strong>ry Moni<strong>to</strong>ring<br />
Figure 3. Environmental analysis structure for EIA/RIMA: sugarcane agribusiness. Source: Elia Ne<strong>to</strong> (2008).
Chapter 5<br />
3. Environmental indica<strong>to</strong>rs<br />
�e environmental sustainability is evaluated through indica<strong>to</strong>rs such as carbon, water, soil,<br />
agrochemicals, biodiversity and by-products.<br />
3.1. Greenhouse gases (GHG) balance<br />
One of the goals of using biofuels is <strong>to</strong> contribute with net reduction of GHG emissions<br />
and thus not a�ecting carbon s<strong>to</strong>ck negatively in di�erent sub-systems of production,<br />
below and above ground biomass (roots, branches and leaves) and in the soil (carbon �xed<br />
in clay, silt, sand and organic matter). Figure 4 shows that <strong>ethanol</strong> from sugarcane reduces<br />
86% of the GHG emissions when compared <strong>to</strong> gasoline. It has also a leading performance<br />
when compared <strong>to</strong> other biofuels from other feeds<strong>to</strong>cks. In addition the energy e�ciency<br />
di�erence is even greater: 9.3 against 1.4 <strong>to</strong> 2.0 of other biomasses (Figure 5).<br />
Sugarbeet, EU<br />
<strong>Sugarcane</strong>, Brazil<br />
Wheat, EU<br />
Corn, US<br />
Rapeseed, EU<br />
Second generation<br />
0 20 40 60 80 100<br />
Figure 4. GHG emissions avoided with <strong>ethanol</strong> or biodiesel replacing gasoline. Source: International<br />
Energy Agency (IEA/OECD, 2006).<br />
9.3<br />
sugercane<br />
2.0 2.0<br />
wheat<br />
sugarbeets<br />
Figure 5. Energy output per unit of fossil fuel consumption in the production process. Source: World<br />
Watch Institute (2006) and Macedo et al. (2008).<br />
120 <strong>Sugarcane</strong> <strong>ethanol</strong><br />
1.4<br />
corn
3.1.1. Carbon s<strong>to</strong>cks<br />
Environmental sustainability of sugarcane <strong>ethanol</strong> in Brazil<br />
One of the main e�ects caused by land use <strong>change</strong>s is the variation in the amount of carbon<br />
s<strong>to</strong>cks under di�erent subsystem, namely in the soil and in the above ground biomass in the<br />
area. When analyzing the environmental e�ects caused by di�erent land use regimes, the<br />
balance of carbon should be taken in<strong>to</strong> account. It is necessary <strong>to</strong> know how much carbon<br />
would be �xed or released in<strong>to</strong> the air under di�erent land use regimes compared with the<br />
previous baseline of use.<br />
One limiting fac<strong>to</strong>r <strong>to</strong> perform an in depth analysis of these balances is the lack of long<br />
term moni<strong>to</strong>ring plots assessing precisely these dynamics through time. However the s<strong>to</strong>ck<br />
and �ows of carbon for major crops like soybean, maize, cot<strong>to</strong>n and sugarcane have been<br />
extensively studied, but in general using di�erent methodologies. �ere are also other<br />
fac<strong>to</strong>rs that a�ect the results: crop productivity and management, soil physical and chemical<br />
properties, <strong>climate</strong> and land use his<strong>to</strong>ry for example.<br />
In large countries such as Brazil, there are many di�erent soils and climatic conditions. �e<br />
di�erent characteristics of each region will in�uence the potential for carbon s<strong>to</strong>rage. A<br />
clay soil, for example, has the ability <strong>to</strong> s<strong>to</strong>re more organic matter and consequently, more<br />
carbon than a sandy soil, because of their physical properties. In hot and humid <strong>climate</strong>s,<br />
the rate of deposition and decomposition of organic matter is higher than in dry and cold<br />
<strong>climate</strong>s, facilitating the deposition of carbon in the soil.<br />
�e spatial distribution of crops in Brazil is edaphic-climatic (soil characteristics and <strong>climate</strong><br />
interactions) dependent for their pro�tability. �ese interactions in�uence carbon content<br />
in the soil and in the biomass, which are also a�ected by soil management practices, such<br />
as minimum tillage, which can signi�cantly for example increase soil carbon content. �e<br />
land use his<strong>to</strong>ry is also relevant when assessing and explaining current levels of carbon,<br />
because when land use <strong>change</strong>s do occur; soil carbon s<strong>to</strong>cks take several years <strong>to</strong> achieve a<br />
new carbon balance. If carbon is measured in a newly cultivated system, the carbon present<br />
in the soil is actually re�ecting the carbon content from the formerly existing vegetation/<br />
his<strong>to</strong>ry and not a consequence of current land use. Table 4 presents the carbon s<strong>to</strong>cks in<br />
soil for some selected Brazilian crops and in the native vegetation.<br />
For carbon s<strong>to</strong>red in the biomass, crop productivity is of great importance as indica<strong>to</strong>r<br />
carbon s<strong>to</strong>red in the above ground biomass per unit of area. �e larger the quantity of<br />
biomass above ground, the greater the s<strong>to</strong>cks of carbon in biomass (Table 5), which is a<br />
measure much easier <strong>to</strong> obtain and with a larger dataset from multiple management and<br />
production systems in Brazil.<br />
According <strong>to</strong> the National Supply Company (CONAB - Ministry of Agriculture and<br />
Lives<strong>to</strong>ck, 2008) sugarcane area expanded 653,722 ha in the 2007/2008 period, occupying<br />
<strong>Sugarcane</strong> <strong>ethanol</strong> 121
Chapter 5<br />
Table 4. Carbon s<strong>to</strong>ck in soil for selected crops in native vegetation.<br />
Biomass Carbon s<strong>to</strong>cks in soil (Mg/ha)<br />
Campo Limpo – grassland savannah (a) 72<br />
Sub-tropical forest (b) 72<br />
Tropical forest (c) 71<br />
Natural pasture (d) 56<br />
Soybean (e) 53<br />
Cerradão – woody savannah (a) 53<br />
Managed pasture (f) 52<br />
Cerrado – typical savannah (a) 46<br />
<strong>Sugarcane</strong> without burn (g) 44<br />
Degraded pasture (h) 41<br />
Maize (h) 40<br />
Cot<strong>to</strong>n (i) 38<br />
<strong>Sugarcane</strong> burned (g) 35<br />
Sources: (a) Lardy et al. (2001); (b) Cerri et al. (1986); (c) Trumbore et al. (1993); (d) Jantalia et al.<br />
(2005); (e) Campos (2006); (f) Rangel and Silva et al. (2007); (g) Estimated from Galdos (2007); (h)<br />
d’Andréa et al. (2004); (i) Neves et al. (2005).<br />
Table 5. Carbon s<strong>to</strong>cks in the above biomass of selected crops and native vegetation.<br />
Biomass Carbon s<strong>to</strong>cks in biomass (Mg/ha)<br />
Tropical rain forest (a) 200.0<br />
Cerradão – woody savannah (b) 33.5<br />
Cerrado – typical savannah (b) 25.5<br />
<strong>Sugarcane</strong> without burn (c) 17.5<br />
<strong>Sugarcane</strong> burned (c) 17.0<br />
Campo Limpo – grasland savannah (b) 8.4<br />
Managed pasture (d) 6.5<br />
Maize (e) 3.9<br />
Cot<strong>to</strong>n (f) 2.2<br />
Soybean (g) 1.8<br />
Degraded pasture (d) 1.3<br />
Sources: (a) INPE; (b) Ottmar et al. (2001); (c) VPB Estimative; (d) Estimated from Szakács et al.<br />
(2003); (e) Estimated from Ti<strong>to</strong>n et al. (2003); (f) Adapted from Fornasieri and Domingos et al.<br />
(1978); (g) Adapted from Campos (2006).<br />
122 <strong>Sugarcane</strong> <strong>ethanol</strong>
Environmental sustainability of sugarcane <strong>ethanol</strong> in Brazil<br />
areas previously covered with pasture (67%), soybean (16.9%), maize (4.9%) and 2.4% of<br />
these new areas expanded in<strong>to</strong> native vegetation of cerrado (savannah-like vegetation). From<br />
these numbers, it is possible <strong>to</strong> estimate the overall carbon balance resulting from land use<br />
<strong>change</strong>s due <strong>to</strong> sugarcane expansion for this period (Table 6). Figure 6 shows the positive<br />
carbon balance resulting from 91.2% in the area of expansion of sugarcane, corresponding<br />
<strong>to</strong> the areas of pasture, maize, soybeans and native vegetation as replaced by not burned<br />
sugarcane as 100% of these new green �eld are using mechanized harvesting practices.<br />
It was considered for this assessment that the <strong>to</strong>tality of pastures replaced was of planted<br />
pastures and the native vegetation replaced as areas of Grassland Savannah (Campo Limpo).<br />
However it is important <strong>to</strong> mention that there are other statistics of sugarcane expansion<br />
(See Nassar et al. in this volume for details), which could a�ect this carbon balance.<br />
Table 6. Carbon balance under different land uses replaced by sugarcane.<br />
Biomass Total carbon s<strong>to</strong>cks<br />
(Mg/ha)<br />
Cot<strong>to</strong>n (d) 40.1 21.8<br />
Degraded pasture (b) 42.0 19.8<br />
Maize (h) 44.1 17.7<br />
<strong>Sugarcane</strong> burned (g) 52.1 9.7<br />
Soybean (e) 54.9 6.9<br />
Managed pasture (f) 58.5 3.3<br />
Cerrado – typical savannah (a) 71.5 -9.7<br />
Campo Limpo – grassland savannah (a) 80.4 -18.6<br />
Cerrado – woody savannah (a) 86.5 -24.7<br />
Tropical forest (c) 271.0 -209.2<br />
Total carbon s<strong>to</strong>cks in sugarcane net burned = 61.8 Mg/ha<br />
Carbon balance<br />
due <strong>to</strong> sugarcane<br />
replacement (Mg/ha)<br />
Sources: (a) Lardy et al. (2001)/Ottmar et al. (2001); (b) d`Andréa et al. (2004)/Estimated from<br />
Szakács et al. (2003); (c) Trumbore et al. (1993)/INPE; (d) Neves et al. (2005)/Adapted from<br />
Fornasieri and Domingos et al. (1978); (e) Campos (2006)/Adapted from Campos (2006); (f) Rangel<br />
and Silva et al. (2007)/Estimated from Szakács et al. (2003); (g) Estimated from Galdos (2007)/<br />
VPB Estimative; (h) d`Andréa et al. (2004)/Estimated from Ti<strong>to</strong>n et al. (2003).<br />
<strong>Sugarcane</strong> <strong>ethanol</strong> 123
Chapter 5<br />
3.2. Water<br />
Total carbon in the<br />
biomass (<strong>to</strong>n C/ha)<br />
Pasture<br />
(~59)<br />
Soya<br />
(~55)<br />
Corn<br />
(~44)<br />
Native vegetation<br />
(~80)<br />
Replaced areas<br />
(ha)<br />
423,120 +1,400,527<br />
110,447<br />
32,211<br />
15,546<br />
Final balance<br />
Carbon balance *<br />
(<strong>to</strong>n C)<br />
+763,169<br />
+571,423<br />
-384,453<br />
+ 2,350,687<br />
* Carbon balance = <strong>to</strong>tal C in biomass - <strong>to</strong>tal C in sugar cane × replaced area (ha)<br />
Figure 6. Carbon balance of sugarcane expansion in São Paulo State, 2007. Source: VPB analysis.<br />
Despite having the greatest water availability in the world, with 14 percent of the surface<br />
waters and the equivalent of annual �ow in underground aquifers, the use of crop irrigation<br />
in Brazil is minimum (~3.3 Mha, compared <strong>to</strong> 227 Mha in the world). Practically all of the<br />
sugarcane produced in São Paulo State is grown without irrigation (Donzelli, 2005).<br />
�e levels of water withdraw and release for industrial use have substantially decreased<br />
over the past few years, from around 5 m 3 /<strong>to</strong>n sugarcane collected in 1990 and 1997 <strong>to</strong><br />
1.83 m 3 /<strong>to</strong>n sugarcane in 2004 (sampling in São Paulo). If we take 1.83 m 3 of water/<strong>to</strong>n of<br />
sugarcane, and exclude the mills having the highest speci�c consumption, the mean rate<br />
for the mills that account for 92% of the <strong>to</strong>tal milling is 1.23 m 3 of water/<strong>to</strong>n of sugarcane.<br />
In addition the recycling rate has been increasing since 1990 (Figure 7). Mills with better<br />
water management practice replace only 500 liters in the industrial system, with a recycling<br />
rate of 96,67%.<br />
Recent developments might lead <strong>to</strong> convert sugarcane mills from water consumers <strong>to</strong> water<br />
exporters industry. Dedini the largest Brazilian manufacturer of sugar mills and equipment<br />
suppliers has developed a new technology that allows the process of transforming sugarcane<br />
in <strong>ethanol</strong> <strong>to</strong> be much more e�cient, and in the end of this process, industrial mills will<br />
be able <strong>to</strong> sell about 300 liters of water per <strong>to</strong>n of sugarcane (Figure 8). �is would be<br />
124 <strong>Sugarcane</strong> <strong>ethanol</strong>
Figure 7. Evolution of water recycling. Source: Elia Ne<strong>to</strong> (2008).<br />
5.7<br />
5.0<br />
1990<br />
62.7%<br />
1990<br />
Environmental sustainability of sugarcane <strong>ethanol</strong> in Brazil<br />
2.5<br />
0.7 0.7<br />
1997<br />
66.2%<br />
1997<br />
0.4<br />
Best practice<br />
87.8%<br />
Figure 8. Evolution of water consumption in industrial <strong>ethanol</strong> production from sugarcane (m 3 /<strong>to</strong>n of<br />
sugarcane). Source: Dedini (2008).<br />
possible because water represents approximately 70% of sugarcane’s composition. �is new<br />
technology will be available next year (2009). Current estimates from maize <strong>ethanol</strong> mills<br />
on water consumption are of 4 liters of water per liter of <strong>ethanol</strong> produced (Commission<br />
on Water Implications of Biofuels Productions in United States, 2008).<br />
<strong>Sugarcane</strong> <strong>ethanol</strong> 125<br />
2005<br />
0.3<br />
Export
Chapter 5<br />
3.3. Soil and fertilizers 8<br />
�e sustainability of the culture improves with the protection against soil erosion,<br />
compacting and moisture losses and correct fertilization. In Brazil, there are soils that have<br />
been producing sugarcane for more than 200 years, with ever-increasing yields and soil<br />
carbon content. Soil erosion in sugarcane �elds is lower than in soybean and maize (Macedo<br />
et al., 2005) and other crops (Table 7). It is expected also that the growing harvesting of cane<br />
without burning will further improve this condition, with the use of the remaining trash<br />
in the soil. Recent sugarcane expansion in Brazil has happened mostly in low fertility soils<br />
(pasture lands), and thus improving their organic matter and nutrient levels from previous<br />
land use patterns. <strong>Sugarcane</strong> uses lower inputs of fertilizers: ten, six and four times lower<br />
than maize respectively for nitrogen, phosphorous and potassium (Table 8). An important<br />
characteristic of the Brazilian sugarcane <strong>ethanol</strong> is the full recycling of industrial waste <strong>to</strong><br />
the �eld.<br />
Vinasse, a by-product of the distillation process, rich in nutrients (mainly potassium) and<br />
organic matters is a good example, which is being used extensively as a source of fertiirrigation<br />
(nutrients associated with water). For each liter of alcohol, 10 <strong>to</strong> 15 liters of vinasse<br />
8 �is text was adapted from Donzeli (2005) and Souza (2005).<br />
Table 7. Losses of soil and water for selected crops.<br />
Annual crop Losses<br />
Soil (t/ha-year) Water (% rain)<br />
Cas<strong>to</strong>r 41.5 12.0<br />
Beans 38.1 11.2<br />
Manioc 33.9 11.4<br />
Peanut 26.7 9.2<br />
Rice 25.1 11.2<br />
Cot<strong>to</strong>n 24.8 9.7<br />
Soybean 20.1 6.9<br />
English pota<strong>to</strong> 18.4 6.6<br />
<strong>Sugarcane</strong> 12.4 4.2<br />
Maize 12.0 5.2<br />
Maize + beans 10.1 4.6<br />
Sweet pota<strong>to</strong> 6.6 4.2<br />
Source: Ber<strong>to</strong>ni et al. (1998).<br />
126 <strong>Sugarcane</strong> <strong>ethanol</strong>
Environmental sustainability of sugarcane <strong>ethanol</strong> in Brazil<br />
Table 8. Agrochemical inputs consumption (per ha) and per <strong>ethanol</strong> production (m 3 ).<br />
<strong>Sugarcane</strong> Maize<br />
Cons./ha Cons./m 3 Cons./ha Cons./m 3<br />
Ethanol production (m 3 ) 8.1 - 4.2 -<br />
Quantity of N (kg) 25.0 3.1 140.0 33.7<br />
Quantity of P (kg) 37.0 4.6 100.0 24.1<br />
Quantity of K (kg) 60.0 7.4 110.0 26.5<br />
Liming materials (kg) 600.0 74.5 500.0 120.5<br />
Herbicide (liters) 2.6 0.3 13.0 3.1<br />
Drying hormone (liters) 0.4 0.0 - -<br />
Insecticides (liters) 0.1 0.0 2.2 0.5<br />
Formicide (kg) - - 0.5 0.1<br />
Nematicide (liters) a 1.2 0.1 - -<br />
Total 726.2 90.2 865.7 208.5<br />
Sources: Agrianual (2008); Fancelli and Dourado Ne<strong>to</strong> (2006).<br />
a Product used <strong>to</strong> control microscopic multicellular worms called nema<strong>to</strong>des.<br />
are produced. Generally the vinasse has a high organic matter and potassium content,<br />
and relatively poor nitrogen, calcium, phosphorus and magnesium contents (Ferreira and<br />
Monteiro 1987). Advantages of using vinasse include increased pH and cation ex<strong>change</strong><br />
capacity, improved soil structure, increased water retention, and development of the soil’s<br />
micro �ora and micro fauna. Many studies have been conducted involving speci�c aspects<br />
pertaining <strong>to</strong> leaching and underground water contamination possibilities at variable<br />
vinasse doses over periods of up <strong>to</strong> 15 years. �e results obtained from tests so far indicate<br />
that there are no damaging impacts on the soil at doses lower than 300 m 3 /ha, while higher<br />
doses may damage the sugarcane or, in speci�c cases (sandy or shallow soil), contaminate<br />
underground water (Souza, 2005).<br />
Investments in infrastructure have enabled the use water from the industrial process and<br />
the ashes from boilers. Filter cake (a by product of the yeast fermentation process) recycling<br />
processes were also developed, thereby increasing the supply of nutrients <strong>to</strong> the �eld.<br />
<strong>Sugarcane</strong> <strong>ethanol</strong> 127
Chapter 5<br />
3.4. Management of diseases, insects and weeds 9<br />
Strategies for disease control involve the development of disease resistant varieties within<br />
large genetic improvement programs. �is approach kept the major disease outbreak<br />
managed, i.e. the SCMV (sugarcane mosaic virus, 1920), the sugarcane smut, Ustilago<br />
scitaminea, and rust Puccinia melanocephala (1980’s), and the SCYLV (sugarcane yellow<br />
leaf virus, 1990’s) by replacing susceptible varieties.<br />
�e soil pest moni<strong>to</strong>ring method in reform areas enabled a 70% reduction of chemical<br />
control (data provided by CTC), thereby reducing costs and risks <strong>to</strong> opera<strong>to</strong>rs and the<br />
environment.<br />
<strong>Sugarcane</strong>, as semi-permanent culture of annual cycle and vegetative propagation, forms a<br />
crop planted with a certain variety that is reformed only a�er 4 <strong>to</strong> 5 years of commercial use.<br />
�ese characteristics determine that the only economically feasible disease control option<br />
is <strong>to</strong> use varieties genetically resistant <strong>to</strong> the main crop diseases.<br />
Insecticide consumption in sugarcane crops is lower than in citrus, maize, co�ee and soybean<br />
crops; the use of insecticides is also low, and of fungicides is virtually null (Agrianual,<br />
2008). Among the main sugarcane pests, the sugarcane beetle, Migdolus fryanus (the most<br />
important pest) and the cigarrinha, Mahanarva �mbriolata, are biologically controlled. �e<br />
sugarcane beetle is the subject of the country’s largest biological control program. Ants,<br />
beetles and termites are chemically controlled. It has been possible <strong>to</strong> substantially reduce<br />
the use of pesticides through selective application.<br />
�e control or management of weeds encompasses speci�c methods or combinations of<br />
mechanical, cultural, chemical and biological methods, making up an extremely dynamic<br />
process that is o�en reviewed. In Brazil, sugarcane uses more herbicides than co�ee and maize<br />
crops, less herbicides than citrus and the same amount as soybean (Agrianual, 2008).<br />
On these issues mentioned above related <strong>to</strong> use of agrochemicals, soil management and<br />
water uses, UNICA’s (Brazilian <strong>Sugarcane</strong> Growers Association) associated mills are<br />
developing a set of goals, aiming at improving agricultural sustainability in the next few<br />
years (Table 9).<br />
9 �is text was adapted from Arrigoni and Almeida (2005) and Ricci Junior (2005).<br />
128 <strong>Sugarcane</strong> <strong>ethanol</strong>
Table 9. <strong>Sugarcane</strong> agricultural sustainability.<br />
<strong>Sugarcane</strong><br />
3.5. Conservation of biodiversity<br />
Environmental sustainability of sugarcane <strong>ethanol</strong> in Brazil<br />
Less agrochemicals Low soil loss Minimal water use<br />
Low use of pesticides.<br />
No use of fungicides<br />
Biological control <strong>to</strong> mitigate<br />
pests.<br />
Advanced genetic enhancement<br />
programs that help idntify the<br />
most resistant varieties of<br />
sugarcane.<br />
Use of vinasse and filter cake as<br />
organic fertilizers.<br />
Source: Unica (2008).<br />
Brazilian sugarcane fields have<br />
relatively low levels of soil loss,<br />
thanks <strong>to</strong> the semi-perennial<br />
nature of the sugarcane that is<br />
only replanted every 6 years.<br />
The trend will be for current<br />
losses, <strong>to</strong> decrease<br />
significantly in coming years<br />
through the use of sugarcane<br />
straw, some of which is left on<br />
the fields as organic matters<br />
after mechanical harvesting<br />
Brazilian sugarcane fields<br />
require practically no irrigation<br />
because rainfall is abundant<br />
and reliable, particularly in the<br />
main South Central production<br />
region.<br />
Ferti-irrigation: applying vinasse<br />
(a water-based residue from<br />
sugar and <strong>ethanol</strong> production).<br />
Water use during industrial<br />
processing has decreased<br />
significantly over the years:<br />
from 5 m 3 /t <strong>to</strong> 1 m 3 /t.<br />
Brazil is a biodiversity hotspot and contains more than 40% of all tropical rain forest of the<br />
World. Brazilian biodiversity conservation priorities were set mainly between 1995 and<br />
2000, with the contribution of hundreds of experts; protected areas were established for<br />
the six major biomes in the National Conservation Unit System.<br />
Steps for the implementation of the Convention on Biological Diversity includes the<br />
preparation of the biodiversity inven<strong>to</strong>ry and moni<strong>to</strong>ring of important biodiversity<br />
resources, the creation of reserves, the creation of seed, germoplasm and zoological banks,<br />
and the conduct of Environmental Impact Assessments covering activities that could a�ect<br />
the biodiversity.<br />
�e percentage of forest cover represents a good indica<strong>to</strong>r of conservation of biodiversity<br />
in agricultural landscapes. In São Paulo State for example the remaining forest covered is<br />
11%, of which 8% being part of the original Atlantic Forest. Table 10 demonstrates that<br />
while the sugarcane area increased from 7 <strong>to</strong> 19% of the State terri<strong>to</strong>ry, native forests also<br />
increased from 5 <strong>to</strong> 11%, showing that it is possible <strong>to</strong> recover biodiversity in intense<br />
agricultural systems.<br />
<strong>Sugarcane</strong> <strong>ethanol</strong> 129
Chapter 5<br />
Table 10. <strong>Sugarcane</strong> and vegetation area in São Paulo State.<br />
Year <strong>Sugarcane</strong> Vegetation % SP State<br />
New lands (Kha)<br />
Land in use (Kha)<br />
Total area (Kha)<br />
Production (K<strong>to</strong>n)<br />
Productivity (<strong>to</strong>n/ha)<br />
Woody-Cerradao<br />
(Kha)<br />
Shrubby-Cerrado/<br />
savana (Kha)<br />
1983 345 1,421 1,765 107,987 76.0 196 489 1,139 7% 5%<br />
1984 317 1,526 1,842 116,666 76.5 167 427 1,453 7% 6%<br />
1985 326 1,626 1,952 121,335 74.6 221 438 1,545 8% 6%<br />
1986 350 1,704 2,054 122,986 72.2 205 378 1,795 8% 7%<br />
1987 311 1,753 2,064 132,322 75.5 211 348 1,870 8% 8%<br />
1988 325 1,771 2,097 134,108 75.7 192 316 1,624 8% 7%<br />
1989 322 1,757 2,078 130,795 74.5 198 325 1,487 8% 6%<br />
1990 276 1,836 2,112 139,400 75.9 175 290 1,097 9% 4%<br />
1991 301 1,864 2,165 144,581 77.6 198 301 1,601 9% 6%<br />
1992 372 1,940 2,311 150,878 77.8 204 284 2,109 9% 8%<br />
1993 371 1,989 2,360 156,623 78.7 238 259 2,120 10% 9%<br />
1994 421 2,180 2,601 168,362 77.2 201 238 2,453 10% 10%<br />
1995 449 2,260 2,709 175,073 77.5 189 220 2,434 11% 10%<br />
1996 428 2,388 2,816 187,040 78.3 217 232 2,462 11% 10%<br />
1997 422 2,451 2,872 194,801 79.5 215 244 2,478 12% 10%<br />
1998 342 2,544 2,887 199,764 78.5 217 241 2,482 12% 10%<br />
1999 281 2,475 2,756 193,374 78.1 218 244 2,468 11% 10%<br />
2000 338 2,491 2,829 189,391 76.0 221 257 2,629 11% 11%<br />
2001 440 2,569 3,009 201,683 78.5 223 262 2,622 12% 11%<br />
2002 457 2,661 3,118 212,707 79.9 224 263 2,725 13% 11%<br />
2003 495 2,818 3,313 227,981 80.9 225 264 2,720 13% 11%<br />
2004 463 2,951 3,414 241,659 81.9 211 262 2,732 14% 11%<br />
2005 553 3,121 3,673 254,810 81,7 217 254 2,648 15% 11%<br />
2006 822 3,437 4,258 284,917 82,9 228 271 2,695 17% 11%<br />
2007 935 3,897 4,832 327,684 84,1 233 277 2,716 19% 11%<br />
Source: IEA/CATI-SAAESP (Annual statistics from 1983-2007).<br />
130 <strong>Sugarcane</strong> <strong>ethanol</strong><br />
Native forests (Kha)<br />
<strong>Sugarcane</strong> area<br />
Native forests area
3.6. Air quality<br />
Environmental sustainability of sugarcane <strong>ethanol</strong> in Brazil<br />
Burning sugarcane for harvesting is one of the most criticized issue of sugarcane production<br />
system, causing local air pollution and a�ecting air quality, despite of the bene�ts of using<br />
100% <strong>ethanol</strong> running engines instead of gasoline (Figure 9), which decreases air pollution<br />
from 14 <strong>to</strong> 49%.<br />
In order <strong>to</strong> eliminate gradually sugarcane burning, several attempts are being made. �e<br />
São Paulo Green Pro<strong>to</strong>col is being considered the most important one, setting an example<br />
for other regions and states in Brazil. Signed between the São Paulo state government (State<br />
Environment Secretariat) and the <strong>Sugarcane</strong> Growers Association (UNICA) in June 04,<br />
2007, the Green Pro<strong>to</strong>col aimed at:<br />
• �e anticipation of the legal deadline for the elimination of the practice of sugarcane<br />
straw burning <strong>to</strong> 2014.<br />
• �e protection of river side woods and recovering of those near water streams (permanent<br />
protected areas - APPs).<br />
• �e implementation of technical plans for conservation of soil and water resources.<br />
• �e adoption of measures <strong>to</strong> reduce air pollution.<br />
• �e use of machines instead of �re <strong>to</strong> harvest new sugarcane �elds.<br />
Voluntarily 141 of the <strong>to</strong>tal of 170 sugar mills from the state of São Paulo signed this<br />
Pro<strong>to</strong>col, and recently 13 thousand sugarcane independent suppliers, members of the<br />
Organization of <strong>Sugarcane</strong> Farmers of the Center-South Region (Orplana), signed also this<br />
pro<strong>to</strong>col. �erefore the entire production chain of sugar and <strong>ethanol</strong> of São Paulo participates<br />
100<br />
85<br />
CO<br />
51<br />
HC NO x<br />
Gasoline 0% E 22% Ethanol 100%<br />
Figure 9. Air pollution by different blends of <strong>ethanol</strong>. Source: ANFAVEA (2006).<br />
100<br />
80<br />
<strong>Sugarcane</strong> <strong>ethanol</strong> 131<br />
53<br />
100<br />
104<br />
86
Chapter 5<br />
in the implementation of the Pro<strong>to</strong>col. Maintaining the 2007 levels of mechanization,<br />
when 550 new harvest machines have begun <strong>to</strong> operate, it will be possible <strong>to</strong> complete the<br />
mechanization even prior <strong>to</strong> the deadline (2014) set by the Pro<strong>to</strong>col.<br />
4. Initiatives <strong>to</strong>wards <strong>ethanol</strong> certification and compliance<br />
�e discussion on sustainable production of biofuels has ful�lled the scienti�c literature<br />
lately (see for example Hill et al., 2006; Van Dam et al., 2006; Goldemberg et al., 2006; Smeets<br />
et al., 2008; Macedo et al., 2008). At the same time several initiatives are being developed in<br />
Europe and in the United States related <strong>to</strong> certi�cation, traceability and de�nition of criteria<br />
and indica<strong>to</strong>rs for sustainable production of biofuels, mainly due <strong>to</strong> di�erent supporting<br />
policies. For example in May 2003, the European Commission launched its Biofuels Directive<br />
2003/30/EC, establishing legal basis for blending biofuels and fossil fuels. �e EU member<br />
countries are urged <strong>to</strong> replace 2% of fossil fuels with biofuels by 2005 and 5.75% by 2010.<br />
From 2003 <strong>to</strong> 2005 the group of 25 countries members enhanced biofuel’s market share of<br />
0.6% <strong>to</strong> 1.4%. However, they have not yet achieved the �rst target yet. �e EU Directive<br />
2003/96/EC had also established tax incentives <strong>to</strong> encourage renewable energy use.<br />
�e government of Germany (GE), Netherlands (NL) and United Kingdom (UK) are<br />
supporting di�erent assessment studies, while another one initiative is taking place from<br />
Switzerland, the Roundtable on Sustainable Biofuels (RTB), a multiple stakeholder initiative,<br />
hosted by the Ecole Polytechnique Federale de Lausanne. �e main environmental issues<br />
addressed by these di�erent initiatives are related <strong>to</strong> greenhouse gas reduction compared<br />
with fossil fuels; competition with other land uses, especially food competition; impacts on<br />
the biodiversity and on the environment (Table 11). Considering carbon and greenhouse<br />
gases balance current agricultural and industrial practices sugarcane <strong>ethanol</strong> from Brazil<br />
does comply with the targets of greenhouse reduction higher than 79% from existing brown<br />
�elds, and from new green �elds, when not replacing large areas of native vegetation. On<br />
food competition, there is no direct evidence that sugarcane is replacing the basic Brazilian<br />
staple foods (Nassar et al., this book). On biodiversity conservation, data from São Paulo<br />
State show that sugarcane expansion did not reduce forest cover, but on the contrary (IEA/<br />
CATI – SAAESP). On the use of water, fertilizers and agrochemicals, sugarcane <strong>ethanol</strong><br />
does perform well above any other current biofuel in the market (in this chapter).<br />
In the USA, the Environmental Protection Agency (EPA) under the Energy Independence<br />
and Security Act of 2007 is responsible for revising and implementing regulations on the<br />
use of biofuels blended with gasoline. �e Renewable Fuel Standard program will increase<br />
the volume of renewable fuel required <strong>to</strong> be blended in<strong>to</strong> gasoline from 9 billion gallons in<br />
2008 <strong>to</strong> 36 billion gallons by 2022. At the same time, EPA is conducting several studies on<br />
the direct and indirect impacts of the expansion of biofuels production and their carbon<br />
footprint and potential reduction of greenhouse gases.<br />
132 <strong>Sugarcane</strong> <strong>ethanol</strong>
Environmental sustainability of sugarcane <strong>ethanol</strong> in Brazil<br />
Table 11. Main issues related <strong>to</strong> sustainable production of biofuels being considered under different<br />
certification regimes.<br />
Criterion NL UK GE RTB EU<br />
1. Greenhouse gas balance ✓ ✓ ✓ ✓ ✓<br />
a1) Net emission reduction compared with a fossil fuel<br />
reference is at least 50%. Variation in policy instruments<br />
could benefit the best performances.<br />
✓<br />
a2) Life cycle GHG balance reduction of 67% compared with<br />
fossil fuels<br />
✓<br />
a3) Processing of energy crops GHG reduction of 67%<br />
compared with fossil fuels<br />
✓<br />
a4) GHG emissions savings from the use of biofuels at least<br />
35% compared with fossil fuels<br />
✓ ✓<br />
a5) GHG emissions will be reduced when compared <strong>to</strong> fossil<br />
fuels<br />
✓<br />
b) Soil carbon and carbon sinks ✓ ✓ ✓<br />
c) Emissions of N2O from biofuels ✓<br />
2. Competition with other applications/ land use ✓ ✓ ✓ ✓ ✓<br />
a) Availability of biomass for food, local energy supply,<br />
building materials or medicines should not decline<br />
✓ ✓ ✓ ✓ ✓<br />
b) Use of less productive land for biofuels ✓<br />
c) Increasing maximum use of crops for both food and fuel ✓<br />
d) Avoiding negative impacts from bioenergy-driven <strong>change</strong>s<br />
in land use<br />
✓ ✓<br />
3. Biodiversity ✓ ✓ ✓ ✓ ✓<br />
a) No deterioration of protected area’s or high quality ecosystems.<br />
✓ ✓ ✓ ✓ ✓<br />
b) Insight in the active protection of the local ecosystem. ✓<br />
c) Alteration of local habitats ✓<br />
d) Effect on local species ✓ ✓<br />
e) Pest and disease resistance ✓<br />
f) Intellectual property and usage rights ✓ ✓<br />
g) Social circumstances of the local residents ✓ ✓<br />
h) Integrity ✓<br />
i) Standard on income distribution and poverty-reduction ✓<br />
j) Avoiding human health impacts ✓<br />
4. Environment<br />
a) No negative effects on the local environment<br />
✓ ✓ ✓ ✓<br />
b) Waste management ✓ ✓<br />
c) Use of agro-chemicals, including artificial manure ✓ ✓ ✓<br />
<strong>Sugarcane</strong> <strong>ethanol</strong> 133
Chapter 5<br />
Table 11. Continued.<br />
Criterion NL UK GE RTB EU<br />
4. Environment (continued) ✓ ✓ ✓ ✓<br />
d) Preventing erosion and deterioration of the soil <strong>to</strong> occur<br />
and maintaining the fertility of the soil<br />
✓ ✓ ✓ ✓<br />
e) Active improvement of quality and quantity of surface and ✓<br />
groundwater<br />
✓ ✓<br />
f) Water use efficiency of crop and production chain ✓ ✓<br />
g) Emissions <strong>to</strong> the air ✓ ✓<br />
h) Use of genetically modified organisms ✓ ✓<br />
Source: adapted from Van Dam et al. (2006).<br />
NL = the Netherlands; UK = United Kingdom; GE = Germany; RTB = Round table on sustainable<br />
biofuels; EU = European Union.<br />
While the above concerns are well-justi�ed, some criticism of biofuels and their impacts are<br />
motivated by protectionism and interest in agricultural subsidies and agribusiness production<br />
chains in several developing countries, especially from EU countries. Certi�cation schemes<br />
suggested may become non-tari� barriers, rather than environmentally and socially sound<br />
schemes.<br />
Scienti�c and technological assessments comparing di�erent kinds of biofuels are needed <strong>to</strong><br />
reduce the play of such interests and <strong>to</strong> establish the strengths of best potential of biofuels<br />
along with their dangers and limitations.<br />
�e OECD’s latest report on biofuels illustrates how fears can be perpetuated without proper<br />
scienti�c basis. Suggestively titled: (‘Biofuels: is the cure worse than the disease?’), the report<br />
stated: ‘Even without taking in<strong>to</strong> account carbon emissions through land-use <strong>change</strong>, among<br />
current technologies only sugarcane-<strong>to</strong>-<strong>ethanol</strong> in Brazil, <strong>ethanol</strong> produced as a by-product<br />
of cellulose production (as in Sweden and Switzerland), and manufacture of biodiesel from<br />
animal fats and used cooking oil, can substantially reduce [greenhouse gases] compared with<br />
gasoline and mineral diesel. �e other conventional biofuel technologies typically deliver<br />
[greenhouse gas] reductions of less than 40% compared with their fossil-fuel alternatives’.<br />
�is report also recognized that while still trade barriers would persist <strong>to</strong> the international<br />
market, it will be di�cult for the world <strong>to</strong> take advantage of the environmental qualities of<br />
the use of some biofuels, mainly the <strong>ethanol</strong> form sugarcane and so forth as international<br />
markets are not yet fully created for biofuels.<br />
134 <strong>Sugarcane</strong> <strong>ethanol</strong>
Environmental sustainability of sugarcane <strong>ethanol</strong> in Brazil<br />
5. Future steps <strong>to</strong>wards sustainable production of <strong>ethanol</strong> and the role of<br />
innovation<br />
A huge challenge facing policy makers, businesses, scientists and societies as a whole is how<br />
<strong>to</strong> responsibly establish sustainable production systems and biofuel supplies in su�cient<br />
volume that meet current and future demands globally.<br />
�e examples and best practices found in Brazilian sugarcane <strong>ethanol</strong> provides a good<br />
framework and baseline of sustainability compared with other current biofuels available<br />
in large scale in the World, having the smallest impact on food in�ation, high levels of<br />
productivity (on average 7,000 liters of <strong>ethanol</strong>/ha and 6.1 MWhr of energy/ha), with<br />
lower inputs of fertilizers and agrochemicals, while reducing signi�cantly the emissions of<br />
greenhouse gases. �e ending of sugarcane burning in 2014 is a good example of improving<br />
existing practices. �e proper planning of sugarcane expansion in<strong>to</strong> new areas will for<br />
another important step <strong>to</strong>wards sustainable production of <strong>ethanol</strong><br />
In addition new technologies and innovation are taking place in Brazil and elsewhere in<br />
the world, aiming at optimizing the use of feeds<strong>to</strong>cks: using lignocellulosic materials (the<br />
second generation of biofuels); reducing waste; adding value <strong>to</strong> <strong>ethanol</strong> co-products and<br />
moving <strong>to</strong>wards <strong>ethanol</strong> chemistry and biore�naries full deployment.<br />
Di�erent initiatives in Brazil from the State of São Paulo Research Foundation (FAPESP),<br />
Ministry of Science and Education (MC&T – FINEP) and investments from the private<br />
sec<strong>to</strong>r are contributing <strong>to</strong> the deployment of new opportunities provided by the sugarcane<br />
biomass, at the same time improving the environmental performances at the agriculture<br />
and at the industry.<br />
References<br />
Agrianual, 2008. Anuário da Agricultura Brasileira. FNP Consul<strong>to</strong>ria & Agroinformativo, São Paulo, 502 pp.<br />
Arrigoni, E. De Beni and L.C. De Almeida, 2005. Use of agrochemicals. In: Macedo, I.C. (ed.) <strong>Sugarcane</strong>’s<br />
Energy – Twelve studies on Brazilian sugarcane agribusiness and its sustainability. São Paulo, pp.<br />
147-161.<br />
Associação Nacional dos Fabricantes de Veículos Au<strong>to</strong>mo<strong>to</strong>res (ANFAVEA), 2006. Brazil. Available at:<br />
www.anfavea.com.br.<br />
Ber<strong>to</strong>ni, J., F.I. Pastana, F. Lombardi Ne<strong>to</strong> and R. Benatti Junior, 1998. Conclusões gerais das pesquisas<br />
sobre conservação de solo no Institu<strong>to</strong> Agronômico. In: Lombardi Ne<strong>to</strong>, F. and Bellinazi Jr, R. (eds.)<br />
Simpósio sobre terraceamen<strong>to</strong> agrícola, Campinas, SP, Fundação Cargill, Campinas. Campinas, Institu<strong>to</strong><br />
Agronômico, Jan 1982, Circular 20, 57 pp.<br />
Brazilian Government. Lei No. 6.938, de 31 de agos<strong>to</strong> de 1981. Dispõe sobre a Política Nacional do Meio<br />
Ambiente, seus �ns e mecanismos de formulação e aplicação, e dá outras providências. Available at:<br />
www.planal<strong>to</strong>.gov.br/ccivil_03/Leis/L6938.htm.<br />
<strong>Sugarcane</strong> <strong>ethanol</strong> 135
Chapter 5<br />
Brazilian Government. Lei No. 4.771, de 15 de setembro de 1965. Institui o novo Código Florestal. Available<br />
at: www.planal<strong>to</strong>.gov.br/ccivil_03/LEIS/L4771.htm.<br />
Brazilian Government. Portaria do Ministério do Interior n. 323, de 29 de novembro de 1978. Proíbe<br />
lançamen<strong>to</strong> de vinho<strong>to</strong> em coleções de água. Brazil. Available at: www.udop.com.br/download/<br />
legislacao_vinhaca.pdf.<br />
Brazilian Government. Resolução CONAMA n. 001 de 23 de janeiro de 1986. Estabelecer as de�nições, as<br />
responsabilidades, os critérios básicos e as diretrizes gerais para uso e implementação da Avaliação de<br />
Impac<strong>to</strong> Ambiental como um dos instrumen<strong>to</strong>s da Política Nacional do Meio Ambiente. Available at:<br />
www.mma.gov.br/port/conama/res/res86/res0186.html. Brazil.<br />
Campos, B.C., 2006. Dinâmica do carbono em la<strong>to</strong>ssolo vermelho sob sistemas de preparo de solo e de<br />
culturas. Santa Maria, RS. Tese (dou<strong>to</strong>rado), Universidade Federal de Santa Maria.<br />
Cerri, C.C., 1986. Dinâmica da matéria orgânica do solo no agrossistema cana-de-açúcar. Tese (livre<br />
docência). Escola Superior de Agricultura ‘Luiz de Queiroz’, Piracicaba, SP, Brazil.<br />
Committee on Water Implications of Biofuels Production in the United States, 2008. Water Implications of<br />
Biofuels Production in the United States. �e National Academies Press. 88 pp.<br />
Companhia Nacional De Abastecimen<strong>to</strong> (CONAB), 2008. Per�l do Se<strong>to</strong>r do Açúcar e do Álcool no Brasil.<br />
Brasília: Conab, 2008. Available at: http://www.conab.gov.br/conabweb/download/safra/per�l.pdf.<br />
D’Andrea, A.F., M.L.N. Silva, N. Curi and L.R.G. Guilherme, 2004. Es<strong>to</strong>que de carbono e nitrogênio e formas<br />
de nitrogênio mineral em um solo submetido a diferentes sistemas de manejo. Pesquisa agropecuária.<br />
brasileira, Brasília, vol. 39 (2): 179-186.<br />
Dedini, 2008. Dedini lança usina de açúcar e etanol produ<strong>to</strong>ra de água. Press release. Dedini S.A. Indústria<br />
de Base, Piracicaba.<br />
Donzelli, J.L., 2005. Preservation of agricultural soil. In: Macedo, I.C. (ed.) <strong>Sugarcane</strong>’s Energy – Twelve<br />
studies on Brazilian sugarcane agribusiness and its sustainability. São Paulo, pp. 139-146.<br />
Elia Ne<strong>to</strong>, A., 2008. Água na indústria da Cana-de-açúcar. In: Workshop Proje<strong>to</strong> PPP: ‘Aspec<strong>to</strong> Ambientais<br />
da Cadeia do Etanol de Cana-de-açúcar’, Painel I, São Paulo. 13 pp.<br />
Fancelli, A.L. and D. Dourado Ne<strong>to</strong>, 2004. Produção de milho. 2. ed. Guaíba, Agropecuária, Brazil. 360 pp.<br />
Ferreira, E.S. and A.O. Monteiro, 1987. Efei<strong>to</strong>s da aplicação da vinhaça nas propriedades químicas, físicas<br />
e biológicas do solo. Boletim Técnico Copersucar 36: 3-7.<br />
Fornasieri, F. and V.I. Domingos, 1978. Nutrição e adubação mineral do algodoeiro. In: Ministério da Ciência<br />
e Tecnologia – MCT (ed.). Emissões de gases de efei<strong>to</strong> estufa na queima de resíduos agrícolas.Brasília/DF<br />
– MCT, 2002. Available at: www.mct.gov.br/index.php/content/view/17341.html.<br />
Galdos, M.V., 2007. Dinâmica do carbono do solo no agrossistema cana-de-açúcar. Tese (dou<strong>to</strong>rado) – Escola<br />
Superior de Agricultura ‘Luiz de Queiroz’, Piracicaba.<br />
Goldemberg, J., 2007. Ethanol for a Sustainable Energy Future. Science 315: 808-810.<br />
Hill, J., E. Nelson, D. Tilman, S. Polasky and T. Douglas, 2006. Environmental, economic, and energetic costs<br />
and bene�ts of biodiesel and <strong>ethanol</strong> biofuels. PNAS 103: 11206-11210.<br />
IEA/CATI – SAAESP, 2008. Área cultivada e produção: Cerrado, Cerradão, Mata Natural. In: Banco de<br />
Dados do Institu<strong>to</strong> de Economia Agrícola. São Paulo. Available at: www.iea.sp.gov.br.<br />
Institu<strong>to</strong> de Economia Agrícola (IEA), 2008. Available at: www.iea.sp.gov.br.<br />
Institu<strong>to</strong> Nacional de pesquisas espaciais (INPE), 2008. Available at: www.inpe.br.<br />
International Energy Agency, 2004-2006. United States. Available at: www.iea.org.<br />
136 <strong>Sugarcane</strong> <strong>ethanol</strong>
Environmental sustainability of sugarcane <strong>ethanol</strong> in Brazil<br />
Itaú Corre<strong>to</strong>ra, 2007. Cosan: Céu Carregado, Tese de investimen<strong>to</strong>s. São Paulo.<br />
Jantalia, C.P., 2005. Estudo de sistemas de uso do solo e rotações de culturas em sistemas agrícolas brasileiros:<br />
dinâmica de nitrogênio e carbono no sistema solo – planta – atmosfera. Tese (dou<strong>to</strong>rado) – Universidade<br />
Federal Rural do Rio de Janeiro, Rio de Janeiro.<br />
Lardy, L.C., M. Brossard, M.L.L. Assad and J.Y. Laurent, 2002. Carbon and phosphorus s<strong>to</strong>cks of clayey<br />
ferrassols in Cerrado native and agroecossystems, Brazil. Agriculture Ecosystems and Environment<br />
92: 147-158, 2002.<br />
Macedo, I.C., J.E.A. Seabra and J.E.A.R. Silva, 2008. Green house gases emissions in the production and<br />
use of <strong>ethanol</strong> from sugarcane in Brazil: �e 2005/2006 averages and a prediction for 2020. Biomass<br />
and Bioenergy 32: 582-595.<br />
Macedo, I.C., 2005. <strong>Sugarcane</strong>’s Energy – Twelve studies on Brazilian sugarcane agribusiness and its<br />
sustainability. São Paulo. Available at: http://english.unica.com.br/multimedia/publicacao/<br />
Ministry of Agriculture and Lives<strong>to</strong>ck - CONAB, 2008. www.conab.gov.br. Brazil.<br />
Neves, C.S., V.J. Feller and Larré-Larrouy, M.-C., 2005. Matéria orgânica nas frações granulométricas de um<br />
la<strong>to</strong>ssolo vermelho distroférrico sob diferentes sistemas de uso e manejo. Ciências Agrárias, Londrina<br />
26: 17-26.<br />
OECD, 2007. Biofuels: is the cure worse than the disease? Paris: September, 2007. Available at: www.oecd.<br />
org/dataoecd/40/25/39266869.pdf.<br />
Ottmar, R.D., R.E. Vihnanek, H.S. Miranda, M.N. Sa<strong>to</strong> and S.M.A. Andrade, 2003. Séries de estéreofo<strong>to</strong>gra�as<br />
para quanti�car a biomassa da vegetação do cerrado no Brasil Central. Brasília: USDA,<br />
USAID, UnB, 2001. In: Ciclagem de Carbono em Ecossistemas Terrestres – O caso do Cerrado Brasileiro.<br />
Planaltina/,DF – Embrapa Cerrados, 2003. Available at: bbeletronica.cpac.embrapa.br/2003/doc/doc_<br />
105.pdf.<br />
Pro<strong>to</strong>colo Agroambiental do Se<strong>to</strong>r Sucroalcooleiro, 2008. Available at: www.unica.com.br/content/show.<br />
asp?cntCode={BEE106FF-D0D5-4264-B1B3-7E0C7D4031D6}.<br />
Rangel, O.J.P. and C.A. Silva, 2007. Es<strong>to</strong>que de carbono e nitrogênio e frações orgânicas de la<strong>to</strong>ssolo<br />
submetido a diferentes sistemas de uso e manejo. Revista Brasileira de Ciência do Solo 31: 1609-1623.<br />
Ricci Junior, A., 2005. Pesticides: herbicides. In: Macedo, Isaias de Carvalho; Several Authors, 2005.<br />
<strong>Sugarcane</strong>’s Energy – Twelve studies on Brazilian sugarcane agribusiness and its sustainability. São<br />
Paulo, pp 156-161.<br />
São Paulo State Government. Decre<strong>to</strong> no. 50.889, de 16 de junho de 2006. Dispõe sobre a manutenção,<br />
recomposição, condução da regeneração natural e compensação da área de Reserva Legal de imóveis<br />
rurais no Estado de São Paulo e dá providências correlatas. São Paulo. Available at: www.cetesb.sp.gov.<br />
br/licenciamen<strong>to</strong>o/legislacao/estadual/decre<strong>to</strong>s/2006_Dec_Est_50889.pdf.<br />
São Paulo State Government. Lei no. 997, de 31 de maio de 1976. Dispõe sobre o controle da poluição do meio<br />
ambiente. São Paulo. Available at: www.ambiente.sp.gov.br/uploads/arquivos/legislacoesambientais/1976_<br />
Lei_Est_997.pdf.<br />
São Paulo State Government. Lei no. 6.171, de 04 de julho de 1988. Dispõe sobre o uso, conservação e<br />
preservação do solo agrícola. São Paulo. Available at: sigam.ambiente.sp.gov.br/Sigam2/legisla%C3%A<br />
7%C3%A3o%20ambiental/Lei%20Est%201988_06171.pdf.<br />
<strong>Sugarcane</strong> <strong>ethanol</strong> 137
Chapter 5<br />
São Paulo State Government. Lei no. 11.241, de 19 de Setembro de 2002. Dispõe sobre a eliminação gradativa<br />
da queima da palha da cana-deaçúcar e dá providências correlatas. São Paulo. Available at: sigam.<br />
ambiente.sp.gov.br/sigam2/Legisla%C3%A7%C3%A3o%20Ambiental/Lei%20Est%202002_11241.pdf.<br />
São Paulo State Government. Lei no. 12.183, de 29 de dezembro de 2005. Dispõe sobre a cobrança pela<br />
utilização dos recursos hídricos do domínio do Estado de São Paulo, os procedimen<strong>to</strong>s para �xação dos<br />
seus limites, condicionantes e valores e dá outras providências. São Paulo. Available at: www.ana.gov.<br />
br/cobrancauso/_ARQS-legal/Geral/Legislacoes%20Estaduais/SP/Lei-12183-05.pdf.<br />
São Paulo State Government. Resolução SMA 42, de 14 de outubro de 2006. Licenciamen<strong>to</strong> ambiental prévio<br />
de destilarias de álcool, usinas de açúcar e unidades de fabricação de aguardente. São Paulo. Available<br />
at: www.milare.adv.br/ementarios/legislacao2006.pdf. São Paulo State Government. Resolução no. 382,<br />
de 26 de dezembro de 2006. Estabelece os limites máximos de emissão de poluentes atmosféricos para<br />
fontes �xas. São Paulo. Available at: www.mp.rs.gov.br/areas/ambiente/arquivos/boletins/bola_leg01_07/<br />
ib382.pdf.<br />
Smeets, E., M. Junginger, A. Faaij, A. Walter, P. Dolzan and W. Turkenburg, 2008;�e sustainability of<br />
Brazilian <strong>ethanol</strong> – an assessment of the possibilities of certi�ed production. Biomass and Bioenergy<br />
32: 781-813.<br />
Souza, S.A.V. de, 2005. Impacts on the water supply. In: Macedo, Isaias de Carvalho; Several Authors, 2005.<br />
<strong>Sugarcane</strong>’s Energy – Twelve studies on Brazilian sugarcane agribusiness and its sustainability. São<br />
Paulo, pp. 105-118.<br />
Szakács, G.G.J., 2003. Avaliação das potencialidades dos solos arenosos sob pastagens, Anhembi – Piracicaba/<br />
SP. Piracicaba, 2003. Dissertação (mestrado) – Centro de Energia Nuclear na Agricultura.<br />
Ti<strong>to</strong>n, M., C.O. Da Ros, C. Aita, S.J. Giacomini, E.B. Do Amaral and M.G. Marques, 2003. Produtividade<br />
e acúmulo de nitrogênio no milho com diferentes épocas de aplicação de N-uréia em sucessão a aveia<br />
preta. In: XXIX Congresso Brasileiro de Ciência do Solo, 2003, Ribeirão Pre<strong>to</strong> – SP.<br />
Trumbore, S. 1993. Comparison of carbon dynamics in tropical and temperate soils using radiocarbon<br />
measurements. Global Biogeochemical Cycles, Washing<strong>to</strong>n, v.7, pp. 75-290. In: Silveira, A.M., Vic<strong>to</strong>ria,<br />
R.L., Ballester, M.V., De Camargo, P.B., Martinelli, L.A. and Piccolo, M.C., 2000. Simulação dos efei<strong>to</strong>s das<br />
mudanças do uso da terra na dinâmica de carbono no solo na bacia do rio Piracicaba. Revista Pesquisa.<br />
agropecuária. brasileira, Brasília 35: 389-399.<br />
União da Indústria de Cana-de-açúcar (UNICA), 2008. Available at: www.unica.com.br.<br />
Unica, 2008. Pro<strong>to</strong>colo Agroambiental do Se<strong>to</strong>r Sucroalcooleiro. Available at: www.unica.com.br/content/<br />
show.asp?cntCode={BEE106FF-D0D5-4264-B1B3-7E0C7D4031D6}.<br />
Unica, 2008. Estimativa da Safra 2008/2009. Available at: www.unica.com.br/noticias/show.<br />
asp?nwsCode={8ACECE47-BD9D-4D82-9BFF-5ABCCD9C5953}.<br />
United States Department of Agriculture (USDA). Available at: www.usda.gov.<br />
Van Dam, J., M. Junginger, A. Faaij. I. Jurgens, G. Best and U. Fritsche, 2006. Overview of recent developments<br />
in sustainable biomass certi�cation. IEA Bioenergy Task 40. 40 pp.<br />
Venture Partners do Brasil (VPB), 2008. VPB analysis of sugarcane future scenarios. São Paulo, SP, Brazil,<br />
14 pp.<br />
World Watch Institute, 2006. Available at: www.worldwatch.org.<br />
138 <strong>Sugarcane</strong> <strong>ethanol</strong>
Chapter 6<br />
Demand for bio<strong>ethanol</strong> for transport<br />
Andre Faaij, Alfred Szwarc and Arnaldo Walter<br />
1. Introduction<br />
�e utilization of <strong>ethanol</strong> either as a straight fuel or blended <strong>to</strong> gasoline (in various<br />
proportions) has been fully proven in various countries and it is regarded as technically<br />
feasible with existing internal combustion engine technologies. Because <strong>ethanol</strong> o�ers<br />
immediate possibilities of partially substituting fossil fuels, it has become the most popular<br />
transport biofuel in use. Production of <strong>ethanol</strong>, which has been rising fast, is expected <strong>to</strong><br />
reach 70 billion litres by the end of 2008. Approximately 80% of this volume will be used<br />
in the transport sec<strong>to</strong>r while the rest will go in<strong>to</strong> alcoholic beverages or will be either used<br />
for industrial purposes (solvent, disinfectant, chemical feeds<strong>to</strong>ck, etc.).<br />
Although a growing number of countries, including China and India, have been introducing<br />
<strong>ethanol</strong> in the transport fuels market, it is in Brazil, in the USA and in Sweden where this<br />
use has gained most relevance. In March 2008, consumption of <strong>ethanol</strong> surpassed that of<br />
gasoline in Brazil, largely due <strong>to</strong> the success of the �ex-fuel vehicles (FFVs) and resulting<br />
steep increase in straight <strong>ethanol</strong> (E100) consumption. In the USA, in addition <strong>to</strong> a rising<br />
utilization of FFVs and high <strong>ethanol</strong> content blends with up <strong>to</strong> 85% <strong>ethanol</strong> content (E85),<br />
over 50% of the gasoline marketed now contains <strong>ethanol</strong>, mostly 10% (E10). Sweden has<br />
been leading <strong>ethanol</strong> use in Europe with the 5% gasoline blend consumed nationwide (E5),<br />
an upward demand of E85 and a �eet of 600 <strong>ethanol</strong>-fuelled buses.<br />
�e international interest on <strong>ethanol</strong> in the transport sec<strong>to</strong>r has been based on various<br />
reasons including energy security, trade balance, rural development, urban pollution<br />
and mitigation of global warming. �e challenge for the near future is <strong>to</strong> achieve wide<br />
acceptance of <strong>ethanol</strong> as a sustainable energy commodity and global growth of its demand.<br />
In the transport sec<strong>to</strong>r this includes increased supply of <strong>ethanol</strong> produced from a variety<br />
of renewable energy sources in an e�cient, sustainable and cost-e�ective way. In many<br />
countries, 2 nd generation biofuels (including <strong>ethanol</strong>) produced from lignocellulosic biomass<br />
instead of food crops, is thought <strong>to</strong> deliver such performance, but commercial technology <strong>to</strong><br />
convert biomass from residues, trees and grasses <strong>to</strong> liquid fuels is not yet available. On the<br />
demand side, it comprises the optimisation of existing engine technologies and development<br />
of new ones that could make the best possible use of <strong>ethanol</strong> and be introduced in the<br />
market in a large scale. Ethanol is a well suited and high quality fuel for more e�cient �ex<br />
fuel engines, <strong>ethanol</strong>-fuelled hybrid drive chains and dual-fuel combustion systems. Such<br />
technologies can boost vehicle e�ciency and increase demand for <strong>ethanol</strong> use in various<br />
transport applications.<br />
<strong>Sugarcane</strong> <strong>ethanol</strong> 139
Chapter 6<br />
2. Development of the <strong>ethanol</strong> market<br />
2.1. Growth in demand and production<br />
Liquid biofuels play so far a limited role in global energy supply, and represent only 10%<br />
of <strong>to</strong>tal bioenergy, 1.38% of renewable energy and 0.18% of <strong>to</strong>tal world energy supply.<br />
�ey are of signi�cance mainly for the transport sec<strong>to</strong>r, but even here they supplied only<br />
0.8% of <strong>to</strong>tal transport fuel consumption in 2005, up from 0.3% in 1990. In recent years,<br />
liquid biofuels have shown rapid growth in terms of volumes and share of global demand<br />
for transport energy. Ethanol production is rising rapidly in many parts of the world in<br />
response <strong>to</strong> higher oil prices, which are making <strong>ethanol</strong> more competitive. In 2007 the<br />
world fuel <strong>ethanol</strong> production was estimated as 50 billion litres, being the production in<br />
USA (24.6 billion litres) and Brazil (19 billion litres) equivalent <strong>to</strong> 88% of the <strong>to</strong>tal; in EU<br />
the production was almost 2.2 billion litres, in China 1.8 billion litres and in Canada 800<br />
million litres (RFA, 2008, based on Licht, 2007).<br />
Production of <strong>ethanol</strong> via fermentation of sugars is a classic conversion route, yet the<br />
most popular, which is applied for sugarcane, maize and cereals on a large scale, especially<br />
in Brazil, the United States and <strong>to</strong> a lesser extent the EU and China. Ethanol production<br />
from food crops like maize and cereals has been linked <strong>to</strong> food price increase, although<br />
estimates <strong>to</strong> what extent vary widely and many fac<strong>to</strong>rs apart from biofuels play a role in<br />
those price increases (FAO, 2008). In addition bio<strong>ethanol</strong> from such feeds<strong>to</strong>cks has only<br />
been competitive <strong>to</strong> gasoline and diesel when supported by subsidies. Despite of some<br />
advances in its production process, <strong>ethanol</strong> from food crops is not likely <strong>to</strong> achieve major<br />
cost reduction in the short and medium terms.<br />
In contrast, the impact of sugarcane based <strong>ethanol</strong> production (dominated by Brazil) on<br />
food prices seems minimal, given reduced world sugar prices in recent years. It’s production<br />
achieved competitive performance levels with fossil fuel prices without the need of subsidies<br />
(Wall-Bake et al., 2008). Also it has been gaining an increasingly relevant position in other<br />
countries in tropical regions (such as India, �ailand, Colombia and various countries in<br />
Sub-Saharan Africa). Production costs of <strong>ethanol</strong> in Brazil have steadily declined over the<br />
past few decades and have reached a point where <strong>ethanol</strong> is competitive with production<br />
costs of gasoline (Rosillo-Calle and Cortez, 1998; Wall-Bake et al., 2008). As a result, <strong>ethanol</strong><br />
is no longer �nancially supported in Brazil and competes openly with gasoline (Goldemberg<br />
et al., 2004).<br />
Figure 1 shows the learning curves of sugarcane and <strong>ethanol</strong> from sugarcane in Brazil<br />
since late 1970s. �e estimated progress ratio (PR) of 0.68 in case of sugarcane imply that<br />
its costs of production have reduced, on average, 32% each time its cumulative production<br />
has doubled (19% in case of <strong>ethanol</strong> costs, excluding feeds<strong>to</strong>ck costs). �e �gure also shows<br />
140 <strong>Sugarcane</strong> <strong>ethanol</strong>
Production costs sugarcane [US$/<strong>to</strong>nne] and <strong>ethanol</strong> (US$/m 3 )<br />
800<br />
400<br />
200<br />
40<br />
20<br />
10<br />
Cumulative <strong>ethanol</strong> production (10 6 m 3 )<br />
Cumulative sugarcane production (10 6 TC)<br />
Demand for bio<strong>ethanol</strong> for transport<br />
10 20 40 80 160 320 640 1,280<br />
PR = 0.81±0.02<br />
PR = 0.68±0.03<br />
<strong>Sugarcane</strong><br />
Ethanol prod. cost (excl. feeds<strong>to</strong>ck)<br />
Expected range of cane prod. costs in 2020<br />
Expected range of <strong>ethanol</strong> prod. costs in 2020<br />
1,000 2,000 4,000 8,000 16,000 32,000<br />
Figure 1. Learning curves and estimated future costs of sugarcane and <strong>ethanol</strong> production (excluding<br />
feeds<strong>to</strong>ck costs) assuming 8% annual growth of sugarcane and <strong>ethanol</strong> production (Wall-Bake et<br />
al., 2008).<br />
estimated costs of sugarcane and <strong>ethanol</strong> production by 2020, supposing a certain growth<br />
path of sugarcane and <strong>ethanol</strong> production.<br />
Larger facilities, better use of bagasse and trash residues from sugarcane production, e.g.<br />
with advanced power generation (gasi�cation based) or hydrolysis techniques (see below),<br />
and further improvements in cropping systems, o�er further perspectives for sugarcane<br />
based <strong>ethanol</strong> production (Damen, 2001; Hamelinck et al., 2005).<br />
�e growth in the use of <strong>ethanol</strong> has been facilitated by its ability <strong>to</strong> be blended with gasoline<br />
in existing vehicles and be s<strong>to</strong>red and transported using current facilities, equipment and<br />
tanks. Blending anhydrous <strong>ethanol</strong> with gasoline at ratios that generally are limited <strong>to</strong> E10 has<br />
been the fastest and most e�ective way of introducing <strong>ethanol</strong> in the fuel marketplace.<br />
In Brazil fuel retailers are required <strong>to</strong> market high <strong>ethanol</strong>-content blends, with a percentage<br />
that can vary from 20% <strong>to</strong> 25% by volume (E20 – E25). Vehicles are cus<strong>to</strong>mized for these<br />
<strong>Sugarcane</strong> <strong>ethanol</strong> 141<br />
2020<br />
2020
Chapter 6<br />
blends by car manufacturers or, in the case of imported cars (around 10% of the market),<br />
at the origin or by the importers themselves.<br />
FFVs in the USA, Sweden and elsewhere can operate within a range that varies from straight<br />
gasoline <strong>to</strong> E85 blends, while in Brazil they are built <strong>to</strong> run in a range that varies from<br />
E20–E25 blends <strong>to</strong> E100. Up <strong>to</strong> 2006 car manufacturers in Brazil used <strong>to</strong> market dedicated<br />
E100 vehicles, which were later substituted by the FFVs.<br />
Considering that current world’s gasoline demand stands in the order of 1.2 trillion litres<br />
per year (information brochure produced by Hart Energy Consulting for CD Technologies,<br />
2008) fuel <strong>ethanol</strong> supply will reach approximately 5% of this volume in 2008, which in<br />
energy terms represents 3% of current gasoline demand.<br />
Ethanol has the advantage that it lowers various noxious emissions (carbon monoxide,<br />
hydrocarbons, sulphur oxides, nitrogen oxides and particulates) when compared <strong>to</strong><br />
straight gasoline. Nevertheless the extent of emission reduction depends on a number<br />
of variables mainly engine characteristics, the way <strong>ethanol</strong> is used and emission control<br />
system features.<br />
With regard <strong>to</strong> GHG emissions it has been demonstrated that on a life-cycle basis sugarcane<br />
<strong>ethanol</strong> produced in Brazil can reduce these emissions by 86% under current manufacturing<br />
conditions and use when compared <strong>to</strong> gasoline (Macedo et al., 2008). Avoided emissions<br />
due <strong>to</strong> the use of <strong>ethanol</strong> produced from maize (USA) and wheat (EU) are estimated as 20-<br />
40% on life-cycle basis (IEA, 2004). In case of <strong>ethanol</strong> from sugarcane further reductions<br />
of GHG emissions are possible in short <strong>to</strong> mid-term, with advances in the manufacturing<br />
process (i.e. replacement of mineral diesel with biodiesel or <strong>ethanol</strong> in the trac<strong>to</strong>rs and<br />
trucks, end of pre-harvest sugarcane burning and capture of fermentation-generated CO 2 )<br />
(Macedo et al., 2008; Damen, 2001; Faaij, 2006).<br />
2.2. International trade<br />
�e development of truly international markets for bioenergy has become an essential<br />
driver <strong>to</strong> develop available biomass resources and bioenergy potentials, which are currently<br />
underutilised in many world regions. �is is true for both residues as well as for dedicated<br />
biomass production (through energy crops or multifunctional systems, such as agroforestry).<br />
�e possibilities <strong>to</strong> export biomass-derived commodities for the world’s energy<br />
market can provide a stable and reliable demand for rural communities in many developing<br />
countries, thus creating an important incentive and market access that is much needed in<br />
many areas in the world. �e same is true for biomass users and importers that rely on a<br />
stable and reliable supply of biomass <strong>to</strong> enable o�en very large investments in infrastructure<br />
and conversion capacity.<br />
142 <strong>Sugarcane</strong> <strong>ethanol</strong>
Demand for bio<strong>ethanol</strong> for transport<br />
Figures 2 and 3 show the <strong>to</strong>p ten <strong>ethanol</strong> importers and exporters in 2006, when the <strong>to</strong>tal<br />
volume traded was estimated as 6.5 billion litres, i.e. almost 13% of the whole production<br />
(Valdes, 2007). At that year more than 60 countries exported <strong>ethanol</strong>, but only ten surpassed<br />
100 million litres traded and the most important 15 exporters covered 90% of the whole<br />
trade. US have imported more than 2.5 billion litres in 2006, EU about 690 million litres<br />
(Licht, 2007), while the imports of Japan were estimated as about 500 million litres. �ese<br />
three economic blocks represented about 80% of the net imports of <strong>ethanol</strong> in 2006.<br />
Clearly, Brazil stands out as the largest exporter, covering more than 50% of the <strong>to</strong>tal volume<br />
traded. Except in 2006, when more than 50% was directly sold <strong>to</strong> US, <strong>ethanol</strong> exports from<br />
Italy<br />
France<br />
Belgium<br />
S.Korea<br />
Sweden<br />
UK<br />
Netherlands<br />
Germany<br />
Japan<br />
USA<br />
Figure 2. Top 10 <strong>ethanol</strong> importers in 2006 (Licht, 2007).<br />
Italy<br />
Pakistan<br />
Ukraine<br />
UK<br />
Germany<br />
Spain<br />
USA<br />
France<br />
China<br />
Brazil<br />
0 500 1,000 1,500 2,000 2,500 3,000<br />
Ethanol import (mln litres)<br />
0 500 1,000 1,500 2,000 2,500 3,000 3,500<br />
Ethanol export (mln litres)<br />
Figure 3. Top 10 <strong>ethanol</strong> exporters in 2006 (Licht, 2007).<br />
<strong>Sugarcane</strong> <strong>ethanol</strong> 143
Chapter 6<br />
Brazil have been roughly well distributed among 10-12 countries. On the other hand, due <strong>to</strong><br />
the Caribbean Basin Initiative (CBI) agreement 10 , most of the <strong>ethanol</strong> exported from Brazil<br />
<strong>to</strong> Central America and Caribbean countries reaches US. US importers from Caribbean<br />
and Central America countries have continuously grown since 2002.<br />
Figure 4 shows Brazil’s <strong>ethanol</strong> trade since 1970. Traditionally, Brazilian exports of <strong>ethanol</strong><br />
have been oriented for beverage production and industrial purposes but, recently, trade<br />
for fuel purposes has enlarged. Halfway the 90-ies, a shortage of <strong>ethanol</strong> occurred, even<br />
requiring net imports. But a�er 2000 Brazilian exports of <strong>ethanol</strong> have risen steadily. In<br />
2007 exports reached 3.5 billion litres and it is estimated that about 4 billion litres will be<br />
exported in 2008. It is expected that Brazil will maintain such an important position in the<br />
future. Outlooks on the future <strong>ethanol</strong> market are discussed in the next section.<br />
10 CBI is an agreement between US and Central American and Caribbean countries that allows that up <strong>to</strong> 7%<br />
of the US <strong>ethanol</strong> demand may be imported duty-free, even if the production itself occurs in another country<br />
(Zarilli, 2006).<br />
Brazil's <strong>ethanol</strong> trade (million litres)<br />
5,000<br />
4,000<br />
3,000<br />
2,000<br />
1,000<br />
-1,000<br />
-2,000<br />
-3,000<br />
Imports<br />
Exports<br />
0<br />
1970 1975 1980 1985 1990 1995 2000 2005 2010<br />
Figure 4. Trade in <strong>ethanol</strong> in Brazil 1970-2008 (estimates for 2008), including all end-uses (Brazil,<br />
2008), (Kutas, 2008).<br />
144 <strong>Sugarcane</strong> <strong>ethanol</strong>
3. Drivers for <strong>ethanol</strong> demand<br />
3.1. Key drivers<br />
Demand for bio<strong>ethanol</strong> for transport<br />
When evaluating key drivers for <strong>ethanol</strong> demand, energy security and <strong>climate</strong> <strong>change</strong> are<br />
considered <strong>to</strong> be the most important objectives reported by nearly all countries that engage<br />
in bioenergy development activities. As illustrated in Table 1 no country highlights less<br />
than three key objectives. �is renders successful bioenergy development a challenge as it<br />
tries <strong>to</strong> reach multiple goals, which are not always compatible. For instance, energy security<br />
considerations favour domestic feeds<strong>to</strong>ck production (or at least diversi�ed suppliers),<br />
whereas <strong>climate</strong> <strong>change</strong> considerations and cost-e�ectiveness call for sourcing of feeds<strong>to</strong>cks<br />
with low emissions and costs. �is implies that imports are likely <strong>to</strong> grow in importance for<br />
various industrialized countries, but also a strong pressure on developing 2 nd generation<br />
biofuels that are <strong>to</strong> be produced from lignocellulosic biomass. Not surprisingly, the latter is<br />
a key policy and RD&D priority in North America and the EU.<br />
Table 1. Main objectives of bioenergy development of G8 +5 countries (GBEP, 2008).<br />
Country Objectives<br />
Climate <strong>change</strong><br />
Environment<br />
Energy security<br />
Rural<br />
development<br />
Agricultural<br />
development<br />
Technological<br />
progress<br />
Brazil X X X X X X<br />
China X X X X X<br />
India X X X X<br />
Mexico X X X X X<br />
South Africa X X X<br />
Canada X X X X<br />
France X X X X<br />
Germany X X X X X X<br />
Italy X X X<br />
Japan X X X X<br />
Russia X X X X X X<br />
UK X X X X X<br />
US X X X X X X<br />
EU X X X X X X<br />
Cost<br />
effectivenness<br />
<strong>Sugarcane</strong> <strong>ethanol</strong> 145
Chapter 6<br />
Overall there are few di�erences between the policy objectives of G8 Countries and the +5<br />
countries (Mexico, South Africa, Brazil, India, China). Rural development is more central <strong>to</strong><br />
the +5 countries’ focus on bioenergy development, and this is o�en aligned with a poverty<br />
alleviation agenda. Bioenergy development is also seen as an opportunity <strong>to</strong> increase access <strong>to</strong><br />
modern energy, including electri�cation, in rural areas. �e rural development objectives of<br />
the wealthier G8 countries focus more on rural revitalization. Similarly, in the +5 countries,<br />
agricultural objectives envisage new opportunities not just for high-end commercialised<br />
energy crop production, but also for poorer small-scale suppliers. Very important is that<br />
in many countries (both industrialized and developing) sustainability concerns, e.g. on<br />
land-use, competition with food, net GHG balances, water use and social consequences,<br />
has become an overriding issue. Development and implementation of sustainability criteria<br />
is now seen in a variety of countries (including the EU) and for various commodities (such<br />
as palm oil, sugar and soy) (Van Dam et al., 2008; Junginger et al., 2008).<br />
3.2. Developments in vehicle technology<br />
Transport predominantly relies on a single fossil resource, petroleum that supplies 95% of<br />
the <strong>to</strong>tal energy used by world transport. In 2004, transport was responsible for 23% of world<br />
energy-related GHG emissions with about three quarters coming from road vehicles. (see<br />
also the breakdown of energy use of di�erent modes of transport in Table 2). Over the past<br />
decade, transport’s GHG emissions have increased at a faster rate than any other energyusing<br />
sec<strong>to</strong>r (Kahn Ribeiro et al., 2007).<br />
Figures 5a and 5b provide projections for the growth in energy use per mode of transport<br />
and per world region. Transport activity will continue <strong>to</strong> increase in the future as economic<br />
growth fuels transport demand and the availability of transport drives development, by<br />
Table 2. World transport energy use in 2000, by mode (Kahn Ribeiro et al., 2007, based on WBCSD,<br />
2004b).<br />
Mode Energy use (EJ) Share (%)<br />
Light-duty vehicles 34.2 44.5<br />
2-wheelers 1.2 1.6<br />
Heavy freight trucks 12.48 16.2<br />
Medium freight trucks 6.77 8.8<br />
Buses 4.76 6.2<br />
Rail 1.19 1.5<br />
Air 8.95 11.6<br />
Shipping 7.32 9.5<br />
Total 76.87 100<br />
146 <strong>Sugarcane</strong> <strong>ethanol</strong>
a<br />
EJ<br />
200<br />
b<br />
Demand for bio<strong>ethanol</strong> for transport<br />
150<br />
100<br />
50<br />
Rail<br />
Water<br />
Air<br />
Buses<br />
Freight trucks<br />
2-3 wheelers<br />
Africa<br />
Latin America<br />
Middle East<br />
India<br />
Other Asia<br />
China<br />
Eastern Europe<br />
EECCA<br />
OECD Pacific<br />
OECD Europe<br />
OECD N. America<br />
0<br />
LDVs<br />
Bunker fuel<br />
2000 2010 2020 2030 2040 2050 2000 2010 2020 2030 2040 2050<br />
Figure 5. Projection of transport energy consumption by mode (a) and region (b) (WBCSD, 2004a).<br />
facilitating specialization and trade. �e majority of the world’s population still does not<br />
have access <strong>to</strong> personal vehicles and many do not have access <strong>to</strong> any form of mo<strong>to</strong>rized<br />
transport. However, this situation is rapidly changing.<br />
Freight transport has been growing even more rapidly than passenger transport and is<br />
expected <strong>to</strong> continue <strong>to</strong> do so in the future. Urban freight movements are predominantly<br />
by truck, while international freight is dominated by ocean shipping.<br />
Transport activity is expected <strong>to</strong> grow robustly over the next several decades. Unless there<br />
is a major shi� away from current patterns of energy use, world transport energy use is<br />
projected <strong>to</strong> increase at the rate of about 2% per year, with the highest rates of growth in<br />
the emerging economies. Total transport energy use and carbon emissions are projected <strong>to</strong><br />
be about 80% higher than current levels by 2030 (Kahn Ribeiro et al., 2007).<br />
�ere is an ongoing debate about whether the world is nearing a peak in conventional oil<br />
production that will require a signi�cant and rapid transition <strong>to</strong> alternative energy resources.<br />
�ere is no shortage of alternative energy sources that could be used in the transport<br />
sec<strong>to</strong>r, including oil sands, shale oil, coal-<strong>to</strong>-liquids, gas-<strong>to</strong>-liquids, natural gas, biofuels,<br />
electricity and hydrogen produced from fossil fuels or renewable energy sources. Among<br />
these alternatives, unconventional fossil carbon resources could produce competitively<br />
priced fuels most compatible with the existing transport infrastructure, but these will lead<br />
<strong>to</strong> strongly increased carbon emissions (Kahn Ribeiro et al., 2007).<br />
<strong>Sugarcane</strong> <strong>ethanol</strong> 147
Chapter 6<br />
3.2.1. The impact of existing technologies on fuel <strong>ethanol</strong> demand<br />
In use vehicle technologies already enable large scale use of <strong>ethanol</strong> and therefore can be<br />
considered a key driver for its worldwide use. For instance, if E10 were <strong>to</strong> become globally<br />
used <strong>to</strong>day, the global FFVs �eet (estimated at 15 million vehicles as of 2008) were <strong>to</strong> use the<br />
maximum level of <strong>ethanol</strong> and 50,000 buses were equipped with dedicated <strong>ethanol</strong> engines,<br />
fuel <strong>ethanol</strong> demand would jump from current 56 billion litres <strong>to</strong> 165 billion litres, almost<br />
a 200% increase over existing demand (Szwarc, A. personal communication). �e largest<br />
consumption (75%) would come from <strong>ethanol</strong> blending with gasoline.<br />
�is estimate indicates the potential demand for <strong>ethanol</strong> without any technological<br />
breakthrough and although it would not be feasible <strong>to</strong> be achieved overnight because it<br />
requires a regula<strong>to</strong>ry framework and <strong>ethanol</strong> logistics, it could be gradually developed<br />
until 2020. Projections of <strong>ethanol</strong> production for Brazil, the USA and the EU indicate that<br />
supply of 165 billion litres by 2020 could be achieved with the use of a combination of �rst<br />
and second generation <strong>ethanol</strong> production technologies.<br />
However, a scenario where sugarcane <strong>ethanol</strong> production in Asia, Africa, Latin America and<br />
the Caribbean could ful�l these needs is also possible. Approximately 25 million hectares of<br />
sugarcane would be needed <strong>to</strong> produce this volume worldwide using only �rst generation<br />
technology. With cellulosic <strong>ethanol</strong> production technologies in place using sugarcane<br />
bagasse and straw and combination of these technologies with �rst generation technology,<br />
the need for land use would be reduced <strong>to</strong> 20 million hectares. A third scenario considering<br />
extensive use of second generation <strong>ethanol</strong> production from various non-conventional<br />
feeds<strong>to</strong>cks, including industrial residues and municipal waste, could further reduce the<br />
need of land for <strong>ethanol</strong> production further (Walter et al., 2008).<br />
3.2.2. FFVs technology and the market<br />
In 1992, the US market saw the �rst commercially produced FFVs. It was a concept that<br />
would allow the gradual structuring of an <strong>ethanol</strong> market. Drivers would be allowed <strong>to</strong> run<br />
on gasoline where <strong>ethanol</strong> would not be available, therefore resolving the question on ‘what<br />
comes �rst: the car or the fuel infrastructure?’ that inhibited the <strong>ethanol</strong> market growth.<br />
Pushed by alternative energy regulations and �scal incentives, American car manufacturers<br />
began producing FFVs that in most part ended up in government �eets. Because the number<br />
of fuel stations marketing E85 is very limited, FFVs in the US have been fuelled with straight<br />
gasoline most of the time. General Mo<strong>to</strong>rs has been championing the FFV concept in the<br />
USA and has recently engaged in the expansion of E85 sales locations. Other companies<br />
like Ford, Chrysler and Nissan have also FFVs in their sales portfolio. By December 2008<br />
approximately 8 million FFVs (2.8% of vehicle �eet in the US) will be on American roads<br />
but still consuming mostly gasoline (Szwarc, A., personal communication).<br />
148 <strong>Sugarcane</strong> <strong>ethanol</strong>
Demand for bio<strong>ethanol</strong> for transport<br />
Sweden was the �rst country in Europe <strong>to</strong> start using FFVs in 1994. At �rst only a few<br />
imported vehicles from the US composed a trial �eet, but in 2001 FFVs sales started. In<br />
2005 local car manufacturers like Saab and Volvo developed E85 FFVs versions. In 2007, the<br />
market share of new FFVs in Sweden was 12% and the <strong>to</strong>tal �eet reached 80,000 vehicles (2%<br />
of the <strong>to</strong>tal vehicle �eet). Over 1,000 fuel stations are selling E85 in Sweden making possible<br />
the use of E85 in FFVs. A variety of policy measures have been provided incentives for<br />
FFVs in Sweden. �ese include exemption of biofuels from mineral oil tax, tax bene�ts for<br />
companies and private car owners, free parking in 16 cities and manda<strong>to</strong>ry alternative fuel<br />
infrastructure and government vehicle purchases. �is initiative is part of a set of measures<br />
taken by Sweden in order <strong>to</strong> achieve its ambitious goal <strong>to</strong> be at the forefront of the world’s<br />
‘green’ nations and achieve a completely oil-free economy by 2020.<br />
E100-compatible FFVs were introduced in the Brazilian market in 2003 in a di�erent context<br />
than observed in the US or Sweden, in order <strong>to</strong> ful�l consumers’ desire <strong>to</strong> use a cheaper<br />
fuel. FFVs have become a sales phenomenon and presently sales correspond <strong>to</strong> nearly 90%<br />
of new light-duty vehicle sales. All car manufacturers in Brazil have developed FFVs that<br />
are being o�ered as standard versions for the domestic market (over 60 models in 2008).<br />
�e success of FFVs can be explained by now excellent availability of E100 and E20/E25<br />
(at more than 35,000 fuel stations nationwide), �exibility for consumers who can choose<br />
the fuel they want depending on fuel costs and/or engine performance. Since fuel <strong>ethanol</strong><br />
has been in general less expensive than gasoline blends (straight gasoline is not available<br />
for sale in Brazil) and gives better performance, it became the fuel of choice. Furhtermore<br />
FFV’s have a ‘greener’ and more modern image and have higher resale value compared <strong>to</strong><br />
conventional cars.<br />
In 2008, the Brazilian �eet of FFVs will reach 7 million vehicles (25% of vehicle �eet) and<br />
in most cases the preferred fuel has been E100. �e success of FFVs in Brazil has caught the<br />
attention of manufacturers of two wheel vehicles (mo<strong>to</strong>rcycles, scooters and mopeds) who<br />
are developing FFVs versions that are expected <strong>to</strong> reach the market soon.<br />
3.2.3. The impact of new drive chain technologies<br />
Compared <strong>to</strong> current average vehicle performance, considerable improvements are possible<br />
in drive chain technologies and their respective e�ciencies and emission pro�les. IEA does<br />
project that in a timeframe <strong>to</strong>wards 2030, increased vehicle e�ciency will play a signi�cant<br />
role in slowing down the growth in demand for transport fuels. Such steps can be achieved<br />
with so-called hybrid vehicles which make use of combined power supply of internal<br />
combustion engine and an electric mo<strong>to</strong>r. Current models on the market, if optimised<br />
for <strong>ethanol</strong> use, could deliver a fuel economy of about 16 km/litre of fuel. With further<br />
technology re�nements, which could include direct injection and regenerative breaking,<br />
fuel <strong>ethanol</strong> economy of 24 km/litre may be possible. Such operating conditions, can also<br />
deliver very low concentration of emissions.<br />
<strong>Sugarcane</strong> <strong>ethanol</strong> 149
Chapter 6<br />
�e use of <strong>ethanol</strong> in heavy-duty diesel fuelled applications is not easy. But the well established<br />
experience with <strong>ethanol</strong>-fuelled buses in Sweden, which started in the mid-nineties, and<br />
recent research with dual-fuel use (diesel is used in combination with <strong>ethanol</strong> but each<br />
fuel is injected individually in the combustion chamber according <strong>to</strong> a preset electronically<br />
controlled engine map) indicate interesting possibilities with regard <strong>to</strong> reducing both diesel<br />
use and emissions.<br />
Drive chain technologies that may make a considerable inroad in the coming decades, such<br />
as electric vehicles and serial hybrids, may however have a profound impact on vehicle<br />
e�ciency and, <strong>to</strong> some extent, a dampening e�ect on the growth of transport fuel demand.<br />
Penetration of electric vehicles (cars, mo<strong>to</strong>rcycles and mopeds) or the use of plug-in hybrids<br />
that could be connected <strong>to</strong> the grid is still uncertain. Developments in battery technology<br />
are rapid though and electric s<strong>to</strong>rage capacity, charging time and power <strong>to</strong> weight ratios are<br />
continuously improved. When such improved technology is especially deployed in hybrid<br />
cars, the net e�ect will simply be a reduction of fuel demand. However, when deployed as<br />
plug-in hybrid, part of the fuel demand can be replaced by electricity. �is could reduce the<br />
growth in demand for (liquid) transport fuels down more quickly than currently assumed<br />
in various studies.<br />
In case Fuel Cell Vehicles (FCVs) become commercially available, this may mean a boost for<br />
the use hydrogen as fuel. Although the projected overall ‘well-<strong>to</strong>-wheel’ potential e�ciency<br />
of e.g. natural gas <strong>to</strong> hydrogen or biomass <strong>to</strong> hydrogen for use in a FCV is very good<br />
(Hamelinck and Faaij, 2006), it is highly uncertain <strong>to</strong> what extent the required hydrogen<br />
distribution infrastructure may be available in the coming decades. Important barriers are<br />
the currently high costs of FCVs and the high investment costs of hydrogen infrastructure.<br />
Most scenarios on the demand for transport fuels <strong>to</strong>wards 2030 project only a marginal<br />
role for hydrogen.<br />
Nevertheless, the speed of penetration of such more advanced drive chains in the market<br />
and the new infrastructure they require, is uncertain and the available projections for<br />
demand of liquid transport fuels indicate that we may be looking at a doubling of demand<br />
halfway this century. Also, the overall economic and environmental performance of the use<br />
of electricity and hydrogen for transport depends heavily on the primary energy source and<br />
overall chain e�ciency.<br />
Hybrid vehicles in the transport sec<strong>to</strong>r and urban services seem <strong>to</strong> be at present stage a<br />
more viable alternative than FCV for the same applications. Not only is this technology more<br />
advanced in terms of commercial use but also it has many practical advantages in terms of<br />
cost and fuel infrastructure (Kruithof, 2007). Sweden has been leading the development<br />
of hybrid buses and trucks equipped with electric mo<strong>to</strong>r and <strong>ethanol</strong> engine. Commercial<br />
use of this type of vehicles could occur by 2010 setting a new benchmark for sustainable<br />
<strong>ethanol</strong> use.<br />
150 <strong>Sugarcane</strong> <strong>ethanol</strong>
4. Future <strong>ethanol</strong> markets<br />
Demand for bio<strong>ethanol</strong> for transport<br />
Future <strong>ethanol</strong> markets could be characterized by a diverse set of supplying and producing<br />
regions. From the current fairly concentrated supply (and demand) of <strong>ethanol</strong>, a future<br />
international market could evolve in<strong>to</strong> a truly global market, supplied by many producers,<br />
resulting in stable and reliable biofuel sources. �is balancing role of an open market and<br />
trade is a crucial precondition for developing <strong>ethanol</strong> production capacities worldwide.<br />
Paramount <strong>to</strong> a solution is an orderly and de�ned schedule for elimination of subsidies,<br />
tari�s, import quotas, export taxes and non-tari� barriers in parallel with the gradual<br />
implementation of sustainable <strong>ethanol</strong> mandates. These measures will provide the<br />
necessary conditions <strong>to</strong> reduce risks and <strong>to</strong> attract investment <strong>to</strong> develop and expand<br />
sustainable production. Several di�erent e�orts <strong>to</strong> reach these goals are ongoing including<br />
multilateral, regional, and bilateral negotiations, as well as unilateral action. Public and<br />
private instruments such as standards, product speci�cations, certi�cation and improved<br />
distribution infrastructure are important for addressing technical and sustainability issues.<br />
In addition, the development of a global scheme for sustainable production combined with<br />
technical and �nancial support <strong>to</strong> facilitate compliance, could ensure that sustainability and<br />
trade agendas are complementary (Best et al., 2008).<br />
4.1. Outlook on 2 nd generation biofuels<br />
Projections that take explicitly second generation options in<strong>to</strong> account are more rare, but<br />
studies that do so come <strong>to</strong> rather di�erent outlooks, especially in the timeframe exceeding<br />
2020. Providing an assessment of studies that deal with both supply and demand of biomass<br />
and bioenergy, IPCC highlights that biomass demand could lay between 70-130 EJ in <strong>to</strong>tal,<br />
subdivided between 28-43 EJ biomass input for electricity and 45-85 EJ for biofuels (Barker<br />
and Bashmakov, 2007). Heat and biomass demand for industry are excluded in these reviews.<br />
It should also be noted that around that timeframe biomass use for electricity has become a<br />
less attractive mitigation option due <strong>to</strong> the increased competitiveness of other renewables<br />
(e.g. wind energy) and e.g. carbon capture and s<strong>to</strong>rage. (Barker and Bashmakov, 2007).<br />
In de Vries et al. (2007) (based on the analyses of Hoogwijk et al. (2005, 2008), it is indicated<br />
that the biofuel production potential around 2050 could lay between about 70 and 300 EJ<br />
fuel production capacity depending strongly on the development scenario, i.e. equivalent <strong>to</strong><br />
3,100 <strong>to</strong> 9,300 billion litres of <strong>ethanol</strong> 11 . Around that time, biofuel production costs would<br />
largely fall in the range up <strong>to</strong> 15 U$/GJ, competitive with equivalent oil prices around 50-60<br />
U$/barrel (see also Hamelinck and Faaij, 2006). A recent assessment study con�rms that<br />
such shares in the global energy supply are possible, <strong>to</strong> a large extent by using perennial<br />
11 Based on the LHV of anhydrous <strong>ethanol</strong> (22.4 MJ/litre).<br />
<strong>Sugarcane</strong> <strong>ethanol</strong> 151
Chapter 6<br />
cropping systems that produced lignocellulosic biomass, partly from non-agricultural lands<br />
and the use of biomass residues and wastes. Large <strong>change</strong>s in land use and leakage e�ects<br />
could be avoided by keeping expanding biomass production in balance with increased<br />
productivity in agriculture and lives<strong>to</strong>ck management. Such a development would however<br />
require much more sophisticated policies and e�ective safeguards and criteria in the global<br />
market (Dornburg et al., 2008).<br />
4.2. Scenario’s on <strong>ethanol</strong> demand and production<br />
Walter et al. (2008) evaluated market perspectives of fuel <strong>ethanol</strong> up <strong>to</strong> 2030, considering<br />
two alternative scenarios. �e �rst scenario re�ects constrains of <strong>ethanol</strong> production in<br />
US and Europe due <strong>to</strong> the hypothesis that large-scale production from cellulosic materials<br />
would be feasible only <strong>to</strong>wards the end of the period. In this case world production would<br />
reach 272,4 billion litres in 2030 (6 EJ), being only 8 billion litres of second generation<br />
<strong>ethanol</strong>, amount that would displace almost 10% of the estimated demand of gasoline.<br />
Scenario 2 is based on the ambitious targets of <strong>ethanol</strong> production de�ned by US government<br />
by early 2007, i.e. consumption of about 132 billion litres by 2017. �is target can only be<br />
achieved if large-scale <strong>ethanol</strong> production from cellulosic materials becomes feasible in<br />
short- <strong>to</strong> mid-term. In Scenario 2 the consumption of fuel <strong>ethanol</strong> reaches 566 billion litres<br />
in 2030 (about 13 EJ), displacing more than 20% of the demand of gasoline; 203 billion litres<br />
would be second generation <strong>ethanol</strong>.<br />
Tables 3 summarizes results of the two scenarios for di�erent regions/countries of the<br />
world. In case of EU, the substitution of 28.5% of gasoline volume basis (Scenario 1)<br />
would correspond <strong>to</strong> the displacement of 20% energy basis. By 2030, the estimated <strong>ethanol</strong><br />
consumption in EU (both scenarios) and US (scenario 2) would only be possible with FFVs<br />
or even neat <strong>ethanol</strong> vehicles.<br />
Table 3 also presents estimates of production capacity of �rst generation <strong>ethanol</strong>. Production<br />
capacity by 2030 was evaluated by Walter et al. (2008) based on the capacity available in<br />
2005 and on projections based on trends and plans. In some cases (e.g. EU) these results<br />
were adjusted <strong>to</strong> the estimates done by the IEA (2004) as well as Moreira (2006) taking in<strong>to</strong><br />
account constraints such as land availability. It is clear that without second generation <strong>ethanol</strong><br />
the relatively modest target <strong>to</strong> displace 10% of the gasoline demand in 2030 (Scenario 1), at<br />
reasonable cost, can only be accomplished fostering fuel <strong>ethanol</strong> production in developing<br />
countries. Second generation of <strong>ethanol</strong> would be vital if 20% of the gasoline demand is <strong>to</strong><br />
be replaced by biofuels in 2030 (Scenario 2), although a signi�cant contribution would have<br />
<strong>to</strong> come from conventional feeds<strong>to</strong>cks mainly from developing countries.<br />
However, the combination of lignocellulosic resources (biomass residues on shorter term<br />
and cultivated biomass on medium term) and second generation conversion technology<br />
152 <strong>Sugarcane</strong> <strong>ethanol</strong>
Demand for bio<strong>ethanol</strong> for transport<br />
Table 3. Ethanol consumption by 2030 in two different scenarios and production capacity based on<br />
conventional technologies (billion litres).<br />
Region/<br />
country<br />
Scenario 1 Gasoline<br />
displaced (%) 1<br />
o�ers a very strong perspective. Furthermore, sugarcane based <strong>ethanol</strong> has a key role<br />
<strong>to</strong> play at present and that role can be considerably expanded by improving the current<br />
operations further and by implementation cane based <strong>ethanol</strong> production <strong>to</strong> regions where<br />
considerably opportunities exist, especially <strong>to</strong> parts of Sub-Saharan Africa. For example,<br />
the e�cient use bagasse and sugar can trash with advanced co-generation technology can<br />
increase electricity output of sugar mills considerably in various countries and thus deliver<br />
a signi�cant contribution <strong>to</strong> (renewable) electricity production. Also, it seems realistic <strong>to</strong><br />
assume that sugarcane based <strong>ethanol</strong> can meet the new and stringent sustainability criteria<br />
that are expected in the global market on short term (see e.g. Smeets et al., 2008).<br />
5. Discussion and final remarks<br />
5.1. Key issues for the future markets<br />
Scenario 2 Gasoline<br />
displaced (%) 1<br />
Production<br />
capacity<br />
US 55.3 7.4 263.7 35.0 63.0<br />
EU 36.0 28.5 49.6 39.3 27.3<br />
Japan 9.3 10.0 14.3 15.0 – 2<br />
China 21.6 10.0 33.5 15.0 18.2<br />
Brazil 50.0 48.0 3 50.0 48.0 3 62.0 4<br />
ROW 5 100.2 10.0 154.9 15.0 n.c. 6<br />
1 Gasoline displaced in volume basis regarding the estimated gasoline consumption in 2030.<br />
2 It was assumed that first generation <strong>ethanol</strong> would not be produced in Japan.<br />
3 Estimates of gasoline displaced considering that the substitution ratio by 2030 would be 1 litre of<br />
gasoline = 1.25 litre of <strong>ethanol</strong>. In case of Brazil there is only one scenario.<br />
4 In this case production capacity is not the maximum, but the capacity that should be reached<br />
considering a certain path of growth.<br />
5 Rest of the World.<br />
6 n.c. = not calculated.<br />
Biofuels in 2008 is at a crossroad: the public perception and debate have <strong>to</strong> a considerable<br />
amount pushed biofuels in a corner as being expensive, not e�ective as GHG mitigation<br />
option, <strong>to</strong> have insigni�cant potential compared <strong>to</strong> global energy use, a threat for food<br />
production and environmentally dangerous. But that basic rationale for the production<br />
and use of biofuels still stands and is stronger than ever. Climate <strong>change</strong> is accepted as a<br />
<strong>Sugarcane</strong> <strong>ethanol</strong> 153
Chapter 6<br />
certainty, the supply of oil in relation <strong>to</strong> growing demand has developed in<strong>to</strong> a strategic and<br />
economic risk, with oil prices hoovering around 130 US$/barrel at the moment of writing.<br />
Furthermore, the recent food crisis has made clear how important it is that investment and<br />
capacity building reach the rural regions <strong>to</strong> improve food production capacity and make<br />
this simultaneously more sustainable. Biofuels produced <strong>to</strong>day in various OECD countries<br />
have a mediocre economic and environmental performance and many objections raised<br />
are understandable, be it overrated.<br />
However, distinguishing those biofuels from sugarcane based <strong>ethanol</strong> production and the<br />
possibilities o�ered by further improvement of that production system, as well as second<br />
generation biofuels (including <strong>ethanol</strong> production from lignocellulosic resources produced<br />
via hydrolysis) is very important. It is clear though, that future growth of the biofuel market<br />
will take place with much more emphasis on meeting multiple goals, especially avoiding<br />
con�icts on land-use, water, biodiversity and at the same time achieving good GHG<br />
performance and socio-economic bene�ts (see e.g. Hunt et al., 2007).<br />
5.2. Future outlook<br />
Projections for the production and use of biofuels di�er between various institutions.<br />
Clearly, demand for transport fuels will continue <strong>to</strong> rise over the coming decades, also with<br />
the introduction of new drive chain technology. In fact, there could be an important synergy<br />
between new drive chains (such as serial hybrid technology) and high quality biofuels with<br />
narrow speci�cations (such as <strong>ethanol</strong>), because such fuels allow for optimised performance<br />
and further decreased emissions of dust and soot, sulphur dioxide and nitrous oxides.<br />
Projections that highlight a possibly marginal role for biofuels in the future usually presume<br />
that biomass resource availability is a key constraint and that biofuel production will remain<br />
based on current technologies and crops and stay expensive (e.g. IEA, 2006, OECD/FAO,<br />
2007). Clearly, the information compiled in this chapter shows that a combination of further<br />
improved and new conversion technologies and conversion concepts (such as hydrolysis<br />
for producing sugars of ligno cellulosic materials) and use of ligno cellulosic biomass o�ers<br />
a di�erent perspective: the biomass resource basis consisting of biomass residues from<br />
forestry and agriculture, organic wastes, use of marginal and degraded lands and the possible<br />
improvement in agricultural and lives<strong>to</strong>ck e�ciency that can release lands for additional<br />
biomass production could become large enough <strong>to</strong> cover up <strong>to</strong> one third of the global<br />
energy demand, without con�icting with food production or additional use of agricultural<br />
land. Also, the economic perspectives for such second generation concepts are very strong,<br />
o�ering competitiveness with oil prices equivalent <strong>to</strong> some 55 US$/barrel around 2020.<br />
Further improved <strong>ethanol</strong> production (i.e. with improved cane varieties, more e�cient<br />
fac<strong>to</strong>ries and e�ciently use of bagasse and trash for power generation or more <strong>ethanol</strong> using<br />
hydrolysis processes) from sugarcane holds a similar strong position for the future.<br />
154 <strong>Sugarcane</strong> <strong>ethanol</strong>
5.3. Policy requirements and ways forward<br />
Demand for bio<strong>ethanol</strong> for transport<br />
It is very likely <strong>ethanol</strong> has a major role <strong>to</strong> play in the future worlds’ energy markets. �ere<br />
are uncertainties though, such as dwindling public support for biofuels and possible failure<br />
<strong>to</strong> commercialise second generation technologies on foreseeable term. In case biofuels<br />
can be developed and managed <strong>to</strong> be the large and sustainable energy carriers they can in<br />
principle become (which largely depends on the above mentioned governance issues). It is<br />
also clear that sugarcane based <strong>ethanol</strong> production is one of the key systems now with a very<br />
good future outlook. In addition, <strong>ethanol</strong> is a fuel that can easily absorbed by the market.<br />
Key preconditions for achieving the sketched desirable future outlook are:<br />
• To build on the success of current sugarcane based <strong>ethanol</strong> production and develop and<br />
implement further optimised production chains.<br />
• Remove market barriers <strong>to</strong> allow for open trade for biofuels across the globe, while at<br />
the same time securing sustainable production by adoption of broad criteria.<br />
• To enhance strong Research Development, Demonstration and Deployment e�orts with<br />
respect <strong>to</strong> advanced, second generation conversion technologies. �is concerns new,<br />
commercial stand-alone processes, but also improvements of existing infrastructure<br />
and even combinations with fossil fuels (such as co-gasi�cation of biomass with coal<br />
for production of synfuel, combined with CO2 capture and s<strong>to</strong>rage).<br />
• To develop and broaden the biomass resources base by expanding (commercial) experience<br />
with production of woody and grassy crops. Also the enhanced use of agricultural and<br />
forestry residues can play an important role, in particular on the shorter term.<br />
•<br />
To further develop, demonstrate and implement the deployment of broad sustainability<br />
criteria for biomass production, in general, and biofuels, in particular. �is can be done<br />
by means of certi�cation. Global collaboration and linking e�orts around the globe<br />
is important now <strong>to</strong> avoid a ‘proliferation of standards’ and the creation of di�erent,<br />
possible con�icting schemes.<br />
References<br />
Barker, T. and I. Bashmakov, 2007. Mitigation from a cross-sec<strong>to</strong>ral perspective, In: B. Metz, O.R. Davidson,<br />
P.R. Bosch, R. Dave and L.A. Meyer (eds.), Climate Change 2007: Mitigation contribution of Working<br />
Group III <strong>to</strong> the Fourth Assessment Report of the Intergovernmental Panel on Climate Change,<br />
Cambridge University Press, Cambridge United Kingdom and New York, USA.<br />
Best, G.J.C. Earley, A. Faaij, U. Fritsche, A. Hester, S. Hunt, T. Iida, F. Johnson, P.M. Nastari, D.E. Newman,<br />
C.A. Opal, M. Ot<strong>to</strong>, P. Read, R.E.H. Sims, S.C. Trindade, J. Bernard Tschirley and S. Zarilli, 2008.<br />
Sustainable Biofuels Consensus, Bellagio Declaration, prepared with support from the Rockefeller<br />
Foundation, April 2008, pp. 8.<br />
Damen, K., 2001. Future prospects for biofuels in Brazil - a chain analysis comparison between production<br />
of <strong>ethanol</strong> from sugarcane and m<strong>ethanol</strong> from eucalyptus on short and longer term in Sao Paulo State-,<br />
Department of Science, Technology & Society - Utrecht University, November 2001, 70 pp.<br />
<strong>Sugarcane</strong> <strong>ethanol</strong> 155
Chapter 6<br />
De Vries, B.J.M., D.P. van Vuuren and M.M. Hoogwijk, 2007. Renewable energy sources: �eir global<br />
potential for the �rst-half of the 21st century at a global level: An integrated approach. Energy Policy<br />
35: 2590-2610.<br />
Dornburg, V., A. Faaij, H. Langeveld, G. van de Ven, F. Wester, H. van Keulen, K. van Diepen, J. Ros, D.<br />
van Vuuren, G.J. van den Born, M. van Oorschot, F. Smout, H. Aiking, M. Londo, H. Moza�arian, K.<br />
Smekens, M. Meeusen, M. Banse, E. Lysen and S. van Egmond, 2008. Biomass Assessment: Assessment<br />
of global biomass potentials and their links <strong>to</strong> food, water, biodiversity, energy demand and economy<br />
– Main Report, Study performed by Copernicus Institute – Utrecht University, MNP, LEI, WUR-PPS,<br />
ECN, IVM and the Utrecht Centre for Energy Research, within the framework of the Netherlands<br />
Research Programme on Scienti�c Assessment and Policy Analysis for Climate Change. Reportno:<br />
WAB 500102012, January 2008. 85 pp. + Appendices.<br />
Faaij, A.P.C., 2006. Modern biomass conversion technologies. Mitigation and Adaptation Strategies for<br />
Global Change 11: 335-367.<br />
FAO, 2008. State of Food and Agriculture - Biofuels: prospects, risks and opportunities, Food and Agirculture<br />
Organisation of the United Nations, Rome, Italy.<br />
GBEP, 2008. A Review of the Current State of Bioenergy Development in G8 +5 Countries, Global Bioenergy<br />
Partnership, Rome, Italy.<br />
Goldemberg, J., S. Teixeira Coelho, P. Mário Nastari and O. Lucon, 2004. Ethanol learning curve – the<br />
Brazilian experience, Biomass and Bioenergy 26: 301-304.<br />
Hamelinck, C. and A. Faaij, 2006. Outlook for advanced biofuels. Energy Policy 34: 3268-3283.<br />
Hamelinck, C.N., G. van Hooijdonk and A.P.C. Faaij, 2005. Future prospects for the production of <strong>ethanol</strong><br />
from ligno-cellulosic biomass. Biomass & Bioenergy 28: 384-410.<br />
Hettinga, W.G., H.M. Junginger, S.C. Dekker, M. Hoogwijk, A.J. McAloon and K.B. Hicks, 2008.<br />
Understanding the Reductions in U.S. Corn Ethanol Production Costs: An Experience Curve Approach,<br />
Energy Policy, in press.<br />
Hoogwijk, M., A. Faaij, B. de Vries and W. Turkenburg, 2008. Global potential of biomass for energy from<br />
energy crops under four GHG emission scenarios Part B: the economic potential. Biomass & Bioenergy,<br />
in press.<br />
Hoogwijk, M., A. Faaij, B. Eickhout, B. de Vries and W. Turkenburg, 2005. Potential of biomass energy out<br />
<strong>to</strong> 2100, for four IPCC SRES land-use scenarios, Biomass & Bioenergy 29: 225-257.<br />
Hunt, S., J. Easterly, A. Faaij, C. Flavin, L. Freimuth, U. Fritsche, M. Laser, L. Lynd, J. Moreira, S. Pacca, J.L.<br />
Sawin, L. Sorkin, P. Stair, A. Szwarc and S. Trindade, 2007. Biofuels for Transport: Global Potential and<br />
Implications for Energy and Agriculture prepared by Worldwatch Institute, for the German Ministry<br />
of Food, Agriculture and Consumer Protection (BMELV) in coordination with the German Agency<br />
for Technical Cooperation (GTZ) and the German Agency of Renewable Resources (FNR), ISBN:<br />
1844074226, Published by EarthScan/James & James, April 2007336 pp.<br />
International Energy Agency, 2004. Biofuels for transport – an international perspective, O�ce of Energy<br />
E�ciency, Technology and R&D, OECD/IEA, Paris, France.<br />
International Energy Agency, 2006. World Energy Outlook 2006, IEA Paris, France.<br />
156 <strong>Sugarcane</strong> <strong>ethanol</strong>
Demand for bio<strong>ethanol</strong> for transport<br />
Junginger, M., T. Bolkesjø, D. Bradley, P. Dolzan, A. Faaij, J. Heinimö, B. Hek<strong>to</strong>r, Ø. Leistad, E. Ling, M.<br />
Perry, E. Piacente, F. Rosillo-Calle, Y. Ryckmans, P.-P. Schouwenberg, B. Solberg, E. Trømborg, A. da<br />
Silva Walter and M. de Wit, 2008. Developments in international bioenergy trade. Biomass & Bioenergy<br />
2: 717-729.<br />
Kahn Ribeiro, S., S. Kobayashi, M. Beuthe, J. Gasca, D. Greene, D.S. Lee, Y. Muromachi, P.J. New<strong>to</strong>n, S.<br />
Plotkin, D. Sperling, R. Wit and P.J. Zhou, 2007: Transport and its infrastructure. In: B. Metz, O.R.<br />
Davidson, P.R. Bosch, R. Dave and L.A. Meyer (eds.), Climate Change 2007: Mitigation contribution of<br />
Working Group III <strong>to</strong> the Fourth Assessment Report of the Intergovernmental Panel on Climate Change,<br />
Cambridge University Press, Cambridge United Kingdom and New York, USA.<br />
Kruithof, T., 2007. Drive the future, techno-economic comparison of fuel cell, serial hybrid and internal<br />
combustion engine drivechains for light duty vehicles. Copernicus Institute – Utrecht University,<br />
department of Science, Technology & Society. Report no.: NWS-I-2007-25, November 2007. 81 pp.<br />
Kutas, G., 2008. Brazil’s Sugar and Ethanol Industry: Endless Growth?. Presentation in Brussels, June 2008.<br />
Available at: www.unica.com.br.<br />
Licht, F.O., 2007. World Bio<strong>ethanol</strong> and Biofuels Report 5: 17.<br />
Macedo, I.d.C., J.E.A. Seabra and J.E.A.R. Da Silva, 2008. Green house gases emissions in the production<br />
and use of <strong>ethanol</strong> from sugarcane in Brazil: �e 2005/2006 averages and a prediction for 2020. Biomass<br />
& Bioenergy 32: 582-595.<br />
Moreira, J.R., 2006. Global biomass energy potential. Mitigation and Adaptation Strategies for Global<br />
Change 11: 313-342.<br />
OECD/FAO, 2007. Agricultural Outlook 2007-2016, Paris-France.<br />
RFA, 2008. Changing the Climate - Ethanol Industry Outlook 2008. Renewable Fuels Association, page 16.<br />
Rosillo-Calle, F. and L.A.B. Cortez, 1998. Towards Pro-Alcool II - a review of the Brazilian bio<strong>ethanol</strong><br />
programme, Biomass & Bioenergy 14: 115-124.<br />
Smeets, E., M. Junginger, A. Faaij, A. Walter, P. Dolzan and W. Turkenburg, 2008. �e sustainability of<br />
Brazilian Ethanol; an assessment of the possibilties of certi�ed production. Biomass & Bioenergy 32:<br />
781-813.<br />
Valdes, C., 2007. Ethanol demand driving the expansion of Brazil’s sugar industry. Sugar and Sweeteners<br />
Outlook/SSS-249: 31-38.<br />
Van Dam, J., M. Junginger, A. Faaij, I. Jürgens, G. Best and U. Fritsche, 2008. Overview of recent developments<br />
in sustainable biomass certi�cation. Biomass & Bioenergy 32: 749-780.<br />
Wall-Bake, J.D., M. Junginger, A, Faaij, T. Poot and A. da Silva Walter, 2008. Explaining the experience curve:<br />
Cost reductions of Brazilian <strong>ethanol</strong> from sugarcane. Biomass & Bioenergy, in press.<br />
Walter, A., F. Rosillo-Calle, P. Dolzan, E. Piacente and K. Borges da Cunha, 2008. Perspectives on fuel <strong>ethanol</strong><br />
consumption and trade. Biomass & Bioenergy 32: 730-748.<br />
WBCSD, 2004a. Mobility 2030: Meeting the Challenges <strong>to</strong> Sustainability. Available at: http://www.wbcsd.ch/<br />
WBCSD, 2004b. IEA/SMP Model Documentation and Reference Projection. Ful<strong>to</strong>n, L. and G. Eadsn (eds.).<br />
Available at: http://www.wbcsd.org/web/publications/mobility/smp-model-document.pdf.<br />
Zarrilli. S., 2006. �e emerging biofuels market: regula<strong>to</strong>ry, trade and development implications. Geneva:<br />
United NationsConference on Trade and Development (UNCTAD); 2006. Available at: /www.unctad.<br />
org/en/docs/ditcted20064_en.pdfS.<br />
<strong>Sugarcane</strong> <strong>ethanol</strong> 157
Chapter 7<br />
Biofuel conversion technologies<br />
Andre Faaij<br />
1. Introduction<br />
In the current heated societal debate about the sustainability of biofuels, usually a distinction<br />
is made between so-called ‘�rst’ and ‘second’ generation biofuels. A large number of options<br />
<strong>to</strong> produce biomass from biofuel is used or are possible (a simpli�ed overview of options is<br />
given in Figure 1). Although de�nitions di�er between publications, �rst generation biofuels<br />
typically are produced from food crops as oilseeds (rapeseed, palm oil), starch crops (cereals,<br />
maize) or sugar crops (sugar beet and sugarcane). Conversion technologies are commercial<br />
and typically feeds<strong>to</strong>ck costs dominate the overall biofuel production costs. Furthermore,<br />
Lignocellulosic<br />
biomass<br />
Sugar/starch<br />
crops<br />
Oil plants<br />
Gasification Syngas<br />
Anaerobic<br />
digestion<br />
Flash pyrolysis<br />
Hydrothermal<br />
liquefaction<br />
Hydrolysis<br />
Milling and<br />
hydrolysis<br />
Pressing or<br />
extraction<br />
Biogas<br />
Bio oil<br />
Sugar<br />
Vegetable oil<br />
Water gas shift<br />
+ separation<br />
Catalysed<br />
synthesis<br />
Purification<br />
Hydro treating<br />
and refining<br />
Fermentation<br />
Esterification<br />
Hydrogen<br />
(H 2 )<br />
M<strong>ethanol</strong><br />
(CH 3 OH)<br />
DME<br />
(CH 3 OCH 3 )<br />
FT Diesel<br />
(C x H y )<br />
SNG<br />
(CH 4 )<br />
Biodiesel<br />
(C x H y )<br />
Ethanol<br />
(CH 3 CH 2 OH)<br />
Biodiesel<br />
(alkyl esters)<br />
Bio oil<br />
(vegetable oil)<br />
Figure 1. different existing and possible biofuel production routes (Hamelinck and Faaij, 2006). This<br />
is a simplified overview; other production chains are possible for example by combining conversion<br />
pathways, e.g. combined <strong>ethanol</strong> and biogas production, <strong>ethanol</strong> production and gasification of<br />
lignine for synfuels and integrated concepts with other industrial processes (pulp & paper plants) or<br />
bio refineries.<br />
<strong>Sugarcane</strong> <strong>ethanol</strong> 159
Chapter 7<br />
in particular when food crops are used grown in temperate <strong>climate</strong>s (i.e. the US and the<br />
EU), costs are typically high due <strong>to</strong> high feeds<strong>to</strong>ck costs and the net overall avoided GHG<br />
emissions range between 20-50% compared <strong>to</strong> conventional gasoline or diesel (Ful<strong>to</strong>n, 2004,<br />
Hunt et al., 2007). Another constraint is that such food crops need <strong>to</strong> be produced on better<br />
quality land and increased demand directly competes with food markets. �is has recently<br />
led <strong>to</strong> a wide range of estimates on the presumed impact of biofuel production on food prices<br />
(FAO, 2008), ranging between 3 up <strong>to</strong> 75%. However, sugarcane based <strong>ethanol</strong> production<br />
is a notable exception <strong>to</strong> these key concerns. Overall production costs as achieved in Brazil<br />
are competitive without subsidies, net GHG balance achieves 80-90% reduction and sugar<br />
prices have remained constant or have decreased slightly over the past years, despite strong<br />
increases in <strong>ethanol</strong> production from sugarcane.<br />
Palm oil, in turn, although far less important as feeds<strong>to</strong>ck for biofuel production has been<br />
at the centre of the sustainability debate, because it’s production is directly linked <strong>to</strong> loss<br />
of rainforest and peat lands in South-East Asia. Nevertheless, palm oil is an e�cient and<br />
high yield crop <strong>to</strong> produce vegetal oil (Ful<strong>to</strong>n, 2004). Recently, interest in Jatropha, a oil<br />
crop that can be grown in semi-arid conditions is growing, but commercial experience is<br />
very limited <strong>to</strong> date.<br />
Second generation biofuels are not commercially produced at this stage, although in various<br />
countries demonstration projects are ongoing. 2 nd generation biofuels are <strong>to</strong> be produced<br />
from lignocellulosic biomass. In lignocellulose, typically translated as biomass from woody<br />
crops or grasses and residue materials such as straw, sugars are chemically bound in chains<br />
and cannot be fermented by conventional micro-organisms used for production of <strong>ethanol</strong><br />
from sugars and the type of sugars are di�erent than from starch or sugar crops. In addition,<br />
woody biomass contains (variable) shares of lignine, that cannot be converted <strong>to</strong> sugars.<br />
�us, more complex conversion technology is needed for <strong>ethanol</strong> production. Typical<br />
processes developed include advanced pre-treatment and enzymatic hydrolysis, <strong>to</strong> release<br />
individual sugars. Also fermentation of C5 instead of C6 sugars is required. �e other key<br />
route being developed is gasi�cation of lignocellulosic biomass, subsequent production of<br />
clean syngas that can be used <strong>to</strong> produce a range of synthetic biofuels, including m<strong>ethanol</strong>.<br />
DME and synthetic hydrocarbons (diesel). Because lignocellulosic biomass can origin from<br />
residue streams and organic wastes (that do in principle not lead <strong>to</strong> extra land-use when<br />
utilised), from trees and grasses that can also be grown on lower quality land (including<br />
degraded and marginal lands), it is thought that the overall potential of such routes is<br />
considerably larger on longer term than for 1 st generation biofuels. Also, the inherently<br />
more extensive cultivation methods lead <strong>to</strong> very good net GHG balances (around 90% net<br />
avoided emissions) and ultimatly, they are thought <strong>to</strong> deliver competitive biofuels, due <strong>to</strong><br />
lower feeds<strong>to</strong>ck costs, high overall chain e�ciency, net energy yield per hectare, assuming<br />
large scale conversion.<br />
160 <strong>Sugarcane</strong> <strong>ethanol</strong>
Biofuel conversion technologies<br />
�is chapter gives an overview of the options <strong>to</strong> produce fuels from biomass, addressing<br />
current performance and the possible technologies and respective performance levels on<br />
longer term. It focuses on the main currently deployed routes <strong>to</strong> produce biofuels and<br />
on the key chains that are currently pursued for production of 2 nd generation biofuels.<br />
Furthermore, an outlook on future biomass supplies is described in section 2, including<br />
a discussion of the impact of sustainability criteria and main determining fac<strong>to</strong>rs and<br />
uncertainties. �e chapter is �nalized with a discussion of projections of the possible longer<br />
term role of biofuels on a global scale and the respective contribution of �rst and second<br />
generation biofuels.<br />
2. Long term potential for biomass resources.<br />
�is section discusses a integral long term outlook on the potential global biomass resource<br />
base, including the recent sustainability debate and concerns. �is assessment covered on<br />
global biomass potential estimates, focusing on the various fac<strong>to</strong>rs a�ecting these potentials,<br />
such as food supplies, water use, biodiversity, energy demands and agro-economics<br />
(Dornburg et al., 2008). �e assessment focused on the relation between estimated biomass<br />
potentials and the availability and demand of water, the production and demand of food,<br />
the demand for energy and the in�uence on biodiversity and economic mechanisms.<br />
�e biomass potential, taken in<strong>to</strong> account the various uncertainties as analysed in this study,<br />
consists of three main categories of biomass:<br />
1. Residues from forestry and agriculture and organic waste, which in <strong>to</strong>tal represent<br />
between 40 - 170 EJ/yr, with a mean estimate of around 100 EJ/yr. �is part of the<br />
potential biomass supplies is relatively certain, although competing applications may<br />
push the net availability for energy applications <strong>to</strong> the lower end of the range. �e latter<br />
needs <strong>to</strong> be better unders<strong>to</strong>od, e.g. by means of improved models including economics<br />
of such applications.<br />
2. Surplus forestry, i.e. apart from forestry residues an additional amount about 60-100<br />
EJ/yr of surplus forest growth is likely <strong>to</strong> be available.<br />
3. Biomass produced via cropping systems:<br />
a. A lower estimate for energy crop production on possible surplus good quality<br />
agricultural and pasture lands, including far reaching corrections for water scarcity,<br />
land degradation and new land claims for nature reserves represents an estimated<br />
120 EJ/yr (‘with exclusion of areas’ in Figure 2).<br />
b. �e potential contribution of water scarce, marginal and degraded lands for energy<br />
crop production, could amount up <strong>to</strong> an additional 70 EJ/yr. �is would comprise<br />
a large area where water scarcity provides limitations and soil degradation is more<br />
severe and excludes current nature protection areas from biomass production (‘no<br />
exclusion’ in Figure 2).<br />
c. Learning in agricultural technology would add some 140 EJ/yr <strong>to</strong> the above mentioned<br />
potentials of energy cropping.<br />
<strong>Sugarcane</strong> <strong>ethanol</strong> 161
Chapter 7<br />
�e three categories added <strong>to</strong>gether lead <strong>to</strong> a biomass supply potential of up <strong>to</strong> about<br />
500 EJ.<br />
Energy demand models calculating the amount of biomass used if energy demands are<br />
supplied cost-e�ciently at di�erent carbon tax regimes, estimate that in 2050 about 50-250<br />
EJ/yr of biomass are used. At the same time, scenario analyses predict a global primary energy<br />
use of about 600 – 1040 EJ/yr in 2050 (the two right columns of Figure 2). Keep in mind that<br />
food demand of around 9 billion people in 2050 are basically met in those scenario’s.<br />
EJ/year<br />
1,600<br />
1,000<br />
800<br />
600<br />
400<br />
200<br />
0<br />
High<br />
range<br />
Medium<br />
range<br />
Low range<br />
Biomass potentials<br />
review studies<br />
'ultimate' technical potential<br />
Learning in<br />
agricultural<br />
technology<br />
No exclusion<br />
With exclusion<br />
of areas<br />
Surplus forestry<br />
Residues<br />
Biomass potentials<br />
analysis this study<br />
Range<br />
studies<br />
Modelled bioenergy<br />
demand<br />
Figure 2. Comparison of biomass supply potentials in the review studies and in this study with the<br />
modelled demand for biomass and the <strong>to</strong>tal world energy demand, all for 2050 (Dornburg et al.,<br />
2008). EJ = Exajoule (current global energy use amounts about 470 EJ at present). The first bar from<br />
the left represents the range of biomass energy potentials found in different studies, the second<br />
presents the results generated in (Dornburg et al., 2008), taking a variety of sustainability criteria<br />
in<strong>to</strong> account (such as water availability, biodiversity protection and soil quality), the third bar shows<br />
currently available estimates of biomass demand for energy from long term scenario studies and the<br />
fourth bar shows the range of projections of <strong>to</strong>tal global energy use in 2050.<br />
162 <strong>Sugarcane</strong> <strong>ethanol</strong><br />
Range<br />
WEA<br />
Total world<br />
energy demands
Biofuel conversion technologies<br />
In principle, biomass potentials are likely <strong>to</strong> be su�cient <strong>to</strong> allow biomass <strong>to</strong> play a signi�cant<br />
role in the global energy supply system. Current understanding of the potential contribution<br />
of biomass <strong>to</strong> the future world energy supply is that the <strong>to</strong>tal technical biomass supplies<br />
could range from about 100 EJ using only residues up <strong>to</strong> an ultimate technical potential of<br />
1500 EJ/yr potential per year. �e medium range of estimates is between 300 and 800 EJ/yr<br />
(�rst column of Figure 2).<br />
�is study (Dornburg et al., 2008) has con�rmed that annual food crops may not be suited<br />
as a prime feeds<strong>to</strong>ck for bioenergy, both in size of potentials and in terms of meeting a wide<br />
array of sustainability criteria, even though annual crops can be a good alternative under<br />
certain circumstances. Perennial cropping systems, however, o�er very di�erent perspectives.<br />
�ese cannot only be grown on (surplus) agricultural and pasture lands, but also on more<br />
marginal and degraded lands, be it with lower productivity. At this stage there is still limited<br />
(commercial) experience with such systems for energy production, especially considering the<br />
more marginal and degraded lands and much more development, demonstration (supported<br />
by research) is needed <strong>to</strong> develop feasible and sustainable systems suited for very di�erent<br />
settings around the globe. �is is a prime priority for agricultural policy.<br />
As summarized, the size of the biomass resource potentials and subsequent degree of<br />
utilisation depend on numerous fac<strong>to</strong>rs. Part of those fac<strong>to</strong>rs are (largely) beyond policy<br />
control. Examples are population growth and food demand. Fac<strong>to</strong>rs that can be more<br />
strongly in�uenced by policy are development and commercialization of key technologies<br />
(e.g. conversion technology that makes production of fuels from lignocellulosic biomass and<br />
perennial cropping systems more competitive), e.g. by means of targeted RD&D strategies.<br />
Other areas are:<br />
• Sustainability criteria, as currently de�ned by various governments and market<br />
parties.<br />
• Regimes for trade of biomass and biofuels and adoption of sustainability criteria (typically<br />
<strong>to</strong> be addressed in the international arena, for example via the WTO).<br />
• Infrastructure; investments in infrastructure (agriculture, transport and conversion) is<br />
still an important fac<strong>to</strong>r in further deployment of bioenergy.<br />
• Modernization of agriculture; in particular in Europe, the Common Agricultural Policy<br />
and related subsidy instruments allow for targeted developments of both conventional<br />
agriculture and second generation bioenergy production. Such sustainable developments<br />
are however crucial for many developing countries and are a matter for national<br />
governments, international collaboration and various UN bodies.<br />
• Nature conservation; policies and targets for biodiversity protection do determine <strong>to</strong> what<br />
extent nature reserves are protected and expanded and set standards for management<br />
of other lands.<br />
•<br />
Regeneration of degraded lands (and required preconditions), is generally not attractive<br />
for market parties and requires government policies <strong>to</strong> be realized.<br />
<strong>Sugarcane</strong> <strong>ethanol</strong> 163
Chapter 7<br />
Current insights provide clear leads for further steps for doing so. In the criteria framework<br />
as de�ned currently by several governments, in roundtables and by NGO’s, it is highlighted<br />
that a number of important criteria require further research and design of indica<strong>to</strong>rs and<br />
veri�cation procedures. �is is in particular the case for <strong>to</strong> the so-called ‘macro-themes’<br />
(land-use <strong>change</strong>, biodiversity, macro-economic impacts) and some of the more complex<br />
environmental issues (such as water use and soil quality). Sustainability of biofuels and<br />
ongoing development around de�ning criteria and deployment of certi�cation is discussed<br />
in Chapter 5 of this book by Neves do Amaral.<br />
3. Technological developments in biofuel production<br />
�e previous section highlights the importance of lignocellulosic resources for achieving<br />
good environmental performance and reducing the risks of competition for land and with<br />
food production. �is implies that di�erent technologies are required <strong>to</strong> produce liquid<br />
fuels, compared <strong>to</strong> the currently dominant use of annual crops as maize and rapeseed.<br />
<strong>Sugarcane</strong> is however a notable exception given it’s very high productivity, low production<br />
costs and good energy and GHG balance (Macedo et al., 2004; Smeets et al., 2008).<br />
�ree main routes can be distinguished <strong>to</strong> produce transportation fuels from biomass:<br />
gasi�cation can be used <strong>to</strong> produce syngas from lignocellulosic biomass that can be<br />
converted <strong>to</strong> m<strong>ethanol</strong>, Fischer-Tropsch liquids, DiMethylEther (DME) and hydrogen.<br />
Production of <strong>ethanol</strong> can take place via direct fermentation of sugar and starch rich<br />
biomass, the most utilized route for production of biofuels <strong>to</strong> date, or this can be preceded<br />
by hydrolysis processes <strong>to</strong> convert lignocellulosic biomass <strong>to</strong> sugars �rst. Finally, biofuels<br />
can be produced via extraction from oil seeds (vegetal oil from e.g. rapeseed or palm oil),<br />
which can be esteri�ed <strong>to</strong> produce biodiesel.<br />
Other conversion routes and fuels are possible (such as production of butanol from sugar or<br />
starch crops) and production of biogas via fermentation. �e above mentioned routes have<br />
however so far received most attention in studies and Research and Demonstration e�orts.<br />
3.1. M<strong>ethanol</strong>, hydrogen and hydrocarbons via gasification<br />
M<strong>ethanol</strong> (MeOH), hydrogen (H 2 ) and Fischer Tropsch synthetic hydrocarbons (especially<br />
diesel), DME (DiMethylEther) and SNG (Synthetic Natural Gas) can be produced from<br />
biomass via gasi�cation. All routes need very clean syngas before the secondary energy<br />
carrier is produced via relatively conventional gas processing methods. Here, focus lays on<br />
the �rst three fuels mentioned.<br />
Several routes involving conventional, commercial, or advanced technologies under<br />
development, are possible. Figure 3 pictures a generic conversion �owsheet for this category<br />
of processes. A train of processes <strong>to</strong> convert biomass <strong>to</strong> required gas speci�cations precedes<br />
164 <strong>Sugarcane</strong> <strong>ethanol</strong>
Biofuel conversion technologies<br />
the m<strong>ethanol</strong> or FT reac<strong>to</strong>r, or hydrogen separation. �e gasi�er produces syngas, a mixture<br />
of CO and H 2 , and a few other compounds. �e syngas then undergoes a series of chemical<br />
reactions. �e equipment downstream of the gasi�er for conversion <strong>to</strong> H 2 , m<strong>ethanol</strong> or<br />
FT diesel is the same as that used <strong>to</strong> make these products from natural gas, except for<br />
the gas cleaning train. A gas turbine or boiler, and a steam turbine optionally employ the<br />
unconverted gas fractions for electricity co-production (Hamelinck et al., 2004).<br />
So far, commercial biofuels production via gasi�cation does not take place, but interest<br />
is on the rise and development and demonstration e�orts are ongoing in several OECD<br />
countries.<br />
Overall energetic e�ciencies of relatively ‘conventional’ production facilities, could be close <strong>to</strong><br />
60% (on a scale of about 400 MW th input). Deployment on large scale (e.g over 1000 MW th )<br />
is required <strong>to</strong> bene�t maximally from economies of scale, which are inherent <strong>to</strong> this type<br />
of installations. Such capacities are typical for coal gasi�cation. �e use of coal gasi�ers and<br />
feeding of pre-treated biomass (e.g. via <strong>to</strong>rrefaction or pyrolysis oils) could prove one of the<br />
shorter term options <strong>to</strong> produce 2 nd generation biofuels e�ciently. �is conversion route<br />
has a strong position from both e�ciency and economic perspective (Hamelinck et al., 2004;<br />
Hamelinck and Faaij, 2002; Tijmensen et al, 2002; Williams et al., 1995). Generic performance<br />
ranges resulting from various pre-engineering studies are reported in Figure 3.<br />
�e �ndings of the previously published papers can be summarised as follows: gasi�cationbased<br />
fuel production systems that apply pressurised gasi�ers have higher joint fuel and<br />
electricity energy conversion e�ciencies than atmospheric gasi�er-based systems. �e <strong>to</strong>tal<br />
e�ciency is also higher for once-through con�gurations, than for recycling con�gurations<br />
that aim at maximising fuel output. �is e�ect is strongest for FT production, where (costly)<br />
syngas recycling not only introduces temperature and pressure leaps, but also ‘material leaps’<br />
by reforming part of the product back <strong>to</strong> syngas. For m<strong>ethanol</strong> and hydrogen, however,<br />
Biomass<br />
Drying and<br />
chipping<br />
Gasification and<br />
gas cleaning<br />
Recycle<br />
Reforming, shifting,<br />
CO 2 separation<br />
Catalysis,<br />
separation<br />
Separation<br />
Catalysis,<br />
separation<br />
Gas turbine or boiler<br />
Steam turbine<br />
Refining<br />
M<strong>ethanol</strong><br />
Hydrogen<br />
FT diesel<br />
Electricity<br />
Figure 3. Generic process scheme for production of synthetic biofuels via gasification (Hamelinck<br />
and Faaij, 2006).<br />
<strong>Sugarcane</strong> <strong>ethanol</strong> 165
Chapter 7<br />
maximised fuel production, with little or no electricity co-production, generally performs<br />
economically somewhat better than once-through concepts.<br />
Hot (dry) gas cleaning generally improves the <strong>to</strong>tal e�ciency, but the economical e�ects are<br />
ambivalent, since the investments also increase. Similarly, CO 2 removal does increase the<br />
<strong>to</strong>tal e�ciency (and in the FT reaction also the selectivity), but due <strong>to</strong> the accompanying<br />
increase in investment costs this does not decrease the product costs. �e bulk of the capital<br />
investment is in the gasi�cation and oxygen production system, syngas processing and<br />
power generation units. �ese parts of the investment especially pro�t from cost reductions<br />
at larger scales. Also, combinations with enriched air gasi�cation (eliminating the expensive<br />
oxygen production assumed for some m<strong>ethanol</strong> and hydrogen concepts) may reduce costs<br />
further.<br />
Several technologies considered here are not yet fully proven or commercially available.<br />
Pressurised (oxygen) gasi�ers still need further development. At present, only a few<br />
pressurised gasi�ers, operating at relatively small scale, have proved <strong>to</strong> be reliable.<br />
Consequently, the reliability of cost data for large-scale gasi�ers is uncertain. A very critical<br />
step in all thermal systems is gas cleaning. It still has <strong>to</strong> be proven whether the (hot) gas<br />
cleaning section is able <strong>to</strong> meet the strict cleaning requirements for reforming, shi� and<br />
synthesis. Liquid phase reac<strong>to</strong>rs (m<strong>ethanol</strong> and FT) are likely <strong>to</strong> have better economies of<br />
scale. �e development of ceramic membrane technology is crucial <strong>to</strong> reach the projected<br />
hydrogen cost level. For FT diesel production, high CO conversion, either once through<br />
or a�er recycle of unconverted gas, and high C5+ selectivity are important for high overall<br />
energy e�ciencies. Several units may be realised with higher e�ciencies than considered<br />
in this paper: new catalysts and carrier liquids could improve liquid phase m<strong>ethanol</strong> single<br />
pass e�ciency. At larger scales, conversion and power systems (especially the combined<br />
cycle) have higher e�ciencies, further stressing the importance of achieving economies of<br />
scale for such concepts.<br />
3.2. Production of <strong>ethanol</strong> from sugarcane<br />
Ethanol production from sugarcane has established a strong position in Brazil and increasingly<br />
in other countries in tropical regions (such as India, China and various countries in Sub-<br />
Saharan Africa). Production costs of <strong>ethanol</strong> in Brazil have steadily declined over the past<br />
few decades and have reached a point where <strong>ethanol</strong> is competitive with production costs of<br />
gasoline (Wall-Bake et al., 2008). As a result, bio<strong>ethanol</strong> is no longer �nancially supported<br />
in Brazil and competes openly with gasoline.<br />
Large scale production facilities, better use of bagasse and trash residues from sugarcane<br />
production e.g. with advanced (gasi�cation based) power generation or hydrolysis techniques<br />
(see below) and further improvements in cropping systems, o�er further perspectives for<br />
sugarcane based <strong>ethanol</strong> production.<br />
166 <strong>Sugarcane</strong> <strong>ethanol</strong>
Biofuel conversion technologies<br />
Improvement options for sugarcane based <strong>ethanol</strong> production are plentiful (Damen, 2001;<br />
Groen, 1999). It is expected that the his<strong>to</strong>ric cost decreases and productivity increments<br />
will continue. An analysis of his<strong>to</strong>ric and potential future improvements in economic<br />
performance of <strong>ethanol</strong> production in Brazil (Wall Bake et al., 2008) concludes that if<br />
improvements in sugarcane yield, logistics (e.g. green can harvesting techniques and<br />
utilisation of sugarcane trash), overall e�ciency improvement in the sugar mills and <strong>ethanol</strong><br />
production (e.g. by full electri�cation and advanced distillation technology) as well as the<br />
use of hydrolysis technology for conversion of bagasse and trash <strong>to</strong> <strong>ethanol</strong>, <strong>ethanol</strong> yields<br />
per hectare of land may even be tripled compared <strong>to</strong> current average production.<br />
�e key limitations for sugarcane production are climatic and the required availability of<br />
good quality soils with su�cient and the right rainfall patterns.<br />
3.3. Ethanol from (ligno)-cellulosic biomass<br />
Hydrolysis of cellulosic (e.g. straw) and lignocellulosic (woody) biomass can open the way<br />
<strong>to</strong>wards low cost and e�cient production of <strong>ethanol</strong> from these abundant types of biomass.<br />
�e conversion is more di�cult than for sugar and starch because from lignocellulosic<br />
materials, �rst sugars need <strong>to</strong> be produced via hydrolysis. Lignocellulosic biomass requires<br />
pretreatment by mechanical and physical actions (e.g. steam) <strong>to</strong> clean and size the biomass,<br />
and destroy its cell structure <strong>to</strong> make it more accessible <strong>to</strong> further chemical or biological<br />
treatment. Also, the lignin part of the biomass is removed, and the hemicellulose is hydrolysed<br />
(sacchari�ed) <strong>to</strong> monomeric and oligomeric sugars. �e cellulose can then be hydrolysed <strong>to</strong><br />
glucose. Also C5 sugars are formed, which require di�erent yeasts <strong>to</strong> be converted <strong>to</strong> <strong>ethanol</strong>.<br />
�e sugars are fermented <strong>to</strong> <strong>ethanol</strong>, which is <strong>to</strong> be puri�ed and dehydrated. Two pathways<br />
are possible <strong>to</strong>wards future processes: a continuing consolidation of hydrolysis-fermentation<br />
reactions in fewer reac<strong>to</strong>r vessels and with fewer micro organisms, or an optimisation of<br />
separate reactions. As only the cellulose and hemicellulose can be used in the process, the<br />
lignin is used for power production (Figure 4).<br />
Biomass<br />
Chipping<br />
Hemicellulose<br />
hydrolysis<br />
Enzyme growth<br />
Cellulose<br />
hydrolysis<br />
Fermentation<br />
Gas turbine or boiler<br />
Steam turbine<br />
Distillation<br />
Ethanol<br />
Electricity<br />
Figure 4. Generic process scheme for the production of <strong>ethanol</strong> from lignocellulosic biomass.<br />
<strong>Sugarcane</strong> <strong>ethanol</strong> 167
Chapter 7<br />
To date, acid treatment is an available process, which is so far relatively expensive and<br />
ine�cient. Enzymatic treatment is commercially unproven but various test facilities have<br />
been built in North America and Sweden. �e development of various hydrolysis techniques<br />
has gained major attention over the past 10 years or so, particularly in Sweden and the<br />
United States. Because breakthroughs seem <strong>to</strong> be necessary on a rather fundamental level,<br />
it is relatively uncertain how fast attractive performance levels can be achieved (Hamelinck<br />
et al., 2005).<br />
Assuming, however, that mentioned issues are resolved and <strong>ethanol</strong> production is combined<br />
with e�cient electricity production from unconverted wood fractions (lignine in particular),<br />
<strong>ethanol</strong> costs could come close <strong>to</strong> current gasoline prices (Lynd et al., 2005): as low as 12<br />
Euroct/litre assuming biomass costs of about 2 Euro/GJ. Overall system e�ciencies (fuel +<br />
power output) could go up <strong>to</strong> about 70% (LHV).<br />
It should be noted though that the assumed conversion extent of (hemi)cellulose <strong>to</strong> <strong>ethanol</strong><br />
by hydrolysis fermentation is close <strong>to</strong> the s<strong>to</strong>ichiometric maximum. �ere is only little<br />
residual material (mainly lignin), while the steam demand for the chosen concepts is high.<br />
�is makes the application of BIG/CC unattractive at 400MWHHV. Developments of pretreatment<br />
methods and the gradual ongoing reac<strong>to</strong>r integration are independent trends and<br />
it is plausible that at least some of the improved performance will be realised in the mediumterm.<br />
�e projected long-term performance depends on development of technologies that<br />
have not yet passed labora<strong>to</strong>ry stage, and that may be commercially available earlier or<br />
later than 20 years from now. �is would mean either a more attractive <strong>ethanol</strong> product<br />
cost in the medium-term, or a less attractive cost in the long-term. �e investment costs<br />
for advanced hemicellulose hydrolysis methods is still uncertain. Continuing development<br />
of new micro-organisms is required <strong>to</strong> ensure fermentation of xylose and arabinose, and<br />
decrease the cellulase enzyme costs.<br />
�e hydrolysis technology can also boost the competitiveness of existing production facilities<br />
(e.g. by converting available crop and process residues), which provides an important market<br />
niche on short term.<br />
Table 1. gives an overview of estimates for costs of various fuels that can be produced from<br />
biomass (Faaij, 2006). A distinction is made between performance levels on the short and<br />
on the longer term. Generally spoken, the economy of ‘traditional’ fuels like Rapeseed<br />
MethylEsther and <strong>ethanol</strong> from starch and sugar crops in moderate <strong>climate</strong> zones is poor<br />
at present and unlikely <strong>to</strong> reach competitive price levels in the longer term. Also, the<br />
environmental impacts of growing annual crops are not as good as perennials because per<br />
unit of product considerable higher inputs of fertilizers and agrochemicals are needed. In<br />
addition, annual crops on average need better quality land than perennials <strong>to</strong> achieve good<br />
productivities.<br />
168 <strong>Sugarcane</strong> <strong>ethanol</strong>
Biofuel conversion technologies<br />
Production of m<strong>ethanol</strong> (and DME), hydrogen, Fischer-Tropsch liquids and <strong>ethanol</strong> produced<br />
from lignocellulosic biomass that o�er good perspectives and competitive fuel prices in<br />
the longer term (e.g. around 2020). Partly, this is because of the inherent lower feeds<strong>to</strong>ck<br />
prices and versatility of producing lignocellulosic biomass under varying circumstances.<br />
Section 2 highlighted that a combination of biomass residues and perennial cropping<br />
systems on both marginal and better quality lands could supply a few hundred EJ by midcentury<br />
in a competitive cost range between 1-2 Euro/GJ (see also Hoogwijk et al., 2005,<br />
2008). Furthermore, as discussed in this paper, the (advanced) gasi�cation and hydrolysis<br />
technologies under development have the inherent improvement potential for e�cient and<br />
competitive production of fuels (sometimes combined with co-production of electricity).<br />
Inherent <strong>to</strong> the advanced conversion concepts, it is relatively easy <strong>to</strong> capture (and subsequently<br />
s<strong>to</strong>re) a signi�cant part of the CO 2 produced during conversion at relatively low additional<br />
costs. �is is possible for <strong>ethanol</strong> production (where partially pure CO 2 is produced) and<br />
for gasi�cation concepts. Production of syngas (both for power generation and for fuels)<br />
in general allows for CO 2 removal prior <strong>to</strong> further conversion. For FT production about<br />
half of the carbon in the original feeds<strong>to</strong>ck (coal, biomass) can be captured prior <strong>to</strong> the<br />
conversion of syngas <strong>to</strong> FT-fuels. �is possibility allows for carbon neutral fuel production<br />
when mixtures of fossil fuels and biomass are used and negative emissions when biomass<br />
is the dominant or sole feeds<strong>to</strong>ck. Flexible new conversion capacity will allow for multiple<br />
feeds<strong>to</strong>ck and multiple output facilities, which can simultaneously achieve low, zero or<br />
even negative carbon emissions. Such �exibility may prove <strong>to</strong> be essential in a complex<br />
transition phase of shi�ing from large scale fossil fuel use <strong>to</strong> a major share of renewables<br />
and in particular biomass.<br />
At the moment major e�orts are ongoing <strong>to</strong> demonstrate various technology concepts<br />
discussed above. Especially in the US (but also in Europe), a number of large demonstration<br />
e�orts is ongoing on production of <strong>ethanol</strong> from lignocellulosic biomass. IOGEN, a<br />
Canadian company working on enzymatic hydrolysis reported the production of 100,000<br />
litres of <strong>ethanol</strong> from agricultural residues in September 2008. Also companies in India,<br />
China and Japan are investing substantially in this technology area.<br />
Gasi�cation for production of synfuels gets support in the US and more heavily in the EU.<br />
�e development trajec<strong>to</strong>ry of the German company CHOREN (focusing on dedicated<br />
biomass gasi�cation systems for production of FT liquids) is ongoing and stands in the<br />
international spotlights. Finland and Sweden have substantial development e�orts ongoing,<br />
partly aiming for integration gasi�cation technology for synfuels in the paper & pulp<br />
industry. Furthermore, co-gasi�cation of biomass in (existing) coal gasi�ers is an important<br />
possibility. �is has for example been demonstrated in the Buggenum coal gasi�ier in the<br />
Netherlands and currently production of synfuels is targeted.<br />
<strong>Sugarcane</strong> <strong>ethanol</strong> 169
Chapter 7<br />
Table 1. Performance levels for different biofuels production routes (Faaij, 2006).<br />
Concept Energy efficiency (HHV) + energy inputs<br />
Hydrogen: via biomass gasification and<br />
subsequent syngas processing. Combined fuel<br />
and power production possible; for production<br />
of liquid hydrogen additional electricity use<br />
should be taken in<strong>to</strong> account.<br />
M<strong>ethanol</strong>: via biomass gasification and<br />
subsequent syngas processing. Combined fuel<br />
and power production possible<br />
Fischer-Tropsch liquids: via biomass gasification<br />
and subsequent syngas processing. Combined<br />
fuel and power production possible<br />
Short term Long term<br />
60% (fuel only)<br />
(+ 0.19 GJe/GJ H2 for<br />
liquid hydrogen)<br />
Ethanol from wood: production takes place 46% (fuel)<br />
via hydrolysis techniques and subsequent 4% (power)<br />
fermentation and includes integrated electricity<br />
production of unprocessed components.<br />
Ethanol from beet sugar: production via<br />
fermentation; some additional energy inputs<br />
are needed for distillation.<br />
Ethanol from sugarcane: production via<br />
cane crushing and fermentation and power<br />
generation from the bagasse. Mill size,<br />
advanced power generation and optimised<br />
energy efficiency and distillation can reduce<br />
costs further on longer term.<br />
Biodiesel RME: takes places via extraction<br />
(pressing) and subsequent esterification.<br />
M<strong>ethanol</strong> is an energy input. For the <strong>to</strong>tal<br />
system it is assumed that surpluses of straw<br />
are used for power production.<br />
55% (fuel)<br />
6% (power)<br />
(+ 0.19 GJe/GJ H2 for<br />
liquid hydrogen)<br />
55% (fuel only) 48% (fuel)<br />
12% (power)<br />
45% (fuel only) 45% (fuel)<br />
10% (power<br />
43% (fuel only)<br />
0.065 GJe + 0.24 GJth/<br />
GJ EtOH<br />
85 litre EtOH per <strong>to</strong>nne of<br />
wet cane,<br />
generally energy neutral<br />
with respect<br />
<strong>to</strong> power and heat<br />
53% (fuel)<br />
8% (power)<br />
43% (fuel only)<br />
0.035 GJe + 0.18 GJth/GJ<br />
EtOH<br />
95 litre EtOH per <strong>to</strong>nne<br />
of wet cane. Electricity<br />
surpluses depend on<br />
plant lay-out and power<br />
generation technology.<br />
88%; 0.01 GJe + 0.04 GJ MeOH per GJ output<br />
Efficiency power generation on shorter term: 45%, on<br />
longer term: 55%<br />
Assumed biomass price of clean wood: 2 Euro/GJ. RME cost figures varied from 20 Euro/GJ (short term) <strong>to</strong> 12<br />
Euro/GJ (longer term), for sugar beet a range of 12 <strong>to</strong> 8 Euro/GJ is assumed. All figures exclude distribution of<br />
the fuels <strong>to</strong> fueling stations.<br />
For equipment costs, an interest rate of 10%, economic lifetime of 15 years is assumed. Capacities of conversion<br />
unit are normalized on 400 MWth input on shorter term and 1000 MWth input on longer term.<br />
170 <strong>Sugarcane</strong> <strong>ethanol</strong>
Investment costs<br />
(Euro/kWth input capacity)<br />
O&M<br />
(% of inv.)<br />
Biofuel conversion technologies<br />
Estimated production costs<br />
(Euro/GJ fuel)<br />
Short term Long term Shorter term Longer term<br />
480 (+ 48 for liquefying) 360 (+ 33 for liquefying) 4 9-12 4-8<br />
690 530 4 10-15 6-8<br />
720 540 4 12-17 7-9<br />
350 180 6 12-17 5-7<br />
290 170 5 25-35 20-30<br />
100 (wide range applied<br />
depending on scale and<br />
technology applied)<br />
150 (+ 450 for power<br />
generation from straw)<br />
230 (higher costs due<br />
<strong>to</strong> more advanced<br />
equipment)<br />
110 (+ 250 for power<br />
generation from straw)<br />
2 8-12 7-8<br />
<strong>Sugarcane</strong> <strong>ethanol</strong> 171<br />
5<br />
4<br />
25-40 20-30
Chapter 7<br />
Industrial interest in those areas comes from the energy sec<strong>to</strong>r, biotechnology as well<br />
as chemical industry. Given the policy targets on (second generation) biofuels in North<br />
America and the EU, high oil prices and increased pressure <strong>to</strong> secure sustainable production<br />
of biofuels (e.g. avoiding con�icts with food production and achieve high reduction in GHG<br />
emissions), pressure on both the market and policy <strong>to</strong> commercialize those technologies is<br />
high. When turn-key processes are available is still uncertain, but such breakthroughs may<br />
be possible already around 2010.<br />
4. Energy and greenhouse gas balances of biofuels<br />
4.1. Energy yields<br />
�e energy yield per unit of land surfaces resources depends <strong>to</strong> a large extent on the crop<br />
choice and the e�ciency of the entire energy conversion route from ‘crop <strong>to</strong> drop’. �is<br />
is illustrated by the �gures in Table 2. It is important <strong>to</strong> stress that when lignocellulose is<br />
the feeds<strong>to</strong>ck of choice production is not constrained <strong>to</strong> arable land, but amounts <strong>to</strong> the<br />
sum of residues and production from degraded/marginal lands not used for current food<br />
production. Ultimately, this will be the preferred option in most cases.<br />
Table 2. Indicative ranges for biomass yield and subsequent fuel production per hectare per year<br />
for different cropping systems in different settings. Starch and sugar crops assume conversion via<br />
fermentation <strong>to</strong> <strong>ethanol</strong> and oil crops <strong>to</strong> biodiesel via esterification (commercial technology at present).<br />
The woody and grass crops require either hydrolysis technology followed by <strong>ethanol</strong> or gasification <strong>to</strong><br />
syngas <strong>to</strong> produce synthetic fuel (both not yet commercial conversion routes).<br />
Crop Biomass yield<br />
(odt/ha/yr)<br />
Wheat 4-5 ~50<br />
Maize 5-6 ~60<br />
Sugar beet 9-10 ~110<br />
Soy bean 1-2 ~20<br />
<strong>Sugarcane</strong> 5-20 ~180<br />
Palm oil 10-15 ~160<br />
Jathropha 5-6 ~60<br />
SRC temperate <strong>climate</strong> 10-15 100-180<br />
SRC tropical <strong>climate</strong> 15-30 170-350<br />
Energy grasses good conditions 10-20 170-230<br />
Perennials marginal/degraded lands 3-10 30-120<br />
Energy yield in fuel<br />
(GJ/ha/yr)<br />
172 <strong>Sugarcane</strong> <strong>ethanol</strong>
4.2. Greenhouse gas balances<br />
Biofuel conversion technologies<br />
�e net emissions over the full life cycle of biofuels – from <strong>change</strong>s in land use <strong>to</strong> combustion<br />
of fuels – that determine their impact on the <strong>climate</strong>. Research on net emissions is far<br />
from conclusive, and estimates vary widely. Calculations of net GHG emissions are highly<br />
sensitive <strong>to</strong> assumptions about system boundaries and key parameter values – for example,<br />
land use <strong>change</strong>s and their impacts, which inputs are included, such as energy embedded<br />
in agricultural machinery and how various fac<strong>to</strong>rs are weighted.<br />
�e primary reasons for di�ering results are di�erent assumptions made about cultivation,<br />
and conversion or valuation of co-products. (Larson, 2005), who reviewed multiple studies,<br />
found that the greatest variations in results arose from the allocation method chosen for<br />
co-products, and assumptions about N 2 O emissions and soil carbon dynamics. In addition,<br />
GHG savings will vary from place <strong>to</strong> place – according <strong>to</strong> existing incentives for GHG<br />
reductions, for example. And the advantages of a few biofuels (e.g. sugarcane <strong>ethanol</strong> in<br />
Brazil) are location speci�c. As a result, it is di�cult <strong>to</strong> compare across studies; however,<br />
despite these challenges, some of the more important studies point <strong>to</strong> several useful<br />
conclusions.<br />
�is analysis notwithstanding, the vast majority of studies have found that, even when all<br />
fossil fuel inputs throughout the life cycle are accounted for, producing and using biofuels<br />
made from current feeds<strong>to</strong>ck result in substantial reductions in GHG emissions relative <strong>to</strong><br />
petroleum fuels.<br />
In general, of all potential feeds<strong>to</strong>ck options, producing <strong>ethanol</strong> from maize results in<br />
the smallest decrease in overall emissions. �e greatest bene�t, meanwhile, comes from<br />
<strong>ethanol</strong> produced from sugarcane grown in Brazil (or from using cellulose or wood waste<br />
as feeds<strong>to</strong>ck). Several studies have assessed the net emissions reductions resulting from<br />
sugarcane <strong>ethanol</strong> in Brazil, and all have concluded that the bene�ts far exceed those from<br />
grain-based <strong>ethanol</strong> produced in Europe and the United States.<br />
Ful<strong>to</strong>n (2004) attributes the lower life-cycle <strong>climate</strong> impacts of Brazilian sugarcane <strong>ethanol</strong><br />
<strong>to</strong> two major fac<strong>to</strong>rs: First, cane yields are high and require relatively low inputs of fertilizer,<br />
since Brazil has better solar resources and high soil productivity. Second, almost all<br />
conversion plants use bagasse (the residue that remains a�er pressing the sugar juice from<br />
the cane stalk) for energy, and many recent plants use co-generation (heat and electricity),<br />
enabling them <strong>to</strong> feed electricity in<strong>to</strong> the grid. As such, net fossil energy requirements are<br />
near zero, and in some cases could be below zero. (In addition, less energy is required for<br />
processing because there is no need for the extra step <strong>to</strong> break down starch in<strong>to</strong> simple<br />
sugars. Because most process energy in Brazil is already renewable, this does not really<br />
play a role.)<br />
<strong>Sugarcane</strong> <strong>ethanol</strong> 173
Chapter 7<br />
According <strong>to</strong> Larson (2005), conventional grain- and oilseed-based biofuels can o�er only<br />
modest reductions in GHG emissions. �e primary reason for this is that they represent<br />
only a small portion of the above ground biomass. He estimates that, very broadly, biofuels<br />
from grains or seeds have the potential for a 20–30 percent reduction in GHG emissions<br />
per vehicle-kilometer, sugar beets can achieve reductions of 40–50 percent, and sugarcane<br />
(average in southeast Brazil) can achieve a reduction of 90 percent.<br />
Other new technologies under development also o�er the potential <strong>to</strong> dramatically increase<br />
yields per unit of land and fossil input, and further reduce life-cycle emissions. �e cellulosic<br />
conversion processes for <strong>ethanol</strong> o�ers the greatest potential for reductions because feeds<strong>to</strong>ck<br />
can come from the waste of other products or from energy crops, and the remaining parts<br />
of the plant can be used for process energy.<br />
Larson (2005) projects that future advanced cellulosic processes (<strong>to</strong> <strong>ethanol</strong>, F-T diesel, or<br />
DME) from perennial crops could bring reductions of 80–90 percent and higher. According<br />
<strong>to</strong> Ful<strong>to</strong>n et al. (2004), net GHG emissions reductions can even exceed 100 percent if the<br />
feeds<strong>to</strong>ck takes up more CO 2 while it is growing than the CO 2 -equivalent emissions released<br />
during its full life cycle (for example, if some of it is used as process energy <strong>to</strong> o�set coal-<br />
�red power).<br />
Typical estimates for reductions from cellulosic <strong>ethanol</strong> (most of which comes from<br />
engineering studies, as few large-scale production facilities exist <strong>to</strong> date) range from 70–90<br />
percent relative <strong>to</strong> conventional gasoline, according <strong>to</strong> Ful<strong>to</strong>n (2004), though the full range<br />
of estimates is far broader.<br />
Figure 5 shows the range of estimated possible reductions in emissions from wastes and<br />
other next-generation feeds<strong>to</strong>ck relative <strong>to</strong> those from current-generation feeds<strong>to</strong>ck and<br />
technologies.<br />
4.3. Chain efficiency of biofuels<br />
When the use of such ‘advanced’ biofuels (especially hydrogen and m<strong>ethanol</strong>) in advanced<br />
hybrid or Fuel Cell Vehicles (FCV’s) is considered, the overall chain (‘tree - <strong>to</strong> – tyre’)<br />
e�ciency can drastically improve compared <strong>to</strong> current bio-diesel or maize or cereal derived<br />
<strong>ethanol</strong> powered Internal Combustion Engine Vehicles; the e�ective number of kilometres<br />
that can be driven per hectare of energy crops could go up with a fac<strong>to</strong>r of 5 (from a<br />
typical current 20,000 km/ha for a middle class vehicle run with RME up <strong>to</strong> over 100,000<br />
km/ha for advanced <strong>ethanol</strong> in an advanced hybrid or FCV (Hamelinck and Faaij, 2002)).<br />
Note though, that the current exception <strong>to</strong> this performance is sugarcane based <strong>ethanol</strong><br />
production; in Brazil the better plantations yield some 8,000 litre <strong>ethanol</strong>/ha*yr, or some<br />
70,000 km/yr for a middle class vehicle at present. In the future, those �gures can improve<br />
174 <strong>Sugarcane</strong> <strong>ethanol</strong>
Reduction in CO equivalent emissions<br />
2<br />
(percent)<br />
0<br />
20<br />
40<br />
60<br />
80<br />
100<br />
120<br />
Wastes<br />
(waste oil, Fibers<br />
harvest residues, (switchgrass,<br />
sewage) poplar)<br />
Biofuel conversion technologies<br />
Figure 5. Reductions in greenhouse gas emissions per vehicle-kilometre, by feeds<strong>to</strong>ck and associated<br />
refining technology (taken from Ful<strong>to</strong>n, 2004).<br />
further due <strong>to</strong> better cane varieties, crop management and e�ciency improvement in the<br />
<strong>ethanol</strong> production facilities (Damen, 2001).<br />
Furthermore, FCV’s (and <strong>to</strong> a somewhat lesser extent advanced hybrids) o�er the additional<br />
and important bene�ts of zero or near zero emission of compounds like NO x , CO, sulphur<br />
dioxide, hydrocarbons and small dust particulates, which are <strong>to</strong> a large extent responsible for<br />
poor air quality in many urban zones in the world. Table 3 provides a quanti�cation of the<br />
range of kilometres that can be driven with di�erent biofuel-vehicle combinations expressed<br />
per hectare. �e ranges are caused by di�erent yield levels for di�erent land-types and<br />
variability and uncertainties in conversion and vehicle e�ciencies. However, overall, there<br />
are profound di�erences between �rst and second generation biofuels I favour of the latter.<br />
4.4. Future expectations on biofuels<br />
Sugars<br />
(sugar cane,<br />
beet)<br />
Starches<br />
(corn,<br />
wheat)<br />
Vegetable oils<br />
(rapeseed,<br />
sunflower seed,<br />
soybeans)<br />
�e future biofuels and speci�cally the bio<strong>ethanol</strong> market is uncertain. �ere are fundamental<br />
drivers (<strong>climate</strong>, oil prices and availability, rural development) that push for further<br />
development of biofuels. On the one hand, recent developments and public debate point<br />
<strong>to</strong>wards con�icts with land use, food markets, poor GHG performance (especially when<br />
indirect land-use <strong>change</strong>s are assumed caused by biofuel production) and, even with high<br />
oil prices, high levels of subsidy for biofuels in e.g. Europe and the United States. Recently,<br />
policy targets (as discussed in chapter 5 of this book) set for biofuels are rediscussed in<br />
the EU, as well as in China. In most key markets (EU, US, China), the role of biofuels is<br />
increasingly connected <strong>to</strong> rapid deployment of 2 nd generation technologies. �e bulk of the<br />
growth beyond 2015 or so should be realized via such routes.<br />
<strong>Sugarcane</strong> <strong>ethanol</strong> 175
Chapter 7<br />
Table 3. Distance that can be driven per hectare of feeds<strong>to</strong>ck for several combinations of fuels and<br />
engines, derived from the net energy yield and vehicle efficiency as reported in (Hamelinck and Faaij,<br />
2006). ICEV = Internal Combustion Engine Vehicle, FCV = Fuel Cell Vehicle.<br />
Feeds<strong>to</strong>ck Fuel Engine Distance (thousands km/ha)<br />
Short term Long term<br />
Lignocellulose Hydrogen ICEV 26-37 80-97<br />
FCV 44-140 189-321<br />
M<strong>ethanol</strong> ICEV 34-49 75-287<br />
FCV 68-83 113-252<br />
FT ICEV 22-38 56-167<br />
FCV 50-67 97-211<br />
Ethanol ICEV 29-30 82-238<br />
FCV 38-72 129-240<br />
Sugar beet Ethanol ICEV 15-37 57-88<br />
FCV 19-93 58-138<br />
Rapeseed RME ICEV 5-28 15-79<br />
FCV 6-84 19-137<br />
Some projections as published by the International Energy Agency (World Energy Outlook)<br />
and the OECD (Agricultural Outlook) focus on �rst generation biofuels only (even for<br />
projections <strong>to</strong> 2030 in the IEA-WEO). Biofuels meet 2.7% of world road-transport fuel<br />
demand by the end of the projection period in the Reference Scenario, up from 1% <strong>to</strong>day. In<br />
the Alternative Scenario, the share reaches 4.6%, thanks <strong>to</strong> higher demand for biofuels but<br />
lower demand for road-transport fuels in <strong>to</strong>tal. �e share remains highest in Brazil, though<br />
the pace of market penetration will be fastest in the European Union in both scenarios.<br />
�e contribution of liquid biofuels <strong>to</strong> transport energy, and even more so <strong>to</strong> global energy<br />
supply, will remain limited. By 2030, liquid biofuels are projected <strong>to</strong> still supply only 3.0-3.5<br />
percent of global transport energy demand. �is is however also due <strong>to</strong> the key assumption<br />
that 2 nd generation biofuel technology is not expected <strong>to</strong> become available <strong>to</strong> the market<br />
(IEA, 2006).<br />
In the Agricultural Outlook, similar reasoning is followed be it for a shorter time frame (up<br />
<strong>to</strong> the year 2016), focusing on 1 st generation biofuels. �e outlook focuses in this respect on<br />
the implications of biofuel production on demand for food crops. In general, a slowdown<br />
in growth is expected (OECD, 2007).<br />
Projections that take explicitly 2 nd generation options in<strong>to</strong> account are more rare, but studies<br />
that do so, come <strong>to</strong> rather di�erent outlooks, especially in the timeframe exceeding 2020.<br />
176 <strong>Sugarcane</strong> <strong>ethanol</strong>
Biofuel conversion technologies<br />
�e IPCC, providing an assessment of studies that deal with both supply and demand of<br />
biomass and bioenergy. It is highlighted that biomass demand could lay between 70 – 130 EJ<br />
in <strong>to</strong>tal, subdivided between 28-43 EJ biomass input for electricity and 45-85 EJ for biofuels<br />
(Barker and Bashmakov, 2007; Kahn Ribeiro et al., 2007). Heat and biomass demand for<br />
industry are excluded in these reviews. It should also be noted that around that timeframe<br />
biomass use for electricity has become a less attractive mitigation option due <strong>to</strong> the increased<br />
competitiveness of other renewables (e.g. wind energy) and e.g. [ and s<strong>to</strong>rage. At the same<br />
time, carbon intensity of conventional fossil transport fuels increases due <strong>to</strong> the increased<br />
use lower quality oils, tar sands and coal gasi�cation.<br />
In De Vries et al. (2007; based on the analyses of Hoogwijk et al. (2005, 2008)), it is indicated<br />
that the biofuel production potential around 2050 could lay between about 70 and 300 EJ fuel<br />
production capacity depending strongly on the development scenario. Around that time,<br />
biofuel production costs would largely fall in the range up <strong>to</strong> 15 U$/GJ, competitive with<br />
equivalent oil prices around 50-60 U$/barrel. �is is con�rmed by other by the information<br />
compiled in this chapter: it was concluded that the, sustainable, biomass resource base,<br />
without con�icting with food supplies, nature preservation and water use, could indeed be<br />
developed <strong>to</strong> a level of over 300 EJ in the �rst half of this century.<br />
5. Final remarks<br />
Biomass cannot realistically cover the whole world’s future energy demand. On the other<br />
hand, the versatility of biomass with the diverse portfolio of conversion options, makes<br />
it possible <strong>to</strong> meet the demand for secondary energy carriers, as well as bio-materials.<br />
Currently, production of heat and electricity still dominate biomass use for energy. �e<br />
question is therefore what the most relevant future market for biomass may be.<br />
For avoiding CO 2 emissions, replacing coal is at present a very e�ective way of using<br />
biomass. For example, co-�ring biomass in coal-�red power stations has a higher avoided<br />
emission per unit of biomass than when displacing diesel or gasoline with <strong>ethanol</strong> or<br />
biodiesel. However, replacing natural gas for power generation by biomass, results in levels<br />
of CO 2 mitigation similar <strong>to</strong> second generation biofuels. Net avoided GHG emissions<br />
therefore depend on the reference system and the e�ciency of the biomass production<br />
and utilisation chain. In the future, using biomass for transport fuels will gradually become<br />
more attractive from a CO 2 mitigation perspective because of the lower GHG emissions<br />
for producing second generation biofuels and because electricity production on average<br />
is expected <strong>to</strong> become less carbon-intensive due <strong>to</strong> increased use of wind energy, PV and<br />
other solar-based power generation, carbon capture and s<strong>to</strong>rage technology, nuclear energy<br />
and fuel shi� from coal <strong>to</strong> natural gas. In the shorter term however, careful strategies and<br />
policies are needed <strong>to</strong> avoid brisk allocation of biomass resources away from e�cient and<br />
e�ective utilisation in power and heat production or in other markets, e.g. food. How this<br />
is <strong>to</strong> be done optimally will di�er from country <strong>to</strong> country.<br />
<strong>Sugarcane</strong> <strong>ethanol</strong> 177
Chapter 7<br />
First generation biofuels in temperate regions (EU, North America) do not o�er a sustainable<br />
possibility in the long term: they remain expensive compared <strong>to</strong> gasoline and diesel (even at<br />
high oil prices), are o�en ine�cient in terms of net energy and GHG gains and have a less<br />
desirable environmental impact. Furthermore, they can only be produced on higher quality<br />
farmland in direct competition with food production. <strong>Sugarcane</strong> based <strong>ethanol</strong> production<br />
and <strong>to</strong> a certain extent palm oil and Jatropha oilseeds are notable exceptions <strong>to</strong> this given<br />
their high production e�ciencies and low(er) costs.<br />
Especially promising are the production via advanced conversion concepts biomass-derived<br />
fuels such as m<strong>ethanol</strong>, hydrogen, and <strong>ethanol</strong> from lignocellulosic biomass. Ethanol<br />
produced from sugarcane is already a competitive biofuel in tropical regions and further<br />
improvements are possible. Both hydrolysis-based <strong>ethanol</strong> production and production<br />
of synfuels via advanced gasi�cation from biomass of around 2 Euro/GJ can deliver high<br />
quality fuels at a competitive price with oil down <strong>to</strong> US$55/ barrel. Net energy yields for<br />
unit of land surface are high and up <strong>to</strong> a 90% reduction in GHG emissions can be achieved.<br />
�is requires a development and commercialization pathway of 10-20 years, depending very<br />
much on targeted and stable policy support and frameworks.<br />
However, commercial deployment of these technologies does not have <strong>to</strong> be postponed for<br />
such time periods. �e two key technological concepts that have shorter term opportunities<br />
(that could be seen as niches) for commercialization are:<br />
1. Ethanol: 2 nd generation can build on the 1 st generation infrastructure by being built as<br />
‘add-ons’ <strong>to</strong> existing fac<strong>to</strong>ries for utilisation of crop residues. One of the best examples<br />
is the use of bagasse and trash at sugar mills that could strongly increase the <strong>ethanol</strong><br />
output from sugarcane<br />
2. Synfuels via gasi�cation of biomass: can be combined with coal gasi�cation as currently<br />
deployed for producing synfuels (such as DME, Fischer-Tropsch and M<strong>ethanol</strong>) <strong>to</strong> obtain<br />
economies of scale and fuel �exibility. Carbon capture and s<strong>to</strong>rage can easily be deployed<br />
with minimal additional costs and energy penalties as an add-on technology.<br />
�e biomass resource base can become large enough <strong>to</strong> supply 1/3 of the <strong>to</strong>tal world’s<br />
energy needs during this century. Although the actual role of bioenergy will depend on its<br />
competitiveness with fossil fuels and on agricultural policies worldwide, it seems realistic<br />
<strong>to</strong> expect that the current contribution of bioenergy of 40-55 EJ per year will increase<br />
considerably. A range from 200 <strong>to</strong> 400 EJ may be observed looking well in<strong>to</strong> this century,<br />
making biomass a more important energy supply option than mineral oil <strong>to</strong>day. Considering<br />
lignocellulosic biomass, about half of the supplies could originate from residues and biomass<br />
production from marginal/degrade lands. �e other half could be produced on good quality<br />
agricultural and pasture lands without jeopardizing the worlds food supply, forests and<br />
biodiversity. �e key pre-condition <strong>to</strong> achieve this goal is increased agricultural land-use<br />
e�ciency, including lives<strong>to</strong>ck production, especially in developing regions. Improvement<br />
178 <strong>Sugarcane</strong> <strong>ethanol</strong>
Biofuel conversion technologies<br />
potentials of agriculture and lives<strong>to</strong>ck are substantial, but exploiting such potentials is a<br />
challenge.<br />
References<br />
Barker, T. and I. Bashmakov, 2007. Mitigation from a cross-sec<strong>to</strong>ral perspective, In: B. Metz, O.R. Davidson,<br />
P.R. Bosch, R. Dave and L.A. Meyer (eds.), Climate Change 2007: Mitigation contribution of Working<br />
Group III <strong>to</strong> the Fourth Assessment Report of the Intergovernmental Panel on Climate Change,<br />
Cambridge University Press, Cambridge United Kingdom and New York, USA.<br />
Damen, K., 2001. Future prospects for biofuels in Brazil - a chain analysis comparison between production<br />
of <strong>ethanol</strong> from sugarcane and m<strong>ethanol</strong> from eucalyptus on short and longer term in Sao Paulo State-,<br />
Department of Science, Technology & Society - Utrecht University, 70 pp.<br />
De Vries, B.J.M., D.P. van Vuuren and M.M. Hoogwijk, 2007. Renewable energy sources: �eir global<br />
potential for the �rst-half of the 21st century at a global level: An integrated approach. Energy Policy<br />
35: 2590-2610.<br />
Dornburg, V., A. Faaij, H. Langeveld, G. van de Ven, F. Wester, H. van Keulen, K. van Diepen, J. Ros, D.<br />
van Vuuren, G.J. van den Born, M. van Oorschot, F. Smout, H. Aiking, M. Londo, H. Moza�arian, K.<br />
Smekens, M. Meeusen, M. Banse, E. Lysen, and S. van Egmond, 2008. Biomass Assessment: Assessment<br />
of global biomass potentials and their links <strong>to</strong> food, water, biodiversity, energy demand and economy<br />
– Main Report, Study performed by Copernicus Institute – Utrecht University, MNP, LEI, WUR-PPS,<br />
ECN, IVM and the Utrecht Centre for Energy Research, within the framework of the Netherlands<br />
Research Programme on Scienti�c Assessment and Policy Analysis for Climate Change. Reportno:<br />
WAB 500102012, 85 pp. + Appendices.<br />
Faaij, A., 2006. Modern biomass conversion technologies. Mitigation and Adaptation Strategies for Global<br />
Change 11: 335-367.<br />
FAO, 2008. State of Food and Agriculture - Biofuels: prospects, risks and opportunities, Food and Agirculture<br />
Organisation of the United Nations, Rome, Italy.<br />
Ful<strong>to</strong>n, L., 2004. International Energy Agency, Biofuels for transport – an international perspective, O�ce<br />
of Energy E�ciency, Technology and R&D, OECD/IEA, Paris, France.<br />
Groen, M., 1999. Energy rooted in sugar cubes; the interaction between energy savings and cogeneration<br />
in Indian sugar mills, Report of the Department of Science, Technology & Society – Utrecht University<br />
in collaboration with Winrock International, Utrecht, the Netherlands, pp. 34.<br />
Hamelinck, C. and A. Faaij, 2006. Outlook for advanced biofuels. Energy Policy 34: 3268-3283.<br />
Hamelinck, C.N. and A.P.C. Faaij, 2002. Future prospects for production of m<strong>ethanol</strong> and hydrogen from<br />
biomass. Journal of Power Sources 111: 1-22.<br />
Hamelinck, C., A. Faaij, H. den Uil and H. Boerrigter, 2004. Production of FT transportation fuels from<br />
biomass; technical options, process analysis and optimisation and development potential. Energy, the<br />
International Journal 29: 1743-1771.<br />
Hamelinck, C.N., G van Hooijdonk and A.P.C. Faaij, 2005. Future prospects for the production of <strong>ethanol</strong><br />
from ligno-cellulosic biomass. Biomass & Bioenergy 28: 384-410.<br />
<strong>Sugarcane</strong> <strong>ethanol</strong> 179
Chapter 7<br />
Hoogwijk, M., A. Faaij, B. de Vries and W. Turkenburg, 2008. Global potential of biomass for energy from<br />
energy crops under four GHG emission scenarios Part B: the economic potential. Biomass & Bioenergy,<br />
in press.<br />
Hoogwijk, M., A. Faaij, B. Eickhout, B.de Vries and W. Turkenburg, 2005. Potential of biomass energy out<br />
<strong>to</strong> 2100, for four IPCC SRES land-use scenarios. Biomass & Bioenergy 29: 225-257.<br />
Hunt, S., J. Easterly, A. Faaij, C. Flavin, L. Freimuth, U. Fritsche, M. Laser, L. Lynd, J. Moreira, S. Pacca, J.L.<br />
Sawin, L. Sorkin, P. Stair, A. Szwarc and S. Trindade, 2007. Biofuels for Transport: Global Potential and<br />
Implications for Energy and Agriculture. prepared by Worldwatch Institute, for the German Ministry<br />
of Food, Agriculture and Consumer Protection (BMELV) in coordination with the German Agency<br />
for Technical Cooperation (GTZ) and the German Agency of Renewable Resources (FNR), ISBN:<br />
1844074226, Published by EarthScan/James & James, 336 pp.<br />
International Energy Agency, 2006. World Energy Outlook 2006, IEA Paris, France.<br />
Kahn Ribeiro, S., S. Kobayashi, M. Beuthe, J. Gasca, D. Greene, D.S. Lee, Y. Muromachi, P.J. New<strong>to</strong>n, S.<br />
Plotkin, D. Sperling, R. Wit and P.J. Zhou, 2007: Transport and its infrastructure. In: B. Metz, O.R.<br />
Davidson, P.R. Bosch, R. Dave and L.A. Meyer (eds.), Climate Change 2007: Mitigation contribution of<br />
Working Group III <strong>to</strong> the Fourth Assessment Report of the Intergovernmental Panel on Climate Change,<br />
Cambridge University Press, Cambridge United Kingdom and New York, USA.<br />
Larson, E.D., 2005. A Review of LCA Studies on Liquid Biofuel Systems for the Transport Sec<strong>to</strong>r. Energy<br />
for Sustainable Development 11: Oc<strong>to</strong>ber 2005.<br />
Lynd, L.R., W.H. van Zyl, J.E. McBride and M. Laser, 2005. Consolidated Bioprocessing of Lignocellulosic<br />
Biomass: An Update. Current Opinion in Biotechnology 16: 577-583.<br />
Macedo, I.d.C., M.R.L.V. Leal and J.E.A.R. Da Silva, 2004. Assessment of greenhouse gas emissions in the<br />
production and use of fuel <strong>ethanol</strong> in Brazil. Secretariat of the Environment of the State of São Paulo,<br />
Brazil. Accessible at: http://www.unica.com.br/i_pages/�les/pdf_ingles.pdf<br />
OECD/FAO, 2007. Agricultural Outlook 2007-2016. Paris, France.<br />
Smeets, E., M. Junginger, A. Faaij, A. Walter, P. Dolzan and W. Turkenburg, 2008. �e sustainability of<br />
Brazilian Ethanol; an assessment of the possibilties of certi�ed production. Biomass & Bioenergy 32:<br />
781-813.<br />
Tijmensen, M.J.A., A.P.C. Faaij, C.N. Hamelinck and M.R.M. van Hardeveld, 2002. Exploration of the<br />
possibilities for production of Fischer Tropsch liquids via biomass gasi�cation. Biomass & Bioenergy<br />
23: 129-152.<br />
Wall-Bake, J.D., M. Junginger, A, Faaij, T. Poot and A. da Silva Walter, 2008. Explaining the experience curve:<br />
Cost reductions of Brazilian <strong>ethanol</strong> from sugarcane. Biomass & Bioenergy, in press.<br />
Williams, R.H., E.D. Larson, R.E. Ka<strong>to</strong>fsky and J. Chen, J., 1995. M<strong>ethanol</strong> and hydrogen from biomass<br />
for transportation, with comparisons <strong>to</strong> m<strong>ethanol</strong> and hydrogen from natural gas and coal. Centre for<br />
Energy and Environmental Studies, Prince<strong>to</strong>n University, reportno. 292.<br />
180 <strong>Sugarcane</strong> <strong>ethanol</strong>
Chapter 8<br />
The global impacts of US and EU biofuels policies<br />
Wallace E. Tyner<br />
1. Introduction<br />
�e major biofuels producers in the world are the US, EU, and Brazil. Figure 1 shows the<br />
global breakdown of biofuels production for 2006. �e US and Brazil combine <strong>to</strong> produce<br />
three-fourths of global <strong>ethanol</strong>, and the EU produces three-fourths of global biodiesel. �e<br />
US over<strong>to</strong>ok Brazil in <strong>ethanol</strong> production, and global production now exceeds 50 billion<br />
liters. Biodiesel <strong>to</strong>tal production is much smaller.<br />
In the US, Brazil, and the EU, the biofuels industries were launched with some combination<br />
of subsidies and mandates plus border protection. As production levels have grown and as oil<br />
prices have risen, all three are now switching in di�erent degrees from reliance on subsidies<br />
<strong>to</strong> reliance on mandates. One reason is the government budget cost of subsidies, which<br />
increase as production increases. Mandates also have a cost, but it is paid by consumers<br />
at the pump assuming the biofuel is more expensive <strong>to</strong> produce than the petroleum based<br />
fuel it replaces. �e consumer cost of a mandate is directly related <strong>to</strong> oil price. At low oil<br />
prices, a mandate can be expensive for consumers because high cost renewable fuel is<br />
mandated in lieu of a certain fraction of relatively lower cost petroleum. At high oil prices,<br />
the renewable fuel may even be less expensive than petroleum based fuels, so the cost can<br />
be much lower or zero.<br />
EU<br />
3%<br />
India<br />
4%<br />
China<br />
8%<br />
others<br />
11%<br />
Brazil<br />
37%<br />
Ethanol<br />
USA<br />
37%<br />
USA<br />
20%<br />
others<br />
4%<br />
Biodiesel<br />
EU<br />
76%<br />
World <strong>ethanol</strong> production: 49.3 billion liters World biodiesel production: 5.6 billion liters<br />
Figure 1. Global biofuels production, 2006. Data sources: Earth Policy Institute (2006), Renewable<br />
Fuels Association (2007), European Biodiesel Board (2007).<br />
<strong>Sugarcane</strong> <strong>ethanol</strong> 181
Chapter 8<br />
In Brazil, subsidies have been completely replaced with mandates. In the EU, subsidies are<br />
determined by each country. In essence, the EU sets a target level of renewable fuels, and<br />
each country decides how best <strong>to</strong> achieve that target. �e original target was 5.75 percent<br />
renewable fuels by 2010. Most countries were well behind the pace needed <strong>to</strong> achieve that<br />
target. More recently a target of 10 percent by 2020 has been proposed. Given the recent food<br />
price and greenhouse gas controversies (more later), it appears the EU is backing away from<br />
that target. Germany has had relatively high levels of subsidies for biodiesel, but these have<br />
now ended. At present, the future directions for biofuels policies in the EU are uncertain.<br />
In the US, <strong>ethanol</strong> has been subsidized for 30 years (Tyner, 2008). �e subsidy has ranged<br />
from 10.6 <strong>to</strong> 15.9 cents per liter, and is currently 13.5 cents per liter. �e subsidy on maize<br />
<strong>ethanol</strong> will be reduced <strong>to</strong> 11.9 cents per liter on 1 January 2009, but a new subsidy of 26.7<br />
cents per liter of cellulosic <strong>ethanol</strong> will be introduced (US Congress, 2008). In addition<br />
<strong>to</strong> the subsidy, in December 2007, the US introduced biofuel mandates in the Energy<br />
Independence and Security Act (US Congress, 2007). Figure 2 portrays the timing of the<br />
US mandate, called a Renewable Fuel Standard (RFS). �e Renewable Fuel Standard (RFS)<br />
as amended in the 2007 Energy Independence and Security Act calls for 36 billion gallons<br />
of renewable fuels by 2022. �e RFS is divided in<strong>to</strong> four categories of biofuels: conventional,<br />
advanced, cellulosic, and biodiesel. �e advanced category reaches 21 billion gallons by 2022<br />
and includes cellulosic <strong>ethanol</strong>, <strong>ethanol</strong> from sugar, <strong>ethanol</strong> from waste material, biodiesel,<br />
and other non-maize sources. In other words, the advanced category encompasses both the<br />
cellulosic and biodiesel categories. Cellulosic <strong>ethanol</strong> as a sub-set of advanced reaches 16<br />
Billions of gallons<br />
40.00<br />
35.00<br />
30.00<br />
25.00<br />
20.00<br />
15.00<br />
10.00<br />
5.00<br />
0.00<br />
2006 2007 2008 2009 2010 2011 2012 2013 2014 2015 2016 2017 2018 2019 2020 2021 2022<br />
Biomass-based diesel 0.50 0.65 0.80 1.00 1.00 1.00 1.00 1.00 1.00 1.00 1.00 1.00 1.00 1.00<br />
Non-celulosic advanced 0.10 0.20<br />
0.30 0.50 0.75 1.00 1.50 2.00 2.50 3.00 3.50 3.50 3.50 4.00<br />
Celulosic advanced 0.10 0.25 0.50 1.00 1.75 3.00 4.25 5.50 7.00 8.50 10.5 13.5 16.0<br />
Conventional biofuels 4.00 4.70 9.00 10.5 12.0 12.6 13.2 13.8 14.4 15.0 15.0 15.0 15.0 15.0 15.0 15.0 15.0<br />
Figure 2. US Renewable Fuel Standard (2007-2022). Source: Joel Valasco (pers. comm.).<br />
182 <strong>Sugarcane</strong> <strong>ethanol</strong>
The global impacts of US and EU biofuels policies<br />
billion by 2022, and biodiesel reaches 1 billion. �e residual, likely <strong>to</strong> be sugarcane <strong>ethanol</strong>,<br />
amounts <strong>to</strong> 4 billion gallons by 2022. �e way the standard is written, there is the <strong>to</strong>tal RFS<br />
requirement and the advanced requirement (with its sub-components speci�ed separately)<br />
with the di�erence being presumed <strong>to</strong> be maize based <strong>ethanol</strong>. However, there is no speci�c<br />
RFS for maize <strong>ethanol</strong>. �is residual, labeled conventional biofuels, reaches 15 billion gallons<br />
by 2015 and stays at that level. �e residual is the only category that permits maize <strong>ethanol</strong>.<br />
However, it could also include any of the other categories of biofuels.<br />
Associated with all the biofuel categories is a GHG reduction requirement. For maize<br />
based <strong>ethanol</strong>, the reduction must be at least 20 percent. For all advanced biofuels except<br />
cellulosic <strong>ethanol</strong>, the reduction required is 50 percent, and for cellulosic <strong>ethanol</strong>, it is<br />
60 percent. Ethanol plants that were under construction or in operation as of the data of<br />
enactment of the legislation are exempt from the GHG requirement (grandfathered). �e<br />
GHG requirements are <strong>to</strong> be developed and implemented by EPA. �e EPA administra<strong>to</strong>r<br />
has �exibility <strong>to</strong> modify <strong>to</strong> some extent the GHG percentages. S/he also has authority <strong>to</strong><br />
reduce or waive the RFS levels.<br />
In addition <strong>to</strong> the subsidy and RFS, the US also has a tari� on imported <strong>ethanol</strong> (Abbott<br />
et al., 2008). �e tari� is 2.5 percent ad valorem plus a speci�c tari� of 14.3 cents per liter<br />
of <strong>ethanol</strong>. With an <strong>ethanol</strong> CIF price of 52.9 cents per liter, the <strong>to</strong>tal tari� becomes 15.6<br />
cents per liter. �e rationale for the tari� was that the US <strong>ethanol</strong> subsidy applies <strong>to</strong> both<br />
domestic and imported <strong>ethanol</strong>. Congress clearly wanted <strong>to</strong> subsidize only domestically<br />
produced <strong>ethanol</strong>, so the tari� was established <strong>to</strong> o�set the domestic subsidy. At the time<br />
the tari� was created, the domestic subsidy was also about 14.3 cents per liter (Tyner, 2008).<br />
However, the domestic subsidy was reduced <strong>to</strong> 13.5 and has now been reduced further <strong>to</strong><br />
11.9 cents per liter. �us, <strong>to</strong>day, the import tari�, as a trade barrier, goes far beyond the<br />
subsidy o�set. �e EU and Brazil also have import tari�s on <strong>ethanol</strong>. For Brazil, it is largely<br />
irrelevant since Brazil is one of the world’s lowest cost producers of <strong>ethanol</strong>, so it is unlikely<br />
<strong>to</strong> import <strong>ethanol</strong>.<br />
2. Ethanol economics and policy<br />
�e lowest cost <strong>ethanol</strong> source is <strong>ethanol</strong> from sugarcane. It is also the most advantageous<br />
from a net energy perspective. Brazil is the global leader in sugarcane based <strong>ethanol</strong><br />
production, and has ample land resources <strong>to</strong> expand production. �e US uses maize <strong>to</strong><br />
produce <strong>ethanol</strong>. �e cost of producing <strong>ethanol</strong> from maize varies with the price of maize.<br />
�e value of the <strong>ethanol</strong> produced is a function of the price of crude oil since <strong>ethanol</strong><br />
substitutes for gasoline. Figure 3 provides a breakeven analysis for maize <strong>ethanol</strong> at varying<br />
prices of crude oil and maize. �e <strong>to</strong>p line is the breakeven values with no government<br />
intervention and <strong>ethanol</strong> valued on an energy basis. �e second line includes the 13.5 cent<br />
per liter subsidy. Prior <strong>to</strong> 2005, maize o�en ranged between $80 and $90 per mt. Without<br />
a subsidy oil would have had <strong>to</strong> be over $60 for maize <strong>ethanol</strong> <strong>to</strong> be economic. However,<br />
<strong>Sugarcane</strong> <strong>ethanol</strong> 183
Chapter 8<br />
Crude ($/bbl.)<br />
140.00<br />
120.00<br />
100.00<br />
80.00<br />
60.00<br />
40.00<br />
20.00<br />
Energy basis<br />
0.00<br />
60 100 140 180 220 260<br />
Figure 3. Breakeven <strong>ethanol</strong> prices with and without federal subsidy.<br />
with the federal subsidy, maize <strong>ethanol</strong> was economic at around $30 crude. In addition <strong>to</strong><br />
the federal subsidy, many US states also o�ered subsidies, so <strong>ethanol</strong> was attractive in the<br />
two decades prior <strong>to</strong> 2005 even though oil averaged $20/bbl. During that period It was not<br />
hugely pro�table, but enough so <strong>to</strong> see the industry grow slowly over the entire period.<br />
Today with maize around $240/mt, the breakeven oil price is about $135 with no subsidy<br />
and $105 with a subsidy. �e nature of a �xed subsidy is such that regardless of the maize<br />
price, the breakeven oil price di�erence with and without the subsidy is about $30/bbl. Or<br />
conversely, at $120 oil, the maize breakeven prices with and without subsidy are $270 and<br />
$207 per metric <strong>to</strong>nne, respectively.<br />
2.1. Impacts of alternative US <strong>ethanol</strong> policies<br />
Corn ($/mt)<br />
Energy + subsidy<br />
�is breakeven analysis is from the perspective of a representative �rm. We can use a<br />
partial equilibrium economic model <strong>to</strong> examine the �xed subsidy, a variable subsidy, and<br />
the RFS over a range of oil prices (Tyner and Taheripour, 2008a,b). �e model includes,<br />
maize, <strong>ethanol</strong>, gasoline, crude oil, and distillers dried grains with solubles (DDGS). �e<br />
supply side of the maize market consists of identical maize producers. �ey produce maize<br />
using constant returns <strong>to</strong> scale Cobb-Douglas production functions and sell their product<br />
in a competitive market. Under these assumptions, we can de�ne an aggregated Cobb-<br />
Douglas production function for the whole market. In the short-run the variable input<br />
of maize producers is a composite input which covers all inputs such as seed, fertilizers,<br />
chemicals, fuel, electricity, and so on. In short run capital and land are �xed. �e demand<br />
side of the maize market consists of three users: domestic users who use maize for feed<br />
and food purposes; foreign users, and <strong>ethanol</strong> producers. We model the domestic and<br />
foreign demands with constant price elasticity functions. �e foreign demand for maize is<br />
more elastic than the domestic demand. �e demand of the <strong>ethanol</strong> industry for maize is<br />
a function of the demand for <strong>ethanol</strong>.<br />
184 <strong>Sugarcane</strong> <strong>ethanol</strong>
The global impacts of US and EU biofuels policies<br />
�e gasoline market has two groups of producers: gasoline and <strong>ethanol</strong> producers. It is<br />
assumed that <strong>ethanol</strong> is a substitute for gasoline with no additive value. �e gasoline and<br />
<strong>ethanol</strong> producers produce according <strong>to</strong> short run Cobb-Douglas production functions. �e<br />
variable input of gasoline producers is crude oil and the variable input of <strong>ethanol</strong> producers<br />
is maize. Both groups of producers are price takers in product and input markets. We model<br />
the demand side with a constant price elasticity demand. �e constant parameter of this<br />
function can <strong>change</strong> due <strong>to</strong> <strong>change</strong>s in income and population. We assume that the gasoline<br />
industry is well established and operates at long run equilibrium, but the <strong>ethanol</strong> industry<br />
is expanding. �e new <strong>ethanol</strong> producers opt in when there are pro�ts. �ere is assumed <strong>to</strong><br />
be no physical or technical limit on <strong>ethanol</strong> production – only economic limits.<br />
�e model is calibrated <strong>to</strong> 2006 data and then solved for several scenarios. Elasticities are<br />
taken from the existing literature. Endogenous variables are gasoline supply, demand, and<br />
price: <strong>ethanol</strong> supply, demand, and price; maize price and production; maize use for <strong>ethanol</strong>,<br />
domestic use, and exports; DDGS supply and price; land used for maize; and the price of<br />
the composite input for maize. Exogenous variables include crude oil price, maize yield,<br />
<strong>ethanol</strong> conversion rate, <strong>ethanol</strong> subsidy level and policy mechanism, and gasoline demand<br />
shock (due <strong>to</strong> non-price variables such as population and income). �e model is driven and<br />
solved by market clearing conditions that maize supply equal the sum of maize demands<br />
and that <strong>ethanol</strong> production expands <strong>to</strong> the point of zero pro�t. �e model is simulated<br />
over a range of oil prices between $40 and $140.<br />
Figure 4 provides the results from this model simulation for maize price and Figure 5 for<br />
<strong>ethanol</strong> production. In each �gure, the far le� bar is the 13.5 cent �xed subsidy, the second<br />
is no subsidy, the third a subsidy that varies with the price of crude oil, the fourth the RFS<br />
alone, and the ��h the RFS in combination with the �xed subsidy (current policy). �e<br />
variable subsidy is in e�ect only for crude oil prices below $70. �e �rst thing <strong>to</strong> note from<br />
Figure 4 is that, just as was evident from the perspective of the �rm, there is now a tight<br />
linkage between crude oil price and maize price. �e basic mechanism is that gasoline price<br />
is driven by crude price. Ethanol is a close substitute for gasoline, so a higher gasoline price<br />
means larger <strong>ethanol</strong> demand. �at demand stimulates investment in <strong>ethanol</strong> plants. More<br />
<strong>ethanol</strong> plants means greater demand for maize, and that increased demand means higher<br />
maize price. �is is a huge <strong>change</strong>, as his<strong>to</strong>rically, there was very little correlation between<br />
energy and agricultural prices.<br />
�e $40 oil price represents the approximate price in 2004. �e model accurately ‘predicts’<br />
the <strong>ethanol</strong> production and maize price corresponding <strong>to</strong> $40 oil. �at is, the 2004 model<br />
results are very close <strong>to</strong> the actual 2004 values. �e <strong>ethanol</strong> production under no subsidy<br />
also accurately shows <strong>ethanol</strong> production beginning only when oil reaches $60 and then at a<br />
very low level. Of course, the RFS case has the <strong>ethanol</strong> production level at 56.7 bil. l., which<br />
is the level of the RFS in 2015, and the level modeled in this analysis. �e numbers above<br />
the RFS bar in Figure 5 represent the implicit subsidy on <strong>ethanol</strong> ($/gal. <strong>ethanol</strong>) due <strong>to</strong> the<br />
<strong>Sugarcane</strong> <strong>ethanol</strong> 185
Chapter 8<br />
$/mt.<br />
300.00<br />
250.00<br />
200.00<br />
150.00<br />
100.00<br />
50.00<br />
0.00<br />
40 60 80 100<br />
Oil price<br />
120 140<br />
Figure 4. Maize price under alternative policies and oil prices.<br />
Bil.l./yr<br />
80.0<br />
70.0<br />
60.0<br />
50.0<br />
40.0<br />
30.0<br />
20.0<br />
10.0<br />
0.0<br />
fixed sub no sub var sub RFS RFS+sub<br />
fixed sub no sub var sub RFS RFS+sub<br />
1.06 0.83 0.55<br />
40 60 80 100<br />
Oil price<br />
120 140<br />
Figure 5. Ethanol production under alternative policies and oil prices.<br />
RFS. It is also an implicit tax on consumers. �e model follows the RFS rule, and ‘requires’<br />
that the stipulated level of <strong>ethanol</strong> be produced. To the extent that the cost of <strong>ethanol</strong> is<br />
higher than the cost of gasoline, this higher cost gets passed on <strong>to</strong> consumers in the form<br />
of an implicit tax on consumers. �us, a RFS functions very di�erently from a subsidy.<br />
�e subsidy is on the government budget, whereas the mandate cost is paid by consumers<br />
186 <strong>Sugarcane</strong> <strong>ethanol</strong><br />
0.29<br />
0.07<br />
0.00
The global impacts of US and EU biofuels policies<br />
directly at the pump. When oil is very inexpensive, the <strong>ethanol</strong> costs considerably more than<br />
petroleum. So the requirement <strong>to</strong> blend <strong>ethanol</strong> means consumers pay more at the pump<br />
than they would without the mandate. For $40 oil, the implicit subsidy/tax is $1.06/gal. or<br />
28 cents per liter. �e subsidy/tax falls <strong>to</strong> zero at $140 oil. At $140 oil, the mandate is no<br />
longer binding, and the amount of <strong>ethanol</strong> demanded is market driven – not determined<br />
by the mandate. �us the RFS is a form of variable subsidy for the <strong>ethanol</strong> producer and<br />
variable tax for the consumer depending on the price of crude oil. Ethanol production stays<br />
at the RFS level of 56.7 bil. l. until oil reaches $120. At that oil price and beyond the market<br />
demands more than 56.7 bil. l., and the RFS becomes non-binding.<br />
�e �nal bar is the current policy of RFS plus subsidy. Note that at low oil prices, the RFS<br />
production level is higher than that induced by the subsidy, and at high oil prices, the subsidy<br />
induces higher production than the RFS. If the RFS represents the intent of Congress with<br />
respect <strong>to</strong> level of <strong>ethanol</strong> production, the subsidy takes production well beyond that level<br />
at high oil prices.<br />
Another important question that can be addressed using these model results is what<br />
proportion of the maize price increase is due <strong>to</strong> the oil price increase, and what proportion<br />
<strong>to</strong> the subsidy. If we start at the no subsidy case with $40 oil, we have a maize price of $67,<br />
which increases <strong>to</strong> $181 when oil triples <strong>to</strong> $120. If we add on the subsidy at $120 oil, the<br />
maize price goes up <strong>to</strong> $222. �e <strong>to</strong>tal maize price increase is $155, of which $41 is due <strong>to</strong><br />
the subsidy, and $113 <strong>to</strong> the oil price increase. So roughly ¾ of the maize price increase<br />
has been due <strong>to</strong> higher oil prices, and ¼ <strong>to</strong> the US subsidy on maize <strong>ethanol</strong>. Even if the<br />
subsidy went away, maize prices would not return <strong>to</strong> their his<strong>to</strong>ric levels because of the<br />
new link between energy and agriculture. And if oil price went down, we would expect <strong>to</strong><br />
see the maize price fall as well. As the oil price fell, gasoline would fall as would the price<br />
of <strong>ethanol</strong>. With lower <strong>ethanol</strong> prices, some plants could not produce pro�tably, so maize<br />
demand would fall and also the maize price.<br />
Figure 6 displays the annual costs of the various policy options. Recall that the method of<br />
paying the costs is very di�erent between the government subsidy and the RFS. �e RFS is<br />
paid by the consumer at the pump, and the �xed and variable subsidies are paid through<br />
the government budget. �e variable subsidy has no cost for oil above $70 by design, and<br />
its cost at low oil prices is quite low. �e cost of the �xed subsidy increases almost linearly<br />
with oil price. �e higher the oil price, the higher the government subsidy cost. �e RFS<br />
is exactly opposite. It has a high cost when oil price is low, and a very low or zero cost at<br />
high oil prices.<br />
�e US tari� on imported <strong>ethanol</strong> introduces a potentially greater dis<strong>to</strong>rtion than does the<br />
subsidy or mandate. Since high oil prices directly lead <strong>to</strong> higher maize prices, maize <strong>ethanol</strong><br />
becomes much more expensive. <strong>Sugarcane</strong>-based <strong>ethanol</strong> is less expensive <strong>to</strong> produce<br />
than maize <strong>ethanol</strong> at any oil price, but the gap widens at higher oil prices. So removal<br />
<strong>Sugarcane</strong> <strong>ethanol</strong> 187
Chapter 8<br />
Bil.$/yr<br />
18.0<br />
16.0<br />
14.0<br />
12.0<br />
10.0<br />
8.0<br />
6.0<br />
4.0<br />
2.0<br />
0.0<br />
Figure 6. Costs of the policy alternatives.<br />
fixed sub no sub var sub RFS RFS+sub<br />
40 60 80 100 120 140<br />
Oil price<br />
of the tari� on imported <strong>ethanol</strong> would lead <strong>to</strong> the biofuel coming from the lowest cost<br />
source–sugarcane–which would reduce some pressure on maize prices and provide the<br />
United States with lower cost <strong>ethanol</strong>. Brazil has the potential <strong>to</strong> expand <strong>ethanol</strong> production<br />
substantially without increasing world sugar prices substantially, so imports down the road<br />
could be quite high.<br />
However, the question is more complicated because it depends on the extent <strong>to</strong> which<br />
imported <strong>ethanol</strong> adds <strong>to</strong> <strong>to</strong>tal consumption and the extent <strong>to</strong> which it displaces maize<br />
<strong>ethanol</strong>. For the portion that displaced maize <strong>ethanol</strong>, each billion gallons of imports would<br />
displace about 358 million bushels of maize used for <strong>ethanol</strong> (Tyner and Taheripour, 2007).<br />
So you would get price impacts as the <strong>ethanol</strong> industry demanded less maize. �e problem<br />
is �guring out how much would go <strong>to</strong> increase <strong>to</strong>tal consumption and how much <strong>to</strong> displace<br />
maize <strong>ethanol</strong>. In the United States, the limit of how much <strong>ethanol</strong> can be blended is called<br />
the blending wall (Tyner et al., 2008). �e blending wall is the maximum amount of <strong>ethanol</strong><br />
that can be blended at the regula<strong>to</strong>ry maximum of 10%. Currently, we consume about 140<br />
billion gallons of gasoline (Energy Information Administration, 2008), so the max level for<br />
the blending wall would be 14 billion gallons of <strong>ethanol</strong>. However, for logistical reasons,<br />
the practical level is likely <strong>to</strong> be much lower, perhaps around 12 billion gallons. See Tyner<br />
et al. (2008) for a more complete analysis of this issue.<br />
We already have in place or under construction 13 billion gallons of <strong>ethanol</strong> capacity. At<br />
present E85 is tiny, and it would take quite a while <strong>to</strong> build that market. �ere are only about<br />
1,700 E85 pumps in the nation and few �ex-fuel vehicles that are required <strong>to</strong> consume the<br />
fuel. It would require a massive investment <strong>to</strong> make E85 pumps readily available for all<br />
188 <strong>Sugarcane</strong> <strong>ethanol</strong>
The global impacts of US and EU biofuels policies<br />
consumers, and a huge switch <strong>to</strong> �ex-fuel vehicle manufacture and sale <strong>to</strong> grow this market.<br />
Without strong government intervention, it will not happen.<br />
What options exist? �e most popular among the <strong>ethanol</strong> industry is switching <strong>to</strong> E15 or<br />
E20 instead of E10. �e major problem is that au<strong>to</strong>mobile manufacturers believe the existing<br />
�eet is not suitable for anything over E10. Switching <strong>to</strong> a higher blend would void warranties<br />
on the existing �eet and potentially pose problems for older vehicles not under warranty.<br />
In the US, the au<strong>to</strong>mobile �eet turns over in about 14 years, so it is a long term process. We<br />
could not add yet another pump for E15 or E20. �e costs would be huge. So the blending<br />
wall in the near term is an e�ective barrier <strong>to</strong> growth of the <strong>ethanol</strong> industry. If a switch is<br />
made <strong>to</strong> an E15 or E20 limit for standard cars, some agreement would have <strong>to</strong> be reached<br />
on who pays for any vehicle repair or performance issues.<br />
On the technical side, two options could emerge. One would be using cellulose through a<br />
thermochemical conversion process <strong>to</strong> produce gasoline or diesel fuel directly. Today this<br />
process is quite expensive, but the cost might be reduced over the next few years. A second<br />
option is <strong>to</strong> convert cellulose <strong>to</strong> butanol instead of <strong>ethanol</strong>, which is much more similar <strong>to</strong><br />
gasoline. Without such a breakthrough, the EPA administra<strong>to</strong>r likely will be forced <strong>to</strong> cap<br />
the RFS far below the planned levels.<br />
Until we hit the blending wall, most of the imports likely would increase <strong>to</strong>tal consumption<br />
and not displace maize <strong>ethanol</strong>. However, we will probably reach the blending wall in<br />
2009/10, at which point imports would likely displace domestic maize <strong>ethanol</strong> and thereby<br />
lower maize price.<br />
3. Impacts of US and EU policies on the rest of the world<br />
Our analysis of global impacts is done using the Global Trade Analysis Project (GTAP)<br />
model and data base. �is work is based on Hertel et al. (2008). We begin with an analysis<br />
of the origins of the recent bio-fuel boom, using the his<strong>to</strong>rical period from 2001-2006 for<br />
purposes of model calibration and validation. �is was a period of rapidly rising oil prices,<br />
increased subsidies in the EU, and, in the US, there was a ban on the major competi<strong>to</strong>r <strong>to</strong><br />
<strong>ethanol</strong> for gasoline additives (MTBE) (Tyner, 2008). Our analysis of this his<strong>to</strong>rical period<br />
permits us <strong>to</strong> evaluate the relative contribution of each of these fac<strong>to</strong>rs <strong>to</strong> the global biofuel<br />
boom. We also use this his<strong>to</strong>rical simulation <strong>to</strong> establish a 2006 benchmark biofuel economy<br />
from which we conduct our analysis of future mandates.<br />
We then can do a forward-looking analysis of EU and US biofuel programs. �e US Energy<br />
Policy and Security Act of 2007 calls for 15 billion gallons of <strong>ethanol</strong> use by 2015, most of<br />
which is expected <strong>to</strong> come from maize. In the EU, the target is 5.75% of renewable fuel use<br />
in 2010 and 10% by 2020. However, there are signi�cant doubts as <strong>to</strong> whether these goals are<br />
attainable. For this analysis, we adopt the conservative mandate of 6.25% by 2015 in the EU.<br />
<strong>Sugarcane</strong> <strong>ethanol</strong> 189
Chapter 8<br />
�e starting point for our prospective simulations is the updated, 2006 fuel economy which<br />
results from the foregoing his<strong>to</strong>rical analysis. �us, we analyze the impact of a continued<br />
intensi�cation of the use of biofuels in the economy treating the mandates as exogenous<br />
shocks. 12 Ethanol exports from Brazil <strong>to</strong> the US grow in this simulation as well.<br />
Table 1 reports the percentage <strong>change</strong>s in output for biofuels and the land-using sec<strong>to</strong>rs<br />
in the USA, EU and Brazil. �e �rst column in each block corresponds <strong>to</strong> the combined<br />
impact of EU and US policies on a given sec<strong>to</strong>r’s output (USEU-2015). �e second column<br />
in each block reports the component of this attributable <strong>to</strong> the US policies (US-2015), and<br />
the third reports the component of the <strong>to</strong>tal due <strong>to</strong> the EU policies (EU-2015) using the<br />
decomposition technique of Harrison et al. (2000). �is decomposition method is a more<br />
sophisticated approach <strong>to</strong> the idea of �rst simulating the global impacts of a US program,<br />
then simulating the impact of an EU biofuels program, and �nally, simulating the impact<br />
of the two combined. �e problem with that (rather intuitive) approach is that the impacts<br />
of the individual programs will not sum <strong>to</strong> the <strong>to</strong>tal, due <strong>to</strong> interactions. By adopting<br />
this numerical integration approach <strong>to</strong> decomposition, the combined impacts of the two<br />
programs are fully attributed <strong>to</strong> each one individually.<br />
In the case of the US impacts (columns labeled Output in US), most of the impacts on the<br />
land-using sec<strong>to</strong>rs are due <strong>to</strong> US policies. Coarse grains output rises by more than 16%, while<br />
output of other crops and lives<strong>to</strong>ck falls when only US policies are considered. However,<br />
oilseeds are a major exception. Here, the production impact is reversed when EU mandates<br />
are introduced. In order <strong>to</strong> meet the 6.25% renewable fuel share target, the EU requires a<br />
massive amount of oilseeds. Even though production in the EU rises by 52%, additional<br />
imports of oilseeds and vegetable oils are required, and this serves <strong>to</strong> stimulate production<br />
worldwide, including in the US. �us, while US oilseeds output falls by 5.6% in the presence<br />
of US-only programs, due <strong>to</strong> the dominance of <strong>ethanol</strong> in the US biofuel mix, when the EU<br />
policies are added <strong>to</strong> the mix, US oilseed production actually rises.<br />
In the case of the EU production impacts (Output in EU: the second group of columns<br />
in Table 1), the impact of US policies is quite modest, with the main interaction again<br />
through the oilseeds market. However, when it comes <strong>to</strong> third markets – in particular Brazil<br />
(Output in Brazil), the US and EU both have important impacts. US policies drive sugarcane<br />
production, through the <strong>ethanol</strong> sec<strong>to</strong>r, while the EU policies drive oilseeds production in<br />
Brazil. Other crops, lives<strong>to</strong>ck, and forestry give up land <strong>to</strong> these sec<strong>to</strong>rs.<br />
12 Technically, we endogenize the subsidy on biofuel use and exogenize the renewable fuel share, then shock<br />
the latter. For simplicity, all components of the renewable fuels bundle are assumed <strong>to</strong> grow in the same<br />
proportion.<br />
190 <strong>Sugarcane</strong> <strong>ethanol</strong>
Table 1. Change in output due <strong>to</strong> EU and US biofuel mandates: 2006-2015 (%).<br />
Sec<strong>to</strong>r Output in US Output in EU Output in Brazil<br />
USEU-2015 US-2015 EU-2015 USEU-2015 US-2015 EU-2015 USEU-2015 US-2015 EU-2015<br />
Ethanol 177.5 177.4 0.1 430.9 1.3 429.7 18.1 17.9 0.2<br />
Biodiesel 176.9 176.8 0.1 428.8 1.2 427.6 - - -<br />
Coarse grains 16.6 16.4 0.2 2.5 0.8 1.7 -0.3 1.1 -1.4<br />
Oilseeds 6.8 -5.6 12.4 51.9 1.2 50.7 21.1 0.6 20.5<br />
<strong>Sugarcane</strong> -1.8 -1.9 0.1 -3.7 0.0 -3.7 8.4 9.3 -0.9<br />
Other grains -7.6 -8.7 1.2 -12.2 0.1 -12.3 -8.7 -2.0 -6.8<br />
Other agri -1.6 -1.7 0.2 -4.5 0.0 -4.5 -3.8 -1.5 -2.4<br />
Lives<strong>to</strong>ck -1.2 -1.2 0.0 -1.7 0.1 -1.8 -1.4 -0.6 -0.7<br />
Forestry -1.2 -1.4 0.1 -5.4 -0.3 -5.1 -2.7 -1.0 -1.8<br />
Note: Ethanol in the US and EU is from grains, and it is sugarcane-based in Brazil.<br />
The global impacts of US and EU biofuels policies<br />
<strong>Sugarcane</strong> <strong>ethanol</strong> 191
Chapter 8<br />
Table 2 reports <strong>change</strong>s in crop harvested area as a result of the biofuel mandates in the US<br />
and EU for all regions in the model. �e simulation includes only the biofuels shock, and<br />
does not include population growth, income growth, trend yield increases, or anyother<br />
‘baseline’ fac<strong>to</strong>rs. It is designed just <strong>to</strong> isolate the biofuels impacts. Coarse grains acreage<br />
in the US is up by about 10%, while sugar, other grains, and other crops are all down. �e<br />
productivity-weighted rise in coarse grains acreage is 10% (Table 3). �is increase in maize<br />
acreage in the US comes from contribution of land from other land-using sec<strong>to</strong>rs such as<br />
other grains (Table 3) as well as pasture land and commercial forest land – <strong>to</strong> which we<br />
will turn momentarily.<br />
From Table 2, we see that US oilseeds acreage is up slightly due <strong>to</strong> the in�uence of EU<br />
policies on the global oilseeds market. However, this marginal increase is dwarfed by the<br />
increased acreage devoted <strong>to</strong> oilseeds in other regions, where the percentage increases range<br />
from 11 <strong>to</strong> 16% in Latin America, and 14% in Southeast Asia and Africa, <strong>to</strong> 40% in the EU.<br />
If the EU really intends <strong>to</strong> implement its 2015 renewable fuels target, there will surely be<br />
a global boom in oilseeds. Coarse grains acreage in most other regions is also up, but by<br />
much smaller percentages. Clearly the US-led <strong>ethanol</strong> boom is not as signi�cant a fac<strong>to</strong>r<br />
as the EU oilseeds boom. <strong>Sugarcane</strong> area rises in Brazil, but declines elsewhere, and other<br />
grains and crops are somewhat of a mixed bag, with acreage rising in some regions <strong>to</strong> make<br />
up for diminished production in the US and EU and declines elsewhere.<br />
From an environmental point of view, the big issue is not which crops are grown, but how<br />
much cropland is demanded overall, and how much (and where) grazing and forestlands<br />
are converted <strong>to</strong> cropland. �ese results are very sensitive <strong>to</strong> the productivity of land in the<br />
pasture and forest categories compared <strong>to</strong> cropland. We recognize that more work needs<br />
<strong>to</strong> be done on certain land categories such as idled land and cropland pasture in the US<br />
and the savannah in Brazil. �erefore the numerical results reported here must be taken<br />
as only illustrative of the results that will be available once the land data base is improved.<br />
Table 3 reports the percentage <strong>change</strong>s in di�erent land cover areas as a result of the EU<br />
and US mandates. Furthermore, as with the output <strong>change</strong>s in Table 1, we decompose<br />
this <strong>to</strong>tal in<strong>to</strong> the portion due <strong>to</strong> each region’s biofuels programs. From the �rst group of<br />
columns, we see that crop cover is up in nearly all regions. Here we also see quite a bit of<br />
interaction between the two sets of programs. For example, in the US, about one-third of<br />
the rise in crop cover is due <strong>to</strong> the EU programs. In the EU, the US programs account for a<br />
small fraction of the rise in crop cover. In other regions, the EU programs play the largest<br />
role in increasing crop cover. For example, in Brazil, the EU programs account for nearly<br />
11% of the 14.2% rise in crop cover.<br />
Where does this crop land come from? In our framework it is restricted <strong>to</strong> come from<br />
pastureland and commercial forest lands, since we do not take in<strong>to</strong> account idle lands, nor do<br />
we consider the possibility of accessing currently inaccessible forests. �e largest percentage<br />
reductions tend <strong>to</strong> be in pasturelands (Table 3, �nal set of columns). For example, in Brazil,<br />
192 <strong>Sugarcane</strong> <strong>ethanol</strong>
The global impacts of US and EU biofuels policies<br />
Table 2. Change in crop harvested area by region, due <strong>to</strong> EU and US biofuel mandates: 2006-2015 (%).<br />
Region Crops<br />
Coarse<br />
grains<br />
Oilseeds <strong>Sugarcane</strong> Other grains Other agri<br />
USA 9.8 1.6 -5.7 -10 -2.7<br />
Canada 3.5 16.9 -3.2 -2.6 -1.6<br />
EU-27 -2.3 40 -7.4 -15.1 -6.1<br />
Brazil -3.2 16 3.8 -10.9 -5.1<br />
Japan 10.7 7.6 -0.7 0.8 -0.1<br />
China-Hong Kong 1.2 8.2 -0.6 -0.5 -0.5<br />
India -0.7 0.9 -0.7 0.5 -0.2<br />
Latin American energy<br />
exporters<br />
1.8 11.3 -2.3 -0.2 -0.8<br />
Rest of Latin America &<br />
Caribbean<br />
1.7 11.5 -1.6 -0.6 -0.3<br />
EE & FSU energy exporters 0.5 18.1 -0.6 0.4 -0.5<br />
Rest of Europe 2.3 10.5 0 1.8 0.4<br />
Middle Eastern North Africa<br />
energy exporters<br />
4 8.6 -0.9 2.5 -0.4<br />
Sub Saharan energy exporters -0.8 13.7 0 2.3 1.2<br />
Rest of North Africa & SSA 1.5 14.2 -0.4 1.1 1.1<br />
South Asian energy exporters -0.5 3.7 -0.9 -0.6 -0.1<br />
Rest of high income Asia 3.7 6.1 -0.1 -0.2 0<br />
Rest of Southeast & South Asia -0.2 2.9 -0.8 0 -0.1<br />
Oceania countries 3.9 17.2 -0.6 -1.3 0.3<br />
Note: These results are solely illustrative of the kinds of numerical results that are produced by the<br />
analysis. They are not definitive results.<br />
we estimate that pasturelands could decline by nearly 11% as a result of this global push for<br />
biofuels, of which 8% decline is from EU mandates alone. �e largest percentage declines<br />
in commercial forestry cover are in the EU and Canada, followed by Africa. In most other<br />
regions, the percentage decline in forest cover is much smaller.<br />
Our prospective analysis of the impacts of the biofuels boom on commodity markets focused<br />
on the 2006-2015 time period, during which existing investments and new mandates in the<br />
US and EU are expected <strong>to</strong> substantially increase the share of agricultural products (e.g.<br />
maize in the US, oilseeds in the EU, and sugar in Brazil) utilized by the biofuels sec<strong>to</strong>r. In<br />
<strong>Sugarcane</strong> <strong>ethanol</strong> 193
Chapter 8<br />
Table 3. Decomposition of <strong>change</strong> land cover by EU and US biofuel mandates (with Sensitivity Analysis):<br />
2006-2015 (% <strong>change</strong>).<br />
Crop cover<br />
USEU<br />
2015<br />
US<br />
2015<br />
EU<br />
2015<br />
Confidence<br />
interval (95%)<br />
Lower Upper<br />
US 7 4.7 2.3 3.5 10.8<br />
Canada 11.3 2.9 8.4 4.7 18.0<br />
EU-27 14.3 0.9 13.4 8.0 20.7<br />
Brazil 14.2 3.5 10.7 7.0 21.5<br />
Japan 1.3 0.5 0.8 -0.1 2.7<br />
China-Hong Kong 1.9 0.5 1.4 -0.5 4.3<br />
India 1 0.1 0.9 -0.6 2.7<br />
Latin American EEx. 6.2 2.1 4.1 1.6 10.9<br />
Rest of Latin Am. 5.5 1.5 4.1 1.3 9.9<br />
EE & FSU EEx. 4.6 0.9 3.7 0.1 9.1<br />
Rest of Europe 6.8 1.3 5.5 2.1 11.5<br />
Middle Eastern N Africa EEx. 1.7 0.4 1.2 0.2 3.2<br />
Sub Saharan EEx. 6.9 1.6 5.3 1.7 12.1<br />
Rest of North Africa & SSA 9.9 2.1 7.8 3.3 16.6<br />
South Asian EEx. -0.2 0 -0.2 -0.9 0.5<br />
Rest of high income Asia 0.1 0 0 -0.1 0.2<br />
Rest of Southeast & South Asia 1.2 0.2 1 -0.3 2.7<br />
Oceania countries 6.6 1.5 5.1 1.6 11.7<br />
the US, this share could more than double from 2006 levels, while the share of oilseeds going<br />
<strong>to</strong> biodiesel in the EU could triple. In analyzing the biofuel policies in these regions, we<br />
decompose the contribution of each set of regional policies <strong>to</strong> the global <strong>change</strong>s in output<br />
and land use. �e most dramatic interaction between the two sets of policies is for oilseed<br />
production in the US, where the sign of the output <strong>change</strong> is reversed in the presence of EU<br />
mandates (rising rather than falling). �e other area where they have important interactions<br />
is in the aggregate demand for crop land. About one-third of the growth in US crop cover<br />
is attributed <strong>to</strong> the EU mandates. When it comes <strong>to</strong> the assessing the impacts of these<br />
mandates on third economies, the combined policies have a much greater impact than just<br />
the US or just the EU policies alone, with crop cover rising sharply in Latin America, Africa<br />
194 <strong>Sugarcane</strong> <strong>ethanol</strong>
Forest cover Pasture cover<br />
USEU<br />
2015<br />
US<br />
2015<br />
EU<br />
2015<br />
Confidence<br />
interval (95%)<br />
The global impacts of US and EU biofuels policies<br />
USEU<br />
2015<br />
US<br />
2015<br />
EU<br />
2015<br />
Confidence<br />
interval (95%)<br />
Lower Upper Lower Upper<br />
-1.7 -1.3 -0.5 -2.6 -0.9 -4.9 -3.2 -1.7 -7.3 -2.6<br />
-6 -1.6 -4.4 -9.2 -2.8 -4.4 -1.1 -3.4 -6.9 -2.1<br />
-7.3 -0.5 -6.8 -10.4 -4.3 -5.6 -0.4 -5.3 -7.8 -3.5<br />
-1.7 -0.5 -1.2 -2.5 -0.9 -10.9 -2.7 -8.3 -15.8 -6.1<br />
-0.8 -0.3 -0.5 -1.8 0.2 -0.4 -0.2 -0.3 -0.8 -0.1<br />
0.1 0 0.2 -0.2 0.5 -2 -0.4 -1.6 -4.1 0.1<br />
0 0 0 -0.4 0.4 -1 -0.1 -0.9 -2.4 0.3<br />
-2 -0.8 -1.2 -3.3 -0.6 -4 -1.3 -2.7 -6.8 -1.2<br />
-0.3 -0.3 0 -1.5 0.9 -5 -1.1 -3.9 -8.3 -1.7<br />
-0.8 -0.2 -0.5 -3.6 2.0 -3.6 -0.6 -3 -6.0 -1.2<br />
-0.7 -0.3 -0.4 -2.0 0.7 -5.7 -0.9 -4.8 -9.2 -2.3<br />
-0.9 -0.2 -0.6 -1.7 0.0 -0.8 -0.2 -0.6 -1.4 -0.2<br />
-3.4 -0.8 -2.6 -6.3 -0.5 -3.2 -0.7 -2.5 -5.1 -1.2<br />
-3.4 -0.8 -2.6 -5.8 -1.1 -5.8 -1.1 -4.6 -9.2 -2.4<br />
0.5 0.1 0.4 -0.2 1.2 -0.3 -0.1 -0.2 -0.5 0.0<br />
0.1 0 0.1 0.0 0.2 -0.1 0 -0.1 -0.3 0.0<br />
0 0 0 -0.3 0.2 -1.1 -0.2 -0.9 -2.5 0.2<br />
-2.4 -0.6 -1.8 -4.0 -0.8 -3.9 -0.8 -3.1 -6.8 -1.0<br />
and Oceania as a result of the biofuel mandates. �ese increases in crop cover come at the<br />
expense of pasturelands (�rst and foremost) as well as commercial forests. It is these land<br />
use <strong>change</strong>s that have attracted great attention in the literature (e.g. Searchinger et al., 2008)<br />
and a logical next step would be <strong>to</strong> combine this global analysis of land use with estimates<br />
of the associated greenhouse gas emissions.<br />
4. Conclusions<br />
�is paper examines US <strong>ethanol</strong> policy options using a partial equilibrium model and<br />
US and EU options using a global general equilibrium model. �e partial equilibrium<br />
<strong>Sugarcane</strong> <strong>ethanol</strong> 195
Chapter 8<br />
results clearly illustrate the new linkage between energy and agricultural markets. Prices<br />
of agricultural commodities in the future will be driven not only by demand and supply<br />
relationships for the agricultural commodities themselves, but also by the price of crude oil.<br />
Ethanol from maize and sugarcane can be produced economically at high crude oil prices.<br />
�e US policy interventions have enabled the <strong>ethanol</strong> industry <strong>to</strong> exist and grow over the<br />
past 30 years. Today the government interventions continue <strong>to</strong> be important, but the new<br />
added driver is high oil prices.<br />
When one examines the US and EU policies <strong>to</strong>gether, one sees clearly that the impacts are<br />
felt around the world. Trade and production patterns are a�ected in every region. �e results<br />
presented here are very preliminary, but they serve <strong>to</strong> illustrate how the analysis can be used<br />
<strong>to</strong> estimate global production, trade, and land use impacts of US and EU policies.<br />
Acknowledgements<br />
�e author acknowledges the collaboration of Dileep Birur, Tom Hertel, and Farzad<br />
Taheripour.<br />
References<br />
Abbott, P., C. Hurt and W. Tyner, 2008. What’s Driving Food Prices? Farm Foundation Issue Report, July<br />
2008. Available at: www.farmfoundation.org.<br />
Earth Policy Institute, 2006. World Ethanol Production. Available at: www.earthpolicy.org/Updates/2005/<br />
Update49_data.htm.<br />
Energy Information Administration, 2008. U.S. Department of Energy. Available at: www.eia.doe.gov.<br />
European Biodiesel Board, 2007. �e EU Biodiesel Industry. Available at: www.ebb-eu.org/stats.php.<br />
Harrison, W.J., J.M. Horridge and K.R. Pearson, 2000 Decomposing Simulation Results with Respect <strong>to</strong><br />
Exogenous Shocks. Computational Economics 15: 227-249.<br />
Hertel, T.W., W.E. Tyner and D.K. Birur, 2008 Biofuels for all? Understanding the Global Impacts of<br />
Multinational Mandates GTAP Working Paper No. 51, 2008.<br />
Renewable Fuels Association, 2007. World Fuel Ethanol Production. Available at: www.<strong>ethanol</strong>rfa.org/<br />
industry/statistics/#A.<br />
Searchinger, T., R. Heimlich, R.A. Hough<strong>to</strong>n, F. Dong, A. Elobeid, J. Fabiosa, S. Tokgoz, D. Hayes and T.-<br />
H. Yu, 2008. Use of U.S. Croplands for Biofuels Increases Greenhouse Gases �rough Emissions from<br />
Land-Use Change. Science 317: 1238-1240.<br />
Tyner, W.E., 2008. �e US Ethanol and Biofuels Boom: Its Origins, Current Status, and Future Prospects.<br />
BioScience 58: 646-53.<br />
Tyner, W.E. and F. Taheripour, 2007. Future Biofuels Policy Alternatives. paper presented at the Farm<br />
Foundation/USDA conference on, April 12-13, 2007, St. Louis, Missouri. In: Biofuels, Food, and<br />
Feed Tradeoffs, pp. 10-18. Available at: http://www.farmfoundation.org/projects/documents/<br />
Tynerpolicyalternativesrevised4-20-07.pdf.<br />
196 <strong>Sugarcane</strong> <strong>ethanol</strong>
The global impacts of US and EU biofuels policies<br />
Tyner, W. and F. Taheripour, 2008a. Policy Options for Integrated Energy and Agricultural Markets. Review<br />
of Agricultural Economics 30, in press.<br />
Tyner, W. and F. Taheripour, 2008b. Policy Analysis for Integrated Energy and Agricultural Markets in<br />
a Partial Equilibrium Framework. Paper Presented at the Transition <strong>to</strong> a Bio-Economy: Integration<br />
of Agricultural and Energy Systems conference on February 12-13, 2008. Available at: www.agecon.<br />
purdue.edu/papers.<br />
Tyner, W.E., F. Dooley, C. Hurt and J. Quear, 2008. Ethanol Pricing Issues for 2008. Industrial Fuels and<br />
Power, February 2008: 50-57.<br />
U.S. Congress, 2007. Energy Independence and Security Act of 2007. H.R. 6, 110 Congress, 1 st session.<br />
Available at: http://www.whitehouse.gov/news/releases/2007/12/20071219-1.html.<br />
U.S. Congress, 2008. 2008 Farm Bill. H. R. 6124 (P.L. 110-246).<br />
<strong>Sugarcane</strong> <strong>ethanol</strong> 197
Chapter 9<br />
Impacts of sugarcane bio<strong>ethanol</strong> <strong>to</strong>wards the Millennium<br />
Development Goals<br />
Annie Dufey<br />
1. Introduction<br />
At the Millennium Summit in September 2000 the largest gathering of world leaders in<br />
his<strong>to</strong>ry adopted the United Nations Millennium Declaration. �ey committed <strong>to</strong> a new<br />
global partnership <strong>to</strong> reduce extreme poverty by 2015 in line with a series of targets that<br />
have become known as the Millennium Development Goals (MDGs). �e MDGs are cra�ed<br />
around eight themes <strong>to</strong> promote sustainable development addressing extreme poverty in its<br />
di�erent dimensions including hunger, health, education, the promotion of gender quality<br />
and environmental sustainability (see Box 1).<br />
At the same time, during the last �ve years or so, the world has witnessed the global emergence<br />
of a new sec<strong>to</strong>r – the biofuels sec<strong>to</strong>r. Biofuels potential for achieving simultaneously<br />
economic, poverty reduction and environmental goals have combined and placed biofuels<br />
at the <strong>to</strong>p of <strong>to</strong>day’s most pressing policy agendas.<br />
�is chapter argues that sugarcane bio<strong>ethanol</strong> can be supportive of sustainable development<br />
and poverty reduction, thus contributing <strong>to</strong> the achievement of the MDGs. In some<br />
contexts there might be synergies between the pursue of di�erent goals but there may be<br />
Box 1. The Millennium Development Goals.<br />
The eight Millennium Development Goals were agreed at the United Nations Millennium Summit<br />
in September 2000. The eight Millennium Development Goals are:<br />
•<br />
•<br />
•<br />
•<br />
•<br />
•<br />
•<br />
•<br />
Eradicate extreme poverty and hunger<br />
Achieve universal primary education<br />
Promote gender equality and empower women<br />
Reduce child mortality<br />
Improve maternal health<br />
Combat HIV and AIDS, malaria and other diseases<br />
Ensure environmental sustainability<br />
Develop a global partnership for development<br />
Source: http://www.un.org/millenniumgoals/<br />
<strong>Sugarcane</strong> <strong>ethanol</strong> 199
Chapter 9<br />
also risks and serious trade-o�s over food security, small farmers inclusion, environment<br />
and the economy.<br />
Much of the available evidence comes from Brazil, which has the main longstanding<br />
experience with the launching of the PROALCOOL Programme in 1975 <strong>to</strong> replace<br />
imported gasoline with bio<strong>ethanol</strong> produced from locally grown sugarcane. Today Brazil is<br />
the second bio<strong>ethanol</strong> producer a�er the United States and the main exporter. In addition,<br />
there have been other smaller initiatives with di�erent rate of success. �ese include<br />
African and East Asian countries such as Zimbabwe, Malawi, Kenya, Pakistan and India<br />
that have promoted bio<strong>ethanol</strong> from sugarcane molasses, some of them since the early<br />
eighties. More widely, at present, many countries around the world, in their search for<br />
development and poverty reduction opportunities are trying <strong>to</strong> replicate the Brazilian<br />
experience with sugarcane bio<strong>ethanol</strong>. �eir vast majority are developing countries in<br />
tropical and semitropical areas in the Caribbean, Africa, Latin America and East Asia in<br />
which sugarcane is traditionally grown.<br />
�e chapter is organized as follows. A�er this brief introduction, Section 2 argues that<br />
sugarcane bio<strong>ethanol</strong> may o�er some genuine opportunities for sustainable development<br />
and poverty reduction and identify the key potential bene�ts. Section 3 points out that<br />
bene�ts are not straightforward and identi�es several challenges and trade-o�s that need <strong>to</strong><br />
be confronted in order <strong>to</strong> realize their full potential for achieving sustainable development<br />
and poverty reduction. Finally, section 4 concludes and provides some recommendations.<br />
2. Opportunities for sugarcane bio<strong>ethanol</strong> in achieving sustainable<br />
development and the Millennium Development Goals<br />
<strong>Sugarcane</strong> bio<strong>ethanol</strong> can contribute <strong>to</strong> sustainable development and poverty reduction<br />
through a varied range of environmental, social and economic advantages over fossil fuels.<br />
�ese include: (a) enhanced energy security both at national and local level; (b) improved<br />
social well-being through better energy services especially among the poorest; (c) improved<br />
trade balance by reducing oil imports; (d) rural development and better livelihoods; (e)<br />
product diversi�cation leaving countries better-o� <strong>to</strong> deal with market �uctuations; (f)<br />
creation of new exports opportunities; (g) potential <strong>to</strong> help tackling <strong>climate</strong> <strong>change</strong> through<br />
reduced emissions of greenhouse gases (h) reduced emissions of other air contaminants;<br />
and (i) opportunities for investment attraction through the carbon �nance markets. �is<br />
section brie�y addresses each of these aspects.<br />
2.1. Enhanced energy security<br />
Enhanced energy security has become a universal geopolitical policy concern and it was a<br />
key policy driver behind the �rst attempts <strong>to</strong> introduce sugarcane bio<strong>ethanol</strong> at a massive<br />
scale in the mid-1970s in Brazil (Dufey et al., 2007b). Current increasing energy costs and<br />
200 <strong>Sugarcane</strong> <strong>ethanol</strong>
Impacts of sugarcane bio<strong>ethanol</strong> <strong>to</strong>wards the Millennium Development Goals<br />
uncertainty regarding future energy supply are giving many governments incentive <strong>to</strong><br />
encourage the production of petroleum substitutes from agricultural commodities. Indeed,<br />
the volatility of world oil prices, uneven global distribution of oil supplies, uncompetitive<br />
structures governing the oil supply and heavy dependence on imported fuels are all fac<strong>to</strong>rs<br />
that leave many countries vulnerable <strong>to</strong> disruption of supply, imposing serious energy<br />
security risks which can result in physical hardships and economic burden (Dufey, 2006).<br />
For instance, crude oil imports <strong>to</strong> African, Caribbean and Paci�c countries were expected<br />
<strong>to</strong> increase <strong>to</strong> 72 percent of their requirements in 2005 (Coelho, 2005).<br />
Energy diversi�cation makes countries less vulnerable <strong>to</strong> oil price shocks, compromising<br />
macro-stability a�ecting variables such as the ex<strong>change</strong> rate, in�ation and debt levels<br />
(Cloin, 2007). <strong>Sugarcane</strong> bio<strong>ethanol</strong> is a rational choice in countries where sugarcane can<br />
be produced at reasonable cost without adverse social and environmental impacts (Dufey<br />
et al., 2007b). For remote places, locally produced sugarcane bio<strong>ethanol</strong> can o�er a highly<br />
competitive alternative <strong>to</strong> other fuels. �is might be the case of several sugarcane producing<br />
countries in Paci�c island nations and land-locked countries in Africa where the high costs<br />
of fossil fuel transportation and the related logistics make them prohibitive.<br />
2.2. Benefits at the household level - improved social well-being<br />
A large part of the poor, mostly in rural areas, do not have access <strong>to</strong> a�ordable energy services<br />
which a�ects their chances of bene�ting from economic development and improved living<br />
standards. In this context the use of bio<strong>ethanol</strong> and other renewable sources can directly<br />
or indirectly lead <strong>to</strong> several MDGs including gender equality, reduction of child mortality,<br />
poverty reduction, improvement of maternal health and environmental sustainability.<br />
Firstly, they can reduce the time spent by women and children on basic survival activities<br />
(gathering �rewood, fetching water, cooking, etc.). Women in least developed countries<br />
may spend more than one third of their productive life collecting and transporting wood.<br />
Additional help needed from children o�en prevents them from attending school (FAO,<br />
2007). Secondly, the use of bio<strong>ethanol</strong> (and other liquid biofuels) for household cooking<br />
and heating could help <strong>to</strong> reduce respira<strong>to</strong>ry disease and death associated with burning of<br />
other traditional forms of fuels usually used in the poorest countries (e.g charcoal, fuelwood<br />
and para�n solid biomass fuels indoors), <strong>to</strong> which women and children are especially<br />
vulnerable (UN-Energy, 2007; Woods and Read, 2005). In some African countries charcoal<br />
and woodfuel account for over 95 percent of household fuel (Johnson and Rosillo-Calle,<br />
2007). As Box 2 suggests, experiences promoting the use of sugarcane bio<strong>ethanol</strong> in s<strong>to</strong>ves<br />
at the household level are expected <strong>to</strong> report important socio-economic and environmental<br />
bene�ts. Finally, the use of biofuels can improve access <strong>to</strong> pumped drinking water, which can<br />
reduce hunger by allowing for cooked food (95% of food needs cooking) (Gonsalves, 2006a).<br />
However, adaptation of bio<strong>ethanol</strong> for domestic uses would of course require a cultural shi�<br />
away from the traditional hearth, plus attention <strong>to</strong> safety in fuel s<strong>to</strong>rage, as liquid biofuels<br />
are highly �ammable (Dufey et al., 2007b). Overall, electricity through transmission lines <strong>to</strong><br />
<strong>Sugarcane</strong> <strong>ethanol</strong> 201
Chapter 9<br />
Box 2. Bio<strong>ethanol</strong> s<strong>to</strong>ves <strong>to</strong> condominium residents in Addis Ababa in Ethiopia<br />
In Ethiopia the Municipality of Addis Ababa EPA (Environmental Protection Authority) and a Sub-<br />
City district are working closely with Gaia Association, Dometic AB, Makobu Enterprises, and<br />
Finchaa Sugar Fac<strong>to</strong>ry <strong>to</strong> develop a project whereby initially 2000 CleanCook (CC) s<strong>to</strong>ves will be<br />
installed in newly built condominium apartments. Wood and charcoal s<strong>to</strong>ves are not permitted<br />
in these condominium buildings.<br />
The CC s<strong>to</strong>ve is financed within the condominium unit price. Financing is provided by the<br />
condominium association with the assistance of the Municipal EPA, the Sub-City Administration<br />
and a financing entity. The finance rate is regulated by the government and is kept low. The<br />
bio<strong>ethanol</strong> used in the project is produced at one of three state-owned sugar fac<strong>to</strong>ries at a<br />
contractual price by Makobu Enterprises and delivered <strong>to</strong> the condominium. The fuel s<strong>to</strong>rage and<br />
distribution infrastructure will be financed by the condominium association. The Ethiopian EPA<br />
will work with one Sub-City Administration <strong>to</strong> package the s<strong>to</strong>ve financing in<strong>to</strong> the condominium<br />
financing through the national bank. As a result, 2000 CC s<strong>to</strong>ves will be financed in 2008 and<br />
approximately 360,000 liters of domestically produced bio<strong>ethanol</strong> will supplant kerosene,<br />
charcoal and firewood use. The other nine Sub-City administrations could replicate the model.<br />
Since the CC s<strong>to</strong>ve is clean burning, its introduction will improve indoor air quality and,<br />
consequently, household health. Another advantage of this model lies in the potential for Clean<br />
Development Mechanism (CDM) financing. It is important <strong>to</strong> note the government has had a<br />
central role for the development of a domestic bio<strong>ethanol</strong> industry in Ethiopia, as well as for<br />
building a local market for bio<strong>ethanol</strong> as a household cooking fuel. Indeed, after considering<br />
allocating bio<strong>ethanol</strong> for fuel blending in the transport sec<strong>to</strong>r in 2006, the Government got<br />
convinced that the most significant socioeconomic and environmental benefits would stem from<br />
prioritizing the use in the domestic household sec<strong>to</strong>r.<br />
Source: adapted from Lambe (2008).<br />
many rural areas is unlikely <strong>to</strong> happen in the near future, so access <strong>to</strong> modern decentralized<br />
small-scale energy technologies, particularly renewables are an important element for<br />
e�ective poverty alleviation policies (Gonsalves, 2006a). In this context, bio<strong>ethanol</strong> can<br />
be directed <strong>to</strong>wards high value added uses such as lighting or mo<strong>to</strong>rs, which can lead <strong>to</strong><br />
income generating activities.<br />
But the e�ectiveness of using sugarcane bio<strong>ethanol</strong> for these uses would need <strong>to</strong> be assessed<br />
against those of other energy crops or renewable sources such as small hydropower.<br />
2.3. Improved trade balance<br />
Heavy reliance on foreign energy sources means countries have <strong>to</strong> spend a large proportion<br />
of their foreign currency reserves on oil imports. Oil import dependency is especially acute<br />
202 <strong>Sugarcane</strong> <strong>ethanol</strong>
Impacts of sugarcane bio<strong>ethanol</strong> <strong>to</strong>wards the Millennium Development Goals<br />
in Sub-Saharan and East Asian countries, where 98 percent and 85 percent of their oil needs<br />
are met by imports, respectively (ESMAP, 2005a). Changes in oil prices have devastating<br />
e�ects in these countries. For instance, the 2005 oil price surge reduced Gross Domestic<br />
Product growth of net oil importing countries from 6.4 percent <strong>to</strong> 3.7 percent, and, as a<br />
consequence, the number of people in poverty rose by as much as 4-6 percent, with nearly<br />
20 countries experiencing increases of more than 2 percent (ESMAP, 2006).<br />
Domestically produced bio<strong>ethanol</strong> o�ers oil importing countries an opportunity <strong>to</strong> improve<br />
their trade balance. In Brazil, for instance, the replacement of imported gasoline by sugarcane<br />
bio<strong>ethanol</strong> saved the country some US$ 61 billion in avoided oil imports during the last<br />
eight years – equating the <strong>to</strong>tal amount of the Brazilian external public debt (FAO, 2007).<br />
In Colombia, the implementation of the bio<strong>ethanol</strong> programme would result in foreign<br />
ex<strong>change</strong> savings of US$ 150 million a year (Echeverri-Campuzano, 2000).<br />
2.4. Rural development and creation of sustainable livelihoods<br />
Biofuels provide new economic opportunities and employment in the agricultural sec<strong>to</strong>r,<br />
key aspects for poverty reduction. �ey generate a new demand for agricultural products<br />
that goes beyond traditional food, feed and �bre uses, expanding domestic markets for<br />
agricultural produce and paving the way for more value-added produce. All of these<br />
aspects enhance rural development, especially in developing countries where most of the<br />
population live in rural areas. For instance, Echeverri-Campuzano (2002) estimates that<br />
every Colombian farming family engaged in bio<strong>ethanol</strong> production will earn two <strong>to</strong> three<br />
times the minimum salary (US$ 4,000/year). In South Africa meeting targets of E8 and<br />
B2 would contribute 0.11 percent <strong>to</strong> the country’s Gross Domestic Product. Most of the<br />
positive e�ect would take place in rural areas characterized by unemployment and rising<br />
poverty (Cartwright, 2007).<br />
Compared <strong>to</strong> other sources of energy, biofuels are labour intensive. �eir production is<br />
expected <strong>to</strong> generate more employment per unit of energy than conventional fuels and<br />
more employment per unit investment than in the industrial, petrochemical or hydropower<br />
sec<strong>to</strong>r (UN-Energy, 2007). Creation of rural employment and the related livelihoods are<br />
all key aspects for rural development and poverty reduction. In Brazil estimations of direct<br />
employment associated with sugarcane bio<strong>ethanol</strong> production ranges from 500,000 and 1<br />
million (Worldwatch Institute, 2006; FAO, 2007) with indirect employment in the order of<br />
6 million. Although most of them are �lled by the lower-skilled, poorest workers in rural<br />
areas (Macedo, 2005), average earnings are considered better than in other sec<strong>to</strong>rs as the<br />
average family income of the employees ranks in the upper 50 percentile (FAO, 2007). In<br />
India, country that houses 22 percent of the world’s poor, the sugarcane industry including<br />
bio<strong>ethanol</strong> production is the biggest agroindustry in the country and the source of livelihood<br />
of 7.5 percent of the rural population. Half a million people are employed as skilled or semiskilled<br />
labourers in sugarcane cultivation (Gonsalves, 2006a).<br />
<strong>Sugarcane</strong> <strong>ethanol</strong> 203
Chapter 9<br />
�e highest impact on poverty reduction is likely <strong>to</strong> occur where sugarcane bio<strong>ethanol</strong><br />
focuses on local consumption, involving the participation and ownership of small farmers<br />
in the production and processing (FAO, 2007; Dufey et al., 2007b) and where processing<br />
facilities are near <strong>to</strong> the cultivation �elds.<br />
2.5. Product diversification and value added<br />
International sugarcane market is one of the most dis<strong>to</strong>rted markets. It is highly protected,<br />
in general countries manage <strong>to</strong> negotiate quotas, a limited access <strong>to</strong> di�erent markets,<br />
and because it is a commodity, it has important price �uctuations (Murillo, 2007). In this<br />
context, sugarcane bio<strong>ethanol</strong> is an opportunity <strong>to</strong> promote agricultural diversi�cation<br />
leaving producers in a more favourable situation <strong>to</strong> deal with <strong>change</strong>s in prices and other<br />
market �uctuations. In Brazil, for instance, besides the pursue of enhanced energy security,<br />
the government promoted the PROALCOOL programme in order <strong>to</strong> deal with the fall<br />
in international sugar prices preventing thus the industry of having idle capacity (FAO,<br />
2007). Moreover, the production of both sugar and bio<strong>ethanol</strong> gives the Brazilian industry<br />
�exibility in responding <strong>to</strong> the changing pro�tability of sugar and bio<strong>ethanol</strong> production<br />
worldwide. In most cases, sugar and bio<strong>ethanol</strong> are produced in the same mills (Bolling<br />
and Suarez, 2001).<br />
<strong>Sugarcane</strong> bio<strong>ethanol</strong> can also reduce vulnerability through diversi�cation. �e <strong>change</strong>s in<br />
the European Union’s sugar regime will imply that many African, Caribbean and Paci�c<br />
countries will see their market access preferences eroded generating negative impacts<br />
on poverty levels. In the Caribbean, for instance, the associated possible loss of export<br />
revenues is expected <strong>to</strong> be 40 percent with a heavy contraction in the industry. �e resulting<br />
sugar surpluses therefore could be accommodated for biofuels production thus helping the<br />
industry <strong>to</strong> diversify, avoiding or mitigating the expected contraction (E4Tech, 2006).<br />
Another element <strong>to</strong> consider is the fact that sugarcane bio<strong>ethanol</strong> production provides value<br />
added <strong>to</strong> sugarcane production. For instance, Murillo (2007) notes for Costa Rica that if the<br />
molasses and sugar producers substitute their production by those of bio<strong>ethanol</strong> the price<br />
received would be much more than what they would get if they were <strong>to</strong> continue producing<br />
molasses or sugar for the surplus market.<br />
2.6. Export opportunities<br />
Although at present very little bio<strong>ethanol</strong> enter the international market (about 10%),<br />
international trade is expected <strong>to</strong> expand rapidly, as the global increase in consumption<br />
(especially countries in the North) will not coincide geographically with the scaling up of<br />
production (countries in the South) (Dufey, 2006). �e geographical mismatch between global<br />
supply and demand represents an opportunity for countries with signi�cant cost advantages<br />
204 <strong>Sugarcane</strong> <strong>ethanol</strong>
Impacts of sugarcane bio<strong>ethanol</strong> <strong>to</strong>wards the Millennium Development Goals<br />
in sugarcane production <strong>to</strong> develop new export markets and <strong>to</strong> increase their export revenues.<br />
�ese are invariably developing countries in tropical and semitropical areas.<br />
Brazil, the main global bio<strong>ethanol</strong> exporter, increased its exports considerably over the<br />
last few years and <strong>to</strong>day supplies about 50 percent of international demand. (Dufey et al.,<br />
2007b). �e Brazilian government expects that by 2015 about 20 percent of the national<br />
production <strong>to</strong> be exported (Ministerio da Agricultura et al., 2006). Countries from the<br />
Caribbean Basin Initiative are developing export-oriented sugarcane bio<strong>ethanol</strong> industries<br />
taking advantage of preferential market access provided by the trade agreement with the<br />
United States. Other exporters include Peru, Zimbabwe and China. As them other Latin<br />
American, African and East Asian countries are exploring the bene�ts of export-oriented<br />
sugarcane bio<strong>ethanol</strong> sec<strong>to</strong>rs.<br />
In absence of trade dis<strong>to</strong>rting policies and where e�ective distributional and social policies<br />
are supportive, the development of a successful sugarcane bio<strong>ethanol</strong> export-oriented<br />
industry could e�ectively reduce poverty.<br />
2.7. Reduced greenhouse gas emissions<br />
At present global warming is considered one of the key global threats facing the humanity<br />
(Stern, 2006). Biofuels alleged reduced greenhouse gas emissions compared <strong>to</strong> fossil fuels<br />
are one of the main policy rationales for their promotion especially in Northern countries.<br />
�ere are two ways in which biofuels can reduce carbon emissions. First, over their life cycle,<br />
biofuels absorb and release carbon from the atmospheric pool without adding <strong>to</strong> the overall<br />
pool (in contrast <strong>to</strong> fossil fuels). Second, they displace use of fossil fuels (Kartha, 2006).<br />
However, biofuels production does, in most cases, involve consumption of fossil fuels.<br />
Compared <strong>to</strong> other types of liquid biofuels and under certain circumstances, Brazilian<br />
sugarcane bio<strong>ethanol</strong> and second generation biofuels show the higher reductions in<br />
greenhouse gas emissions relative <strong>to</strong> standard fuels. IEA (2004) estimates that greenhouse<br />
emissions from sugarcane bio<strong>ethanol</strong> in Brazil are 92 percent lower than standard fuel, while<br />
wheat bio<strong>ethanol</strong> points <strong>to</strong> reductions ranging from 19 percent <strong>to</strong> 47 percent and reductions<br />
from sugar beet bio<strong>ethanol</strong> vary between 35 percent and 53 percent. In addition <strong>to</strong> Brazil’s<br />
exceptional natural conditions in terms of high soil productivity and that most sugarcane<br />
crops are rain fed, a key fac<strong>to</strong>r behind its great greenhouse emissions performance is that<br />
nearly all conversion plants’ processing energy is provided by ‘bagasse’ (the remains of the<br />
crushed cane a�er the juice has been extracted). �is means energy needs from fossil fuel are<br />
zero and the surplus bagasse is even used for electricity co-generation. In 2003, Brazil avoided<br />
5.7 million <strong>to</strong>nnes CO 2 equivalent due <strong>to</strong> the use of bagasse in sugar production (Macedo,<br />
2005). Moreover, new developments in the sec<strong>to</strong>r such as the commercial application of<br />
lignocelulosic technology that will allow the use of bagasse for bio<strong>ethanol</strong> production and<br />
<strong>Sugarcane</strong> <strong>ethanol</strong> 205
Chapter 9<br />
the increased generation of electricity from bagasse will improve their greenhouse emissions<br />
balance (Dufey et al., 2007a).<br />
However the Brazilian experience is not necessarily replicable in other contexts. For example,<br />
e�ciency gains and the greenhouse emissions reductions associated with co-generation are<br />
an option for those countries whose electricity sec<strong>to</strong>rs regulation allows power sale <strong>to</strong> the<br />
grid (E4Tech, 2006).<br />
Finally, these estimations do not include the emissions resulting from <strong>change</strong>s in land use<br />
and land cover induced by sugarcane plantations for bio<strong>ethanol</strong> production. For example,<br />
the evaluation of greenhouse emissions from Brazil for the 1990-1994 period points out<br />
the <strong>change</strong> in land use and forests as the fac<strong>to</strong>r accounting for most of the emissions (75%),<br />
followed by energy (23%). �is implies that if additional land use for sugarcane production<br />
leads (directly or indirectly) <strong>to</strong> conversion of pastures or forests as suggested later in this<br />
chapter, the greenhouse emissions may be severe and could have a major impact on the<br />
overall greenhouse emission balance (Smeets et al., 2006). Overall, the land use issue<br />
requires further attention and is addressed in another chapter of this book.<br />
2.8. Outdoor air quality<br />
Road transport is a growing contribu<strong>to</strong>r <strong>to</strong> urban air pollution in many developing country<br />
cities. One of the greatest costs of air pollution is the increased incidence of illness and<br />
premature death that result from human exposure <strong>to</strong> elevated levels of harmful pollutants.<br />
�e most important urban air pollutants <strong>to</strong> control in developing countries are lead, �ne<br />
particulate matter, and, in some cities, ozone. <strong>Sugarcane</strong> bio<strong>ethanol</strong>, when used neat, is a<br />
clean fuel (aside from increased acetaldehyde emissions). More typical use of bio<strong>ethanol</strong><br />
is in low blends. Bio<strong>ethanol</strong> also has the advantage of having a high blending octane<br />
number, thereby reducing the need for other high-octane blending components such as<br />
lead that cause adverse environmental e�ects. Venezuela, for instance, began importing<br />
Brazilian bio<strong>ethanol</strong> as part of the e�ort <strong>to</strong> eliminate lead from gasoline. Bio<strong>ethanol</strong> can<br />
be e�ective for cutting carbon monoxide emissions in winter in old technology vehicles as<br />
well as hydrocarbons emissions. �e latter are ozone-precursors, in old technology vehicles<br />
(ESMAP, 2005b).<br />
On the other hand, there is air pollution associated with the slush and burn of sugarcane<br />
and the burning of the straw, a common practice in developing countries <strong>to</strong> facilitate the<br />
harvesting. �is issue is further addressed in Section 3.b on Environmental Impacts.<br />
206 <strong>Sugarcane</strong> <strong>ethanol</strong>
Impacts of sugarcane bio<strong>ethanol</strong> <strong>to</strong>wards the Millennium Development Goals<br />
2.9. Opportunities for investment attraction – including the Clean Development<br />
Mechanism<br />
Developing countries can make use of the carbon �nance markets for attracting investment<br />
in<strong>to</strong> biofuels projects using the market value of expected greenhouse emission reductions.<br />
�e Clean Development Mechanism (CDM) under the Kyo<strong>to</strong> Pro<strong>to</strong>col is the most important<br />
example of the carbon market for developing countries. �e CDM allows developed countries<br />
(or their nationals) <strong>to</strong> implement project activities that reduce emissions in developing<br />
countries in return for certi�ed emission reductions (CERs). Developed countries can use<br />
the CERs generated by such project activities <strong>to</strong> help meet their emissions targets under the<br />
Kyo<strong>to</strong> Pro<strong>to</strong>col. For instance, it is calculated the Colombian Programme on bio<strong>ethanol</strong> would<br />
reduce CO 2 emissions by six million <strong>to</strong>ns, o�ering opportunities <strong>to</strong> obtain �nancial resources<br />
for the project trough the CDM (Echeverri-Campuzano, 2000). For Costa Rica, Horta (2006)<br />
estimates that considering an avoided <strong>to</strong>n of carbon at a conservative price of US$ 5, in the<br />
scope of the Kyo<strong>to</strong> Pro<strong>to</strong>col and the valid mechanisms of carbon trade, US$ 320,000/year<br />
can be obtained using a 10 percent of sugarcane bio<strong>ethanol</strong> in the gasoline blend.<br />
Although the CDM is a potential source of �nancing for biofuels projects, taking advantage<br />
of it can present a number of challenges for the developing country host. Firstly, so far<br />
there is no liquid-biofuels baseline and moni<strong>to</strong>ring methodology approved. Calculation<br />
of greenhouse gases emissions is not straightforward and for many countries biofuels are<br />
still a relatively expensive means of reducing these emissions relative <strong>to</strong> other mitigation<br />
measures. An additional challenge is that the existing experience with CDM projects shows<br />
that approved projects are strongly concentrated in a handful of large developing countries,<br />
with over 60 percent of all CDM projects distributed across China, India and Brazil alone.<br />
While there are simpli�ed procedures for small-scale projects, the current structure of<br />
the CDM tends <strong>to</strong> select for large-scale projects. �e transaction costs associated with<br />
registering a CDM project are o�en prohibitively expensive for smaller developing countries,<br />
which imply that economies of scale are relevant (Bakker, 2006). For bioenergy projects<br />
speci�cally, the exclusion of all land use activities from the CDM except for a�orestation and<br />
reforestation is another signi�cant limiting fac<strong>to</strong>r, since in the poorest developing countries,<br />
land-use related emissions make up the bulk of greenhouse gases emissions from biomass<br />
energy systems (Schlamadinger and Jürgens, 2004). Overall, as FAO (2007) concludes, while<br />
carbon credits might be in�uential in the future, currently the carbon market does not have<br />
a large in�uence over the economics of bioenergy production.<br />
3. Risks and challenges<br />
Section 2 analysed a diverse range of bene�ts associated with sugarcane bio<strong>ethanol</strong> in terms of<br />
its potential <strong>to</strong> support poverty reduction and environmental sustainability. However, as this<br />
section argues, these bene�ts are not straightforward. �ere is a range of challenges and tradeo�s<br />
that need <strong>to</strong> be confronted in order <strong>to</strong> realize the full potential that sugarcane bio<strong>ethanol</strong><br />
<strong>Sugarcane</strong> <strong>ethanol</strong> 207
Chapter 9<br />
o�ers <strong>to</strong> support the MDGs, which include: (a) impacts on food security; (b) environmental<br />
pressure; (c) small farmer inclusion and fair distribution of the value chain bene�ts; (d) land<br />
impacts; (e) employment quality; (f) need of government support; (g) existence of market<br />
access and market entry barriers and; (h) issues related <strong>to</strong> improved e�ciency, access <strong>to</strong><br />
technology, credit and infrastructure. �ese issues are addressed in the following.<br />
3.1. The food versus fuel debate<br />
Current food prices increases, the role that biofuels play on such rises and their related<br />
impacts on food security are, probably, one of the most controversial debates being held both<br />
at national and international fora. Indeed, food prices increased by 83 percent during the<br />
last three years (World Bank, 2008). �e Food and Agriculture Organization of the United<br />
Nations (FAO) food index price rose by nearly 40 percent in 2007, from a 9 percent increase<br />
in 2006 (IFPRI, 2008). World prices rose much more strongly in 2006 than anticipated for<br />
cereals, and <strong>to</strong> a lesser extent for oilseeds, but weakened for sugar (OECD-FAO, 2007).<br />
�e understanding of biofuels impacts on food security is a wider and complex. It requires<br />
considering that the link between food prices increases and food security is not unique<br />
and necessarily negative. It needs <strong>to</strong> be analysed in the context that <strong>change</strong>s in food prices<br />
not only impact food availability but also its accessibility through <strong>change</strong>s in incomes for<br />
farmers and rural areas (Schmidhuber, 2007).<br />
3.1.1. Impacts on food availability<br />
�e key question at the national level is whether the savings and gains from biofuels will<br />
outweigh additional food costs. Biofuels compete with food crops for land and water,<br />
potentially reducing food production where new agricultural land or water for irrigation are<br />
scarce (Dufey et al., 2007b). For biofuels that are manufactured from food crops, there is also<br />
direct competition for end-use. To what extent sugarcane bio<strong>ethanol</strong> creates competition for<br />
land and crowd out food crops is an issue that is not very clear. �e limited available evidence<br />
would suggest a lesser impact compared <strong>to</strong> other feeds<strong>to</strong>cks. Zarrilli (2006), for example,<br />
points out that sugarcane producing regions in Brazil stimulate rather than compete with<br />
food crops, which is done by two means. Firstly, through the additional income generated<br />
by sugarcane related agro-industrial activities which ‘capitalises’ agriculture and improves<br />
the general conditions for producing other crops. �is is also noted by Murillo (2007) for<br />
Costa Rica, where under current weather conditions and land use, sugarcane bio<strong>ethanol</strong><br />
production is seen as a complement in income generation rather than a competition for basic<br />
products and vegetables. Secondly, the high productivity of cane per unit of land compared<br />
<strong>to</strong> other feeds<strong>to</strong>cks enables a signi�cant production of cane, with a relatively small land<br />
occupation (Zarrilli, 2006). <strong>Sugarcane</strong>’s minimal land requirements but in the context of<br />
sub-Saharan Africa is noted by Johnson et al. (2006), but needs <strong>to</strong> be proven (Dufey et al.,<br />
2007b). Moreover, in those countries where bio<strong>ethanol</strong> is produced from sugarcane molasses<br />
208 <strong>Sugarcane</strong> <strong>ethanol</strong>
Impacts of sugarcane bio<strong>ethanol</strong> <strong>to</strong>wards the Millennium Development Goals<br />
there is no displacement of food crops (Ra� Khan et al., 2007). In addition, in many African<br />
countries, cassava and maize are grown for subsistence purposes while cane is o�en grown<br />
for sugar export. Diversion <strong>to</strong> fuel production is therefore more likely <strong>to</strong> adversely a�ect<br />
food availability in the case of cassava (Johnson and Rosillo-Calle, 2007)<br />
At the international level, the growing international demand for biofuels is expected <strong>to</strong><br />
reverse the long-term downward trend in global prices of agricultural commodities. Several<br />
studies have been conducted linking increased global biofuels production with rising<br />
agricultural commodity prices. Estimations vary widely with most credible ones going<br />
up <strong>to</strong> 30 percent. Other contributing fac<strong>to</strong>rs <strong>to</strong> price increases are the weather-related<br />
shortfalls in many key producing countries, reduced global s<strong>to</strong>cks, increased demand from<br />
new emerging economies in Asia (OECD-FAO, 2007) and speculation (IFPRI, 2008). In<br />
that sense, the higher demand for biofuel feeds<strong>to</strong>cks is viewed as increasing pressure on an<br />
already tight supply.<br />
However, it is one issue trying <strong>to</strong> isolate how much biofuels, in overall, are responsible<br />
for the sec<strong>to</strong>r’s in�ationary pressure and, a di�erent one, understanding <strong>to</strong> what extent<br />
sugarcane bio<strong>ethanol</strong> is responsible for the price increase. Although the available evidence<br />
in this sense is also scant, it would suggest that, compared <strong>to</strong> other feeds<strong>to</strong>cks, sugarcane<br />
bio<strong>ethanol</strong> would have a slighter impact on food security. A key reason behind this is that<br />
sugarcane is not a principal food crop. Staple grains like maize and rice are o�en the main<br />
food source for the poorest people, accounting for 63 percent of the calories consumed in<br />
low-income Asian countries, nearly 50 percent in Sub-Saharan Africa, and 43 percent in<br />
lower-income Latin American countries (IFPRI, 2008). Rosegrant (2008) in an exercise in<br />
which biofuel production was frozen at 2007 levels for all countries and for all crops used<br />
as feeds<strong>to</strong>cks, shows the smaller price reductions for sugarcane followed by wheat while the<br />
higher reductions are for maize (Figure 1). Another reason been argued is that sugarcane<br />
price would be relatively uncorrelated with other food crops (Oxfam, 2008).<br />
3.1.2. Impacts on accessibility<br />
�e issue of how the gains and costs of biofuels <strong>to</strong> food security are distributed across society<br />
has been less explored in the literature. FAO and other commenta<strong>to</strong>rs agree that hunger<br />
is largely a matter of access rather than supply, so that a focus on rural development and<br />
livelihoods makes more sense that trying <strong>to</strong> maximise global food supply, which for now<br />
at least is adequate for global needs (Murphy, 2007).<br />
Higher agricultural commodity prices are good news for agricultural producers, but they<br />
have an adverse impact on poorer consumers, who spends a much larger share of their<br />
income on food (IFPRI, 2008). �ere are also di�erences depending on whether households<br />
are net food producers or buyers. For small farmers that are net food producers, overall<br />
gains in welfare and food security are expected due <strong>to</strong> rising revenues from biofuel crops and<br />
<strong>Sugarcane</strong> <strong>ethanol</strong> 209
Chapter 9<br />
Price variation (%)<br />
14<br />
12<br />
10<br />
8<br />
6<br />
4<br />
2<br />
0<br />
Figure 1. Change in selected crop prices if biofuel demand was fixed at 2007 levels. Source: Rosegrant<br />
(2008).<br />
food crops (Peskett et al., 2007). In overall, poor consumers in urban areas who purchase<br />
all their food are expected <strong>to</strong> be worst o�. From this perspective and compared <strong>to</strong> other<br />
feeds<strong>to</strong>cks, sugarcane bio<strong>ethanol</strong> is likely <strong>to</strong> provide more limited opportunities <strong>to</strong> meet<br />
food security for small farmers. In Brazil, for example, sugarcane is a crop mainly grown<br />
under large-scale schemes, with limited participation of small farmers. In regions such as<br />
Asia, although small farmers participation in sugarcane cultivation is important, the need<br />
<strong>to</strong> use irrigation makes more unlikely <strong>to</strong> involve poorest farmers (ICRISAT, 2007). More<br />
widely, it is agreed that despite being producers of agricultural crops, most poor farming<br />
households in rural areas are net buyers of food (Dufey et al., 2007b; IFPRI, 2008).<br />
Finally, it should be noted that, his<strong>to</strong>rically, domestic food prices have not been tightly<br />
linked <strong>to</strong> international food or energy prices, as price transmission mechanisms are not<br />
straightforward (Hazell et al., 2005). For instance, agricultural pricing policies such as<br />
price �xation, the remoteness of some rural areas, trade dis<strong>to</strong>rtions and power structures<br />
governing agricultural commodity markets are key fac<strong>to</strong>rs preventing world prices from<br />
reaching domestic markets. �is may imply that farmers may not see the incentives <strong>to</strong><br />
<strong>change</strong> feeds<strong>to</strong>ck production in tandem with <strong>change</strong>s in international prices.<br />
3.2. Environmental pressure<br />
2010 2015<br />
Maize Wheat Sugar Oils Cassava<br />
Traditional environmental impacts associated with sugarcane appear when it comes<br />
<strong>to</strong> managing soil, water, agrochemicals, agricultural frontier expansion and the related<br />
biodiversity impacts. Among them, impacts on agricultural frontier and on water deserve<br />
especial attention. Regarding the former, it should be noted that the bulk of the sugarcane<br />
expansion in the last thirty years in Brazil has been concentrated in the central southern<br />
210 <strong>Sugarcane</strong> <strong>ethanol</strong>
Impacts of sugarcane bio<strong>ethanol</strong> <strong>to</strong>wards the Millennium Development Goals<br />
region of the country. Between 1992 and 2003, 94 percent of the expansion occurred in<br />
existing areas of agriculture or pastureland and only a small proportion of new agricultural<br />
borders were involved (Macedo, 2005). O�en the sugarcane crop replaced cattle grazing and<br />
other agricultural activities (e.g. citrus crops), which in turn moved <strong>to</strong> the central region of<br />
Brazil where the land is cheaper (Smeets et al., 2006). Land converted <strong>to</strong> agriculture in the<br />
sensitive area of the Cerrado savanna (which accounts for 25% of the national terri<strong>to</strong>ry)<br />
has been used for cattle grazing and/or planted <strong>to</strong> soya, with only a small proportion for<br />
sugarcane. However, given the new phase of expansion experiencing the sec<strong>to</strong>r for bio<strong>ethanol</strong><br />
production, new areas are expected <strong>to</strong> be converted <strong>to</strong> sugarcane, including the Cerrado<br />
of Ma<strong>to</strong> Grosso do Sul, Goiás and Minas Gerais (Dufey et al., 2007a). �is could further<br />
increase the pressure on the already a�ected biodiversity and produce greenhouse emissions.<br />
�ere is concern in this sense on the impacts that the substitution e�ect - sugarcane taking<br />
over existing pastureland or other crops that become less pro�table which in turn advance<br />
in<strong>to</strong> protected or marginal areas – may have on biodiversity. Indeed, in Brazil, substitution<br />
e�ect related impacts are considered more signi�cant than the direct e�ects of sugarcane<br />
expansion (Dufey, 2007). In Africa, on the other hand, land constraints appear unlikely in<br />
any near-term scenario, and resources such as water, as explained in the next paragraph,<br />
may turn out <strong>to</strong> be the key limiting fac<strong>to</strong>r (Johnson and Rosillo-Calle, 2007).<br />
Regarding water, sugarcane requires large amounts of water, both at the farming and<br />
processing level. Even in Brazil where most sugarcane is rain fed, irrigation is increasing.<br />
Energy cane, which is especially bred for energy production, requires more water and<br />
fertiliser than conventional sugarcane (Cloin, 2007). Water is likely <strong>to</strong> be a key limiting fac<strong>to</strong>r<br />
especially in dry and semi-dry areas in Africa and Asia. Bio<strong>ethanol</strong> impact on water quality<br />
is another issue and not only at the farming level due <strong>to</strong> the use of agrochemicals but also at<br />
the processing level. Vinasse, - a black residue resulting from the distillation of cane syrup - is<br />
hot and requires cooling. In the mountainous areas of north-eastern Brazil, for instance, the<br />
costs of pumping s<strong>to</strong>ring vinasse were prohibitive, and it was therefore released in<strong>to</strong> rivers,<br />
resulting in the pollution of rivers causing eutrophication and �sh kills. Currently, vinasse is<br />
used for ferti-irrigation of cane crops, <strong>to</strong>gether with wastewaters. Moreover, legislation has<br />
been implemented in Brazil <strong>to</strong> avoid the negative impacts of vinasse applications, although<br />
its coverage is incomplete and its enforcement is rather weak (Smeets et al., 2006). All in all,<br />
while steps have been taken in Brazil order <strong>to</strong> manage vinasse disposal, in countries such<br />
as Malawi it is still a major concern (Johnson and Rosillo-Calle, 2007).<br />
Furthermore, the air pollution associated with the slush and burn of sugarcane and the<br />
burning of the straw, a common practice in developing countries <strong>to</strong> facilitate the harvesting,<br />
is an additional issue. <strong>Sugarcane</strong> burning emits several gases including CO, CH 2 , ozone,<br />
non-methane organic compounds and particle matter that are potentially damaging for<br />
human health. Several studies were conducted in São Paulo in Brazil during the 1980s<br />
and 1990s <strong>to</strong> identify the impacts of sugarcane burning on human health. Although some<br />
studies did not found a link, others studies did con�rm the relationship (Smeets et al., 2006;<br />
<strong>Sugarcane</strong> <strong>ethanol</strong> 211
Chapter 9<br />
Dufey et al., 2007a). Legislation has been passed in Brazil by which sugarcane burning is<br />
<strong>to</strong> be completely phased out in the São Paulo State by 2031. In Southern Africa e�orts <strong>to</strong><br />
reduce sugarcane burning pre-harvesting have also been reported (Jackson, 2004), but in<br />
other countries it still remain a major practice.<br />
Overall, sugarcane bio<strong>ethanol</strong> production poses some speci�c environmental challenges that<br />
need <strong>to</strong> be carefully identi�ed and managed using a life cycle approach in order <strong>to</strong> achieve<br />
the MDG on environmental sustainability.<br />
3.3. Small farmers inclusion and fair distribution of the value chain benefits<br />
Addressing poverty means that biofuels should bene�t poor and small farmers overall.<br />
An emphasis on small farmers would provide livelihoods across the greatest section of<br />
the populations (Johnson and Rosillo-Calle, 2007). But the competitiveness of a biofuels<br />
industry is highly dependent on gaining economies of scale. O�en large-scale systems are<br />
more globally competitive and export oriented, while small-scale systems o�er greater<br />
opportunities for employment generation and poverty alleviation (Dufey et al., 2007b).<br />
In Brazil, the sugarcane business model is characterised by enormous concentration of<br />
land and capital, which highlights the need for a better inclusion of small-scale producers<br />
(Dufey et al., 2007a). Increasing economies of scale and land concentration have meant<br />
that bene�ts of sugarcane bio<strong>ethanol</strong> production for small land owners have so far been<br />
limited and large farmers and industrialists have bene�ted more from the expansion of<br />
the industry (Peskett et al., 2007). In contrast, in countries such as India and South Africa<br />
small farmers are key players in the sugarcane sec<strong>to</strong>r. In India, they represent between 60<br />
and 70 percent of the cane growers (Johnson and Rosillo-Calle, 2007). In Costa Rica, the<br />
proportion of small producers in the sugarcane sec<strong>to</strong>r increased by 97 percent between<br />
2000 and 2005 (Murillo, 2007).<br />
Small farmers face several obstacles in trying <strong>to</strong> access supply chains. �ey trade-o� high<br />
transportation costs getting crops <strong>to</strong> processing plants with selling through middlemen<br />
(Peskett et al., 2007; Ra� Khan et al., 2007). In India, farmers must access <strong>to</strong> irrigation <strong>to</strong> be<br />
competitive, which is increasingly di�cult and expensive due <strong>to</strong> growing water scarcity and<br />
cost (ICRISAT, 2007). At processing plants they have <strong>to</strong> time delivery <strong>to</strong> �t daily plant capacity<br />
and meet plant standards. Either way, small producers are price-takers (Peskett et al., 2007).<br />
Box 3 highlights some of the challenges faced by sugarcane small farmers in Pakistan.<br />
However, large-scale and small-scale systems are not mutually exclusive and can interact<br />
successfully in a number of di�erent ways (Dufey et al., 2007b). Some of the models for<br />
partnership between large-scale and small-scale enterprises include outgrower schemes,<br />
cooperatives, marketing associations, service contracts, joint ventures and share-holding<br />
by small-scale producers (Mayers and Vermeulen, 2002). Concerning sugarcane, in Brazil<br />
co-operatives operate in certain areas (Oxfam, 2008). In India some of the sugar mills are<br />
212 <strong>Sugarcane</strong> <strong>ethanol</strong>
Impacts of sugarcane bio<strong>ethanol</strong> <strong>to</strong>wards the Millennium Development Goals<br />
Box 3. Unfair distribution of benefits against small farmers - middleman in Pakistan.<br />
In Pakistan, where bio<strong>ethanol</strong> is produced from sugarcane molasses, middlemen play a key role<br />
in sugarcane procurement and often end up exploiting small-scale farmers forcing them <strong>to</strong> sell at<br />
distress prices. In collusion with mill owners, they orchestrate delays at the mill gate; the problem<br />
becomes exacerbated during surplus years. The farmer has no option but <strong>to</strong> accept the price<br />
offered (lower than the support price) or face further delays. Large farmers are better placed<br />
as their crop represents a large proportion of the mill intake and they also have greater political<br />
clout. Small farmers are indebted <strong>to</strong> middlemen for their consumption and input needs, which<br />
also leads <strong>to</strong> under pricing. Further, a report by the Agricultural Prices Commission of Pakistan<br />
indicates that the scales installed <strong>to</strong> weigh sugarcane do not provide correct readings. However,<br />
given the high level of illiteracy among small-scale growers, such practices go undetected.<br />
Moreover, mills are also known <strong>to</strong> make undue deductions contending that sugarcane quality is<br />
low and contains high trash content.<br />
Source: adapted from Rafi Khan et al. (2007).<br />
cooperatives in which farmers also hold ownership shares in the fac<strong>to</strong>ry (ICRISAT, 2007).<br />
�e South African sugar industry distinguishes itself by operating a successful small-scale<br />
outgrower scheme, which supplies 11 percent of the country’s sugarcane under contract<br />
farming arrangements <strong>to</strong> one of the three major mills (Cartwright, 2007).<br />
�e need for economies of scale <strong>to</strong> increase competitiveness constitutes a pressure <strong>to</strong> reduce<br />
costs. �e main mechanisms for doing this – introduction of improved varieties, switch away<br />
from diversi�ed production systems <strong>to</strong> monocropping, move <strong>to</strong> larger land holdings, and<br />
shi� <strong>to</strong> increasingly capitalised production - are di�cult or risky for small producers. For<br />
example, in Brazil, selection of improved cane varieties (e.g. energy cane) and investment<br />
in irrigation have helped <strong>to</strong> improve yields but the bene�ts of these have mostly been felt on<br />
plantations. Other mechanisms, such as increasing labour productivity without increasing<br />
wages, are likely <strong>to</strong> be detrimental <strong>to</strong> poor households (Peskett et al., 2007). �is presents<br />
a serious challenge <strong>to</strong> identifying pro-poor biofuels production systems.<br />
Analysis by a UN consortium suggests that e�cient clusters of small and medium-scale<br />
enterprises could participate e�ectively in di�erent stages of the value chain (UN-Energy,<br />
2007). �e main challenge is how <strong>to</strong> provide appropriate policy conditions <strong>to</strong> promote valuesharing<br />
and prevent monopolisation along the chain (Dufey et al., 2007b). Controlling valueadded<br />
parts of the production chain ‘is critical for realising the rural development bene�ts and<br />
full economic multiplier e�ects associated with bioenergy’ (UN-Energy, 2007). In countries<br />
such as �ailand policy interventions are addressing the sharing of the earning between<br />
sugarcane growers and producers (70% and 30%, respectively). However, for bio<strong>ethanol</strong><br />
<strong>Sugarcane</strong> <strong>ethanol</strong> 213
Chapter 9<br />
manufactured directly from sugarcane juice, producers argue the Government has <strong>to</strong> come<br />
with a better agreement as they have <strong>to</strong> invest on bio<strong>ethanol</strong> plants (Gonsalves, 2006b).<br />
At the international level this implies that the biofuels value chain must shi� <strong>to</strong> the countries<br />
that produce the feeds<strong>to</strong>ck.<br />
Overall, economies of scale are important and small-farmers will need <strong>to</strong> adapt and get<br />
organised <strong>to</strong>wards that direction. Challenges and di�culties will be confronted and more<br />
research is needed <strong>to</strong> understand the role partnership schemes (Dufey et al., 2007b).<br />
3.4. Landlessness and land rights<br />
�e strength and nature of land rights are key determinants of patterns of land ownership<br />
under biofuel production. As the above point suggests, the need of costs reduction o�ers<br />
considerable incentives for large-scale, mechanised agribusiness and concentrated land<br />
ownership. �is is turn can displace small farmers and other people living from the forests<br />
and depriving them from its main source of livelihoods. �is may have devastating e�ects<br />
on rural poverty. Indeed, the primary threat associated with biofuels is landlessness and<br />
resultant deprivation and social upheaval, as has been seen for example with the expansion<br />
of the sugarcane industry in Brazil (Worldwatch Institute, 2006; Dufey et al., 2007b) which is<br />
summarised in Box 4. Johnson and Rosillo-Calle (2007) also highlight land related problems<br />
in the African context, where the high proportion of subsistence farming and complexities<br />
of land ownership under traditional land regimes make large acquisition of land, for largescale<br />
sugarcane operations, a highly controversial issue.<br />
Box 4. Access, ownership and use of land in Brazil.<br />
Biothanol production in Brazil has inherited problems faced by the sugar industry over the last<br />
50 years, including violent conflict over land between indigenous groups and large farmers.<br />
Problems stem from weak legal structures governing land ownership and use which have<br />
increased land concentration, monoculture cropping and minimisation of production costs. Land<br />
occupation planning is carried out at municipal level, but not all municipalities have developed<br />
guidelines governing monocultures. Land concentration in Brazil is very high, with only 1.7% of<br />
real estate covering 43.8% of the area registered. Land concentration and subsequent inequality<br />
is increasing with expansion of monocropping areas, reduction of sugar mill numbers, growth in<br />
foreign investment and land acquisition. The need of economies of scale for efficient sugarcane<br />
production in part drives these effects.<br />
Source: adapted from Peskett et al. (2007).<br />
214 <strong>Sugarcane</strong> <strong>ethanol</strong>
Impacts of sugarcane bio<strong>ethanol</strong> <strong>to</strong>wards the Millennium Development Goals<br />
Rossi and Lambrou (2008) note some gender-di�erentiated risks. Marginal lands are<br />
particularly important for women. �e conversion of these lands <strong>to</strong> energy crops might<br />
cause displacement of women’s agricultural activities <strong>to</strong>wards increasingly marginal lands,<br />
with negative e�ects in their ability <strong>to</strong> meet household obligations. �is highlights the<br />
urgent need of a careful analysis of what the concept of ‘marginal’, ‘idle’ or ‘unproductive’<br />
lands really entails. It is in these lands where most government are mandating biofuels <strong>to</strong><br />
be grown.<br />
3.5. Quality of the employment<br />
<strong>Sugarcane</strong> bio<strong>ethanol</strong> will generate a range of employment opportunities, mostly in rural<br />
areas, which is certainly good for poverty reduction. However there are limitations and tradeo�s.<br />
Firstly, there is concern about the quality of employment, whether self-employment<br />
(small-scale farmers) or employment within large-scale operations (Worldwatch Institute,<br />
2006; UN-Energy, 2007). <strong>Sugarcane</strong> harvesting is extreme physically demanding. Production<br />
is highly seasonal and, in Brazil, for example, the ratio between temporary and permanent<br />
workers is increasing. Low skilled labour dominates the industry and a high rate of migrant<br />
labour is employed. In southern Africa the sudden in�ux of seasonal workers has had<br />
negative e�ects on community cohesion, causing ethnic tension and disintegration of<br />
traditional structures of authorities. Migrants behaviour is also linked with higher rates of<br />
HIV infection around sugarcane plantations (Johnson and Rosillo-Calle, 2007).<br />
Whilst over the latest years in some plantations in Brazil improvements in working conditions<br />
have been done, in other plantations, sugarcane cutters continue <strong>to</strong> work in appalling<br />
conditions. Cases of forced labour and poor working conditions within the sec<strong>to</strong>r are still<br />
reported (Oxfam, 2008). Other problems include a lack of agreed or enforceable working<br />
standards in many countries, and lack of labour representation (Dufey et al., 2007b).<br />
Moreover, compared <strong>to</strong> other feeds<strong>to</strong>cks (e.g. palm oil, cas<strong>to</strong>r oil, sweet sorghum) sugarcane<br />
is less labour-intensive and thus provide less on-farm and o�-farm employment (Dufey<br />
et al., 2007b). �e industry greater mechanisation in turn reduces labour demands. One<br />
harvester can replace 80 cutters and thus facilitate the whole harvesting process (Johnson<br />
and Rosillo-Calle, 2007). In Brazil mechanization of sugarcane harvesting has been driven by<br />
increasing labour costs and more recently by legislation <strong>to</strong> eliminate sugarcane burning. Total<br />
employment in the industry decreased by a third between 1992 and 2003 (ESMAP, 2005b).<br />
Indeed sugarcane related unemployment is expected <strong>to</strong> become the key social challenge<br />
faced by the sugarcane industry in Brazil (Dufey et al., 2007a). �is can have devastating<br />
e�ects on poverty levels as it is unemployment among the lower-skilled workers.<br />
In order <strong>to</strong> balance trade-offs between environmental needs, mechanisation and<br />
unemployment, Johnson and Rosillo-Calle (2007) propose the use of half-mechanisation<br />
which was successfully used in Brazil as a transition <strong>to</strong>wards full mechanisation. It consists<br />
<strong>Sugarcane</strong> <strong>ethanol</strong> 215
Chapter 9<br />
in mechanical aid for the harvesting, in which a machine is used for cutting the cane<br />
and workers are used <strong>to</strong> gather the crops. As the cutting of the cane is the hardest part<br />
physically, the authors argue this system would also contribute <strong>to</strong> opening up the labour<br />
force for women.<br />
All in all, although recognising that many of the above mentioned issues are not exclusive<br />
for sugarcane bio<strong>ethanol</strong>, employment generation that leads <strong>to</strong> e�ective poverty reduction<br />
requires addressing these problems.<br />
3.6. Government support<br />
Experience suggests the biofuels sec<strong>to</strong>r requires some form of policy support, at the very<br />
least in the initial phases development. Even Brazil, the most e�cient biofuel producing<br />
country, still maintains a signi�cant tax di�erential between gasoline and hydrous <strong>ethanol</strong><br />
<strong>to</strong> promote the sec<strong>to</strong>r (ESMAP, 2005b) and �xes a manda<strong>to</strong>ry blend (between 20% <strong>to</strong><br />
25%). More generally, the PROALCOOL programme in the past required heavy support.<br />
Between 1975 and 1987 it produced savings for US$ 10.4 billion but it costs were US$ 9<br />
billion (World Watch Institute, 2006). Moreover, with falling oil prices, rising sugar prices,<br />
and a national economic crisis the programme simply became <strong>to</strong>o expensive and collapsed<br />
by end of 1980s.<br />
In many countries, the main rationale behind biofuels production is <strong>to</strong> decrease the costs<br />
associated with imported fossil fuels. Among the costs of such a policy that need <strong>to</strong> be<br />
accounted is the foregone duty on fuel imports, which results in a decline in government<br />
revenues. For instance, in Brazil, the forgone tax revenue in the state of São Paulo, which<br />
accounts for more than one-half of the <strong>to</strong>tal hydrous <strong>ethanol</strong> consumption in the country, was<br />
about US$ 0.6 billion in 2005 (ESMAP, 2005b). In many developing countries a substantial<br />
portion of public revenues are derived from import duties. In addition, the diversion of sugar<br />
exports for bio<strong>ethanol</strong> production for domestic markets means that countries may su�er<br />
reductions in their export earnings. All these pose signi�cant challenges in poorest countries,<br />
where there are a multitude of urgent needs competing for scarce �scal resources.<br />
Another issue is that once granted and the biofuel industry has been launched, subsidies<br />
are di�cult <strong>to</strong> withdraw. A major challenge <strong>to</strong> reduce policy support is the vested interests<br />
created in the domestic industry (Henniges and Zeddies, 2006).<br />
On the other hand, the existence of contentious domestic policies and practices can<br />
undermine industry development. For instance, Ra� Khan et al. (2007) and Gonsalves<br />
(2006a) report the negative e�ects on bio<strong>ethanol</strong> development of policy measures such as a<br />
high central excise duty and sales tax on alcohol that exist in Pakistan and India, respectively.<br />
�e lack of policy provenance - re�ected by the fact that the Pakistani government directed<br />
the Petroleum Ministry (who houses the oil lobby) <strong>to</strong> develop the bio<strong>ethanol</strong> conversion plan<br />
216 <strong>Sugarcane</strong> <strong>ethanol</strong>
Impacts of sugarcane bio<strong>ethanol</strong> <strong>to</strong>wards the Millennium Development Goals<br />
also constitutes an additional policy constraint. Pricing issues - whether <strong>to</strong> use bio<strong>ethanol</strong><br />
international price or its cost of production - can also a�ect industry development (Ra�<br />
Khan et al., 2007).<br />
All the above suggest the promotion of a sugarcane bio<strong>ethanol</strong> industry can become very<br />
expensive, not only due <strong>to</strong> the high up front investments that are required but also due <strong>to</strong><br />
the �nancial resources that are needed <strong>to</strong> make it viable in the long term.<br />
From a poverty reduction strategy point of view this means that governments should design<br />
their sugarcane bio<strong>ethanol</strong> policies so as <strong>to</strong> reach the desired target group. As ESMAP (2005b)<br />
notes, resources that �ow <strong>to</strong> agriculture all <strong>to</strong>o o�en bene�t politically powerful, large<br />
producers and modern enterprises disproportionately at the expense not only of the society as<br />
a whole, but of those that are supposed <strong>to</strong> be the main bene�ciary group: smallholder farmers<br />
and landless workers. Examples include untargeted producer subsidies and dis<strong>to</strong>rtionary<br />
subsidies for privately used inputs such as water and electricity. According <strong>to</strong> the same source,<br />
promoting biofuels for energy diversi�cation can make sense if large government subsidies<br />
are not required. However, UN-Energy (2007) holds the view that if the large subsidies are<br />
targeting small producers this may be money well spent. Governments tend <strong>to</strong> get higher<br />
returns on their public spending by fostering small-scale production due <strong>to</strong> the lowered<br />
demand for social welfare spending and greater economic multiplier e�ects.<br />
Overall, governments need <strong>to</strong> conduct a careful assessment of the pros and cons of promoting<br />
sugarcane bio<strong>ethanol</strong> <strong>to</strong> support poor rural communities versus those of other alternatives.<br />
Similarly, from a <strong>climate</strong> <strong>change</strong> mitigation strategy, although sugarcane bio<strong>ethanol</strong> may<br />
show the greatest greenhouse reductions compared <strong>to</strong> other �rst generation feeds<strong>to</strong>cks, these<br />
should be assessed against the costs of other policy instruments <strong>to</strong> achieve the same goal.<br />
3.7. Market access and market entry barriers<br />
�e strategic nature of bio<strong>ethanol</strong> implies the existence of some degree of protectionism in<br />
almost any producing country. Protectionism is especially acute where energy security is<br />
equated with self-su�ciency or where biofuels are promoted <strong>to</strong> help domestic farmers in<br />
high-cost producing countries (Dufey et al., 2007b). �e use of tari�s <strong>to</strong> protect domestic<br />
biofuel industries is a common practice and, as Table 1 shows, these can be very high.<br />
However, these tari�s are only indicative as their actual level applied vary widely as both<br />
the European Union and the United States have trade agreements providing preferential<br />
market access <strong>to</strong> several developing countries. In particular, the extra US$ 0.14 <strong>to</strong> each litre<br />
(US$ 0.54 per gallon) of imported bio<strong>ethanol</strong> on <strong>to</strong>p of the 2.5 percent tari� applied by the<br />
United States, it is said <strong>to</strong> be targeting Brazilian imports as it brings the cost of Brazilian<br />
bio<strong>ethanol</strong> in line with that produced domestically (Severinghaus, 2005). Tari� escalation,<br />
which discriminates against the �nal product, can also be an issue, for example, where there<br />
are di�erentiated tari�s on bio<strong>ethanol</strong> and feeds<strong>to</strong>ck such as raw molasses (Dufey, 2006).<br />
<strong>Sugarcane</strong> <strong>ethanol</strong> 217
Chapter 9<br />
Table 1. Import tariffs on bio<strong>ethanol</strong> 1 .<br />
Country Import tariff<br />
US 2.5% + extra US$ 14 cents/litre (46% ad valorem)<br />
EU € 19.2/hl (63% ad valorem)<br />
Canada 4.92 US$ cent/litre<br />
Brazil 2 20%<br />
Argentina 20%<br />
China 30%<br />
Thailand 30%<br />
India 186% on undenatureated alcohol<br />
Source: adapted from Dufey et al. (2007b)<br />
1 Undenaturated alcohol.<br />
2 Temporarily lifted in February 2006.<br />
On the other hand, the planning of an export-oriented bio<strong>ethanol</strong> industry based on the<br />
rationale of preferential market access is a risky strategy. As Box 5 suggests for Pakistan,<br />
trade preferences can be withdrawn at any time with devastating e�ects on the industry.<br />
Subsidies is another key concern. In industrialised countries, government support for the<br />
domestic production of energy crops, the processing or commercialisation of biofuels seems<br />
<strong>to</strong> be the rule (Dufey, 2006). Amounts involved are enormous. In the United States, Koplow<br />
(2006) estimated that subsidies <strong>to</strong> the biofuels industry <strong>to</strong> be between US$ 5.5 billion and<br />
US$ 7.3 billion a year. In the European Union, Kutas and Lindberg (2007) estimated that<br />
<strong>to</strong>tal support <strong>to</strong> bio<strong>ethanol</strong> amounted € 0.52/litre.<br />
�e impacts these policies have on the developing countries competitiveness and on their<br />
potential for poverty reduction needs <strong>to</strong> be unders<strong>to</strong>od as domestic support in these<br />
countries is likely <strong>to</strong> be very limited. Moreover, subsidies impacts on environmental<br />
sustainability are also questionable as they promote bio<strong>ethanol</strong> industries based on the<br />
less e�cient energy crops and with the least greenhouse gases reductions such as maize<br />
and wheat (Dufey, 2006).<br />
�e proliferation of di�erent technical, environmental and social standards and regulations<br />
for biofuels – without a system for mutual recognition – cause additional di�culties. For<br />
instance, at present not all biofuels are perceived as ‘sustainable’ especially those coming from<br />
overseas. As a consequence, several initiatives <strong>to</strong>wards the development of sustainability<br />
certi�cation for both bio<strong>ethanol</strong> and biodiesel have started. Some of them are led by<br />
governments (e.g. the United Kingdom, Netherlands and the European Union); others by<br />
218 <strong>Sugarcane</strong> <strong>ethanol</strong>
Impacts of sugarcane bio<strong>ethanol</strong> <strong>to</strong>wards the Millennium Development Goals<br />
Box 5. The elimination of Pakistan from the EU GSP.<br />
Until recently, Pakistan was the second largest industrial alcohol exporter <strong>to</strong> the EU after Brazil,<br />
under the General System of Preferences (GSP). In May 2005, the Commission of Industrial<br />
Ethanol Producers of the EU (CIEP) accused Pakistan and Guatemala (the largest duty free<br />
exporters for the period 2002-2004) of dumping ethyl alcohol in the EU market, causing material<br />
harm <strong>to</strong> domestic producers. The Commission dropped proceedings a year later when full cus<strong>to</strong>m<br />
tariffs were res<strong>to</strong>red on Pakistani imports. Later, following a complaint lodged by India at the<br />
World Trade Organization (WTO), a panel concluded that by granting tariff preferences <strong>to</strong> 12<br />
countries under this special arrangement the EU was violating GATT/WTO preferential treatment<br />
obligations. The EU consequently removed Pakistan from the GSP. In the revised GSP regime, the<br />
anti-drug system has been replaced by GSP Plus, for which Pakistan does not qualify.<br />
Elimination of Pakistan from the GSP had devastating effects on the local industry. Distilleries<br />
begun <strong>to</strong> suffer important losses and some had no option but <strong>to</strong> cease operations. Whilst<br />
between 2002 and 2003, the number of distilleries in the country increased from 6 <strong>to</strong> 21, the<br />
more stringent EU tariff measures <strong>to</strong>gether with a rise in molasses exports, the distilleries were<br />
soon running idle capacities. Currently, at least 2 distilleries have shut down, with another 5<br />
contemplating that option.<br />
Source: adapted from Rafi Khan et al. (2007).<br />
NGOs (e.g. WWF); and also by Universities (e.g. Lausanne University). �ese schemes tend<br />
<strong>to</strong> focus on traditional environmental and social aspects of feeds<strong>to</strong>cks production, with<br />
several of them including greenhouse emission issues and with some few of them expanding<br />
<strong>to</strong> food security concerns. Although environmental and social assurance is needed in the<br />
industry, where these schemes are developed by importing nations, with little participation<br />
by producing country stakeholders, insu�cient re�ection of the producing countries’<br />
environmental and social priorities and without mutual recognition between them, they<br />
are bound <strong>to</strong> constitute signi�cant trade barriers. Moreover, the experience with assurance<br />
schemes in the agriculture and forestry sec<strong>to</strong>r indicates that the complex procedures and<br />
high costs usually associated with them have regressive e�ects in detriment of small and<br />
poorest producers in developing countries. All in all, sustainability standards for bio<strong>ethanol</strong><br />
trade are <strong>to</strong> become more and more important. Countries wanting <strong>to</strong> bene�t from bio<strong>ethanol</strong><br />
exports need <strong>to</strong> invest in the development of robust and credible certi�cation systems that<br />
satisfy importing countries requirements.<br />
Overall, it is widely agreed that developing countries would bene�t from enhanced bio<strong>ethanol</strong><br />
trade and therefore the need <strong>to</strong> eliminate trade barriers.<br />
<strong>Sugarcane</strong> <strong>ethanol</strong> 219
Chapter 9<br />
3.8. Improving efficiency, access <strong>to</strong> technology, credit and channelling investment<br />
�e development of a successful bio<strong>ethanol</strong> sec<strong>to</strong>r goes beyond having available land, cheap<br />
labour and good <strong>climate</strong>. It crucially depends on countries’ domestic capacity <strong>to</strong> expand<br />
production e�ciently, accessing the technology and assuring best practice. Indeed, Brazil’s<br />
success in developing an e�cient bio<strong>ethanol</strong> industry is in a large extent explained by the<br />
enormous endogenous e�orts devoted <strong>to</strong> R&D, capacities building and infrastructure (Dufey<br />
et al., 2007a). �is implies that having a number of technical skills for research, technology<br />
transfer as well as access <strong>to</strong> credit are critical issues. Moreover, those countries wanting <strong>to</strong><br />
develop an export oriented sec<strong>to</strong>r also need <strong>to</strong> be in compliance with the relevant technical<br />
standards in importing markets and <strong>to</strong> invest in suitable transport infrastructure (roads,<br />
water ways and ports) <strong>to</strong> reach exports markets. Countries also need <strong>to</strong> have su�cient<br />
capacity in policy implementation and project management <strong>to</strong> run biofuels production and<br />
processing e�ectively (Dufey et al., 2007b).<br />
At present, many countries foresee a major participation of the sugar industry in bioenergy<br />
production. However, the current low e�ciency and productivity of the sec<strong>to</strong>r in many<br />
of them implies that major <strong>change</strong>s <strong>to</strong> the industry’s structure will be needed <strong>to</strong> make<br />
sugarcane an important feeds<strong>to</strong>ck (FAO, 2007). In countries where bio<strong>ethanol</strong> is produced<br />
from molasses and wanting a signi�cant scale of production, e�orts will need <strong>to</strong> be made<br />
<strong>to</strong> produce from sugarcane juice, which is a relatively more e�cient source of bio<strong>ethanol</strong><br />
and capable of supplying larger volumes (Woods and Read, 2005). Other speci�c needs<br />
include adaptive agricultural research and extension development for enhanced transfer<br />
of bio<strong>ethanol</strong> technologies. Investment is also important <strong>to</strong> bring agricultural practices up<br />
<strong>to</strong> the required level of technical capacity, scale of operations, and intensity of production<br />
(Johnson and Rosillo-Calle, 2007)<br />
4. Conclusions<br />
<strong>Sugarcane</strong> bio<strong>ethanol</strong> can contribute <strong>to</strong> the achievement of several Millennium Development<br />
Goals through a varied range of environmental, social and economic advantages over fossil<br />
fuels. �e highest impact on poverty reduction is likely <strong>to</strong> occur where sugarcane bio<strong>ethanol</strong><br />
production focuses on local consumption, involving the participation and ownership of<br />
small farmers and where processing facilities are near <strong>to</strong> the cultivation �elds.<br />
Realising the greatest potential of sugarcane bio<strong>ethanol</strong> on poverty reduction implies that<br />
several challenges will need <strong>to</strong> be confronted and dealing with serious trade-o�s. Especially<br />
<strong>to</strong>ugh will be those related <strong>to</strong> e�ciency gains through large-scale operations, mechanisation<br />
and land concentration versus small farmers inclusion. Economies of scale are important<br />
and small farmers will need <strong>to</strong> adapt and get organised <strong>to</strong>wards that direction. Likewise, the<br />
resulting unemployment among the lower-skilled workers is a key aspect <strong>to</strong> be addressed.<br />
Whilst the domestic use of sugarcane bio<strong>ethanol</strong> may imply opportunities in terms of<br />
220 <strong>Sugarcane</strong> <strong>ethanol</strong>
Impacts of sugarcane bio<strong>ethanol</strong> <strong>to</strong>wards the Millennium Development Goals<br />
general well-being, the increasing use of marginal land for biofuels cultivation may imply<br />
negative impacts among the most vulnerable such as women. From a poverty reduction<br />
strategy this means that governments should explicitly design their sugarcane bio<strong>ethanol</strong><br />
policies <strong>to</strong> provide the right environment <strong>to</strong> promote business models that maximises rural<br />
development, small farmer inclusion and equitable access <strong>to</strong> ownership and value along<br />
the chain. One example in that direction can be the use of tax-breaks for companies that<br />
include small producers among their suppliers, which is already being used in the context<br />
of biodiesel in Brazil through the PROBIODIESEL programme.<br />
�e impacts of sugarcane bio<strong>ethanol</strong> on food security are less clear. Regarding food<br />
availability and compared <strong>to</strong> other feeds<strong>to</strong>cks, sugarcane bio<strong>ethanol</strong> would provide better<br />
opportunities <strong>to</strong> meet food security as long as it creates less competition for land and crowd<br />
out other crops. However, from an accessibility point of view, it would provide more limited<br />
opportunities <strong>to</strong> the extent that its production is less likely <strong>to</strong> involve small or poorest<br />
farmers. Overall, more research is needed <strong>to</strong> understand these linkages.<br />
From an environmental sustainability perspective, compared <strong>to</strong> other �rst generation<br />
biofuels, sugarcane bio<strong>ethanol</strong> o�ers opportunities <strong>to</strong> achieve one of the greatest reductions<br />
in greenhouse emissions under certain circumstances. However, available estimations need<br />
<strong>to</strong> be revised <strong>to</strong> include the emissions directly and indirectly associated with <strong>change</strong>s in<br />
land use and cover. Similarly, biodiversity impacts linked <strong>to</strong> <strong>change</strong>s in land use and cover<br />
especially those associated with the substitution e�ect appear as crucial environmental<br />
aspects <strong>to</strong> be addressed and more research <strong>to</strong> understand them is needed. Likewise, impacts<br />
on water, especially in the context of dry and semi-dry lands, are other key aspects that<br />
deserve better analysis. Only the adequate understanding and management of these impacts,<br />
using a life cycle approach, will help <strong>to</strong> improve the environmental sustainability of sugarcane<br />
bio<strong>ethanol</strong> and thus achieving the Millennium Development Goal on environmental<br />
sustainability.<br />
In some contexts, the promotion of a sugarcane bio<strong>ethanol</strong> industry can be a very expensive<br />
means of achieving poverty reduction and promoting environmental sustainability.<br />
Governments need <strong>to</strong> conduct a careful assessment of the pros and cons of promoting<br />
sugarcane bio<strong>ethanol</strong> <strong>to</strong> support poor rural communities versus those of other policy<br />
choices. Similarly, from a <strong>climate</strong> <strong>change</strong> mitigation strategy, although under certain<br />
circumstances sugarcane bio<strong>ethanol</strong> shows the greatest greenhouse reductions compared<br />
<strong>to</strong> other �rst generation feeds<strong>to</strong>cks, these should be assessed against the costs and bene�ts<br />
of other policy instruments for achieving the same goal.<br />
Another crucial issue involved in realising the full potential of sugarcane bio<strong>ethanol</strong> is the<br />
building of an adequate set of national capabilities on technical skills, policy implementation,<br />
project management and development of R&D programmes. �ese should come hand in<br />
hand with promoting access <strong>to</strong> technology, credit and �nance as well as the provision of<br />
<strong>Sugarcane</strong> <strong>ethanol</strong> 221
Chapter 9<br />
some minimum transport infrastructure. For those countries wanting <strong>to</strong> take advantages<br />
of an export oriented industry, capacities building on standard setting and compliance as<br />
well as the negotiation of favourable terms of trade constitute other key aspects.<br />
Policy coherence is another issue. �e promotion of a sugarcane bio<strong>ethanol</strong> sec<strong>to</strong>r that<br />
contributes <strong>to</strong> sustainable development and poverty reduction should be aligned with<br />
existing relevant national and international policies and frameworks such as Sustainable<br />
Development Strategies, Poverty Reduction Strategies, Environmental and Social Impact<br />
Assessments, the Kyo<strong>to</strong> Pro<strong>to</strong>col or the Convention on Biological Biodiversity. Coordination<br />
therefore is required among di�erent government bodies (e.g. Ministry of Agriculture,<br />
Energy, Environment, Industry, Trade, etc.), levels and ac<strong>to</strong>rs.<br />
Finally, at the international level, cooperation is also crucial for the development of a<br />
sugarcane bio<strong>ethanol</strong> industry oriented <strong>to</strong>wards poverty reduction and environmental<br />
sustainability. South-South cooperation can play an important role in overcoming many of<br />
the technical challenges. Countries can bene�t from the technical and scienti�c knowledge<br />
of Brazil, which is at the forefront of the industry. One example in that sense is the illustrated<br />
by the Brazil-UK-Africa Partnership for bio<strong>ethanol</strong> development. International �nancial<br />
institutions can help, for example, by mitigating political risk for project development in<br />
developing countries. Elimination of trade barriers is another issue <strong>to</strong> be addressed by<br />
governments <strong>to</strong> enhance development opportunities associated with sugarcane bio<strong>ethanol</strong>.<br />
�is would be also aligned with the last Millennium Development Goal that calls <strong>to</strong> ‘develop<br />
a global partnership for development’.<br />
References<br />
Bakker, S.J.A., 2006. CDM and biofuels - Can the CDM assist biofuels production and deployment? Energy<br />
Research Centre of the Netherlands, Oc<strong>to</strong>ber. Available at: http://www.senternovem.nl/mm�les/<br />
CDMandBiofuels_tcm24-222843.pdf<br />
Bolling, C. and Suarez, N., 2001. �e Brazilian sugar industry: recent developments. In: Sugar and Sweetener<br />
Situation & Outlook /SSS-232/September.<br />
Cartwright, A., 2007. Biofuels trade and sustainable development: An analysis of South African bio<strong>ethanol</strong>.<br />
Working document, International Institute for Environment and Development, London, UK.<br />
Cloin, J., 2007. Liquid biofuels in Paci�c island countries. SOPAC Miscellaneous Report 628. Paci�c Islands<br />
Applied Geoscience Commission, Suva, Fiji.<br />
Coelho, S.T, 2005. Biofuels – Advantages and Trade Barriers. Prepared for the United Nations Conference<br />
on Trade and Development, February, Geneva, Switzerland.<br />
Dufey, A., 2006. Biofuels production, trade and sustainable development: emerging issues. Sustainable<br />
Markets Discussion Paper 2. International Institute for Environment and Development, London, UK.<br />
Available at: http://www.iied.org/pubs/pdf/full/15504IIED.pdf<br />
222 <strong>Sugarcane</strong> <strong>ethanol</strong>
Impacts of sugarcane bio<strong>ethanol</strong> <strong>to</strong>wards the Millennium Development Goals<br />
Dufey, A., 2007. International trade in biofuels: Good for development? and Good for the Environment?<br />
IIED Policy Brie�ng. International Institute for Environment and Development, London, UK. Available<br />
at: http://www.iied.org/pubs/pdf/full/11068IIED.pdf<br />
Dufey, A., M. Ferreira and L. Togeiro, 2007a. Capacity Building in Trade and Environment in the Sugar/<br />
Bio<strong>ethanol</strong> Sec<strong>to</strong>r in Brazil. UK Department for Environment, Food and Rural A�airs, London, UK.<br />
Dufey, A., S. Vermeulen and W. Vorley, 2007b. Biofuels: Strategic Choices for Commodity Dependent<br />
Developing Countries. Common Fund for Commodities, September.<br />
Echeverri-Campuzano, H., 2000. Columbia Paving the Way in Renewable Fuels for Transport in Renewable<br />
Energy for Development. S<strong>to</strong>ckholm Environment Institute –Newsletter of the Sustainable Energy<br />
Programme, Oc<strong>to</strong>ber 2000 Vol. 13 No. 3.<br />
Echeverri-Campuzano, H., 2002. Fuel Ethanol Program in Colombia, CORPODIB. Available at: http://www.<br />
iea.org/textbase/work/2002/ccv/ccv1%20echeverri.pdf<br />
ESMAP, 2005a. �e Vulnerability of African Countries <strong>to</strong> Oil Price Shocks: Major Fac<strong>to</strong>rs and Policy<br />
Options - �e Case of Oil Importing Countries Energy Sec<strong>to</strong>r Management Assistance Programme,<br />
Report 308/05. �e International Bank for Reconstruction and Development, Washing<strong>to</strong>n DC, August.<br />
Available at: http://wbln0018.worldbank.org/esmap/site.nsf/�les/308-05+Final_<strong>to</strong>_Printshop.pdf/<br />
$FILE/308-05+Final_<strong>to</strong>_Printshop.pdf<br />
ESMAP, 2005b. Potential for biofuels for transport in developing countries. Energy Sec<strong>to</strong>r Management<br />
Assistance Programme, World Bank, Washing<strong>to</strong>n DC, USA. Available at: http://esmap.org/�lez/pubs/<br />
31205BiofuelsforWeb.pdf<br />
ESMAP, 2006. Annual Report 2005. Energy Sec<strong>to</strong>r Management Assistance Programme, �e International<br />
Bank for Reconstruction and Development, Washing<strong>to</strong>n DC, June. Available at: http://www.esmap.<br />
org/�lez/pubs/ESMAP05.pdf<br />
E4tech, 2006. Feasibility study on the production of bio<strong>ethanol</strong> from sugarcane in the Caribbean Region.<br />
Final report for DFID Caribbean, DFID, March.<br />
FAO, 2007. A Review of the Current State of Bioenergy Development in G8 +5 Countries. Global Bioenergy<br />
Partnership, Food and Agriculture Organization of the United Nations, Rome.<br />
Gonsalves, J. 2006a. An Assessment of the Biofuels Industry in India. United Nations Conference on Trade<br />
and Development, UNCTAD/DITC/TED/2006/6.<br />
Gonsalves, J. 2006b. An Assessment of the Biofuels Industry in �ailand. United Nations Conference on<br />
Trade and Development, UNCTAD/DITC/TED/2006/7.<br />
Hazell, P., G. Shields and D. Shields, 2005. �e nature and extent of domestic sources of food price instability<br />
and risk. Paper presented <strong>to</strong> the workshop ‘Managing Food Price Risk Instability in Low-Income<br />
Countries’ February 28 – March 1, 2005, Washing<strong>to</strong>n DC, USA.<br />
Horta, L., 2006. Potencial Económico y Ambiental del Etanol como Oxigenante en la Gasolina. Convenio<br />
Costarricense-Alemán de Cooperación Técnica, Proyec<strong>to</strong> Aire Limpio San José. MOPT, MS, MINAE<br />
y GTZ. Costa Rica.<br />
Henniges, O. and J. Zeddies, 2006. Bioenergy in Europe: Experiences and Prospects in Bioenergy and<br />
Agriculture: Promises and Challenges, IFPRI, FOCUS 14, Brief 9 of 12, December. Available at: http://<br />
ifpri.org/2020/focus/focus14/focus14_09.pdf<br />
ICRISAT, 2007. Pro-poor biofuels outlook for Asia and Africa: ICRISAT’s perspective. International Crops<br />
Research Institute for the Semi-Arid Tropics, Nairobi, Kenya.<br />
<strong>Sugarcane</strong> <strong>ethanol</strong> 223
Chapter 9<br />
IEA, 2004. Biofuels for Transport: An International Perspective. International Energy Agency, Paris,<br />
April.<br />
IFPRI, 2008. What goes down must come up: Global Food Prices Reach New Heights. IFPRI Forum,<br />
International Food Policy Research Institute, March. Available at: http://www.ifpri.org/PUBS/newsletters/<br />
IFPRIForum/if21.pdf<br />
Jackson, M., 2004. Ethanol Fuel Use - Promising Prospects for the Future in Renewable Energy for<br />
Development. S<strong>to</strong>ckholm Environment Institute –Newsletter of the Sustainable Energy Programme,<br />
January 2004 Vol. 17 No. 1.<br />
Johnson, F. and F. Rosillo-Calle, 2007. Biomass, Livelihoods and International Trade - Challenges and<br />
Opportunities for the EU and Southern Africa. S<strong>to</strong>ckholm Environment Institute, Climate and Energy<br />
Report 2007-01.<br />
Johnson, F., V. Seebaluck, H. Watson and J. Woods, 2006. Bio<strong>ethanol</strong> from sugarcane and sweet sorghum<br />
in Southern Africa: Agro-Industrial Development, Import Substitution and Export Diversi�cation in<br />
Linking Trade, Climate Change and Energy. ICTSD Trade and Sustainable Energy Series, International<br />
Centre for Trade and Sustainable Development, Geneva, Switzerland, November.<br />
Kartha, S., 2006. Environmental e�ects of bioenergy. In: Hazell, P. and Pachauri, R.K. (eds) Bioenergy and<br />
agriculture: promises and challenges. 2020 Vision Focus 14. International Food Policy Research Institute,<br />
Washing<strong>to</strong>n DC, USA, and �e Energy and Resources Institute, New Delhi, India.<br />
Koplow, D., 2006. Biofuels: At What Cost? Government Support for Ethanol and Biodiesel. In: the United<br />
States report prepared by Earth Track, Inc for �e Global Subsidies Initiative (GSI) of the International<br />
Institute for Sustainable Development (IISD), Geneva, Switzerland.<br />
Kutas, G. and C. Lindberg, 2007, Biofuels – At what Cost? Government Support for Ethanol and Biodiesel<br />
in the European Union for the Global Subsidies Initiative (GSI). IISD, Geneva, Switzerland.<br />
Lambe, F., 2008. Development of Local Biofuel Markets: A Case Study from Ethiopia. In: Renewable Energy<br />
for Development. S<strong>to</strong>ckholm Environment Institute –Newsletter of the Sustainable Energy Programme,<br />
May 2008, Vol. 21 No. 1.<br />
Macedo I.C (Ed.). 2005. A Energia da Cana de Açúcar - Doze estudos sobre a agroindústria da cana-deaçúcar<br />
no Brasil e a sua sustentabilidade UNICA.<br />
Mayers, J. and S. Vermeulen, 2002. From raw deals <strong>to</strong> mutual gains: company-community partnerships<br />
in forestry. Instruments for Sustainable Private Sec<strong>to</strong>r Forestry series. International Institute for<br />
Environment and Development, London, UK.<br />
Ministerio da Agricultura, Pecuaria e Abastecimien<strong>to</strong> and Assessoria de Gestao Estrategica, 2006.<br />
Agribusiness Projections: World and Brazil, Executive Summary available at: http://www.agricultura.<br />
gov.br/pls/portal/docs/PAGE/MAPA/MENU_LATERAL/AGRICULTURA_PECUARIA/PROJECOES_<br />
AGRONEGOCIO/COPY_OF_PROJECOES_AGRONEGOCIO/EXECUTIVE%20SUMMARY%20AG<br />
RIBUSINESS%20PROJECTIONS_0.PDF<br />
Murillo, C., 2007. Biofuels trade and sustainable development: the case of Costa Rica. Working document,<br />
International Institute for Environment and Development, London, UK.<br />
Murphy, S., 2007. �e multilateral trade and investment context for biofuels: Issues and challenges.<br />
International Institute for Environment and Development, London/Institute for Agriculture and Trade<br />
Policy, Minneapolis.<br />
224 <strong>Sugarcane</strong> <strong>ethanol</strong>
Impacts of sugarcane bio<strong>ethanol</strong> <strong>to</strong>wards the Millennium Development Goals<br />
OECD-FAO, 2007. OECD & FAO Agricultural Outlook 2007-2016. Organisation for Economic Cooperation<br />
and Development, Paris, France, and Food and Agriculture Organisation of the United Nations, Rome,<br />
Italy.<br />
OXFAM, 2008. Another Inconvenient Truth – how biofuels policies are deepening poverty and accelerating<br />
<strong>climate</strong> <strong>change</strong>. Oxfam Brie�ng Paper, Oxfam International, June.<br />
Peskett, L., R. Slater, C. Stevens and A. Dufey, 2007. Biofuels, agriculture and poverty reduction. Report<br />
prepared for the UK Department for International Development. Overseas Development Institute,<br />
London, UK.<br />
Ra� Khan, S., M. Yusuf, S. Adam Khan and R. Abbasy, 2007. Biofuels Trade and Sustainable Development:<br />
�e Case of Pakistan. Working Document International Institute for Environment and Development,<br />
London, UK.<br />
Rosegrant, M., 2008. Biofuels and Grain Prices: Impacts and Policy Responses, International Food Policy<br />
Research Institute May. Available at: http://www.ifpri.org/pubs/testimony/rosegrant20080507.pdf<br />
Rossi, A. and Y. Lambrou, 2008. Gender and Equity Issues in Liquid Biofuels Production - Minimizing the<br />
Risks <strong>to</strong> Maximize the Opportunities. Food and Agriculture Organization of the United Nations, Rome.<br />
Available at: �p://�p.fao.org/docrep/fao/010/ai503e/ai503e00.pdf<br />
Schlamadinger, B. and I. Jürgens, 2004. Bioenergy and the Clean Development Mechanism. Joint International<br />
Energy Association and FAO policy paper, IEA Bioenergy Task 38, Paris, International Energy Agency.<br />
Available at http://www.ieabioenergy-task38.org/publications/.<br />
Schmidhuber, J., 2007. Biofuels: an emerging threat <strong>to</strong> Europe’s food security? Notre Europe Policy Paper<br />
27. Notre Europe, Paris, France.<br />
Severinghaus, J., 2005. Why we import Brazilian bio<strong>ethanol</strong>. Iowa Farm Bureau.<br />
Smeets, E., M. Junginger, A. Faaij, A. Walter and P. Dolzan, 2006. Sustainability of Brazilian bio-<strong>ethanol</strong>.<br />
Copernicus Institute - Department of Science, Technology and Society for SenterNovem, �e Netherlands<br />
Agency for Sustainable Development and Innovation, �e Netherlands, Utrecht.<br />
Stern, N., 2006 �e Economics of Climate <strong>change</strong>: Stern Review. Cambridge University Press, Cambridge.<br />
UN-Energy, 2007. Sustainable bioenergy: a framework for decision makers. United Nations. Available at:<br />
http://esa.un.org/un-energy/pdf/susdev.Biofuels.FAO.pdf<br />
Woods, J. and P. Read, 2005. Arguments for Bioenergy Development in Policy Debate on Global Biofuels<br />
Development. Renewable Energy Partnerships for Poverty Eradication and Sustainable Development,<br />
June 2005, Partners for Africa/S<strong>to</strong>ckholm Environment Institute.<br />
World Bank, 2008. Rising Food Prices: Policy Options and World Bank Response. World Bank.<br />
Worldwatch Institute, 2006. Biofuels for transportation: global potential and implications for sustainable<br />
agriculture and energy in the 21st century. Report prepared for the German Federal Ministry of Food,<br />
Agriculture and Consumer Protection (BMELV). Worldwatch Institute, Washing<strong>to</strong>n DC, USA.<br />
Zarrilli, S., 2006 Trade and Sustainable Development Implications of the Emerging Biofuels Marke’. In:<br />
International Centre for Trade and Sustainable Development Linking Trade, Climate Change and<br />
Energy: Selected Issue Briefs. International Centre for Trade and Sustainable Development, Geneva,<br />
Switzerland.<br />
<strong>Sugarcane</strong> <strong>ethanol</strong> 225
Chapter 10<br />
Why are current food prices so high?<br />
Martin Banse, Peter Nowicki and Hans van Meijl<br />
1. World agricultural prices in a his<strong>to</strong>rical perspective<br />
World agricultural prices are very volatile which is due <strong>to</strong> traditional characteristics of<br />
agricultural markets such as inelastic (short run) supply and demand curves (see, Meijl et<br />
al. 2003). 13 �e volatility is also high because the world market is a relatively small residual<br />
market in a world dis<strong>to</strong>rted by agricultural policies. 14 �e combination of high technological<br />
<strong>change</strong> and inelastic demand cause real world prices <strong>to</strong> decline in the long run (trend). �e<br />
prices, however, of many (major) agricultural commodities have risen quickly over recent<br />
years (see Figure 1).<br />
Recent increase in agricultural prices are strong, but even with the increase that we have<br />
observed in the last three years, real agricultural prices are still low compared <strong>to</strong> the peaks<br />
in prices of the mid-70s. Local prices are linked with these world prices. �e transmission<br />
e�ect depends on the transparency of markets, market power and accessibility<br />
13 ‘World food prices are instable and will remain unstable in the future. Forecast errors are large in predictions<br />
of world prices. �ere are always unexpected events in important drivers such as yields which are dependent on<br />
weather, plagues and diseases’ (See Van Meijl et al., 2003).<br />
14 Trade share (2006) in global production: rice (7%), cheese (7%), coarse grains (11%) and wheat (20%), FAO<br />
Statistics.<br />
1,600<br />
1,400<br />
1,200<br />
1,000<br />
800<br />
600<br />
400<br />
200<br />
0<br />
1960 1965<br />
1970 1975 1980 1985 1990 1995 2000 2005<br />
Maize Wheat Rice Palmoil Soybeans<br />
Figure 1. Development of world agricultural prices, 1960–2007, USD/<strong>to</strong>n, in constant USD (1990).<br />
Source: World Bank data base (2008).<br />
<strong>Sugarcane</strong> <strong>ethanol</strong> 227
Chapter 10<br />
Figure 2 depicts the price index for food commodities along with an index for the average<br />
of all commodities and an index for crude oil. Although the food commodity index has<br />
risen more than 60 percent in the last 2 years, the index for all commodities has also risen<br />
60 percent and the index for crude oil has risen even more (see also Trostle, 2008). Since<br />
1999 food commodity prices have risen 98 percent (as of March 2008); the index for all<br />
commodities has risen 286 percent; and the index for crude oil has risen 547 percent. In<br />
this perspective, the recent rise in food commodity prices is moderate. Figure 3 shows that<br />
spot prices in early 2008 for soybean and wheat are declining again while the spot prices<br />
for rice and crude oil continue <strong>to</strong> rise. �e prices of wheat and soybeans declined by almost<br />
30% and almost 20%, respectively, since their peak at the end of February this year.<br />
700<br />
600<br />
500<br />
400<br />
300<br />
200<br />
100<br />
0<br />
1992 1994<br />
1996 1998 2000 2002 2004 2006 2008<br />
Figure 2. Index of oil, food and all commodities, 1992-2008, January 1992=100. Source: International<br />
Monetary Fund: International Financial Statistics.<br />
600<br />
500<br />
400<br />
300<br />
200<br />
100<br />
0<br />
2005<br />
Oil All commodities Food commodities<br />
2006<br />
Figure 3. Daily price notations for crude oil, wheat, maize and soybeans; spot prices, 2005-2008, at<br />
current USD. Source: World Bank data base (2008) from January, 1 2005 <strong>to</strong> May, 15 2008.<br />
228 <strong>Sugarcane</strong> <strong>ethanol</strong><br />
2007<br />
2008<br />
Crude oil, $/bbl Wheat, $/mt<br />
Maize, $/mt Soybeans, $/mt
Why are current food prices so high?<br />
However, although real food prices are not extremely high in a his<strong>to</strong>rical perspective and<br />
other commodities have risen more, an increase in the price of food – a basic necessity<br />
– causes hardships for many lower income consumers around the world. �is makes foodprice<br />
in�ation socially and politically sensitive. �is is why much of the world’s attention is<br />
now focused on the increase in food prices more than on the more rapid increase in prices<br />
of other commodities, (see Trostle, 2008: 4).<br />
�e question on the minds of many consumers around the world is, ‘Will food prices drop<br />
again this time?’ Or, stated another way, ‘Is the current price spike any di�erent from those<br />
of the past, and if so, why?’<br />
2. Long run effects<br />
2.1. Long run drivers of demand 15<br />
Population and macro-economic growth are important drivers of demand for agricultural<br />
products. In past years, rapid population growth has accounted for the bulk of the increase<br />
in food demand for agricultural products, with a smaller e�ect from income <strong>change</strong>s and<br />
other fac<strong>to</strong>rs (Nowicki et al., 2006) 16 . �e world’s population growth will fall <strong>to</strong> about 1%<br />
in the coming ten years. Continued economic growth is expected over the coming period<br />
in almost all regions of the world and this driver of demand will become more important<br />
than population growth in the future (see Figure 4).<br />
2.2. Expected population developments in period 2005-2020<br />
•<br />
•<br />
•<br />
•<br />
•<br />
�e world’s population growth will fall from 1.4% in the 1990-2003 period <strong>to</strong> about 1%<br />
in the coming ten years. �is is mainly due <strong>to</strong> birth or fertility rates, which are declining<br />
and are expected <strong>to</strong> continue <strong>to</strong> do so.<br />
Almost all annual population growth will occur in low and middle income countries,<br />
whose population growth rates are much higher than those in high income countries.<br />
Europe’s share in world population has declined sharply and is projected <strong>to</strong> continue<br />
declining during the 21 st century.<br />
Population growth in Europe is very low (0.3% yearly for EU-15: old EU member states)<br />
or slightly negative (-0.2% for EU-10: new EU member states).<br />
�e uncertainty with regard <strong>to</strong> birth and death rates at world or regional level is not<br />
<strong>to</strong>o large. However, migration �ows between countries and regions are much more<br />
uncertain.<br />
15 Based on Scenar 2020 (Nowicki et al., 2006).<br />
16 Projections for population and GDP for the EU member states are taken from a study of the Economic Policy<br />
Committee of the European Commission called ‘�e 2005 EPC projection of age-related expenditure: agreed<br />
underlying assumptions and projections methodologies, 2005’. �e projections for the rest of the world are based<br />
on assumptions used in the OECD and USDA agricultural Outlooks.<br />
<strong>Sugarcane</strong> <strong>ethanol</strong> 229
Chapter 10<br />
Figure 4. World population and GDP growth (annual growth %). Source: USDA for 1970-1990 and<br />
1990-2005. Projections for 2005-2020 derived from Scenar 2020, Nowicki et al. (2006). HDC =<br />
High Income Developed Countries, C&S Amer = Central and South America<br />
2.3. Global income growth<br />
•<br />
•<br />
•<br />
•<br />
7<br />
6<br />
5<br />
4<br />
3<br />
2<br />
1<br />
0<br />
-1<br />
Population GDP<br />
1970-1990 1990-2005<br />
2005-2020 1970-1990 1990-2005 2005-2020<br />
EU15 EU10 HDC C&S Amer Asia Africa<br />
Robust economic growth is expected over the coming period in almost all regions of<br />
the world in the baseline scenario (see Figure 4).<br />
Economic growth will be considerably higher for most of the transitional and developing<br />
countries than for the EU-15, the United States and Japan, in particular for Brazil, China,<br />
India and the new EU member states. Incomes in Europe are expected <strong>to</strong> increase slightly<br />
over the coming years.<br />
Annual income growth in Europe is about 2% for EU-15 and 3.8% for EU-10.<br />
World and EU economic growth in the future stays uncertain and depends on the<br />
amount of investments in education and research, on technological opportunities, on<br />
the degree of (labour) participation in the political, societal and market arenas, and on<br />
the liberalisation of world commodity and fac<strong>to</strong>r markets.<br />
�e robust growth of income per capita leads <strong>to</strong> more ‘luxury’ consumption in developed<br />
countries. �is implies more convenience food, processed products (ready <strong>to</strong> eat) and food<br />
safety, environmental and health concerns. In developed countries the <strong>to</strong>tal amount of food<br />
consumed will only grow in a limited manner. However, in developing countries a higher<br />
income induces more consumption and a shi� <strong>to</strong> more value-added products. Important is<br />
the switch from cereals <strong>to</strong> meat consumption, as an increased demand for meat induces a<br />
relatively higher demand for grain and protein feed. To produce 1 kg of chicken, pork and<br />
beef, respectively 2.5 kg, 6.5 kg and 7 kg of feed are required. 17<br />
17 �e numbers describe upper-bound estimates of conversion rates: 7 kg of maize <strong>to</strong> produce 1 kg of beef, 6.5<br />
kg of maize <strong>to</strong> produce 1 kg of pork, and 2.6 kg of maize <strong>to</strong> produce 1 kg of chicken (Leibtag, 2008). Modern<br />
technology, however, require much less feed especially in pork production; here average feed conversion rates<br />
are between 3.2-2.6 kg of feed per kg of meat.<br />
230 <strong>Sugarcane</strong> <strong>ethanol</strong>
2.4 Long-term drivers of supply<br />
Why are current food prices so high?<br />
With regard <strong>to</strong> grain and oilseed production, yield and area developments are important<br />
drivers of supply. Figure 5 shows that production growth was almost <strong>to</strong>tally determined by<br />
yield increase while the <strong>to</strong>tal area harvested was more or less constant. �e growth in yields<br />
declined from 2% per year in the 1970-1990 period <strong>to</strong> 1.1% in the 1990-2007 period. USDA<br />
expects the growth <strong>to</strong> decline <strong>to</strong> 0.8% per year for the period 2009-2017 (USDA, 2008). At<br />
the global scale, crop production area increased in the 1970-2007 period by 0.15% per year,<br />
and USDA expects the area <strong>to</strong> grow by 0.4% per year in the period 2007-2017.<br />
Figure 6 shows that growth rates of yields for major cereals in developing countries are<br />
slowing. It should be mentioned that the decline in annual growth rates is not necessarily<br />
related <strong>to</strong> a decline in absolute yield growth per annum. An important explanation for<br />
the decreasing yield growth rates might be the declining public agricultural research and<br />
development spending over time in both developing and developed countries (Figure 7).<br />
Although private sec<strong>to</strong>r research has grown, private sec<strong>to</strong>r R&D is mostly cost reducing\<br />
short run oriented instead of public R&D, which is o�en more yield enhancing\long term<br />
oriented.<br />
•<br />
•<br />
�e direct link between R&D spending and yield growth had been intensively discussed<br />
amongst agricultural scientists and is not fully clear.<br />
�e general outcome of this discussion is that an additional growth in yield rates requires<br />
more than additional spending in capital s<strong>to</strong>ck but also investment in human capital<br />
s<strong>to</strong>ck and improvements in market institutions<br />
260<br />
240<br />
220<br />
200<br />
180<br />
160<br />
140<br />
120<br />
100<br />
80<br />
1970 1975 1980 1985 1990 1995 2000 2005 2010 2015<br />
Production Yield Population<br />
Per capita production Area harvested<br />
Figure 5. Development of world grain and oilseed production. Source: USDA Agricultural Projections<br />
<strong>to</strong> 2017.<br />
<strong>Sugarcane</strong> <strong>ethanol</strong> 231
Chapter 10<br />
Average annual growth rate (%)<br />
6<br />
5<br />
4<br />
3<br />
2<br />
1<br />
0<br />
1963 1967 1971 1975 1979 1983 1987 1991 1995 1999 2003<br />
Figure 6. Development annual yields for selected cereals in developing countries. Source: World<br />
Development Report 2008.<br />
Average annual growth (percent per year)<br />
12.0<br />
10.0<br />
8.0<br />
6.0<br />
4.0<br />
2.0<br />
0.0<br />
-2.0<br />
Asia-Pacific Latin America<br />
and the<br />
Carribean<br />
Sub-Saharan<br />
Africa<br />
Developing<br />
countries<br />
3. What explains the recent increase in agricultural prices?<br />
maize<br />
A combination of record low global inven<strong>to</strong>ry levels, weather induced supply side shocks,<br />
surging outside inves<strong>to</strong>r in�uence, record oil prices and structural <strong>change</strong>s in demand for<br />
grains and oilseeds due <strong>to</strong> biofuels have created the high prices. �e question is whether it<br />
is a coincidence that the past and current high price levels coincide with high oil prices or<br />
whether other reasons for the current price peak are more important.<br />
232 <strong>Sugarcane</strong> <strong>ethanol</strong><br />
rice<br />
wheat<br />
1976-81 1981-91 1991-2000<br />
High-income<br />
countries<br />
Figure 7. Public Agricultural R&D Spending Trends, 1976-2000. Source: Pardey et al. (2006).
3.1. Effects on the supply side<br />
Why are current food prices so high?<br />
As mentioned above the variation of yields due <strong>to</strong> climatic conditions, the development of<br />
input prices – fertilizer, diesel and pesticides – as well as the level of political support are<br />
the main drivers of supply. �e following items provide some information on these points<br />
(Figure 8):<br />
• Poor harvests in Australia, Ukraine and Europe for wheat and barley. According <strong>to</strong><br />
FAO statistics, these three regions contributed on average 51% of <strong>to</strong>tal world barley<br />
production and 27% of <strong>to</strong>tal world wheat production for the period 2005-2006.<br />
• Lower harvests in wheat and barley are more than compensated by a bumper harvest<br />
for maize worldwide.<br />
– �erefore, world cereal production increased in <strong>to</strong>tal even in 2007.<br />
– �e bumper harvest in maize kept maize prices low and the wheat-maize spread<br />
increased signi�cantly (Figure 3).<br />
– Only recently have maize prices also strongly increased.<br />
• Higher energy prices lead <strong>to</strong> higher food prices as costs (e.g. fertilizer, processing, and<br />
transport) increase. Higher transport costs induce higher price e�ects as distances<br />
increase.<br />
• CAP policies such as manda<strong>to</strong>ry set-aside regulation or production quota restrained<br />
supply. Furthermore, there was a <strong>change</strong> from price <strong>to</strong> income support and compensa<strong>to</strong>ry<br />
payments became decoupled, set aside was introduced and export subsidies were<br />
diminished. Some of these measures limited supply within the EU. However, the general<br />
aim of the last CAP reforms was an enforcement of farmers’ ability <strong>to</strong> react <strong>to</strong> market<br />
signals instead of following policy signals given by market price support. Measures<br />
0.8<br />
0.6<br />
0.4<br />
0.2<br />
0.0<br />
-0.2<br />
-0.4<br />
-0.6<br />
-0.8<br />
-1.0<br />
1995 1996 1997 1998 1999 2000 2001 2002 2003 2004 2005 2006 2007<br />
Australia Canada EU (27) US<br />
Figure 8. Deviation from trend in yields (wheat and coarse grains) in <strong>to</strong>ns/ha. Source: OECD-FAO<br />
Agricultural Outlook 2008-2017 (2008).<br />
<strong>Sugarcane</strong> <strong>ethanol</strong> 233
Chapter 10<br />
•<br />
aimed <strong>to</strong> restrict supply, e.g. production quota or set-aside requirements, are instruments<br />
designed for a world with declining prices, but which may act <strong>to</strong> reinforce prices in case<br />
of food shortages.<br />
Low prices in the last decades did not provide an incentive <strong>to</strong> invest in productivity<br />
enhancing technologies.<br />
3.2. Effects on the demand side<br />
Compared <strong>to</strong> the variability of agricultural supply, the demand of agri-food products is<br />
rather inelastic. For most agricultural commodities price and income elasticities are small,<br />
i.e. long-term demand for primary agricultural products is more determined by population<br />
growth and less by income growth. Within the last years the demand for agri-food products<br />
have been determined by the following driver:<br />
• Constant demand in Europe and Northern America with an increase in demand in<br />
Asian countries<br />
• Change in diet in emerging economies.<br />
• Additional demand for biofuels:<br />
– 5% of global oilseed production is processed <strong>to</strong> biodiesel or is used directly for<br />
transportation.<br />
– 4.5% of global cereal production is used for <strong>ethanol</strong> production.<br />
– �erefore, this marginal extra demand triggered the markets.<br />
– However, biofuels are not new. Ethanol based on sugarcane exists in an economically<br />
pro�table way in Brazil for a long time.<br />
–<br />
Increasing food and feeds<strong>to</strong>ck prices make biofuels less pro�table and food more<br />
pro�table. �is shi�s production back <strong>to</strong> food (in US is this already visible; Trostle,<br />
2008, p.17). With current high prices for soybeans in the US margins for biodiesel<br />
became already negative and the biodiesel production slowed down [see presentation<br />
of Gerald A. Bange (USDA) on the Agricultural Markets Roundtable held April 22,<br />
2008 Washing<strong>to</strong>n, DC at the Commodity Futures Trading Commission].<br />
�e development of both – supply and demand side – contribute <strong>to</strong> the development of<br />
s<strong>to</strong>cks which is illustrated in the following Figure 9. �e trend of a declining s<strong>to</strong>ck <strong>to</strong> use<br />
ratio as has increased and s<strong>to</strong>cks for wheat are currently running on empty. �is implies that<br />
all the shocks mentioned above could not be mitigated by using s<strong>to</strong>cks but lead immediately<br />
<strong>to</strong> price increases. Furthermore, it enabled speculation (with s<strong>to</strong>cks available there would<br />
have been less room for speculation)<br />
234 <strong>Sugarcane</strong> <strong>ethanol</strong>
3.3 Policy responses <strong>to</strong> rising food prices<br />
•<br />
•<br />
50%<br />
45%<br />
40%<br />
35%<br />
30%<br />
25%<br />
20%<br />
15%<br />
10%<br />
5%<br />
0%<br />
1960/1961<br />
1965/1966<br />
1970/1971<br />
1975/1976<br />
1980/1981<br />
1985/1986<br />
Wheat Corn<br />
1990/1991<br />
Why are current food prices so high?<br />
1995/1996<br />
2000/2001<br />
2005/2006<br />
Figure 9. Development of s<strong>to</strong>ck <strong>to</strong> use ratio, 1960-2007. Source: US Department of Agriculture PSD<br />
View database, June 2008.<br />
�e rapidly increasing world prices for food grains, feed grains, oilseeds, and vegetable<br />
oils are causing domestic food prices at the consumer level <strong>to</strong> rise in many countries. In<br />
response <strong>to</strong> rising food prices, some countries are beginning <strong>to</strong> take protective policy<br />
measures designed <strong>to</strong> reduce the impact of rising world food commodity prices on their<br />
own consumers. However, such measures typically force greater adjustments and higher<br />
prices on<strong>to</strong> global markets.<br />
In the fall of 2007, some exporting countries made policy <strong>change</strong>s designed <strong>to</strong> discourage<br />
exports so as <strong>to</strong> keep domestic production within the country. �e objective was <strong>to</strong><br />
increase domestic food supplies and restrain increases in food prices. Table 1 depicts a<br />
partial list of these policy <strong>change</strong>s.<br />
<strong>Sugarcane</strong> <strong>ethanol</strong> 235
Chapter 10<br />
Table 1. Policy responses <strong>to</strong> rising food prices.<br />
Eliminated export subsidies:<br />
China eliminated rebates on value-added taxes on exported grains and grain products. The rebate<br />
was effectively an export subsidy that was eliminated.<br />
Export taxes:<br />
China, with food prices still rising after eliminating the value-added tax rebate, imposed an export<br />
tax on a similar list of grains and products.<br />
Argentina raised export taxes on wheat, maize, soybeans, soybean meal, and soybean oil.<br />
Russia and Kazakhstan raised export taxes on wheat.<br />
Malaysia imposed export taxes on palm oil.<br />
Export quantitative restrictions:<br />
Argentina restricted the volume of wheat that could be exported even before raising export taxes<br />
on grains.<br />
Ukraine established quantitative restrictions on wheat exports.<br />
India and Vietnam put quantitative restrictions on rice exports.<br />
Export bans:<br />
Ukraine, Serbia, and India banned wheat exports.<br />
Egypt, Cambodia, Vietnam, and Indonesia banned rice exports. India, the world’s third largest<br />
rice exporter, banned exports of rice other than basmati, significantly reducing global exportable<br />
supplies.<br />
Kazakhstan banned exports of oilseeds and vegetable oils. Early in 2008, importing countries also<br />
began <strong>to</strong> take protective policy measures <strong>to</strong> combat rising food prices. Their objective was <strong>to</strong> make<br />
high-cost imports available <strong>to</strong> consumers at lower prices. A partial list of policy <strong>change</strong>s follows.<br />
The following countries reduced import tariffs:<br />
India (wheat flour).<br />
Indonesia (soybeans and wheat; streamlined the process for importing wheat flour).<br />
Serbia (wheat).<br />
Thailand (pork).<br />
EU (grains).<br />
Korea and Mongolia (various food commodities)<br />
Subsidizing consumers:<br />
Some countries, including Morocco and Venezuela, buy food commodities at high world prices and<br />
subsidize their distribution <strong>to</strong> consumers.<br />
Other decisions by importers:<br />
Iran imported maize from the United States, something that has occurred rarely – only when they<br />
could not procure maize elsewhere at reasonable prices.<br />
The policies adopted by importing countries also <strong>change</strong>d price relationships in world markets. Their<br />
policy <strong>change</strong>s increased the global demand for food commodities even when world prices were<br />
already rapidly escalating.<br />
Source: Trostle (2008).<br />
236 <strong>Sugarcane</strong> <strong>ethanol</strong>
3.4. Other effects<br />
•<br />
Why are current food prices so high?<br />
USD ex<strong>change</strong> rate developments. World prices are denominated in dollars and the<br />
dollar depreciated against most currencies. �e increase in prices in other currencies<br />
is therefore much less.<br />
Speculation:<br />
• In recent months spot and future prices do not fully converge.<br />
• Future prices remain higher than prices on spot markets.<br />
– Reason for this development:<br />
› Most hedging (90%) is Index-hedging, i.e. ‘traditional’ short- and long hedging<br />
does not dominate the price development in the future markets.<br />
› �us, if everybody expects high prices, then future prices tend <strong>to</strong> be higher than<br />
the spot prices.<br />
– So, part of current high prices can be attributed <strong>to</strong> this ‘bubble’.<br />
• Di�cult <strong>to</strong> estimate the impact of speculation in this s<strong>to</strong>ry.<br />
– �e crises on the �nancial markets are diverting funds away from traditional<br />
�nancial institutions leading <strong>to</strong> a large pool of funds available for investments in<br />
other markets.<br />
– �ere is de�nitely a impact of speculation in current high prices<br />
– Hard <strong>to</strong> say it makes X %.<br />
– Growing volatility in food markets due <strong>to</strong> the fact that most of hedging is based on<br />
index funds and not anymore on the ‘traditional’ short and long hedging. �is share<br />
is less than 10% in <strong>to</strong>tal market volume.<br />
– An example for the current volatility: In the 1st week of March the �uctuation of<br />
maize prices was more than 150 USD/t, which is more than last year’s average maize<br />
price!<br />
• Impact of speculation on current spike in agricultural prices is di�cult <strong>to</strong> quantify.<br />
Figure 10 shows the composition of the maize futures markets broken down between<br />
commercial merchants, managed money funds and commodity index traders <strong>to</strong>gether<br />
with the price development in USD per bushel of maize (right-hand scale).<br />
– It clearly shows that not only the ‘speculative’ index and fund hedging but also the<br />
increase in short futures by commercial merchants contributed <strong>to</strong> the dramatic<br />
increase in maize future prices.<br />
– However, the managed money funds which are mostly pension funds – which<br />
diversify their portfolio now also <strong>to</strong> agricultural commodities – cut down their<br />
purchase of additional contracts on long position when prices increased dramatically<br />
(Figure 10).<br />
–<br />
A formal assessment is hampered by data and methodological problems, including<br />
the di�culty of identifying speculative and hedging-related trades.<br />
<strong>Sugarcane</strong> <strong>ethanol</strong> 237
Chapter 10<br />
Figure 10. CBOT Corn Market Composition January 2007 – April 2008. Source: Derived from a<br />
presentation of Dave Kass at the Agricultural Markets Roundtable held April 22, 2008 Washing<strong>to</strong>n,<br />
DC at the Commodity Futures Trading Commission.<br />
–<br />
A number of recent studies seem <strong>to</strong> suggest that speculation has not systematically<br />
contributed <strong>to</strong> higher commodity prices or increased price volatility.<br />
› For example, a recent IMF sta� analysis (September 2006 World Economic<br />
Outlook) shows that speculative activity tends <strong>to</strong> respond <strong>to</strong> price movements<br />
(rather than the other way around), suggesting that the causality runs from prices<br />
<strong>to</strong> <strong>change</strong>s in speculative positions.<br />
› �e Commodity Futures Trading Commission has argued that speculation<br />
may have reduced price volatility by increasing market liquidity, which allowed<br />
market participants <strong>to</strong> adjust their portfolios, thereby encouraging entry by new<br />
participants.<br />
4. First quantitative results of the analysis of key driving fac<strong>to</strong>rs<br />
•<br />
Thousand contracts<br />
Short Long<br />
500<br />
400<br />
300<br />
200<br />
100<br />
0<br />
-100<br />
-200<br />
-300<br />
-400<br />
-500<br />
-600<br />
-700<br />
-800<br />
-900<br />
1/3<br />
1/22<br />
2/26<br />
2/7<br />
3/14<br />
3/30<br />
4/18<br />
5/4<br />
5/22<br />
6/8<br />
7/13<br />
6/26<br />
7/31<br />
8/16<br />
9/4<br />
9/20<br />
10/24<br />
10/8<br />
11/9<br />
11/28<br />
12/14<br />
1/3<br />
1/22<br />
2/7<br />
2/26<br />
3/13<br />
4/1<br />
Commercial merchants Managed money funds<br />
CIT CBOT nearby future<br />
6.00<br />
5.75<br />
5.50<br />
5.25<br />
5.00<br />
4.75<br />
4.50<br />
4.25<br />
4.00<br />
3.75<br />
3.50<br />
3.25<br />
3.00<br />
2.75<br />
2.50<br />
OECD Outlook 2007-2017: �e OECD performed some scenarios <strong>to</strong> see the impact of<br />
various drivers on their Outlook projection (OECD-FAO, 2008). �is analysis highlights<br />
the outcome of a situation where biofuel policies are in place under the reference scenario<br />
and di�erent assumptions are moderate, e.g. income growth, development of crude oil<br />
prices, etc.:<br />
– If biofuel production stays at its 2007 level, then world wheat prices would be 5% lower,<br />
maize 13% lower and vegetable oil 15% lower compared <strong>to</strong> the reference scenario<br />
where biofuel production in 2017 more than doubles relative <strong>to</strong> the 2007 level.<br />
238 <strong>Sugarcane</strong> <strong>ethanol</strong><br />
Dollars per bushel
–<br />
–<br />
–<br />
–<br />
Why are current food prices so high?<br />
A constant crude oil price implies 10% lower prices for all three commodities, due<br />
<strong>to</strong> the fact that the assumed high crude oil price under the reference scenario will<br />
make biofuel crops more pro�table.<br />
Lower income growth is especially relevant for vegetable oils (more than 10%).<br />
A stronger US dollar of 10% leads <strong>to</strong> about 5% lower prices for wheat, maize and<br />
vegetable oil relative <strong>to</strong> the baseline.<br />
Higher growth rates in yields for important biofuel crops will lower the world market<br />
prices for their production by more than 5% for wheat and maize.<br />
�ese results are inline with our own results on the impact of biofuel policies, which are<br />
presented in Figure 12.<br />
•<br />
0%<br />
-5%<br />
-10%<br />
-15%<br />
-20%<br />
-25%<br />
-30%<br />
-35%<br />
-40%<br />
-45%<br />
Wheat Maize Vegetable oil<br />
Scenario 5 : Scenario 4 and yields for wheat, oilseeds and coarse grains 5 % higher<br />
than over the projection period<br />
Scenario 4 : Scenario 3 and Progressive appreciation of the USD ex<strong>change</strong> rates <strong>to</strong><br />
reach 10% higher rates in 2017<br />
Scenario 3 : Scenario 2 and Lower income growth in EE5 countries<br />
(half annual growth rate)<br />
Scenario 2 : Scenario 1 and Oil price constant at 2007 level (72$)<br />
Scenario 1 : Biofuel production constant at 2007 level<br />
Figure 11. Sensitivity on analysis of world price <strong>change</strong>s. Source: OECD-FAO Agricultural Outlook<br />
2008-2017. Highlights. (2008).<br />
International Food Policy Research Institute (IFPRI) study (e.g. Von Braun et al., 2008).<br />
– �e percentage contribution of biofuels demand <strong>to</strong> price increases from 2000-07 is<br />
the di�erence between 2007 prices in the two scenarios, divided by the increase in<br />
prices in the baseline from 2000-2007.<br />
– �e increased biofuel demand between 2000 and 2007, compared with previous<br />
his<strong>to</strong>rical rates of growth, is estimated <strong>to</strong> have accounted for 30 percent of the increase<br />
in weighted average cereal prices during 2000-07.<br />
› Maize – 39%.<br />
› Rice – 21%.<br />
› Wheat – 22%.<br />
<strong>Sugarcane</strong> <strong>ethanol</strong> 239
Chapter 10<br />
•<br />
160<br />
150<br />
140<br />
130<br />
120<br />
110<br />
100<br />
actual biofuel growth, 2000-2007<br />
continuation of 1990-2000 biofuel growth<br />
2000 2001 2002 2003 2004 2005 2006 2007<br />
Figure 12. Biofuels: Impact on world cereal prices since 2000. Source: Impact Simulations 2008.<br />
IFPRI.<br />
– Rapid growth in biofuel demand has contributed <strong>to</strong> the rapid rise in cereal prices,<br />
but it has not been a dominant driving force in the 2000-07 period, except perhaps<br />
in the case of maize.<br />
– �e fundamentals of supply and demand seem <strong>to</strong> be playing more of a role in the rapid<br />
increase in prices during this period, especially for commodities like rice and wheat.<br />
– A�er 2007 prices increases – for rice in particular – seem <strong>to</strong> be driven by the relatively<br />
‘thin’ nature of the rice market with a limited amount of international trade compared<br />
<strong>to</strong> <strong>to</strong>tal production.<br />
– Unilateral trade policy actions of individual Asian countries, which have sought <strong>to</strong><br />
put in<strong>to</strong> place export bans and import subsidies for rice.<br />
– Speculative trading and s<strong>to</strong>rage behaviour; private opera<strong>to</strong>rs taking advantage of<br />
opportunities.<br />
Agri-Canada quanti�ed the impact of all the policy responses (Figure 13). �e impact<br />
of policies added a few percent for almost all commodities, except for rice where the<br />
impact is substantial (16%).<br />
Experts are pointing out that it is hard <strong>to</strong> quantify the separate impacts. �e contribution<br />
of biofuel demand <strong>to</strong> the increase in average cereal prices of 30% presented by IFPRI was<br />
criticized by some colleagues. Some �nd it <strong>to</strong>o high, other <strong>to</strong>o low. However, all studies<br />
point out that a combination of fac<strong>to</strong>rs was responsible for the rise. �e analyses of OECD,<br />
FAPRI and also of Banse et al. (2008a,b) indicated that the impact on world price levels is<br />
commodity speci�c. For maize the impact is relatively high due <strong>to</strong> the fact that most US<br />
<strong>ethanol</strong> production is maize-based. For other cereals – e.g. wheat and rice, where the use for<br />
biofuels is almost zero – only indirect e�ects over the land use a�ects the world price level.<br />
For those commodities an estimated increase of 30% – as indicated in the IFPRI estimates<br />
– seems <strong>to</strong> be rather high.<br />
240 <strong>Sugarcane</strong> <strong>ethanol</strong>
18<br />
16<br />
14<br />
12<br />
10<br />
8<br />
6<br />
4<br />
2<br />
0<br />
5. The future<br />
Wheat<br />
Maize<br />
2007-08 2008-09<br />
Why are current food prices so high?<br />
Oilseeds<br />
Veg.oil<br />
Figure 13. Impact of export restriction policies on world prices. Source: Agriculture and Agri-Food<br />
Canada, unpublished.<br />
A�er the discussion of those driving elements which contributed <strong>to</strong> the current spike in<br />
food prices this section depicts some elements which might contribute <strong>to</strong> the long-term<br />
development of agri-food prices. �is sections also allows <strong>to</strong> identify possible solutions for<br />
the current crisis on world food markets.<br />
• High prices are their own worst enemy. Increased pro�t margins entice entrepreneurial<br />
investment, which results in increased production. Lower market prices inevitably<br />
follow. �e ‘invisible hand’ of Adam Smith ensures that winners’ gains and losers’ losses<br />
will be temporary, as entrepreneurs correct market imbalances. In the USA, in the 2008<br />
spring planting farmers are shi�ing from maize <strong>to</strong> wheat and soybeans, setting the prices<br />
of the latter on a downward trajec<strong>to</strong>ry and stabilising the price of the former.<br />
• Higher prices induce more production as planted areas increase and available arable land<br />
will be used more intensively. �erefore, the current situation is not structural and as<br />
a result prices will go down again. However, �rst s<strong>to</strong>cks have <strong>to</strong> be built up again. Both<br />
e�ects take some time. In Brazil and Russia there are ample opportunities as additional<br />
land can be taken in<strong>to</strong> production, whereas in many other countries production can<br />
only be higher due <strong>to</strong> intensi�cation. According <strong>to</strong> USDA analyses, Russia, Ukraine and<br />
Argentina can become one of the world’s <strong>to</strong>p grain exporters.<br />
• R&D investments in agriculture (e.g. yields, etc.) become more pro�table with higher<br />
food prices.<br />
• Strategic s<strong>to</strong>cks are essential <strong>to</strong> limit price volatility in world agricultural markets, but<br />
they are costly.<br />
• �e expected impact on world prices of the 10% EU-biofuel directive and the various<br />
global biofuel initiatives is depicted in the graph below (Banse et al., 2008a,b). If all<br />
initiatives are implemented <strong>to</strong>gether and technological <strong>change</strong> stays on the his<strong>to</strong>ric trend,<br />
<strong>Sugarcane</strong> <strong>ethanol</strong> 241<br />
Rice
Chapter 10<br />
then the impact on world prices is substantial and the long term trend of declining world<br />
prices in the reference scenario might be dampened or reversed. �e arrival and impact<br />
of second generation biofuels is uncertain. According <strong>to</strong> Banse et al. (2008a,b), biofuels<br />
lead <strong>to</strong> higher agricultural income, land use and land prices, and a loss of biodiversity.<br />
Development of oil prices is crucial for the development of biofuels. Some experts point<br />
that prices stay high due <strong>to</strong> increased demand in Asia and depleting supply resources.<br />
Others indicate that this is a temporary situation as capacity is lacking at the moment due<br />
<strong>to</strong> <strong>to</strong>o few investments in the past. If oil prices stay high, food and energy markets will be<br />
more interlinked. �e oil prices will then put both a �oor and a ceiling 18 for prices in the<br />
food markets (Schmidhuber, 2007). As energy markets are more elastic, the long-term<br />
trend of food prices might be <strong>change</strong>d (less negative <strong>to</strong> positive dependent on development<br />
oil price).<br />
•<br />
20%<br />
15%<br />
10%<br />
5%<br />
0%<br />
-5%<br />
-10%<br />
-15%<br />
Cereals<br />
Oilseeds<br />
Sugar<br />
Reference Biofuel, EU Biofuel, global<br />
Crude oil<br />
Figure 14. Change in real world prices, in percent, 2020 relative <strong>to</strong> 2001. Source: Banse et al.<br />
(2008a,b).<br />
High feeds<strong>to</strong>ck prices make biofuels less pro�table (ceiling e�ect), as does a low oil<br />
price (�oor e�ect). Even at current level of crude oil prices of 120 USD per barrel almost<br />
no biofuels are economically viable without policies. A low oil price implies that only<br />
biofuels will be produced under mandates or that they are heavily subsidized. Without<br />
an increase in oil prices the impact of biofuels is therefore limited <strong>to</strong> the impact of �lling<br />
the mandates.<br />
18 Ceiling price e�ect: as feeds<strong>to</strong>ck costs are the most important cost element of all (large scale) forms of bioenergy<br />
use, feed s<strong>to</strong>ck prices (food and agricultural prices) cannot rise faster than energy prices in order for agriculture<br />
<strong>to</strong> remain competitive in energy markets. Floor price e�ect: if demand is particular pronounced as in the case<br />
of cane-based <strong>ethanol</strong>, bioenergy demand has created a quasi intervention system and an e�ective �oor price<br />
for sugar in this case.<br />
242 <strong>Sugarcane</strong> <strong>ethanol</strong>
•<br />
•<br />
•<br />
Why are current food prices so high?<br />
�e interrelation with the energy markets may slowdown or reverse Cochrane’s treadmill<br />
or Owens development squeeze which imply declining real agricultural prices, less<br />
farmers, larger scale farming and possible depopulated areas.<br />
Volatility of world prices might be an important problem in the future that causes hunger<br />
in terms of very high prices for poor consumers and problems for poor farmers when<br />
prices are low. �e ceiling and especially the �oor may act as an intervention price in<br />
case of very volatile prices. A �oor may also stimulate agriculture in the (poor) world.<br />
Hunger is not a problem directly related with biofuels but o�en of bad policies, and<br />
improperly functioning fac<strong>to</strong>r and commodity markets. 19 In principle, there is enough<br />
food in the world but there is a distribution problem.<br />
Rising food commodity prices tend <strong>to</strong> negatively a�ect lower income consumers more<br />
than higher income consumers. First, lower income consumers spend a larger share<br />
of their income on food. Second, staple food commodities such as maize, wheat, rice,<br />
and soybeans account for a larger share of food expenditures in low-income families.<br />
�ird, consumers in low-income, food-de�cit countries are vulnerable because they<br />
must rely on imported supplies, usually purchased at higher world prices. Fourth,<br />
countries receiving food aid donations based on �xed budgets receive smaller quantities<br />
of food aid. A simpli�ed comparison of the impact of higher food commodity prices<br />
on consumers in high-income countries and on consumers in low-income, food-de�cit<br />
countries illustrates these di�erences (see Table 2).<br />
19 AG assessment (2008), ‘Policy options for improving livelihoods include access <strong>to</strong> microcredit and other<br />
�nancial services; legal frameworks that ensure access and tenure <strong>to</strong> resources and land; recourse <strong>to</strong> fair con�ict<br />
resolution; and progressive evolution and proactive engagement in Intellectual Property Rights (IPR) regimes<br />
and related instruments.’<br />
Table 2. Impact of higher food commodity prices on consumers’ food budgets.<br />
High income<br />
countries<br />
Low income,<br />
food deficit countries<br />
Initial situation<br />
Income € 40,000 € 1,000<br />
Food expenditure € 4,000 € 500<br />
Food costs as % of income 10% 50%<br />
30% increase in food prices<br />
New costs for <strong>to</strong>tal food expenditure € 5,200 € 650<br />
Food costs as % of income 13% 65%<br />
<strong>Sugarcane</strong> <strong>ethanol</strong> 243
Chapter 10<br />
�is illustrative comparison shows that for a consumer in a high-income country a 30percent<br />
increase in food prices causes food expenditures <strong>to</strong> rise 3 percent (€1,200), while for<br />
a consumer in a low-income country food expenditures increase by 15 percentage points.<br />
6. Concluding remarks<br />
�e motivation at the origin of this chapter can be summarised in four questions:<br />
• Is the current price increase driven by real or monetary issues (notably a speculation<br />
phenomenon)?<br />
• Are natural resource and basic food commodity prices linked <strong>to</strong>gether?<br />
• Is the shortfall in production also linked <strong>to</strong> governance issues that limit investment and<br />
production?<br />
•<br />
To what extent is the underused capacity in land and man-power a result of lack of<br />
investment capacity, both at the micro level (<strong>to</strong>ols and seed) and at the macro level<br />
(s<strong>to</strong>rage and transportation infrastructure)?<br />
�e work on these questions allows the formulation of responses, and also some broader<br />
observations. From our work it is clear that the price increases have several roots and that<br />
a normally functioning market will in time provide a certain degree of corrective action.<br />
But policy/political decisions can prevent the market from doing so. In any case, the time<br />
lapse for the market <strong>to</strong> act does not remove the acuity of the price dis<strong>to</strong>rtion that a�ects the<br />
poorest people, and urgent intervention is necessary <strong>to</strong> alleviate the e�ects of short-term<br />
price peaks.<br />
Natural resource prices lead basic food commodity prices; the rate of growth of the former<br />
has his<strong>to</strong>rically been (and is again at present) higher than the latter. Biofuels create a more<br />
direct link between food and fuel prices, if fuel prices are high: the long-term trend of<br />
declining real food prices might be dampened or reversed.<br />
�e in�uence of policy/political decisions mentioned above is certainly present when<br />
considering why production in many countries is below the potential capacity <strong>to</strong> produce<br />
food. Not only has land been voluntarily removed from production in some cases, but the<br />
access <strong>to</strong> technology and markets is sometimes also limited by fac<strong>to</strong>rs that are strictly in the<br />
realm of governance. But then there are also potential producers, who simply can not make<br />
it in<strong>to</strong> the market, and they can be assisted through micro-credit or through the donation of<br />
<strong>to</strong>ols, seeds and the development of irrigation, s<strong>to</strong>rage capacity and transportation facilities<br />
<strong>to</strong> integrate in<strong>to</strong> market structures.<br />
Our further observations are of several orders, and theses are with regard <strong>to</strong> policy<br />
implications, market failure, social equity, and required policy action.<br />
244 <strong>Sugarcane</strong> <strong>ethanol</strong>
6.1. Policy implications<br />
Why are current food prices so high?<br />
With regard <strong>to</strong> the EU, CAP reform was designed <strong>to</strong> enforce farmers’ reaction <strong>to</strong> market<br />
signals. �ere should be no surprise, therefore, when farmers do, and therefore production<br />
falls close <strong>to</strong> the level of world demand. �e problem, however, is the time lag between the<br />
demand in the market and a farmer’s decision on what – and how much – <strong>to</strong> plant. �ere is<br />
always some degree of ‘inadequate’ response on the supply side. Around the world, farmers<br />
are now responding <strong>to</strong> price signals and are increasing their production of cereals. Building<br />
up and managing s<strong>to</strong>cks is not the primary responsibility of farmers, and in a free market<br />
this is le� <strong>to</strong> traders; some government intervention might be considered, but a return <strong>to</strong><br />
au<strong>to</strong>matic intervention based solely on commodity prices should be absolutely avoided!<br />
6.2. Will current price level persist?<br />
High prices can only ‘cured’ by high prices. �is may initially seem <strong>to</strong> be a provocative<br />
statement, but the simple fact is that – as stated above – farmers do react <strong>to</strong> price signals.<br />
So do all the other agents in the economy, including specula<strong>to</strong>rs! �e food price ‘crisis’ will<br />
certainly be prolonged through protective measures by national governments, although the<br />
issue of civil stability may encourage some governments <strong>to</strong> take such actions, <strong>to</strong> reassure<br />
their populations that ‘something is being done’. Biofuels, however, create a more direct<br />
link between food and fuel prices and if fuel prices increase further, the long-term trend of<br />
declining real food prices might be dampened or reversed.<br />
6.3. Who is mostly affected?<br />
�e consumers of food in low-income countries with food and energy de�cits are those<br />
who will su�er most in any sudden or rapid price shi� for basic commodities, of which<br />
foremost is food. In principle, current high prices provide additional income opportunities<br />
for farmers. Whether farmers in developing countries will bene�t from current high prices<br />
on world food markets remains questionable and depends on the degree of integration of<br />
regional in global food markets. But if there is no structural market failure involved per se,<br />
as stated above, then this means that the conditions of productivity and market access are<br />
the priorities that have not been addressed successfully for a long period of time before a<br />
price crisis occurs.<br />
6.4. Required policy action<br />
Short-term action is <strong>to</strong> urgently increase spending on food aid (which has gone down<br />
during the last years). Long-term production capacity improvement (including publically<br />
�nanced agricultural research) is essential <strong>to</strong> avoid repeated price crises. �e current crisis<br />
is not a crisis in terms of shortage of food, but a crisis in terms of income shortage (in terms<br />
of purchasing power and of investment potential <strong>to</strong> increase productive capacity). Policy<br />
<strong>Sugarcane</strong> <strong>ethanol</strong> 245
Chapter 10<br />
measures should enable especially the poor <strong>to</strong> be able <strong>to</strong> participate in the economy, and<br />
therefore for the poor countries <strong>to</strong> generate income within a world market.<br />
Acknowledgements<br />
We consulted the following experts: Patt Westho� (FAPRI), Josef Schmidhuber (FAO),<br />
Loek Boonekamp (OECD), Ron Trostle (ERS/USDA), Pavel Vavra (OECD), Willie Meyers<br />
(FAPRI) and Pierre Charlebois (Agriculture and Agri-Food Canada). Furthermore,<br />
we bene�ted greatly from insights and the discussions during the World Agricultural<br />
Outlook Conference, organized by ERS/USDA Washing<strong>to</strong>n DC, May, 14-15, 2008 and the<br />
Modeling Workshop on Biofuel, May, 16 organized by Farm Foundation and ERS/USDA<br />
Washing<strong>to</strong>n DC.<br />
References<br />
Banse, M., H. van Meijl, A. Tabeau and G. Woltjer, 2008a. Will EU Biofuel Policies a�ect Global Agricultural<br />
Markets? European Review of Agricultural Economics, 35: 117-141.<br />
Banse, M., H. van Meijl and G. Woltjer, 2008b. �e Impact of First Generation Biofuels on Global Agricultural<br />
Production, Trade and Land Use. Paper presented at the 12th EAAE Conference. 26-29 August 2008,<br />
Gent, Belgium.<br />
Licht, F.O., 2007. Licht Interactive Data. Available at: http://statistics.fo-licht.com/. Accessed 20/04/2007.<br />
Leibtag, E., 2008. Corn Prices Near Record High, But What About Food Costs? Amber Waves.<br />
International Monetary Fund (IMF), 2008. International �nancial statistics. Available at: http://www.<br />
imfstatistics.org/imf/. Accessed 18/04/2008.<br />
Nowicki, P., H. van Meijl, A. Knierim, M. Banse, J. Helming, O. Margraf, B. Matzdorf, R. Mnatsakanian, M.<br />
Reutter, I. Terluin, K. Overmars, D. Verhoog, C. Weeger and H. Westhoek, 2006. Scenar 2020 - Scenario<br />
study on agriculture and the rural world. Contract No. 30 - CE - 0040087/00-08. European Commission,<br />
Direc<strong>to</strong>rate-General, Belgium.<br />
OECD-FAO, 2008. Agricultural Outlook 2008-2017. Paris, France.<br />
Pardey, P.G., N. Beintema, S. Dehmer and S. Wood, 2006. Agricultural research: a growing global divide,<br />
IFPRI, Washing<strong>to</strong>n, USA. DOI: http://dx.doi.org/10.2499/089629529X.<br />
Schmidhuber, J., 2007. Biofuels: An Emerging �reat <strong>to</strong> Europe’s Food Security? Impact of an Increased<br />
Biomass Use on Agricultural Markets, Prices and Food Security: A Longer-term Perspective. Available<br />
at: www.notre-europe.eu.<br />
Trostle, R., 2008. Global Agricultural Supply and Demand: Fac<strong>to</strong>rs Contributing <strong>to</strong> the Recent Increase in<br />
Food Commodity Prices. ERS/USDA. WRS-0801.<br />
United States Department on Agriculture (USDA), 2008. PSD view database. Available at: http://www.fas.<br />
usda.gov/psdonline/. Accessed 21/05/2008.<br />
United States Department on Agriculture (USDA), 2008. USDA Agricultural Projections <strong>to</strong> 2017. Long-term<br />
Projections Report. OCE-2008-1. February 2008. Washing<strong>to</strong>n D.C.<br />
246 <strong>Sugarcane</strong> <strong>ethanol</strong>
Why are current food prices so high?<br />
Van Meijl, H., T.J. Achterbosch, A.J. de Kleijn, A.A. Tabeau and M. Kornelis, 2003. Prijzen op agrarische<br />
wereldmarkten; Een verkenning van projecties [Agricultural world market prices; an explorative study<br />
<strong>to</strong> projections]. Agricultural Economics Research Institute, Rapport 8.03.06.<br />
Von Braun, J., A. Ahmed, K. Asenso-Okyere, S. Fan, A. Gulati, J. Hoddinott, R. Pandya-Lorch, M.W.<br />
Rosegrant, M. Ruel, M. Torero, T. van Rheenen and K. von Grebmer, 2008. High Food Prices: �e What,<br />
Who, and How of Proposed Policy Actions. IFPRI Policy Brief, Washing<strong>to</strong>n, USA.<br />
World Bank, 2008. World Bank data base. Available at: http://web.worldbank.org/ Accessed 18/04/2008.<br />
World Bank, 2008. World Development Report 2008: Agriculture for Development. Washing<strong>to</strong>n DC.<br />
<strong>Sugarcane</strong> <strong>ethanol</strong> 247
Acknowledgements<br />
We would like <strong>to</strong> express our gratitude <strong>to</strong> the authors of the di�erent chapters of this book<br />
for their valuable contributions, their creativity, positive attitude and willingness <strong>to</strong> accept<br />
our role of coordina<strong>to</strong>rs. �e thorough work of the peer reviewers contributed <strong>to</strong> the quality<br />
of the contents of the di�erent chapters.<br />
�e choice of the subjects, the selection of authors, the selection of peer reviewers and the<br />
structure of the publication was ours.<br />
Regarding Chapter 10, the underlying study - Why are current food prices so high? by<br />
Martin Banse, Peter Nowicki and Hans van Meijl, �e Hague, 2008 - was �nanced by the<br />
Ministry of Agriculture, Nature and Food Quality, for which they are expressing their<br />
thanks as well.<br />
We thank Wageningen International, part of Wageningen University and Research Centre <strong>to</strong><br />
facilitate the management of the project. Finally, we gratefully acknowledge the important<br />
contribution of Wageningen Academic Publishers. Mike Jacobs and his team did a great<br />
job within a limited timeframe.<br />
Peter Zuurbier<br />
Jos van de Vooren<br />
<strong>Sugarcane</strong> <strong>ethanol</strong> 249
Authors<br />
Dr. Marcos Adami, senior researcher at INPE - Institu<strong>to</strong> Nacional de Pesquisas Espaciais, Divisão<br />
de Sensoriamen<strong>to</strong> Remo<strong>to</strong>, Jose dos Campos (SP), Brazil.<br />
Daniel Alves de Aquiar, Msc and currently researcher at INPE - Institu<strong>to</strong> Nacional de Pesquisas<br />
Espaciais, Direção, Coordenação Geral de Observação da Terra, Jose dos Campos (SP), Brazil.<br />
Dr. Weber An<strong>to</strong>nio Neves do Amaral is full professor at the University of São Paulo, ESALQ - Escola<br />
Superior de Agricultura ‘Luiz de Queiroz’, Piracicaba (SP), Brazil.<br />
Laura Barcellos An<strong>to</strong>niazzi, Msc is working at ICONE - Institu<strong>to</strong> de Estudos do Comércio e<br />
Negociações, São Paulo (SP), Brazil.<br />
Dr. Miriam Rumenos Piedade Bacchi, researcher at CEPEA - Centro de Estudos Avançados em<br />
Economia Aplicada, University of São Paulo, ESALQ - Escola Superior de Agricultura ‘Luiz de<br />
Queiroz’, Piracicaba (SP), Brazil.<br />
Dr. Martin Banse, senior researcher at the Agricultural Economics Research Institute of Wageningen<br />
University and Research Centre, �e Hague, the Netherlands.<br />
Dr. Augus<strong>to</strong> Beber, researcher at Venture Partners do Brazil - São Paulo (SP), Brazil.<br />
Dr. Annie Dufey, senior researcher at IIED - International Institute for Environment and Development,<br />
London, United Kingdom.<br />
Dr. Andre Faay, associate professor at the Copernicus Institute, Utrecht University, the Netherlands.<br />
Dr. Günther Fischer leads the Land Use Change and Agriculture Program (LUC) at IIASA -<br />
International Institute for Applied Systems Analysis, in Laxenburg, Austria.<br />
Dr. Eduardo Giuliani is partner at Venture Partners do Brazil - São Paulo (SP), Brazil<br />
Dr. Eva Tothne Hizsnyik joined the Land Use Change and Agriculture Program (LUC) at IIASA<br />
- International Institute for Applied Systems Analysis - in 2003 as a part-time Research Scholar,<br />
Laxenburg, Austria.<br />
Dr. Isaias Macedo is visiting researcher at NIPE - Núcleo Interdisciplinar de Planejamen<strong>to</strong> Energético,<br />
Universidade Estadual de Campinas (UNICAMP), Campinas (SP), Brazil. Since 2001, he has been<br />
consultant in Energy for the Brazilian Government and the private sec<strong>to</strong>r.<br />
João Paulo Marinho, Msc is graduate student at the University of São Paulo, ESALQ - Escola Superior<br />
de Agricultura ‘Luiz de Queiroz’, Piracicaba (SP), Brazil.<br />
<strong>Sugarcane</strong> <strong>ethanol</strong> 251
Authors<br />
Dr. Andre Meloni Nassar is direc<strong>to</strong>r-general ICONE - Institu<strong>to</strong> de Estudos do Comércio e Negociações,<br />
São Paulo (SP), Brazil.<br />
Dr. Peter Nowocki, senior researcher at the Agricultural Economics Research Institute of Wageningen<br />
University and Research Centre, �e Hague, the Netherlands.<br />
Dr. Bernardo F.T. Rudor� is senior research at INPE - Institu<strong>to</strong> Nacional de Pesquisas Espaciais,<br />
Divisão de Sensoriamen<strong>to</strong> Remo<strong>to</strong>, Jose dos Campos (SP), Brazil.<br />
Dr. Joaquim E.A. Seabra, professor at FEM - Faculdade de Engenharia Mecânica, Universidade<br />
Estadual de Campinas (UNICAMP), Campinas (SP), Brazil.<br />
Dr. Alfred Szwarc, consultant at ADS - Technology and Sustainable Development, São Paulo, Brazil.<br />
Rudy Tarasantchi, Msc is graduate student at the University of São Paulo, ESALQ - Escola Superior<br />
de Agricultura ‘Luiz de Queiroz’, Piracicaba (SP), Brazil.<br />
Dr. Edmar Teixeira joined the Land Use Change and Agriculture Program of IIASA - International<br />
Institute for Applied Systems Analysis, in April 2007 as a Postdoc<strong>to</strong>ral Research Scholar, Laxenburg,<br />
Austria.<br />
Dr. Wallace E. Tyner, professor at the Department of Agricultural Economics, Purdue University,<br />
West Lafayette (IN), USA.<br />
Dr. Jos van de Vooren is manager of the Latin America O�ce Wageningen University and Research<br />
Centre, the Netherlands, located at University of São Paulo, ESALQ - Escola Superior de Agricultura<br />
‘Luiz de Queiroz’, Piracicaba (SP), Brazil.<br />
Dr. Hans van Meijl, senior researcher at the Agricultural Economics Research Institute of Wageningen<br />
University and Research Centre, �e Hague, the Netherlands.<br />
Dr. Harrij van Velthuizen is a land resources ecologist and specialist in agro-ecological zoning. Since<br />
1995 he has been engaged with the activities of the Land Use Change and Agriculture Program (LUC)<br />
of IIASA - International Institute for Applied Systems Analysis, Laxenburg, Austria..<br />
Dr. Arnaldo Walter, professor at UNICAMP - Universidade Estadual de Campinas, Campinas (SP),<br />
Brazil.<br />
Dr. Peter Zuurbier is direc<strong>to</strong>r of the Latin America O�ce of Wageningen University and Research<br />
Centre, the Netherlands. He is also professor at the University of São Paulo, ESALQ - Escola Superior<br />
de Agricultura ‘Luiz de Queiroz’, Piracicaba (SP), Brazil and at Wageningen University.<br />
252 <strong>Sugarcane</strong> <strong>ethanol</strong>
Keyword index<br />
A<br />
Africa 204, 205, 209, 211<br />
Amazon 41, 42, 51, 64<br />
– biome 73, 86, 88, 92<br />
– ecosystem 73<br />
– rainforest 42, 58<br />
Asia 23, 29, 52, 59, 148, 160, 192, 200,<br />
203, 205, 209, 210, 234<br />
Australia 233<br />
B<br />
bagasse 22, 23, 58, 95, 100, 141, 154, 173,<br />
205<br />
biodiversity 19, 24, 41, 42, 52, 57, 58,<br />
129, 132, 154, 161, 163, 178, 210,<br />
211, 221, 222, 242<br />
bioenergy 26, 54, 142, 151, 163, 178<br />
bio<strong>ethanol</strong> 215, 216, 217<br />
biomass 19, 21, 22, 24, 47, 88, 91, 95,<br />
109, 113, 120, 121, 135, 139, 142,<br />
150, 151, 154, 159, 160, 161, 162,<br />
163, 164, 165, 167, 168, 177<br />
biotechnology 58<br />
Brazil 20, 22, 23, 29, 30, 31, 33, 35, 39,<br />
40, 41, 44, 45, 56, 63, 65, 67, 73, 84,<br />
91, 103, 108, 113, 117, 124, 129,<br />
139, 140, 144, 148, 174, 181, 182,<br />
190, 200, 203, 205, 208, 210, 211,<br />
214, 234, 241<br />
C<br />
carbon<br />
– capture 177, 178<br />
– debts 52<br />
– s<strong>to</strong>cks 102, 104, 106, 121<br />
Caribbean 23, 29, 30, 144, 148, 200, 204,<br />
205<br />
cas<strong>to</strong>r oil 215<br />
cattle 63, 71, 84, 90, 108, 110, 211<br />
Central America 35, 144<br />
Cerrado 42, 46, 56, 63, 73, 84, 88, 103,<br />
123, 211<br />
– biome 65<br />
– ecosystem 52<br />
– region 57<br />
China 21, 23, 29, 36, 139, 166, 169, 175,<br />
205<br />
citrus 83<br />
<strong>climate</strong> <strong>change</strong> 19, 34, 145, 153, 200<br />
– mitigation 19, 221<br />
Colombia 140<br />
consumption<br />
– energy 19<br />
– fuel 20<br />
criteria 25, 132, 146, 155, 163<br />
criticism 12<br />
Cuba 30<br />
D<br />
deforestation 41, 42, 52, 58, 63, 64, 81,<br />
88, 92<br />
developing countries 25, 26, 31, 47, 52,<br />
134, 152, 200, 206, 216, 219, 245<br />
E<br />
emission<br />
– acetaldehyde 206<br />
– carbon monoxide 206<br />
– CO2 19, 96<br />
– hydrocarbons 206<br />
– life-cycle 174<br />
– N2O 173<br />
– noxious 142<br />
– polluting 24<br />
energy 19, 20, 24, 47, 54, 96, 109, 113,<br />
132, 135, 140, 145, 151, 153, 155,<br />
161, 162, 164, 172, 176, 182, 187,<br />
196<br />
–<br />
security 23, 24, 31, 113, 139, 145, 200,<br />
217<br />
<strong>Sugarcane</strong> <strong>ethanol</strong> 253
Keyword index<br />
– solar 11<br />
environment 19<br />
environmental licensing 73<br />
<strong>ethanol</strong><br />
– anhydrous 22, 141<br />
– gasoline 22<br />
– hydrous 22<br />
Europe 234<br />
European Union 148, 172, 181, 190, 192,<br />
218<br />
expansion 31, 33, 34, 40, 41, 47, 56, 57,<br />
63, 65, 73, 78, 84, 92, 108, 210<br />
F<br />
fermentation 11, 21, 23, 96, 127, 140,<br />
142, 160, 164, 167, 168<br />
ferti-irrigation 126<br />
FFVs – See: �ex-fuel vehicles<br />
�ex-fuel vehicles (FFVs) 22, 139, 142,<br />
148, 152<br />
food prices 25, 26, 227, 229, 233, 235,<br />
241<br />
forest 88, 103<br />
– riparian 46<br />
fossil 200, 201, 205, 216, 220<br />
G<br />
generation<br />
– �rst 148, 152, 159, 160, 176, 178, 217,<br />
221<br />
– second 139, 145, 148, 151, 152, 154,<br />
155, 159, 160, 161, 165, 172, 175,<br />
176, 177, 178, 205, 242<br />
GHG – See: greenhouse gas<br />
global impacts 181, 189<br />
greenhouse gas (GHG) 54, 172, 200<br />
– emissions 23, 24, 25, 34, 57, 63, 95,<br />
96, 99, 100, 101, 102, 107, 108, 109,<br />
120, 133, 142, 146, 160, 172, 173,<br />
174, 177, 178, 205, 207, 221<br />
H<br />
hydrolysis 11, 22, 95, 96, 141, 154, 160,<br />
164, 166, 167, 168, 169, 178<br />
I<br />
India 29, 30, 36, 38, 51, 139, 140, 166,<br />
169, 200, 203, 212<br />
indica<strong>to</strong>rs 115, 120, 132, 164<br />
industry<br />
– au<strong>to</strong>motive 24<br />
– biofuel 26, 218<br />
– <strong>ethanol</strong> 23, 24<br />
– gasoline 185<br />
– paper & pulp 169<br />
– sugar 30<br />
– sugarcane 30, 43, 95, 203, 214<br />
intercropping 103<br />
irrigation 38, 51, 124, 208, 212<br />
J<br />
Jatropha 160, 178<br />
K<br />
Kenya 200<br />
L<br />
land allocation 73<br />
land use <strong>change</strong>s (LUC) 45, 54, 63, 64,<br />
65, 66, 68, 84, 91, 92, 107, 113, 121,<br />
123, 173, 195<br />
– direct 63<br />
– indirect 57, 63<br />
Latin America 47, 148, 192, 200<br />
legal framework 116, 117<br />
license<br />
– operation (LO) 73<br />
–<br />
previous (LP) 73<br />
lignocellulosic 22, 95, 139, 154, 160, 164,<br />
167, 178<br />
LUC – See: land use <strong>change</strong>s<br />
254 <strong>Sugarcane</strong> <strong>ethanol</strong>
M<br />
maize 20, 83, 104, 173, 184, 187, 209, 240<br />
Malawi 200, 211<br />
methyl-tertiary-butyl-ether (MTBE) 20,<br />
189<br />
Millennium Development Goals 26, 199,<br />
200, 220<br />
Miscanthus 23<br />
mitigation 95, 96, 100, 102, 109, 153, 207<br />
MTBE – See: methyl-tertiary-butyl-ether<br />
N<br />
natural vegetation 43<br />
Netherlands 218<br />
North America 172, 178, 234<br />
P<br />
Pakistan 38, 200<br />
palm 146, 159, 160, 164, 178, 215<br />
Panicum virgatum 23<br />
pasture 25, 42, 44, 52, 56, 63, 69, 74, 78,<br />
86, 91, 103, 104, 106, 107, 108, 109,<br />
123, 126, 161, 163, 178, 192, 195,<br />
206, 211<br />
– cultivated 42, 57, 104<br />
– degraded 12<br />
– extensive 43<br />
pho<strong>to</strong>synthesis 48, 96<br />
policies 20, 24, 26, 29, 40, 113, 132, 181,<br />
184, 189, 190, 196, 202, 210, 217,<br />
218, 238<br />
Proalcool program 33, 113<br />
productivity 38, 51, 102, 107, 135, 208<br />
Puer<strong>to</strong> Rico 32<br />
R<br />
rain-fed sugarcane 38, 51, 52, 54<br />
rainforest 129, 160<br />
rapeseed 164<br />
residues 22, 43, 139, 152, 161, 178<br />
– forestry 155<br />
Russia 241<br />
Keyword index<br />
S<br />
sacchari�cation 11<br />
satellite images 86, 90, 103<br />
–<br />
analysis 66<br />
savannah 46, 192<br />
small farmers 24, 200, 209, 210, 212, 213,<br />
220<br />
soil 23, 24, 40, 43, 52, 69, 104, 126, 161,<br />
210<br />
sorghum 22, 23, 215<br />
South Africa 212<br />
South America 29, 52<br />
starch 22<br />
sugar beet 22, 159<br />
sustainability 25, 54, 63, 120, 126, 146,<br />
151, 153, 159, 199, 218<br />
Sweden 134, 139<br />
switchgrass 23<br />
Switzerland 134<br />
T<br />
�ailand 140<br />
U<br />
United Kingdom 218<br />
United States of America 20, 26, 139,<br />
148, 181, 190<br />
V<br />
vinasse 43, 58, 126, 211<br />
W<br />
water 43, 58, 124, 128, 132, 146, 154, 161,<br />
201, 208, 211<br />
wheat 22<br />
Z<br />
Zea mays 20<br />
Zimbabwe 200<br />
<strong>Sugarcane</strong> <strong>ethanol</strong> 255