Support Build Plan - Dimension Data
Support Build Plan - Dimension Data
Support Build Plan - Dimension Data

Create successful ePaper yourself
Turn your PDF publications into a flip-book with our unique Google optimized e-Paper software.
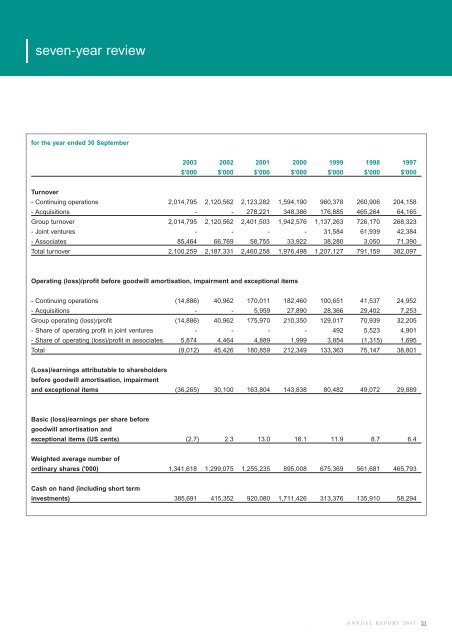
seven-year review<br />
for the year ended 30 September<br />
2003 2002 2001 2000 1999 1998 1997<br />
$'000 $'000 $'000 $'000 $'000 $'000 $'000<br />
Turnover<br />
- Continuing operations 2,014,795 2,120,562 2,123,282 1,594,190 960,378 260,906 204,158<br />
- Acquisitions - - 278,221 348,386 176,885 465,264 64,165<br />
Group turnover 2,014,795 2,120,562 2,401,503 1,942,576 1,137,263 726,170 268,323<br />
- Joint ventures - - - - 31,584 61,939 42,384<br />
- Associates 85,464 66,769 58,755 33,922 38,280 3,050 71,390<br />
Total turnover 2,100,259 2,187,331 2,460,258 1,976,498 1,207,127 791,159 382,097<br />
Operating (loss)/profit before goodwill amortisation, impairment and exceptional items<br />
- Continuing operations (14,886) 40,962 170,011 182,460 100,651 41,537 24,952<br />
- Acquisitions - - 5,959 27,890 28,366 29,402 7,253<br />
Group operating (loss)/profit (14,886) 40,962 175,970 210,350 129,017 70,939 32,205<br />
- Share of operating profit in joint ventures - - - - 492 5,523 4,901<br />
- Share of operating (loss)/profit in associates 5,874 4,464 4,889 1,999 3,854 (1,315) 1,695<br />
Total (9,012) 45,426 180,859 212,349 133,363 75,147 38,801<br />
(Loss)/earnings attributable to shareholders<br />
before goodwill amortisation, impairment<br />
and exceptional items (36,265) 30,100 163,804 143,838 80,482 49,072 29,889<br />
Basic (loss)/earnings per share before<br />
goodwill amortisation and<br />
exceptional items (US cents) (2.7) 2.3 13.0 16.1 11.9 8.7 6.4<br />
Weighted average number of<br />
ordinary shares ('000) 1,341,618 1,299,075 1,255,235 895,008 675,369 561,681 465,793<br />
Cash on hand (including short term<br />
investments) 385,691 415,352 920,080 1,711,426 313,376 135,910 58,294<br />
ANNUAL REPORT 2003 51