Focus - The Dow Chemical Company
Focus - The Dow Chemical Company
Focus - The Dow Chemical Company

You also want an ePaper? Increase the reach of your titles
YUMPU automatically turns print PDFs into web optimized ePapers that Google loves.
<strong>The</strong> <strong>Dow</strong> <strong>Chemical</strong> <strong>Company</strong> 2002 Annual Report
�<strong>The</strong> Way Forward<br />
At <strong>Dow</strong>, we know that the way forward requires us to accelerate and intensify<br />
our efforts to improve our business and maximize both near- and long-term<br />
shareholder value.<br />
This is why we are constantly striving to eliminate waste, reduce costs, improve<br />
productivity, find better ways to do business, create new and improved products<br />
and services, enhance production methods and be more sustainable.<br />
We are also conscious that the actions we take today not only set the foundation<br />
for long-term business success, but also pave the way forward for improving the<br />
daily lives of current and future generations.<br />
<strong>Dow</strong> invites you to explore our 2002 Annual Report to learn more about how we<br />
are leading the way forward.
2002 Financial Highlights<br />
IN MILLIONS, EXCEPT AS NOTED 2002 2001<br />
Net Sales $27,609 $28,075<br />
Earnings before Interest, Income Taxes and Minority Interests (“EBIT”)* 86 35<br />
Net Income (Loss) (338) (385)<br />
Return on Stockholders’ Equity (4.4)% (3.9)%<br />
Earnings (Loss) per Share—Basic (in dollars) (0.37) (0.43)<br />
Earnings (Loss) per Share—Diluted (in dollars) (0.37) (0.43)<br />
Dividends Declared per Share (in dollars) 1.34 1.295<br />
*See page 22 for a reconciliation of EBIT to “Income (Loss) before Income Taxes and Minority Interests.”<br />
Net Sales (dollars in millions)<br />
98 $25,396<br />
99<br />
$26,131<br />
00<br />
$29,798<br />
01<br />
$28,075<br />
02<br />
$27,609<br />
Earnings (Loss) per Share—Diluted (dollars)<br />
98 $1.89<br />
99<br />
$1.82<br />
00<br />
$1.85<br />
01<br />
$(0.43)<br />
02<br />
$(0.37)<br />
2002 Sales by Operating Segment (dollars in millions)<br />
Performance Plastics $7,095<br />
Performance <strong>Chemical</strong>s $5,130<br />
Agricultural Sciences $2,717<br />
Plastics $6,476<br />
<strong>Chemical</strong>s $3,361<br />
Hydrocarbons and Energy $2,435<br />
Unallocated and Other $395<br />
EBIT (dollars in millions)<br />
98 $3,093<br />
99<br />
$3,022<br />
00<br />
$3,105<br />
01<br />
$35<br />
02<br />
$86<br />
Dividends Declared per Share (dollars)<br />
98 $1.16<br />
99<br />
$1.16<br />
00<br />
$1.16<br />
01<br />
$1.295<br />
02<br />
$1.34<br />
2002 Sales by Geographic Area (dollars in millions)<br />
United States $11,259<br />
Europe $9,209<br />
Rest of World $7,141<br />
Results for 2002 included the pretax impact of merger-related expenses and restructuring of $280 million and a pretax charge of $828 million<br />
related to Union Carbide Corporation’s potential asbestos-related liability. Results for 2001 included the impact of a $1.5 billion pretax special<br />
charge for merger-related expenses and restructuring. See Notes B and J to the Consolidated Financial Statements for additional information.<br />
<strong>The</strong> <strong>Dow</strong> <strong>Chemical</strong> <strong>Company</strong> 1 >
To the Stockholders of <strong>The</strong> <strong>Dow</strong> <strong>Chemical</strong> <strong>Company</strong>:<br />
2002 was not a good year for <strong>Dow</strong>. Neither the general economy nor industry fundamentals offered much relief from the difficult conditions we<br />
faced in 2001. Despite expectations that industry conditions would improve in the second half of the year, the economic rebound never materialized,<br />
and lagging demand and excess capacity continued to impede our efforts to adequately raise prices and substantially increase volume. As a result,<br />
profit margins were severely compressed.<br />
Although industry conditions were tough, they are not an excuse for earnings that were, in a word, unacceptable.<br />
Regardless of the conditions we face, the management of this company is being held responsible and accountable for performance. That is why<br />
the Board of Directors decided in December to make a change in executive leadership.<br />
Building our financial strength<br />
In returning as <strong>Dow</strong>’s CEO, my immediate tasks are to raise profit margins, improve cash flow and reduce debt. To do so, we are restructuring,<br />
consolidating and streamlining our company in order to improve our cost structure, reduce capital spending and focus more on our competitive assets<br />
and businesses. All options are on the table. <strong>The</strong> measures we are pursuing in 2003 include:<br />
Bill Stavropoulos,<br />
Chairman, President and CEO<br />
> 2 <strong>The</strong> <strong>Dow</strong> <strong>Chemical</strong> <strong>Company</strong><br />
•Divesting non-strategic and under-performing assets.<br />
• Closing assets that are either under-utilized or non-competitive, including our announcement in January of 2003 to<br />
close two Union Carbide ethylene crackers in Texas that will reduce U.S. Gulf Coast ethylene capacity by roughly 4%.<br />
•Sharply reducing structural costs by $400 million, including cuts in discretionary spending, strict limitations<br />
on new hires, productivity improvements and the elimination of 3,000-4,000 jobs through divestitures, plant<br />
shutdowns, attrition and efficiencies.<br />
• Reducing capital spending by $400 million, or 25%, from 2002, placing capital expenditures well below depreciation<br />
levels. <strong>The</strong> bulk of these spending cuts will come from reduced planned capacity expansions. We will continue<br />
to devote capital to maintaining the reliability and safety of our plants.<br />
• Shifting our successful Six Sigma methodology to cost-reduction projects that have an immediate, positive impact<br />
on earnings, rather than longer term revenue-increasing projects.<br />
• Delaying or canceling all corporate initiatives, except those that positively impact the bottom line in 2003.<br />
• On the revenue side, focusing on our customers and market dynamics to increase prices and improve volume.<br />
Since 1995, <strong>Dow</strong>’s oil and energy costs have increased while prices have fallen, with a negative impact on profits<br />
of nearly $9 billion. We are working closely with our customers to confront the challenge we face, given the<br />
highly volatile cost of feedstocks.<br />
<strong>The</strong>se measures, taken together, are designed to increase cash flow by over a billion dollars from 2002 and generate positive free cash flow in 2003.<br />
Meanwhile, we will continue to pursue our long-term strategy to invest in our franchise businesses—those with long-term competitive advantage—<br />
and in our less cyclical performance businesses. In doing so, we will emphasize productivity, which is the sine qua non of this industry. Ours is a world<br />
of unremitting competitiveness. Trends toward supplier and customer consolidation, high and volatile energy costs, and increased competition from<br />
developing countries continue to challenge the chemical industry. Productivity must and will be a priority for <strong>Dow</strong> not only at the trough of the cycle,<br />
but also at the peak.<br />
On track for long-term profitability<br />
Looking at the long-term, it is important to remember that difficult conditions are not new to the chemical industry. Herbert H. <strong>Dow</strong>, this company’s<br />
founder, encountered them in the early years of the 20th century, as have more recent <strong>Dow</strong> managers in the 1980s and 90s, when deep troughs were<br />
followed by periods of robust profitability.<br />
Our task is to ensure that the company will benefit not just from better conditions, but from the work we are doing right now to improve profitability<br />
regardless of where we are in the cycle. Towards that end, we are building on our accomplishments in 2002; chief among them were:<br />
• Completing the integration of Union Carbide and other key acquisitions, including Ascot fine and specialty chemicals, Rohm and Haas’s agricultural<br />
chemicals business, Gurit-Essex, and EniChem’s polyurethanes business. With Union Carbide alone, we achieved cost synergies of $1.2 billion dollars,<br />
significantly improving the profit margins of Carbide’s businesses and making them globally competitive.<br />
•Growth in Performance <strong>Chemical</strong>s, a $5.1 billion portfolio of businesses that was <strong>Dow</strong>’s most profitable segment in 2002. Specialty businesses from<br />
Carbide not only substantially increased the sales of Performance <strong>Chemical</strong>s, they also increased profits. Performance <strong>Chemical</strong>s is now one of the<br />
top five specialty chemical businesses in the world.
• Continued growth in Asia, where our volume increased by 12% and sales by 7%. This region now accounts for $3.3 billion of our revenues, with performance<br />
businesses comprising over 60%. <strong>The</strong> Union Carbide joint ventures in Kuwait and Malaysia, a source of low-cost feedstocks, are instrumental<br />
to our expansion in Asia. In addition, we started up a latex plant in Zhangjiagang, <strong>The</strong> People’s Republic of China, and our joint venture with Asahi<br />
Kasei began polystyrene production there. In the second quarter of 2003 we expect to start up production of a new epoxy resins plant at the site.<br />
Meanwhile, we continue making progress towards our 2005 goals in Environmental, Health and Safety performance, and here it is worth mentioning<br />
that these ambitious goals represent an improvement of up to 90% from our starting point in 1994. During the year, we reduced our injury and illness<br />
rate by 20%, and leaks, breaks and spills by 14%. Lest we forget what these numbers mean, consider this: since 1994, more than 8000 injuries and<br />
illnesses did not occur as a result of our progress—in other words, <strong>Dow</strong> employees and contractors are safer.<br />
And, in response to the corporate governance lapses that have shaken investor confidence, we are reaffirming and clarifying our code of ethics<br />
and strengthening the oversight of our company.<br />
Managing the asbestos issue<br />
We also took a new look at asbestos issues associated with Union Carbide’s former business activities, with the goal of bringing greater<br />
clarity to investors.<br />
Towards that end, the well-known firm, Analysis, Research & Planning Corporation, with more than 20 years of experience working on major<br />
liability issues, including asbestos, quantified the potential cost of resolving pending and future claims against Carbide. Based on the results of this<br />
analysis, Carbide increased the reserve for its potential asbestos liabilities to $2.2 billion. It also increased the receivable for asbestos-related insurance<br />
recoveries to $1.35 billion.<br />
As a result of this assessment, Carbide—and consequently <strong>Dow</strong>—took a pretax charge to earnings of $828 million in the fourth quarter of 2002.<br />
This action reflects our belief that quantifying the pending and future costs of resolving asbestos claims against Carbide will help alleviate the<br />
uncertainty surrounding asbestos, and help our company realize its full value. Meanwhile, Carbide will continue to press its strong legal position in<br />
litigation. Because the overwhelming majority of Carbide lawsuits involve people who show no symptoms of illness—including some who were never<br />
even exposed to its asbestos products—the defense strategy will be aggressive. We are also joining the efforts of many industries to pursue a<br />
legislative resolution to the asbestos issue, which we believe is gaining momentum.<br />
Driving for better results<br />
Given the realities of geo-political uncertainty, industry overcapacity, and oil priced at more than $30 a barrel in early 2003, we do not expect industry<br />
conditions to substantially improve at least for the first quarter of 2003.<br />
But it is not our intention to simply wait for conditions to get better.<br />
Regardless of conditions, we intend to reach three key objectives in 2003: to improve our earnings, build our financial strength and work safely.<br />
To do so, we are concentrating on the things we can control: discretionary spending, capital expenditures, asset sales, asset shutdowns, customer<br />
focus, price-volume management, and workplace safety.<br />
Our ultimate objective remains what it has always been: to maximize long-term shareholder value. What has changed is our sense of urgency to reach<br />
that goal. I have confidence that the people of <strong>Dow</strong>, whose talent and dedication are second to none in this industry, will do so quickly and decisively.<br />
William S. Stavropoulos<br />
Chairman, President and Chief Executive Officer<br />
February 12, 2003<br />
<strong>The</strong> <strong>Dow</strong> <strong>Chemical</strong> <strong>Company</strong> 3 >
Strong Leadership for Corporate Governance<br />
<strong>The</strong> thirteen men and women who comprise <strong>Dow</strong>’s Board of<br />
Directors have distinguished themselves as pre-eminent leaders<br />
in a broad array of disciplines: business, government, science,<br />
technology, engineering, accounting, finance, and academia.<br />
Individually, each is clearly an asset to the <strong>Company</strong>. Collectively,<br />
they fulfill an increasingly important role in <strong>Dow</strong>’s corporate<br />
governance practices. <strong>Dow</strong>’s Board Committee on Directors<br />
and Governance, in recommending this particular combination<br />
of people, sought the optimum balance of critical skills, knowledge<br />
of the <strong>Company</strong> and industry, and outside perspective.<br />
Recent corporate governance lapses and the loss of investor<br />
confidence in the stock markets, combined with new rules<br />
approved by the U.S. Congress, Securities and Exchange<br />
Commission and the stock exchanges, have elevated the visibility<br />
of corporate governance in every industry. In this environment,<br />
<strong>Dow</strong>’s Board and management continue to make critical business<br />
decisions with due deliberation, keeping their responsibilities<br />
to <strong>Dow</strong> stockholders in the forefront.<br />
<strong>The</strong> role of the Board<br />
<strong>The</strong> role of a board of directors is to oversee its company’s<br />
strategy and business plan, enhance the long-term value of the<br />
company in the best interests of its stockholders, and reinforce<br />
the highest standards of ethics and integrity. Many of the responsibilities<br />
of <strong>Dow</strong>’s Board are reflected in the <strong>Company</strong>’s corporate<br />
governance documents, such as the Certificate of Incorporation,<br />
Bylaws, Board Committee charters, and other policy documents<br />
(see <strong>Dow</strong>’s Corporate Governance page on www.dow.com).<br />
Such responsibilities include: selection and evaluation of the<br />
CEO; setting executive compensation; determination of key<br />
corporate policies; approval of major <strong>Company</strong> initiatives; advice<br />
and counsel to management; and oversight of the <strong>Company</strong>’s<br />
compliance with financial, legal, and regulatory requirements.<br />
<strong>The</strong> ability to think and act independently is a factor in Board<br />
performance, since the Board provides checks and balances to<br />
management activities. More than two-thirds of <strong>Dow</strong>’s Board<br />
are non-employee Directors. Both formal and informal executive<br />
sessions (meetings without <strong>Company</strong> management present)<br />
have been a part of <strong>Dow</strong>’s Board practices since the late 1980s.<br />
Historically, <strong>Dow</strong>’s norm has been separation of the Chairman<br />
and CEO positions, with a non-executive Chairman. However,<br />
with Chairman William S. Stavropoulos now also serving as<br />
the CEO, the Board created the position of Presiding Director.<br />
Among other responsibilities, the Presiding Director leads executive<br />
sessions of the Board, works with the Chairman to set<br />
the Board agenda (which determines the Board’s activities)<br />
and determines what internal and external information and<br />
resources are necessary for the Directors to perform their jobs.<br />
> 4 <strong>The</strong> <strong>Dow</strong> <strong>Chemical</strong> <strong>Company</strong><br />
Dr. Harold T. Shapiro, President Emeritus and Professor of<br />
Economics and Public Affairs at Princeton University, a <strong>Dow</strong><br />
director since 1985, was elected by the non-employee Directors<br />
as the <strong>Company</strong>’s first Presiding Director.<br />
Another <strong>Dow</strong> Director recognized for her strong credentials is<br />
Barbara Hackman Franklin, President and CEO of Barbara Franklin<br />
Enterprises, and former U.S. Secretary of Commerce, who chairs<br />
<strong>Dow</strong>’s Audit Committee. <strong>The</strong> Audit Committee retains the<br />
<strong>Company</strong>’s independent auditing firm, oversees its performance,<br />
and pre-approves all the services the auditing firm provides to<br />
<strong>Dow</strong>. In addition to other significant responsibilities set forth in<br />
the Audit Committee’s charter, this committee, composed<br />
entirely of independent directors and with multiple members<br />
meeting the new financial expertise standards, monitors the federally<br />
mandated certification of financial statements by the CEO<br />
and CFO. An internal disclosure committee ensures appropriate<br />
disclosure and integrity in that process. <strong>Dow</strong>’s Audit Committee<br />
is often cited for pioneering best practices in governance.<br />
In addition to Board Committees formed to address traditional<br />
committee functions (Audit, Compensation, and the Committee<br />
on Directors and Governance), <strong>Dow</strong> also has standing committees<br />
to focus on Finance; Environment, Health & Safety; and<br />
Public Interest, reflecting the interests and concerns of the<br />
<strong>Company</strong>’s diverse stakeholders.<br />
Other long-standing, sound Board practices include:<br />
•A mandatory retirement policy requiring that Directors not be<br />
re-nominated after reaching age 70 (but allowing completion of<br />
any term to which they have been elected by stockholders);<br />
•Periodic visits to <strong>Dow</strong> sites to give Directors the opportunity<br />
to learn firsthand about the various businesses and to interact<br />
with <strong>Dow</strong> employees;<br />
•Executive sessions before and during every Board meeting,<br />
at each Audit Committee meeting, and at other times,<br />
as appropriate;<br />
•A requirement that each Director hold a requisite amount of<br />
<strong>Dow</strong> stock; and<br />
•Non-employee Director compensation programs designed so<br />
that a significant amount of fees are paid in the form of <strong>Dow</strong><br />
stock or stock equivalents. Employee Directors receive no<br />
fees for Board service.<br />
More information about <strong>Dow</strong>’s Board of Directors and corporate<br />
governance may be found on the corporate governance<br />
website at www.dow.com.
Board of Directors at March 1, 2003<br />
Arnold A. Allemang<br />
Executive Vice President<br />
Director since 1996<br />
Jacqueline K. Barton<br />
Arthur and Marian Hanisch Memorial Professor<br />
of Chemistry, California Institute of Technology<br />
Director since 1993<br />
Anthony J. Carbone<br />
Vice Chairman of the Board and Senior Consultant<br />
Director since 1995<br />
J. Michael Cook<br />
Retired Chairman/CEO of Deloitte & Touche LLP<br />
Director since 2000<br />
John C. Danforth<br />
Partner, Bryan Cave LLP and Former U.S. Senator<br />
Director since 1996<br />
Willie D. Davis<br />
President and Chief Executive Officer,<br />
All Pro Broadcasting, Inc.<br />
Director since 1988<br />
Barbara Hackman Franklin<br />
President and Chief Executive Officer,<br />
Barbara Franklin Enterprises and<br />
Former U.S. Secretary of Commerce<br />
Director 1980-92 and 1993 to date<br />
Committees of the Board of Directors<br />
Audit Committee<br />
B.H. Franklin, Chairman<br />
J.C. Danforth<br />
J.M. Ringler<br />
H.T. Shapiro<br />
P.G. Stern<br />
Compensation Committee<br />
H.T. Shapiro, Chairman<br />
J. K. Barton<br />
J.M. Cook<br />
W.D. Davis<br />
B.H. Franklin<br />
P.G. Stern<br />
Committee on Directors and Governance<br />
W.D. Davis, Chairman<br />
J.K. Barton<br />
H.T. Shapiro<br />
P.G. Stern<br />
Environment, Health & Safety Committee<br />
A.J. Carbone, Chairman<br />
A.A. Allemang<br />
J.K. Barton<br />
P.G. Stern<br />
R.M. Gross, ex officio<br />
R.L. Manetta, ex officio<br />
F. Ruiz, ex officio<br />
S.L. Smolik, ex officio<br />
L.J. Washington, Jr., ex officio<br />
Keith R. McKennon<br />
Former Chairman and CEO of PacifiCorp<br />
Director 1983-1992 and 2003 to date<br />
J. Pedro Reinhard<br />
Executive Vice President and Chief<br />
Financial Officer<br />
Director since 1995<br />
James M. Ringler<br />
Vice Chairman of the Board, Illinois<br />
Tool Works, Inc.<br />
Director since 2001<br />
Harold T. Shapiro<br />
Presiding Director<br />
President Emeritus and Professor<br />
of Economics and Public Affairs,<br />
Princeton University<br />
Director since 1985<br />
William S. Stavropoulos<br />
Chairman of the Board, President and<br />
Chief Executive Officer<br />
Director since 1990<br />
Paul G. Stern<br />
Partner, Thayer Capital Partners<br />
and Arlington Capital Partners<br />
Director since 1992<br />
Executive Committee<br />
W.S. Stavropoulos, Chairman<br />
A.A. Allemang<br />
J.P. Reinhard<br />
Finance Committee<br />
J.P. Reinhard, Chairman<br />
A.J. Carbone<br />
J.M. Cook<br />
W.S. Stavropoulos<br />
F.H. Brod, ex officio<br />
K.C. Fothergill, ex officio<br />
C.J. Hahn, ex officio<br />
F. Ruiz, ex officio<br />
Public Interest Committee<br />
J.C. Danforth, Chairman<br />
J.M. Cook<br />
W.D. Davis<br />
B.H. Franklin<br />
K.R. McKennon<br />
J.P. Reinhard<br />
J.M. Ringler<br />
H.T. Shapiro<br />
W.S. Stavropoulos<br />
R.W. Charlton, ex officio<br />
T.S. Van Dam, ex officio<br />
L.J. Washington, Jr., ex officio<br />
Arnold A. Allemang Jacqueline K. Barton<br />
Anthony J. Carbone J. Michael Cook<br />
John C. Danforth Willie D. Davis<br />
Barbara H. Franklin Keith R. McKennon<br />
J. Pedro Reinhard James M. Ringler<br />
Harold T. Shapiro William S. Stavropoulos<br />
Paul G. Stern<br />
<strong>The</strong> <strong>Dow</strong> <strong>Chemical</strong> <strong>Company</strong> 5 >
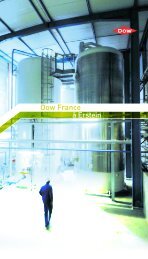
Amerchol provides functional ingredients that improve<br />
the performance of shampoos, facial cleansers and body<br />
washes by providing enhanced conditioning properties<br />
to hair and skin.<br />
Al
At <strong>Dow</strong>, we continue to shape, simplify and align our portfolio to ensure that our businesses<br />
set the competitive standard in each of the regions and market segments we serve.<br />
Delivering long-term value to our<br />
stakeholders requires us to continually<br />
align and balance our global business<br />
portfolio. <strong>Dow</strong> is focused on moving<br />
beyond the integration of recent mergers<br />
and acquisitions to ensure that our<br />
organization is ideally suited to serve<br />
our target market segments, which<br />
range from water purification and food,<br />
to transportation and building maintenance<br />
and construction.<br />
We continue to focus on ensuring that<br />
our portfolio is strategically positioned,<br />
with the right resources in the right<br />
places. This helps us to best meet the<br />
needs of the marketplace and to deliver<br />
value to our customers. For example,<br />
with the integration of Union Carbide’s<br />
Amerchol subsidiary, <strong>Dow</strong> is now a leading<br />
supplier of performance specialties to<br />
the $120 billion personal care industry on<br />
a global basis, providing key functional<br />
ingredients for products like conditioning<br />
shampoos and body washes.<br />
We are committed to being a leader<br />
and to setting the competitive standard<br />
with both global and local customers.<br />
With resources on the ground in all major<br />
geographic regions, our business structure<br />
allows us to capitalize on the efficiencies<br />
of our manufacturing capabilities while<br />
still being able to quickly respond to rapidly<br />
changing marketplace dynamics.<br />
In addition, we are pursuing opportunities<br />
to better capture value within<br />
growing market segments. One such<br />
effort is the recent introduction of the<br />
<strong>Dow</strong>pharma business, which supplies<br />
a broad range of technology and manufacturing<br />
services to pharmaceutical<br />
companies, thereby improving the next<br />
generation of life-saving medicines. By<br />
capitalizing on <strong>Dow</strong>’s history of producing<br />
pharmaceuticals, and combining the<br />
recent acquisition of Ascot Plc with <strong>Dow</strong>’s<br />
historical strengths in manufacturing and<br />
R&D, this new business positions <strong>Dow</strong><br />
as a leader in this rapidly growing $8 billion<br />
sector of the pharmaceutical industry.<br />
igned<br />
<strong>Dow</strong>’s engineering plastics business<br />
recently created two market-facing business<br />
groups to better meet the needs of<br />
customers in the fast-growing information<br />
technology equipment and appliance<br />
market segments. <strong>The</strong> new alignment is<br />
helping the business enhance customer<br />
loyalty through a better understanding<br />
of each segment’s business dynamics,<br />
including market drivers, industry trends,<br />
product and service needs, and demands<br />
from end users.<br />
Our strategic global portfolio effectively<br />
extends our global reach further<br />
than ever. This allows <strong>Dow</strong> to continue<br />
to responsibly expand our presence and<br />
enhance our responsiveness in rapidly<br />
developing markets. In Southeast Asia,<br />
for example, <strong>Dow</strong> and the OPTIMAL<br />
Group of Companies—affiliates of <strong>Dow</strong><br />
and PETRONAS, the national oil and gas<br />
company of Malaysia—recently completed<br />
construction and start-up of a world-scale,<br />
fully integrated petrochemical facility with<br />
state-of-the-art technology and products.<br />
<strong>The</strong> <strong>Dow</strong> <strong>Chemical</strong> <strong>Company</strong> 7 >
8 <strong>The</strong> <strong>Dow</strong> <strong>Chemical</strong> <strong>Company</strong><br />
<strong>Dow</strong> XLA elastic fibers offer consumers new “comfort stretch” in apparel<br />
<strong>Focus</strong><br />
while providing <strong>Dow</strong>’s customers with improved processing efficiencies<br />
over incumbent elastics at the yarn covering and textile weaving stages.
<strong>The</strong> key to <strong>Dow</strong>’s success is being highly focused on the needs of our customers and the<br />
ultimate end user. This helps ensure that the technologies in our labs today become<br />
the “real world” successes of tomorrow, delivering value to <strong>Dow</strong> and our stakeholders.<br />
Working hand-in-hand with our<br />
customers, <strong>Dow</strong> has helped discover,<br />
develop and bring to market high-value<br />
solutions to many marketplace challenges.<br />
<strong>Dow</strong>’s actions range from helping<br />
customers overcome technical issues<br />
and meet industry goals, to improving<br />
established materials and even developing<br />
new and exciting consumer products.<br />
An excellent example is <strong>Dow</strong><br />
Automotive, which works with automakers<br />
and their suppliers to translate scientific<br />
innovation into products and systems<br />
that enable the industry to meet its goals.<br />
Betafoam polyurethane foam from <strong>Dow</strong><br />
Automotive provides a safer and quieter<br />
ride in the 2003 Cadillac CTS from<br />
General Motors. <strong>The</strong> automaker uses the<br />
product in the vehicle’s frame to provide<br />
the necessary structural enhancement<br />
for compliance with stringent front and<br />
offset crash safety requirements. Another<br />
Betafoam product is used in the body of<br />
the luxury car to seal the vehicle and<br />
eliminate wind and road noise.<br />
ed<br />
A constant focus on customers has<br />
also made our Emulsion Polymers business<br />
a leading supplier to carpet, paper<br />
and paperboard manufacturers for more<br />
than 50 years. <strong>The</strong> Emulsion Polymers<br />
business invests in state-of-the-art testing<br />
facilities around the globe where <strong>Dow</strong><br />
technical experts conduct a wide range<br />
of innovative research. This allows <strong>Dow</strong><br />
to offer customized solutions that meet<br />
specific customer needs. <strong>The</strong> strong<br />
customer positions the business enjoys<br />
are indicative of <strong>Dow</strong>’s commitment to<br />
quality products and value-added services.<br />
Additionally, in response to growing<br />
demand in the carpet industry for sustainable<br />
products, <strong>Dow</strong> Polyurethanes<br />
introduced Biobalance polymers. This new<br />
soybean-based technology replaces a<br />
portion of the petroleum-based material<br />
required to make polyurethane carpet<br />
backings. This breakthrough technology<br />
addresses industry needs while supporting<br />
the agricultural community.<br />
In 2002, <strong>Dow</strong> launched a new business<br />
offering, BioAqueous solubilization<br />
services, which leverages unique <strong>Dow</strong><br />
technology and advanced pharmaceutical<br />
process expertise to enhance the ability<br />
of drugs to rapidly dissolve in the body.<br />
<strong>Dow</strong> works directly with major pharmaceutical<br />
manufacturers to create more<br />
effective medicines, which are highly<br />
sought after by doctors and patients. We<br />
also use biotechnology processes to manufacture<br />
new drugs and vaccines for pharmaceutical<br />
companies, and we’re making<br />
strides toward capitalizing on the promises<br />
of plant-based biopharmaceuticals.<br />
Our intense focus on customers and<br />
end users is the reason why many of the<br />
world’s most successful companies, such<br />
as Procter & Gamble (P&G), choose <strong>Dow</strong><br />
as their leading supplier for a wide range<br />
of products and services—from packaging<br />
resins and functional ingredients, to custom<br />
processing and supply chain services.<br />
<strong>Dow</strong> and P&G maintain cross-functional<br />
teams who work together to find synergies<br />
and deliver value to both companies.<br />
A joint packaging steering team, for<br />
example, takes advantage of <strong>Dow</strong>’s core<br />
competence in plastic packaging to<br />
improve P&G’s consumer purchase and<br />
usage experience. <strong>The</strong> result is a positive<br />
bottom-line impact for both companies.<br />
<strong>The</strong> <strong>Dow</strong> <strong>Chemical</strong> <strong>Company</strong> 9 >
10 <strong>The</strong> <strong>Dow</strong> <strong>Chemical</strong> <strong>Company</strong><br />
Using Six Sigma methodology, <strong>Dow</strong><br />
worked with a rail carrier to reduce<br />
delivery time from 4.4 days to 1.1 days.<br />
Six months after implementation of this<br />
project, <strong>Dow</strong> has already reduced its<br />
inventory by an estimated $1.7 million.<br />
Disci
A steadfast and disciplined approach to business success is the<br />
driving force that allows us to improve our productivity and retain<br />
our position as the industry’s lowest-cost global supplier.<br />
From empowering our<br />
employees to finding even<br />
<strong>Dow</strong>’s marketplace, as well as improving<br />
more efficient ways to operate<br />
organizational and supplier interface<br />
our manufacturing plants and<br />
efficiency. One tool, online auctions,<br />
work with suppliers, <strong>Dow</strong> takes then share that information within and is already allowing <strong>Dow</strong> to conduct<br />
a decisive and disciplined approach between businesses, regions and func- increasingly efficient and effective sup-<br />
to business.<br />
tions to capitalize on knowledge, expertise plier negotiations for purchases such as<br />
Our intolerance for variation and and purchasing power company-wide the printing of this <strong>Dow</strong> Annual Report.<br />
defects is evidenced by a continued and improve <strong>Dow</strong>’s competitive advan- We are also dedicated to maintaining<br />
commitment to Six Sigma, which plays tage. For example, effective sharing of the highest safety levels in our opera-<br />
a major role in our decision making and MET, as externally benchmarked on tions, so we can continue to make<br />
management processes. During the past capital projects, has resulted in an 18 progress toward our vision of an incident-<br />
three years, Six Sigma has become an percent lower capital cost for <strong>Dow</strong> on free workplace for employees and con-<br />
integral part of <strong>Dow</strong>’s operations, deliv- those projects, relative to the chemical tractors. Our overall safety performance<br />
ering strong successes and measurable industry average.<br />
reached an historical best for <strong>Dow</strong> in<br />
cost reductions, the value of which will Our disciplined approach to opera- 2002, with an Injury and Illness Rate now<br />
become more visible as market conditions has made <strong>Dow</strong> a key contributor 73% better than our 1994 performance.<br />
tions improve. Six Sigma is also proving to the industry’s impressive track record Our safety discipline extends throughout<br />
to be a valuable tool for <strong>Dow</strong>’s cus- of improving energy efficiency. After the world, as we help integrate our safety<br />
tomers by delivering cost, time and reducing the amount of energy used per programs into developing regions. In<br />
resource savings.<br />
pound of product produced by 20 percent 2002, for example, <strong>Dow</strong> completed<br />
<strong>Dow</strong> also documents practices, in the early 1990s, we remain on track construction and start-up of world-scale<br />
equipment and systems that are consid- to achieve our goal of further reductions polystyrene and emulsion polymers plants<br />
ered best-in-class with a tool called of 2 percent per year through 2005. in Zhangjiagang, <strong>The</strong> People’s Republic<br />
Most Effective Technology (MET). We Taking full advantage of its global<br />
organization and information systems<br />
infrastructure, <strong>Dow</strong> is also leading efforts<br />
to gain competitive advantage through<br />
the use of eProcurement tools. When<br />
fully implemented, eProcurement will<br />
deliver significant value by increasing<br />
of China, without any safety incidents.<br />
plined<br />
<strong>The</strong> <strong>Dow</strong> <strong>Chemical</strong> <strong>Company</strong> 11 >
We are committed to delivering long-term value for our<br />
stockholders, employees, communities and society.<br />
At <strong>Dow</strong>, we understand and embrace<br />
the need to be a responsible corporate<br />
citizen. We are committed to the principles<br />
of sustainable development and the Triple<br />
Bottom Line business model of economic<br />
prosperity, environmental stewardship and<br />
social responsibility. We continue to make<br />
tremendous progress, and our results are<br />
reported via the <strong>Dow</strong> Global Public Report<br />
(http://www.dowpublicreport.com).<br />
We remain dedicated to improving the<br />
quality of life in the communities where<br />
we operate and throughout society in<br />
general. From our leading environmental<br />
health and safety practices and the development<br />
of sustainable technologies, to<br />
our dedication to corporate contributions<br />
and volunteerism, we aspire to earn the<br />
satisfaction and support of this key<br />
stakeholder group.<br />
<strong>Dow</strong> actively explores ways to reduce<br />
our overall environmental impact and<br />
improve manufacturing efficiencies. Our<br />
focus on recycling chlorine demonstrates<br />
that the two goals can go hand-in-hand.<br />
In 2005, we expect to have increased our<br />
recovery and reuse of chlorine by 1.3 billion<br />
pounds from 1995—the equivalent<br />
of two world-scale plants. We have also<br />
reduced the amount of flaring—the controlled<br />
combustion of process gases—<br />
at our hydrocarbons facilities by 20 percent<br />
since 1998, and remain committed<br />
to further reductions. Although flaring is<br />
an important safety practice, the noise,<br />
smoke, heat and light it produces impact<br />
community residents; and burning valuable<br />
products has a negative impact on <strong>Dow</strong>’s<br />
bottom line.<br />
Our commitment to ethical business<br />
practices is a critical element of our<br />
accountability to stakeholders. <strong>Dow</strong>’s<br />
Board of Directors plays an important role<br />
in <strong>Dow</strong>’s corporate governance practices<br />
(see pages 4-5). Additionally, high ethical<br />
standards are built into company culture,<br />
as employees operate around the world<br />
according to an established <strong>Dow</strong> Code<br />
of Business Conduct. <strong>The</strong> <strong>Company</strong>’s<br />
Finance employees specifically are<br />
required to adhere to a Financial Code of<br />
Ethics, and standardized global financial<br />
work processes help ensure integrity and<br />
timeliness in our financial statements.<br />
Operating under the auspices of the<br />
Audit Committee of <strong>Dow</strong>’s Board, a highly<br />
experienced internal auditing function<br />
exists to<br />
evaluate the<br />
adequacy of financial<br />
and operating controls for<br />
<strong>Dow</strong>’s global operations. <strong>Dow</strong>’s<br />
Office of Global Ethics and Compliance<br />
provides employees with guidelines for<br />
ethical conduct and a means of reporting<br />
potential violations, as well as implementing<br />
global training programs.<br />
We recognize that our greatest<br />
competitive advantage is <strong>Dow</strong>’s 50,000<br />
employees. <strong>The</strong>refore, we are committed<br />
to maintaining their satisfaction. Our comprehensive<br />
People Strategy addresses<br />
<strong>Dow</strong>’s ability to attract and retain outstanding<br />
professionals, provide them<br />
with continuous learning, encourage<br />
performance excellence, achieve diversity<br />
and develop leaders at all levels.<br />
> 12 <strong>The</strong> <strong>Dow</strong> <strong>Chemical</strong> <strong>Company</strong> Com
<strong>Dow</strong> is working to conserve water at its manufacturing<br />
locations around the world, providing<br />
a sustainable competitive advantage at these<br />
sites. In Terneuzen, <strong>The</strong> Netherlands, <strong>Dow</strong> now<br />
recycles 80 percent of the site’s treated fresh<br />
wastewater, resulting in an annual cost savings<br />
of $1.2 million. <strong>Dow</strong> is also experiencing a 90<br />
percent energy gain by producing boilerfeed<br />
water from seawater. At Texas Operations, <strong>Dow</strong><br />
concluded a freshwater consumption reduction<br />
project which will generate $1 million in savings<br />
annually and will reduce water usage by more<br />
than 40 percent.<br />
mitted
Year in Review<br />
First Quarter<br />
• <strong>Dow</strong> declares 362nd consecutive<br />
cash dividend.<br />
•<strong>Dow</strong> Custom & Fine <strong>Chemical</strong>s<br />
global business unit forms two<br />
contract services businesses,<br />
<strong>Dow</strong>pharma and <strong>Dow</strong> Haltermann<br />
Custom Processing, to focus<br />
on the needs of customers in<br />
pharmaceutical, biopharmaceutical,<br />
and custom and fine<br />
chemicals industries.<br />
• <strong>The</strong> U.S. Environmental Protection<br />
Agency awards “Stratospheric<br />
Ozone Protection Awards” to<br />
<strong>Dow</strong> AgroSciences LLC for the<br />
development of alternatives to<br />
methyl bromide, a widely used<br />
agricultural and structural fumigant.<br />
• Cargill <strong>Dow</strong> Polymers LLC, a joint<br />
venture of Cargill Incorporated<br />
and <strong>Dow</strong>, begins operation of<br />
its first world-scale polylactide<br />
manufacturing plant in Nebraska<br />
to turn corn into commercialgrade<br />
plastic.<br />
> 14 <strong>The</strong> <strong>Dow</strong> <strong>Chemical</strong> <strong>Company</strong><br />
Second Quarter<br />
• <strong>Dow</strong> declares 363rd consecutive<br />
cash dividend.<br />
• <strong>Dow</strong> holds 105th Annual Meeting<br />
of Stockholders.<br />
•<strong>Dow</strong> and Sumitomo sign joint<br />
development agreement to<br />
enhance run-flat tire PAX<br />
System technology.<br />
• <strong>Dow</strong> receives “Sustained<br />
Excellence Award” from American<br />
Chemistry Council for demonstrating<br />
excellent safety records<br />
over three-year period.<br />
•U.S. President George W. Bush<br />
presents <strong>The</strong> National Medal of<br />
Technology to <strong>Dow</strong> for leadership<br />
in science and technology, for<br />
the vision to create great science<br />
and innovative technology in the<br />
chemical industry, and for the<br />
positive impact that commercialization<br />
of this technology has<br />
had on society.<br />
• <strong>Dow</strong> spearheads the formation<br />
of a chemical industry forum to<br />
develop a sector-wide cybersecurity<br />
strategy, contributing to<br />
the U.S. government’s National<br />
Strategy to Secure Cyberspace.<br />
• <strong>Dow</strong> AgroSciences receives full<br />
food and feed approval from<br />
Japanese regulatory agencies for<br />
Herculex I Insect Protection, a<br />
genetically-engineered trait that<br />
provides resistance to European<br />
corn borer, black cut worm, and<br />
other insects in corn.<br />
Third Quarter<br />
•Allan D. Gilmour elects to retire<br />
from <strong>Dow</strong> Board of Directors.<br />
•<strong>Dow</strong> and BASF announce plans to<br />
join in the development of technology<br />
for the manufacture of<br />
propylene oxide, utilizing hydrogen<br />
peroxide as a key raw material.<br />
•<strong>Dow</strong> earns “R&D 100 Award”<br />
from R&D Magazine for Quash<br />
sound management foam.<br />
•<strong>Dow</strong> receives third consecutive<br />
“CIO 100” award for exemplary<br />
business integration.<br />
• <strong>Dow</strong> announces that beginning<br />
in the first quarter of 2003, it will<br />
expense stock options granted<br />
to employees.<br />
• <strong>Dow</strong> declares 364th consecutive<br />
cash dividend.<br />
•<strong>Dow</strong> Europe GmbH announces<br />
intention to build a second<br />
world-scale PET production<br />
train at its integrated Buna Sow<br />
Leuna Olefinverbund site in<br />
Schkopau, Germany.<br />
• 2002 <strong>Dow</strong> Jones Sustainability<br />
Group Index includes <strong>Dow</strong> for<br />
fourth consecutive year.<br />
•<strong>Dow</strong> Fiber Solutions, a new business<br />
within the global Polyolefins<br />
and Elastomers portfolio of <strong>Dow</strong>,<br />
introduces <strong>Dow</strong> XLA elastic fiber<br />
to the global textile marketplace.<br />
Fourth Quarter<br />
• <strong>Dow</strong> Automotive dedicates new<br />
state-of-the-art production facility<br />
within Ford Motor <strong>Company</strong>’s<br />
newest manufacturing site in<br />
Brazil, providing “pellet-to-part”<br />
manufacturing for more than 20<br />
parts on the Ford Fiesta, as well<br />
as ongoing technical development,<br />
R&D, manufacturing and<br />
production expertise.<br />
• <strong>Dow</strong> Plant-Based<br />
Biopharmaceuticals acquires<br />
global, exclusive assignment<br />
of patents involving significant<br />
technology for enabling the<br />
production of mammalian-like<br />
glycans in plants.<br />
•<strong>Dow</strong> releases its Global Public<br />
Report, highlighting company<br />
progress on sustainability goals.<br />
• <strong>Dow</strong> and the OPTIMAL Group<br />
of Companies—affiliates of <strong>Dow</strong><br />
and PETRONAS, the national oil<br />
and gas company of Malaysia—<br />
announce the start-up of all units.<br />
<strong>The</strong> facility includes a cracker to<br />
manufacture ethylene and propylene,<br />
and various production units<br />
for downstream products in the<br />
<strong>Chemical</strong>s and Performance<br />
<strong>Chemical</strong>s segments.<br />
• <strong>Dow</strong> Emulsion Polymers and<br />
Metso Paper sign cooperation<br />
agreement to develop and bring<br />
to market a new paper- and<br />
board-coating process.<br />
•<strong>Dow</strong>pharma business<br />
announces plans for commercial<br />
production capabilities for oligonucleotides,<br />
which are segments<br />
of chemically synthesized DNA<br />
used in pharmaceuticals.<br />
•Emulsion Polymers business<br />
inaugurates styrene-butadiene<br />
latex plant in Zhangjiagang,<br />
<strong>The</strong> People’s Republic of China.<br />
•<strong>Dow</strong> receives Modern Plastics<br />
magazine’s “2002 Humanitarian<br />
Award” for its involvement in<br />
many charitable programs around<br />
the world.<br />
•<strong>Dow</strong> and Asahi Kasei polystyrene<br />
joint venture starts production at<br />
Zhangjiagang, <strong>The</strong> People’s<br />
Republic of China.<br />
•<strong>Dow</strong> announces 365th consecutive<br />
cash dividend.<br />
•<strong>Dow</strong> board of directors elects<br />
William S. Stavropoulos as president<br />
and chief executive officer,<br />
succeeding Michael D. Parker.
Living. Improved daily.<br />
Corporate Social Responsibility Highlights<br />
Committed to the principles of sustainable development, <strong>Dow</strong> strives to make our communities, and society in general, a<br />
better place—not only through our science and technology, but also through corporate social responsibility. <strong>The</strong> examples<br />
highlighted below are representative of the hundreds of humanitarian efforts in which <strong>Dow</strong> participated throughout the<br />
world in 2002. For a broader explanation of company progress on <strong>Dow</strong>’s sustainability goals, see the <strong>Dow</strong> Global Public<br />
Report (http://www.dowpublicreport.com).<br />
� <strong>Dow</strong> continued to support Habitat for Humanity, its flagship global humanitarian effort.<br />
<strong>Dow</strong> executives, employees and customers participated in home builds around the<br />
world—including a 100-home ”blitz-build” in Durban, South Africa, alongside former<br />
U.S. President and Nobel Peace Prize recipient Jimmy Carter. <strong>Dow</strong> also continued to<br />
donate Styrofoam extruded polystyrene insulation for every Habitat home built in<br />
North America, as well as providing financial assistance for house sponsorships.<br />
� Working with local non-governmental organizations, <strong>Dow</strong> helped develop a program<br />
to introduce oyster cultivation as an alternative source of income in Caboto, Brazil,<br />
where residents had previously used explosives to draw oysters out of the water.<br />
Cultivating the oysters in captivity provides a viable alternative that has a substantially<br />
higher growth rate and doesn’t harm the environment. This award-winning project<br />
should become self-sufficient during its second year.<br />
� <strong>Dow</strong> expanded its 16-year commitment to <strong>The</strong> Ocean Conservancy’s International<br />
Coastal Cleanup (ICC). Approximately 350 <strong>Dow</strong> executives, customers, employees<br />
and family members removed trash from the beaches and waterways along the Texas<br />
coast. In addition, <strong>Dow</strong> made a substantial financial contribution to the ICC and<br />
donated polyethylene resin that was converted into 300,000 bags that were used at<br />
local cleanup sites around the United States.<br />
� In China, <strong>Dow</strong> supported “Hand in Hand, Building an Earth Village,” which promotes<br />
environmental education and recycling among school children, and raises funds for<br />
schools and libraries in poor communities. By 2002, <strong>Dow</strong> had helped nearly 300 elementary<br />
and high schools set up recycling banks, environmental education libraries and<br />
bulletin boards in Beijing, Shanghai and Zhangjiagang. In all, more than 1,000 schools<br />
became involved, and the funds raised through recycling paid for the construction of<br />
six primary schools in the Jianxi province and other poverty areas in China.<br />
� Through cash and product donations, <strong>Dow</strong> helped several cities in Central Europe<br />
recover from the devastating floods that occurred during the summer of 2002. In<br />
Prague, Czech Republic, <strong>Dow</strong> helped rebuild an elementary school/nursery by donating<br />
money for the purchase of plaster and supplying Styrofoam extruded polystyrene insulation<br />
from <strong>Dow</strong>’s production facility in Hungary. In Germany, <strong>Dow</strong> donated funds to<br />
help rebuild a children’s center, and supplied more than 4,300 cubic meters of Styrofoam<br />
extruded polystyrene insulation for flood repairs in Saxony and Saxony-Anhalt.<br />
<strong>The</strong> <strong>Dow</strong> <strong>Chemical</strong> <strong>Company</strong> 15 >
Corporate Profile<br />
<strong>Dow</strong> is a leading science and technology company that provides innovative chemical, plastic and agricultural products and<br />
services to many essential consumer markets. In 2002, <strong>Dow</strong> had annual sales of approximately $28 billion and employed<br />
approximately 50,000 people. <strong>The</strong> <strong>Company</strong> serves customers in 175 countries and a wide range of markets that are vital<br />
to human progress, including food, transportation, health and medicine, personal and home care, and building and construction,<br />
among others. <strong>The</strong> <strong>Company</strong> has 191 manufacturing sites in 38 countries and supplies more than 3,400 products<br />
grouped within the operating segments listed on the following pages. <strong>The</strong> Corporate Profile is an integral part of Note T to<br />
the Financial Statements.<br />
Performance Plastics<br />
APPLICATIONS:<br />
• automotive interiors, exteriors, chassis/powertrain and body<br />
engineered systems • building and construction, thermal and<br />
acoustic insulation, roofing • communications technology,<br />
telecommunication cables, electrical and electronic connectors<br />
• computer housings and accessories • footwear • home and<br />
office furnishings: appliance insulation, mattresses, carpeting,<br />
flooring, furniture padding, office furniture • packaging, food and<br />
beverage containers, protective packaging • sports and recreation<br />
equipment • wire and cable insulation and jacketing materials for<br />
power utility and telecommunications<br />
<strong>Dow</strong> Automotive delivers innovative solutions for automotive interior, exterior,<br />
chassis/powertrain and body engineered systems applications. As a leading<br />
global supplier of resins, engineering plastic materials, fluids, adhesives,<br />
sealants, epoxy dampers, structural bonding and reinforcement products, and<br />
thermal and acoustical management solutions, <strong>Dow</strong> Automotive has been<br />
recognized for its automotive components and systems. It also provides<br />
research and development, design expertise and advanced engineering.<br />
Products: Betabrace reinforcing composites; Betadamp acoustical damping<br />
systems; Betafoam NVH and structural foams; Betaguard sealers; Betamate<br />
structural adhesives; Betaseal glass bonding systems; Calibre polycarbonate<br />
resins; <strong>Dow</strong> polypropylene resins and automotive components of <strong>Dow</strong><br />
polypropylene; Injection-molded dashmats and underhood barriers; Inspire<br />
performance polymers; Integral adhesive film; Magnum ABS resins; Pulse<br />
engineering resins; Questra crystalline polymers; Retain recycle content resins;<br />
Spectrim reaction moldable polymers; Strandfoam polypropylene foam<br />
> 16 <strong>The</strong> <strong>Dow</strong> <strong>Chemical</strong> <strong>Company</strong><br />
Engineering Plastics business offers one of the broadest ranges of engineering<br />
polymers and compounds of any global plastics supplier. <strong>Dow</strong>’s<br />
Engineering Plastics business complements its product portfolio with technical<br />
and commercial capabilities to develop solutions that deliver improved economics<br />
and performance to its customers.<br />
Products: Calibre polycarbonate resins; Emerge advanced resins; Isoplast<br />
engineering thermoplastic polyurethane resins; Magnum ABS resins; Pellethane<br />
thermoplastic polyurethane elastomers; Prevail engineering thermoplastic<br />
resins; Pulse engineering resins; Questra crystalline polymers; Tyril SAN resins<br />
Epoxy Products and Intermediates business manufactures a variety of<br />
basic epoxy products, as well as intermediates used by other major epoxy<br />
producers. <strong>Dow</strong> is a leading global producer of basic epoxy products, supported<br />
by high-quality raw materials, technical service and production capabilities.<br />
Products: Acetone; Acrylic monomers; Allyl chloride; Bisphenol A;<br />
D.E.H. epoxy catalyst resins; D.E.N. epoxy novolac resins; D.E.R. epoxy<br />
resins (liquids, solids and solutions); Derakane and Derakane Momentum<br />
epoxy vinyl ester resins; Epichlorohydrin; Epoxy acrylates; Optim glycerine;<br />
Phenol; UV specialty epoxies
Fabricated Products business manufactures and<br />
markets an extensive line of plastic film and foam products.<br />
Fabricated Products sets the competitive standard by creating<br />
high-performance solutions in industries ranging from packaging<br />
and construction to telecommunications, automotive<br />
and medical.<br />
Products: Covelle HF weldable polyolefin film; <strong>Dow</strong> backing layer<br />
film; Envision custom foam laminates; Ethafoam polyethylene foam;<br />
Immotus acoustic panels; Instill vacuum insulation core; Integral adhesive<br />
film; Lamdex polyolefin foam; Opticite label film; Polypropylene foam;<br />
Procite window envelope film; Quash sound management foam; Saranex barrier<br />
medical film; Styrofoam brand products (including Weathermate Plus housewrap);<br />
Synergy soft touch foam; Tanklite protective insulation; Trenchcoat protective<br />
film; Trycite polystyrene film; Trymer polyisocyanurate foam; Zetabon coated<br />
metal cable armor<br />
Polyurethanes and Polyurethane Systems businesses are leading global<br />
producers of polyurethane raw materials and polyurethane systems.<br />
Differentiated by their ability to globally supply a high-quality, consistent and<br />
complete product range, these businesses emphasize both existing and new<br />
business developments while facilitating customer success with a global market<br />
and technology network.<br />
Products: Dispersions; <strong>The</strong> Enhancer and Lifespan carpet backings;<br />
Froth-Pak polyurethane spray foam; Great Stuff polyurethane foam sealant;<br />
Insta-Stik roof insulation adhesive; Intacta performance polymers; Intacta<br />
polyurethane gloves; Isonate pure and modified methylene diphenyl diisocyanate<br />
(MDI); Papi polymeric MDI; Propylene glycol; Propylene oxide;<br />
Syntegra polyurethane; Tile Bond roof tile adhesive; Voracor, Voralast, Voralux<br />
and Vorastar polyurethane systems; Voranate toluene diisocyanate; Voranol and<br />
Voranol Voractiv polyether and copolymer polyols; Woodstalk fiberboard products<br />
Technology Licensing and Catalyst business includes licensing and supply<br />
of related catalysts for the Unipol polypropylene process, the Meteor process<br />
for ethylene oxide and ethylene glycol, the LP Oxo process for oxo alcohols,<br />
and <strong>Dow</strong>’s bisphenol A process. In addition, licensing of the Unipol polyethylene<br />
process and related catalysts, including metallocene catalysts, is handled<br />
through Univation Technologies, LLC, a 50:50 joint venture. <strong>The</strong> business<br />
also includes UOP LLC, a 50:50 joint venture, which supplies process technology,<br />
catalysts, molecular sieves and adsorbents to the petroleum refining, petrochemical<br />
and gas processing industries.<br />
Products: Bisphenol A process technology and catalyst; LP Oxo process<br />
technology; Meteor EO/EG process technology and catalysts; Shac and Ucat<br />
catalysts; Unipol process technology<br />
Wire & Cable Compounds business is the leading global producer of a variety<br />
of performance polyolefin products that are marketed worldwide for wire and<br />
cable applications. Chief among these are polyolefin-based compounds for<br />
high-performance insulation, semiconductives and jacketing systems for power<br />
distribution, telecommunications and flame-retardant wire and cable.<br />
Products: Redi-Link polyethylene, Si-Link crosslinkable polyethylene,<br />
Unigard high-performance flame-retardant compounds, Unigard reduced<br />
emissions flame-retardant compounds, Unipurge purging compounds, Wire<br />
and cable insulation and jacketing compounds<br />
Performance <strong>Chemical</strong>s<br />
APPLICATIONS:<br />
• agricultural and pharmaceutical products and processing •<br />
building materials • chemical processing and intermediates<br />
• food processing and ingredients • household products • paints,<br />
coatings, inks, adhesives, lubricants • personal care products<br />
• pulp and paper manufacturing, coated paper and paperboard •<br />
textiles and carpet • water purification<br />
Custom & Fine <strong>Chemical</strong>s business provides products and services to other<br />
specialty chemical, pharmaceutical, biopharmaceutical and agricultural<br />
chemical producers, and also produces fine chemicals for household paints<br />
and various other applications.<br />
Products: Basic nitroparaffins and nitroparaffin-based specialty chemicals<br />
of ANGUS <strong>Chemical</strong> <strong>Company</strong>; Contract manufacturing services provided by<br />
<strong>Dow</strong>pharma and <strong>Dow</strong> Haltermann Custom Processing; Fine and specialty<br />
chemicals from <strong>Dow</strong> Haltermann Custom Processing, Chirotech Technology<br />
Limited and Mitchell Cotts; Test and reference fuels, printing ink distillates,<br />
pure hydrocarbons and esters, and derivatives of Haltermann Products<br />
Emulsion Polymers business is the world’s largest supplier of synthetic<br />
latex, and the most globally diverse of the styrene-butadiene latex suppliers.<br />
<strong>Dow</strong> is the largest supplier of latex for coating paper and paperboard used in<br />
magazines, catalogues and food packaging. <strong>Dow</strong> is also the world’s largest<br />
supplier of latexes used in carpet production.<br />
Products: Acrylic latex; Butadiene-vinylidene latex; Polystyrene latex;<br />
Styrene-acrylate latex; Styrene-butadiene latex<br />
Industrial <strong>Chemical</strong>s business provides products used as functional ingredients<br />
or processing aids in the manufacture of a diverse range of products.<br />
<strong>Dow</strong>’s surfactants and biocides businesses provide value-added ingredients<br />
for household and personal care products.<br />
Products: Biocides; Carbowax polyethylene glycols and methoxypolyethylene<br />
glycols; Diphenyloxide; <strong>Dow</strong> polypropylene glycols; <strong>Dow</strong>fax, Hamposyl,<br />
Tergitol and Triton surfactants; <strong>Dow</strong>therm, Syltherm and Ucartherm heat<br />
transfer fluids; UCAR deicing fluids; UCON fluids; Versene chelating agents<br />
<strong>The</strong> <strong>Dow</strong> <strong>Chemical</strong> <strong>Company</strong> 17 >
Oxide Derivatives business is the world’s largest supplier of glycol ethers<br />
and amines to a diverse set of market applications, including coatings, household<br />
products, gas treating and agricultural products.<br />
Products: Alkyl alkanolamines; Ethanolamines; Ethylene oxide- and<br />
propylene oxide-based glycol ethers; Ethyleneamines; Isopropanolamines<br />
Specialty Polymers business is a diverse portfolio serving numerous markets.<br />
<strong>The</strong> largest unit, Liquid Separations, uses several technologies to separate<br />
dissolved minerals and organics from water, making purer water for human<br />
and industrial uses.<br />
Products: Acrolein derivatives; Acrylic acid/Acrylic esters; Cyracure<br />
cycloaliphatic epoxides; Daxad dispersants; <strong>Dow</strong>ex ion exchange resins;<br />
Drytech superabsorbent polymers; Epoxidized vegetable oils; FilmTec membranes;<br />
Glycine; Peroxymerics; Polyvinyl acetate resins; Quaternaries;<br />
Redispersible polymer powders; Solution vinyl resins; Specialty monomers;<br />
Sulfur derivative compounds; Surface sizing polymers; Tone polyols,<br />
polymers and monomers<br />
UCAR Emulsion Systems is a leading global supplier of water-based<br />
emulsions used as key components in decorative and industrial paints,<br />
adhesives, textile products, and construction products such as caulks and<br />
sealants. <strong>The</strong>se products allow customers to formulate more environmentally<br />
friendly products that contain less or no solvent.<br />
Products: Neocar branched vinyl ester latexes; Polyphobe rheology modifiers;<br />
UCAR all-acrylic, styrene-acrylic and vinyl-acrylic latexes<br />
Water Soluble Polymers business provides a portfolio of high-value, multifunctional<br />
ingredients used to enhance the physical and sensory properties of<br />
end products in a wide range of applications, including food, pharmaceuticals,<br />
oilfield, paints and coatings, personal care, building and construction, and<br />
many other specialty applications.<br />
Products: Cellosize hydroxyethyl cellulose; Ethocel ethylcellulose resins;<br />
Methocel cellulose ethers; Polyox water-soluble resins; Products for hair/skin<br />
care from Amerchol Corporation<br />
> 18 <strong>The</strong> <strong>Dow</strong> <strong>Chemical</strong> <strong>Company</strong><br />
Agricultural Sciences<br />
APPLICATIONS:<br />
• control of weeds, insects and diseases in plants •<br />
pest management • seeds • traits (genes) for crops and agriculture<br />
<strong>Dow</strong> AgroSciences LLC is a global leader in providing pest management,<br />
agricultural and crop biotechnology products. <strong>The</strong> business develops, manufactures<br />
and markets products for crop production; weed, insect and plant disease<br />
management; and industrial and commercial pest management. <strong>Dow</strong><br />
AgroSciences is building a leading plant genetics and biotechnology business<br />
in crop seeds and traits for seeds.<br />
Products: Acetochlor herbicide products; Clincher herbicide; Dithane<br />
fungicide; Dursban and Lorsban insecticides; FirstRate herbicide; Fortress<br />
fungicide; Garlon herbicide; Glyphomax herbicide; Grandstand herbicide;<br />
Herculex I Insect Protection; Lontrel herbicide; Mustang herbicide; Mycogen<br />
seeds; PhytoGen cottonseeds; Sentricon Termite Colony Elimination System;<br />
Spider herbicide; Starane herbicide; Stinger herbicide; Strongarm herbicide;<br />
Telone soil fumigant; Tordon herbicide; Tracer Naturalyte insect control;<br />
Treflan herbicide; Vikane structural fumigant<br />
Plastics<br />
APPLICATIONS:<br />
• appliances and appliance housings • agricultural films • automotive<br />
parts and trim • beverage bottles • building and construction •<br />
consumer and durable goods • consumer electronics • disposable<br />
diaper liners • fibers • films, bags and packaging for food and<br />
consumer products • flexible and rigid packaging • housewares<br />
• hygiene and medical films and nonwovens • industrial and<br />
consumer films and foams • information technology • oil tanks<br />
and road equipment • toys, playground equipment and recreational<br />
products • wire and cable compounds<br />
Polyethylene business is the world’s leading supplier of polyethylene-based<br />
solutions through sustainable product differentiation. Through the use of multiple<br />
catalyst and process technologies, <strong>Dow</strong> offers one of the industry’s broadest<br />
ranges of polyethylene solutions for a wide variety of applications. DuPont<br />
<strong>Dow</strong> Elastomers LLC, a 50:50 joint venture, leverages Insite Technology, <strong>Dow</strong>’s<br />
proprietary catalyst and process technology, into elastomeric products.<br />
Products: Affinity polyolefin plastomers; Aspun fiber grade resins; Attane<br />
ultra low density polyethylene resins; <strong>Dow</strong>lex polyethylene resins; Elite<br />
enhanced polyethylene resins; <strong>Dow</strong> XLA elastic fiber for the textile industry;<br />
Flexomer very low density polyethylene resins; High density polyethylene<br />
resins (HDPE), including Unival HDPE; Low density polyethylene resins (LDPE);<br />
Primacor copolymers; Saran barrier resins and films; Tuflin linear low density<br />
polyethylene resins (LLDPE)
Polypropylene business, a major global polypropylene supplier, provides a<br />
broad range of products and solutions tailored to customer needs by leveraging<br />
<strong>Dow</strong>’s leading manufacturing and application technology, research and product<br />
development expertise, extensive market knowledge and strong customer<br />
relationships.<br />
Products: Homopolymer polypropylene resins; Impact copolymer<br />
polypropylene resins; Inspire performance polymers; Random copolymer<br />
polypropylene resins<br />
Polystyrene business, the global leader in the production of polystyrene<br />
resins, is uniquely positioned with geographic breadth and broad industry<br />
experience to meet a diverse range of customer needs. By implementing<br />
breakthrough proprietary technology, <strong>Dow</strong> continues to improve efficiencies<br />
and product performance.<br />
Products: Styron A-Tech advanced technology polystyrene resin; Styron<br />
general purpose polystyrene resin; Styron high-impact polystyrene resin;<br />
Styron ignition-resistant polystyrene resin<br />
<strong>The</strong> Plastics segment also includes polybutadiene rubber, polyethylene terephthalate<br />
(PET), purified terephthalic acid (PTA), styrene-butadiene rubber and<br />
several specialty resins.<br />
<strong>Chemical</strong>s<br />
APPLICATIONS:<br />
• agricultural products • alumina • automotive antifreeze, coolant<br />
systems • carpet and textiles • chemical processing • dry cleaning<br />
• dust control • household cleaners and plastic products • inks •<br />
metal cleaning • packaging, food and beverage containers, protective<br />
packaging • paints, coatings and adhesives • personal care<br />
products • petroleum refining • pharmaceuticals • plastic pipe •<br />
pulp and paper manufacturing • snow and ice control • soaps<br />
and detergents • water treatment<br />
Core <strong>Chemical</strong>s business is a leading global producer of each of its basic<br />
chemical products, which are sold to many industries worldwide, and also<br />
serve as key raw materials in the production of a variety of <strong>Dow</strong>’s performance<br />
and plastics products.<br />
Products: Acids; Alcohols; Aldehydes; Caustic soda; Chlorine; Chloroform;<br />
Combo<strong>The</strong>rm blended deicer; <strong>Dow</strong>flake calcium chloride; <strong>Dow</strong>per dry cleaning<br />
solvent; Esters; Ethylene dichloride (EDC); Liquidow liquid calcium chloride;<br />
Magnesium hydroxide; Maxicheck procedure for testing the strength of<br />
reagents; Maxistab stabilizers for chlorinated solvents; Methyl chloride;<br />
Methylene chloride; Oxo products; Peladow calcium chloride pellets;<br />
Perchloroethylene; Safe-Tainer closed-loop delivery system; Trichloroethylene;<br />
Vinyl acetate monomer (VAM); Vinyl chloride monomer (VCM)<br />
Ethylene Oxide/Ethylene Glycol business is the world’s leading producer of<br />
ethylene oxide, used primarily for internal consumption, and ethylene glycol,<br />
which is sold for use in polyester fiber, PET for food and beverage applications,<br />
polyester film and antifreeze.<br />
Products: Ethylene glycol (EG); Ethylene oxide (EO)<br />
Hydrocarbons and Energy<br />
APPLICATIONS:<br />
• polymer and chemical production • power<br />
Hydrocarbons and Energy business encompasses the procurement of<br />
fuels, natural gas liquids and crude oil-based raw materials, as well as the<br />
supply of monomers, power and steam for use in <strong>Dow</strong>’s global operations.<br />
<strong>Dow</strong> is the world leader in the production of olefins and styrene.<br />
Products: Benzene; Butadiene; Butylene; Cumene; Ethylene; Propylene;<br />
Styrene; Power, steam and other utilities<br />
New Business Growth includes Industrial Biotechnology, Pharmaceutical<br />
Technologies, and new developments with a focus on identifying and pursuing<br />
commercial opportunities. <strong>The</strong> results of Advanced Electronic Materials;<br />
New Business Growth; Venture Capital; the <strong>Company</strong>’s insurance operations;<br />
as well as Cargill <strong>Dow</strong> LLC and <strong>Dow</strong> Corning Corporation, both of which are<br />
50:50 joint ventures, are included in Unallocated and Other.<br />
<strong>The</strong> <strong>Dow</strong> <strong>Chemical</strong> <strong>Company</strong> 19 >
Management Team at March 1, 2003<br />
Arnold A. Allemang, Executive Vice<br />
President, Operations<br />
Kathleen M. Bader, Business<br />
Group President (Engineering<br />
Plastics, Fabricated Products,<br />
Polystyrene, Synthetic Rubber);<br />
and responsibility for Six Sigma<br />
A. Charles Fischer, President and<br />
CEO, <strong>Dow</strong> AgroSciences LLC<br />
Richard M. Gross, Corporate Vice<br />
President, Research & Development<br />
and New Business Growth<br />
Chairman of the Board, President<br />
and Chief Executive Officer<br />
William S. Stavropoulos<br />
Executive Vice President and<br />
Chief Financial Officer<br />
J. Pedro Reinhard<br />
> 20 <strong>The</strong> <strong>Dow</strong> <strong>Chemical</strong> <strong>Company</strong><br />
David E. Kepler, Corporate Vice<br />
President and Chief Information<br />
Officer; and responsibility for<br />
eBusiness and Advanced Electronic<br />
Materials<br />
Romeo Kreinberg, Business Group<br />
President (<strong>Dow</strong> Fiber Solutions,<br />
Polyethylene, Polypropylene,<br />
PET/PTA, Wire & Cable Compounds)<br />
Andrew N. Liveris, Business<br />
Group President (Custom and Fine<br />
<strong>Chemical</strong>s, Emulsion Polymers,<br />
Industrial <strong>Chemical</strong>s, Oxide<br />
Derivatives, Specialty Polymers,<br />
UCAR Emulsion Systems, Water<br />
Soluble Polymers)<br />
Corporate Organization at March 1, 2003<br />
Executive Vice President<br />
Arnold A. Allemang<br />
Corporate Vice President,<br />
Environment, Health & Safety,<br />
Human Resources and<br />
Public Affairs<br />
Lawrence J. Washington, Jr.<br />
Corporate Vice President,<br />
Research & Development and<br />
New Business Growth<br />
Richard M. Gross<br />
Richard L. Manetta, Corporate Vice<br />
President and General Counsel<br />
Lee P. McMaster, Business Group<br />
President (Core <strong>Chemical</strong>s,<br />
Environmental Operations,<br />
Technology Licensing and Catalysts)<br />
J. Pedro Reinhard, Executive Vice<br />
President and Chief Financial Officer<br />
Luciano Respini, President,<br />
<strong>Dow</strong> Europe; Chairman of the<br />
Global Geographic Council;<br />
and responsibility for Sales<br />
and Marketing<br />
Corporate Vice President and<br />
Chief Information Officer<br />
David E. Kepler<br />
Corporate Vice President and<br />
General Counsel<br />
Richard L. Manetta<br />
Vice President and Controller<br />
Frank H. Brod<br />
Vice President and Treasurer<br />
Fernando Ruiz<br />
William S. Stavropoulos, President<br />
and Chief Executive Officer<br />
<strong>The</strong>o H. Walthie, Business Group<br />
President (Hydrocarbons & Energy,<br />
Ethylene Oxide/Ethylene Glycol)<br />
Lawrence J. Washington, Jr.,<br />
Corporate Vice President,<br />
Environment, Health & Safety,<br />
Human Resources and Public Affairs<br />
Robert L. Wood, Business<br />
Group President (Polyurethanes,<br />
Polyurethanes Systems, Epoxy<br />
Products and Intermediates,<br />
<strong>Dow</strong> Automotive)<br />
Secretary of the <strong>Company</strong><br />
Tina S. Van Dam<br />
Assistant Secretary<br />
Charles J. Hahn<br />
Thomas E. Moran<br />
Corporate Auditor<br />
Douglas J. Anderson
2002 Financial Report<br />
Management’s Discussion and Analysis of Financial Condition and Results of Operations . . . . . . . . . . . . . . . . . . . . . . . . . . . . . . 22<br />
Segment Results . . . . . . . . . . . . . . . . . . . . . . . . . . . . . . . . . . . . . . . . . . . . . . . . . . . . . . . . . . . . . . . . . . . . . . . . . . . . . . . . . . . . . . . . 22<br />
<strong>Company</strong> Summary . . . . . . . . . . . . . . . . . . . . . . . . . . . . . . . . . . . . . . . . . . . . . . . . . . . . . . . . . . . . . . . . . . . . . . . . . . . . . . . . . . . . . 28<br />
Accounting Changes and Critical Accounting Policies . . . . . . . . . . . . . . . . . . . . . . . . . . . . . . . . . . . . . . . . . . . . . . . . . . . . . . . . . 33<br />
Environmental Matters . . . . . . . . . . . . . . . . . . . . . . . . . . . . . . . . . . . . . . . . . . . . . . . . . . . . . . . . . . . . . . . . . . . . . . . . . . . . . . . . . . . 36<br />
Asbestos-Related Matters of Union Carbide Corporation . . . . . . . . . . . . . . . . . . . . . . . . . . . . . . . . . . . . . . . . . . . . . . . . . . . . . . . 37<br />
Management Statement of Responsibility . . . . . . . . . . . . . . . . . . . . . . . . . . . . . . . . . . . . . . . . . . . . . . . . . . . . . . . . . . . . . . . . . . . . . . 40<br />
Independent Auditors’ Report . . . . . . . . . . . . . . . . . . . . . . . . . . . . . . . . . . . . . . . . . . . . . . . . . . . . . . . . . . . . . . . . . . . . . . . . . . . . . . . . 40<br />
Consolidated Financial Statements . . . . . . . . . . . . . . . . . . . . . . . . . . . . . . . . . . . . . . . . . . . . . . . . . . . . . . . . . . . . . . . . . . . . . . . . . . . . 41<br />
Notes to the Consolidated Financial Statements . . . . . . . . . . . . . . . . . . . . . . . . . . . . . . . . . . . . . . . . . . . . . . . . . . . . . . . . . . . . . . . . . 45<br />
A. Summary of Significant Accounting Policies and Accounting Changes . . . . . . . . . . . . . . . . . . . . . . . . . . . . . . . . . . . . . . . . 45<br />
B. Purchased In-Process Research and Development, and Merger-Related Expenses and Restructuring . . . . . . . . . . . . . . . 49<br />
C. Acquisitions and Divestitures . . . . . . . . . . . . . . . . . . . . . . . . . . . . . . . . . . . . . . . . . . . . . . . . . . . . . . . . . . . . . . . . . . . . . . . . . . 50<br />
D. Inventories . . . . . . . . . . . . . . . . . . . . . . . . . . . . . . . . . . . . . . . . . . . . . . . . . . . . . . . . . . . . . . . . . . . . . . . . . . . . . . . . . . . . . . . . . . 52<br />
E. Property . . . . . . . . . . . . . . . . . . . . . . . . . . . . . . . . . . . . . . . . . . . . . . . . . . . . . . . . . . . . . . . . . . . . . . . . . . . . . . . . . . . . . . . . . . . . 52<br />
F. Goodwill and Other Intangible Assets . . . . . . . . . . . . . . . . . . . . . . . . . . . . . . . . . . . . . . . . . . . . . . . . . . . . . . . . . . . . . . . . . . . 52<br />
G. Significant Nonconsolidated Affiliates and Related <strong>Company</strong> Transactions . . . . . . . . . . . . . . . . . . . . . . . . . . . . . . . . . . . . 54<br />
H. Financial Instruments . . . . . . . . . . . . . . . . . . . . . . . . . . . . . . . . . . . . . . . . . . . . . . . . . . . . . . . . . . . . . . . . . . . . . . . . . . . . . . . . . 55<br />
I. Supplementary Information . . . . . . . . . . . . . . . . . . . . . . . . . . . . . . . . . . . . . . . . . . . . . . . . . . . . . . . . . . . . . . . . . . . . . . . . . . . . 56<br />
J. Commitments and Contingent Liabilities . . . . . . . . . . . . . . . . . . . . . . . . . . . . . . . . . . . . . . . . . . . . . . . . . . . . . . . . . . . . . . . . . 57<br />
K. Notes Payable, Long-Term Debt and Available Credit Facilities . . . . . . . . . . . . . . . . . . . . . . . . . . . . . . . . . . . . . . . . . . . . . . 62<br />
L. Pension Plans and Other Postretirement Benefits . . . . . . . . . . . . . . . . . . . . . . . . . . . . . . . . . . . . . . . . . . . . . . . . . . . . . . . . . . 63<br />
M. Leased Property and Variable Interest Entities . . . . . . . . . . . . . . . . . . . . . . . . . . . . . . . . . . . . . . . . . . . . . . . . . . . . . . . . . . . . 65<br />
N. Stock Compensation Plans . . . . . . . . . . . . . . . . . . . . . . . . . . . . . . . . . . . . . . . . . . . . . . . . . . . . . . . . . . . . . . . . . . . . . . . . . . . . 65<br />
O. Limited Partnership . . . . . . . . . . . . . . . . . . . . . . . . . . . . . . . . . . . . . . . . . . . . . . . . . . . . . . . . . . . . . . . . . . . . . . . . . . . . . . . . . . . 68<br />
P. Preferred Securities of Subsidiaries . . . . . . . . . . . . . . . . . . . . . . . . . . . . . . . . . . . . . . . . . . . . . . . . . . . . . . . . . . . . . . . . . . . . . 68<br />
Q. Stockholders’ Equity . . . . . . . . . . . . . . . . . . . . . . . . . . . . . . . . . . . . . . . . . . . . . . . . . . . . . . . . . . . . . . . . . . . . . . . . . . . . . . . . . . 68<br />
R. Employee Stock Ownership Plans and Redeemable Preferred Stock . . . . . . . . . . . . . . . . . . . . . . . . . . . . . . . . . . . . . . . . . . 69<br />
S. Income Taxes . . . . . . . . . . . . . . . . . . . . . . . . . . . . . . . . . . . . . . . . . . . . . . . . . . . . . . . . . . . . . . . . . . . . . . . . . . . . . . . . . . . . . . . . 69<br />
T. Operating Segments and Geographic Areas . . . . . . . . . . . . . . . . . . . . . . . . . . . . . . . . . . . . . . . . . . . . . . . . . . . . . . . . . . . . . . 70<br />
U. Subsequent Event . . . . . . . . . . . . . . . . . . . . . . . . . . . . . . . . . . . . . . . . . . . . . . . . . . . . . . . . . . . . . . . . . . . . . . . . . . . . . . . . . . . . 72<br />
Quarterly Statistics . . . . . . . . . . . . . . . . . . . . . . . . . . . . . . . . . . . . . . . . . . . . . . . . . . . . . . . . . . . . . . . . . . . . . . . . . . . . . . . . . . . . . . . . . 73<br />
Eleven-Year Review of Market Price per Share of Common Stock . . . . . . . . . . . . . . . . . . . . . . . . . . . . . . . . . . . . . . . . . . . . . . . . . . 73<br />
Eleven-Year Summary of Selected Financial Data . . . . . . . . . . . . . . . . . . . . . . . . . . . . . . . . . . . . . . . . . . . . . . . . . . . . . . . . . . . . . . . . 74<br />
<strong>The</strong> Private Securities Litigation Reform Act of 1995 provides a “safe harbor” for forward-looking statements made by or on behalf of <strong>The</strong> <strong>Dow</strong><br />
<strong>Chemical</strong> <strong>Company</strong> and its subsidiaries (“<strong>Dow</strong>” or the “<strong>Company</strong>”). This section covers the current performance and outlook of the <strong>Company</strong><br />
and each of its operating segments. <strong>The</strong> forward-looking statements contained in this section and in other parts of this document involve risks<br />
and uncertainties that may affect the <strong>Company</strong>’s operations, markets, products, services, prices and other factors as more fully discussed<br />
elsewhere and in filings with the U.S. Securities and Exchange Commission (“SEC”). <strong>The</strong>se risks and uncertainties include, but are not limited<br />
to, economic, competitive, legal, governmental and technological factors. Accordingly, there is no assurance that the <strong>Company</strong>’s expectations will<br />
be realized. <strong>The</strong> <strong>Company</strong> assumes no obligation to provide revisions to any forward-looking statements should circumstances change, except<br />
as otherwise required by securities and other applicable laws.<br />
<strong>The</strong> <strong>Dow</strong> <strong>Chemical</strong> <strong>Company</strong> 21 >
Management’s Discussion and Analysis of Financial Condition and Results of Operations<br />
INTRODUCTORY NOTES TO READERS<br />
<strong>The</strong> accompanying consolidated financial statements of <strong>The</strong> <strong>Dow</strong><br />
<strong>Chemical</strong> <strong>Company</strong> and its subsidiaries give retroactive effect to<br />
the Union Carbide merger, which was completed on February 6,<br />
2001, and accounted for as a pooling of interests. Accordingly, the<br />
consolidated financial statements include the combined accounts<br />
of the two companies for all periods presented. See Note C to the<br />
Consolidated Financial Statements for additional information.<br />
Prior to this annual report, the net results of the <strong>Company</strong>’s<br />
insurance operations were presented on a separate line entitled<br />
“Insurance company operations, pretax income” on the income<br />
statement. <strong>The</strong> consolidated financial statements in this annual<br />
report reflect a reclassification of these results to “Net sales” and<br />
“Cost of sales” for all periods presented.<br />
RESULTS OF OPERATIONS<br />
<strong>The</strong> year 2002 was a difficult year for the chemical industry and<br />
<strong>Dow</strong>. Neither the general economy nor industry fundamentals<br />
offered much relief from the difficult conditions the <strong>Company</strong><br />
faced in 2001. On the positive side, the <strong>Company</strong> completed the<br />
integration of Union Carbide and other recent acquisitions, including<br />
Ascot Plc (“Ascot”), Rohm and Haas’ agricultural chemicals business,<br />
the remaining 50 percent of Gurit-Essex AG (“Gurit-Essex”),<br />
and EniChem’s polyurethanes business. With the Union Carbide<br />
integration alone, the <strong>Company</strong> achieved cost synergies of $1.2<br />
billion, exceeding its ambitious targets.<br />
<strong>Dow</strong>’s sales for 2002 were $27.6 billion, compared with $28.1<br />
billion in 2001 and $29.8 billion in 2000. Sales declined slightly in<br />
2002 as selling prices fell 6 percent and volume increased 4 percent<br />
(see Sales Price and Volume table on page 27). Prices were lower in<br />
all operating segments and across all geographic areas, reflecting<br />
the difficult economic environment. Volume growth was strongest<br />
in Asia Pacific and Latin America, with Plastics showing the greatest<br />
improvement in both regions. Volume also improved in Europe,<br />
aided by the acquisitions in mid-2001 of Ascot, EniChem’s polyurethanes<br />
business, and Rohm and Haas’ agricultural chemicals<br />
business. Volume declined in the United States, principally in<br />
Performance Plastics and Performance <strong>Chemical</strong>s. Excluding the<br />
impact of the 2001 acquisitions, overall volume improved 3 percent<br />
in 2002.<br />
Sales in the United States accounted for 41 percent of total<br />
sales in 2002, compared with 43 percent in 2001 and 44 percent<br />
in 2000. Sales and other information by operating segment and<br />
geographic area are provided in Note T to the Consolidated<br />
Financial Statements.<br />
<strong>The</strong> <strong>Company</strong> expects 2003 to be another challenging year. <strong>The</strong><br />
global economy is expected to improve gradually, with global GDP<br />
increasing 2 to 2.5 percent. <strong>The</strong> <strong>Company</strong> expects some improvement<br />
in most regions of the world. However, with the extreme<br />
volatility in feedstock and energy prices caused by geopolitical<br />
factors, the <strong>Company</strong> expects its raw material costs to be substantially<br />
higher, at least for the first half of the year. To mitigate the<br />
effects of the challenging environment, the <strong>Company</strong> has<br />
announced plans to control discretionary spending, reduce capital<br />
expenditures, and sell or shut down non-strategic or underperforming<br />
assets in order to improve overall financial performance.<br />
> 22 <strong>The</strong> <strong>Dow</strong> <strong>Chemical</strong> <strong>Company</strong><br />
SEGMENT RESULTS<br />
<strong>The</strong> <strong>Company</strong> uses “Earnings before Interest, Income Taxes and<br />
Minority Interests” (“EBIT”) as its measure of profit/loss for<br />
segment reporting purposes. <strong>The</strong> reconciliation between EBIT<br />
and “Income (Loss) before Income Taxes and Minority Interests”<br />
is shown below:<br />
IN MILLIONS 2002 2001 2000<br />
EBIT $ 86 $ 35 $3,105<br />
Interest income 66 85 146<br />
Interest expense and<br />
amortization of debt discount 774 733 665<br />
Income (Loss) before Income<br />
Taxes and Minority Interests $(622) $(613) $2,586<br />
Performance Plastics<br />
Performance Plastics sales decreased 3 percent to $7.1 billion in<br />
2002, compared with $7.3 billion in 2001. Sales were $7.7 billion<br />
in 2000. Volume increased 3 percent over 2001, while prices<br />
decreased 6 percent. Excluding 2001 acquisitions, volume in 2002<br />
was up just 1 percent, reflecting weak industry demand in many of<br />
the segment’s businesses. Sales in 2001 reflected a 1 percent<br />
volume decline while prices decreased 4 percent versus 2000.<br />
EBIT for the segment was $612 million in 2002, compared<br />
with $643 million in 2001 and $1.0 billion in 2000. EBIT in 2002<br />
decreased as the impact of continued competitive price pressure<br />
more than offset the realization of acquisition-related cost synergies<br />
and lower feedstock costs. EBIT in 2002 also included the impact<br />
of a $10 million restructuring charge (<strong>Dow</strong>’s share) recorded by<br />
UOP LLC, a joint venture between Union Carbide and Honeywell<br />
International Inc., in the second quarter. EBIT in 2001 decreased<br />
from 2000 due to soft demand and lower prices. Results for 2000<br />
included an unusual charge of $31 million recorded by UOP LLC,<br />
related primarily to losses associated with certain customer contracts<br />
coupled with restructuring charges.<br />
Performance Plastics—Sales (in millions)<br />
98 $6,900<br />
99<br />
$7,031<br />
00<br />
$7,667<br />
01<br />
$7,321<br />
02<br />
$7,095<br />
Performance Plastics—EBIT (in millions)<br />
98 $1,819<br />
99<br />
$1,578<br />
00<br />
$1,029<br />
01<br />
$643<br />
02<br />
$612<br />
<strong>Dow</strong> Automotive sales were up 1 percent versus 2001. Prices<br />
declined 2 percent in 2002 due to an intensely competitive environment<br />
within the automotive industry. Volume was up 3 percent as<br />
<strong>Dow</strong> Automotive continued to expand its new product offerings,<br />
including the start-up of a parts manufacturing facility in Brazil.<br />
EBIT increased as a result of improved margins from higher-value<br />
products and the realization of cost synergies related to the acquisition<br />
of the remaining 50 percent interest in Gurit-Essex in 2001.
Management’s Discussion and Analysis of Financial Condition and Results of Operations<br />
Engineering Plastics sales were down 14 percent compared<br />
with 2001. Prices declined 15 percent, as low industry operating<br />
rates caused competitive price reductions. Sales of polycarbonate<br />
to Asia Pacific declined in 2002, as LG <strong>Dow</strong> Polycarbonate Ltd., a<br />
50:50 joint venture with LG <strong>Chemical</strong> Ltd., now sources customers<br />
in that region. Sales volume was also impacted as <strong>Dow</strong> exited its<br />
nylon alliance with Solutia Inc. Despite these changes, volume was<br />
up 1 percent. During 2002, <strong>Dow</strong> successfully completed the start-up<br />
of a new ABS manufacturing facility in Terneuzen, <strong>The</strong> Netherlands.<br />
EBIT in 2002 was down, reflecting the dramatic drop in prices.<br />
Epoxy Products and Intermediates sales decreased 7 percent<br />
compared with 2001. Volume was flat to 2001, as the electronics<br />
industry in Asia Pacific failed to recover from the dramatic market<br />
decline in 2001. Intense competitive activity continued, resulting in<br />
a 7 percent price decline. As a result, <strong>Dow</strong> temporarily idled one<br />
of its epichlorohydrin manufacturing plants in Freeport, Texas, in<br />
2002. Despite the decline in sales, EBIT improved due primarily to<br />
cost reductions and lower feedstock costs.<br />
Fabricated Products sales increased 2 percent in 2002. Volume<br />
was up 4 percent compared with last year reflecting the first full<br />
year of sales of polyisocyanurate insulation products acquired in<br />
the third quarter of 2001 from Celotex Corporation. Excluding the<br />
addition of these products, volume declined 3 percent due to<br />
weakness in the electronics packaging and fiber optic telecommunications<br />
industries. <strong>Dow</strong> experienced strong sales growth in<br />
China and Russia in 2002, as construction and infrastructure<br />
spending increased. Prices decreased 2 percent, predominantly<br />
due to industry overcapacity for engineered films and laminates.<br />
Capacity optimization improved late in 2002 with the addition of a<br />
new production facility for Styrofoam insulation in Estarreja,<br />
Portugal. EBIT was lower in 2002, reflecting the impact of lower<br />
selling prices and higher raw material costs.<br />
Technology Licensing and Catalyst sales were down 8 percent<br />
from 2001 due to reduced volume. Reduced production rates<br />
among polyethylene and polypropylene licensees lowered catalyst<br />
sales and royalties. While ethylene oxide/ethylene glycol<br />
(“EO/EG”) technology licensing was also slow, EO/EG catalyst<br />
sales were robust due to the start-up of new facilities in Malaysia<br />
in 2002. EBIT in 2002 was lower due to reduced volumes.<br />
Polyurethanes sales were up 1 percent versus last year. Volume<br />
increased 6 percent reflecting the acquisition of EniChem’s polyurethanes<br />
business in April 2001. Excluding this acquisition, volume<br />
increased 3 percent, led by growth within polyurethanes systems.<br />
Compared with last year, prices declined 5 percent, hitting ten-year<br />
lows in the first half of the year for several product lines. Prices<br />
began to recover in the second half of the year. EBIT in 2002<br />
declined due to lower selling prices and increased raw material costs.<br />
Wire and Cable sales in 2002 were down 17 percent as<br />
demand from the telecommunications industry dropped 30 percent<br />
versus 2001. Prices were stable in 2002, but EBIT declined due to<br />
lower volumes.<br />
Performance Plastics Outlook for 2003<br />
<strong>The</strong> Performance Plastics segment expects some improvement<br />
in 2003 market conditions, resulting in an increase in sales from<br />
2002. Competition is expected to remain aggressive while industry<br />
capacity utilization remains low, but prices are not expected<br />
to return to the low levels of 2002. Profitability is expected to<br />
improve with increased focus on higher-margin products and cost<br />
control initiatives.<br />
<strong>Dow</strong> Automotive anticipates that the continued launch of new<br />
product offerings will result in expanded market participation.<br />
Engineering Plastics expects price competition to continue as<br />
competitors aggressively invest in Asia Pacific. Volume is<br />
expected to grow due to ABS capacity added in 2002 in<br />
Terneuzen, <strong>The</strong> Netherlands.<br />
Epoxy Products and Intermediates anticipates improved sales,<br />
as volumes are expected to return to long-term trend line growth<br />
rates with higher volumes in Asia Pacific due to some improvement<br />
in the electronics industry from its low 2002 levels. Prices<br />
are expected to remain highly competitive due to industry oversupply.<br />
Start-up of a new epoxy resin manufacturing facility in<br />
Zhangjiagang, <strong>The</strong> People’s Republic of China, is scheduled for the<br />
second quarter of 2003.<br />
Fabricated Products expects volume growth in the building<br />
materials industry. <strong>The</strong> Technology Licensing and Catalyst business<br />
expects the competitive environment for polypropylene catalysts<br />
to continue in 2003, since new suppliers have entered the market<br />
with competitive offerings using technologies from recently<br />
expired patents.<br />
Polyurethanes’ results are expected to improve from very difficult<br />
industry conditions in 2001 and 2002. <strong>Dow</strong> announced several<br />
strategic actions designed to improve profitability, including a review<br />
of manufacturing assets, initiatives to reduce operating costs and<br />
an increased emphasis on accelerating growth for higher-margin<br />
new products. <strong>The</strong> business also expects continued growth of<br />
polyurethanes systems into new emerging geographic markets.<br />
Performance <strong>Chemical</strong>s<br />
Performance <strong>Chemical</strong>s sales were $5.1 billion in 2002 and 2001,<br />
and $5.3 billion in 2000. Prices declined 2 percent versus last year<br />
due to weak economic conditions, while volume increased 3 percent.<br />
<strong>The</strong> increase in volume was primarily due to the acquisition of<br />
Ascot in the second quarter of 2001 and stronger sales of emulsion<br />
polymers into the coated paper and carpet industries. Volume<br />
grew in Europe and Asia Pacific, partially offset by declines in<br />
North America. Sales in 2001 declined from 2000 due to divestitures<br />
of businesses required for regulatory approval of the Union<br />
Carbide merger and softening demand in the automotive, steel,<br />
and pulp and paper industries.<br />
EBIT in 2002 was $650 million versus $611 million in 2001 and<br />
$536 million in 2000. <strong>The</strong> improvement in EBIT in 2002 reflects the<br />
combined impact of higher sales volume, cost synergies from the<br />
Union Carbide merger and the Ascot acquisition, and a continued<br />
focus on productivity improvements. EBIT in 2001 increased from<br />
2000 due to price increases, lower feedstock and energy costs,<br />
realization of cost synergies from recent acquisitions, and productivity<br />
improvements.<br />
<strong>The</strong> <strong>Dow</strong> <strong>Chemical</strong> <strong>Company</strong> 23 >
Management’s Discussion and Analysis of Financial Condition and Results of Operations<br />
Performance <strong>Chemical</strong>s—Sales (in millions)<br />
98 $4,944<br />
99<br />
$5,044<br />
00<br />
$5,343<br />
01<br />
$5,081<br />
02<br />
$5,130<br />
Performance <strong>Chemical</strong>s—EBIT (in millions)<br />
98 $744<br />
99<br />
$805<br />
00<br />
$536<br />
01<br />
$611<br />
02<br />
$650<br />
Custom and Fine <strong>Chemical</strong>s sales increased 25 percent compared<br />
with 2001 due to the acquisition of Ascot in the second quarter of<br />
2001. EBIT improved in 2002 due to an increase in volume and the<br />
realization of cost synergies associated with the acquisition of Ascot.<br />
Emulsion Polymers increased sales 7 percent versus last year.<br />
Volume, up in all geographic areas, increased 11 percent. This<br />
volume improvement was driven by stronger demand for coated<br />
paper and the acquisition of the carpet and paper latex businesses<br />
of Reichhold, Inc. Prices declined 4 percent due to competitive<br />
pressures in North America and Europe. Price increases implemented<br />
late in 2002 restored margins back to the levels of the<br />
fourth quarter of 2001. Despite the increase in sales, EBIT in 2002<br />
declined due to higher styrene monomer costs.<br />
Industrial <strong>Chemical</strong>s sales were down 6 percent compared with<br />
2001. Both volume and prices declined 3 percent due to competitive<br />
pressures in polyglycols and surfactants and weaker demand in<br />
the heavy industrial markets. EBIT in 2002 declined slightly versus<br />
2001, as the decline in prices and volume offset the realization<br />
of merger-related cost synergies and the impact of productivity<br />
improvements.<br />
Oxide Derivatives sales were down 4 percent in 2002 compared<br />
with 2001. Volume declined 3 percent due to the divestiture of<br />
certain businesses related to the Union Carbide merger in mid-<br />
2001 and a decision to eliminate lower-margin business in North<br />
America and Europe. Prices declined 1 percent. Despite lower<br />
sales, EBIT increased substantially in 2002 due to the realization of<br />
merger-related cost synergies and savings achieved through a<br />
continued focus on productivity.<br />
Specialty Polymers sales were down 1 percent versus last year,<br />
as prices declined 2 percent, offset by a 1 percent improvement<br />
in volume. Prices declined due to excess global industry capacity<br />
in acrylic acid, which created a difficult, competitive environment.<br />
EBIT declined in 2002, as margins were compressed due to lower<br />
selling prices.<br />
UCAR Emulsion Systems (“UES”) sales were down slightly<br />
versus last year, as a 2 percent decline in prices was partially offset<br />
by a 1 percent increase in volume. EBIT improved in 2002 due to<br />
the combined favorable impact of higher volume and the realization<br />
of merger-related cost synergies.<br />
Water Soluble Polymers sales were up 1 percent versus 2001<br />
due to increased demand in the construction industry driven by<br />
lower interest rates. Prices were relatively flat versus 2001. EBIT<br />
improved in 2002 due to higher volume, the realization of mergerrelated<br />
cost synergies and improved manufacturing operations.<br />
> 24 <strong>The</strong> <strong>Dow</strong> <strong>Chemical</strong> <strong>Company</strong><br />
Performance <strong>Chemical</strong>s Outlook for 2003<br />
Performance <strong>Chemical</strong>s anticipates improving demand in selected<br />
markets. Sales volume is expected to grow through continued<br />
integration of recent acquisitions and net capacity additions at a<br />
number of <strong>Dow</strong> facilities. Prices are also expected to improve<br />
slightly as supply/demand balances tighten in several businesses.<br />
EBIT is expected to improve in 2003 due to the continued realization<br />
of cost synergies from recent acquisitions, cost reductions, productivity<br />
improvements, and asset and supply chain optimization.<br />
Production facilities will be temporarily idled in Edison, New<br />
Jersey, by Amerchol Corporation, a wholly owned subsidiary of<br />
<strong>Dow</strong>, and by UES in Bayamon, Puerto Rico, in early 2003.<br />
Customers will be supplied from other facilities.<br />
Capacity for Methocel cellulose ethers and styrene-butadiene<br />
latex will start up in Stade, Germany, and Terneuzen, <strong>The</strong><br />
Netherlands, respectively, to meet growing demand. Custom and<br />
Fine <strong>Chemical</strong>s will complete the construction of a new facility in<br />
Midland, Michigan, to manufacture oligonucleotides, a new class<br />
of breakthrough pharmaceutical therapeutics.<br />
Agricultural Sciences<br />
Agricultural Sciences sales were $2.7 billion in 2002, compared<br />
with $2.6 billion in 2001 and $2.3 billion in 2000. Volume increased<br />
6 percent versus 2001, while prices declined 2 percent. <strong>The</strong> addition<br />
of Rohm and Haas’ agricultural chemicals business, acquired in<br />
June of 2001, was the key driver behind the 2002 volume increase.<br />
Excluding the impact of this acquisition, volume declined 2 percent.<br />
Volume growth in 2002 was hampered by drought and reduced<br />
demand for insecticides in key geographic areas. <strong>The</strong> competitive<br />
environment remained challenging in 2002 with continued industry<br />
consolidation and an increasing presence of generic products.<br />
Sales in 2001 improved versus 2000, as a 15 percent increase in<br />
volume, primarily due to acquisitions, was partially offset by a<br />
4 percent decline in prices.<br />
EBIT in 2002 was $154 million versus $104 million in 2001 and<br />
$212 million in 2000. <strong>The</strong>re was a strong focus on cost reductions<br />
to improve profitability in 2002. <strong>The</strong>se improvements, however,<br />
were offset by seed plant write-offs, the impact of a new import<br />
tax and currency weakness in Argentina, and severance of $5 million<br />
related to a workforce reduction program. EBIT in 2001 was<br />
reduced by a $69 million charge for purchased in-process research<br />
and development (“IPR&D”) associated with the Rohm and Haas<br />
acquisition (See Note B to the Consolidated Financial Statements).<br />
EBIT in 2001 included the impact of goodwill amortization of<br />
$72 million; goodwill amortization in 2000 was $54 million. <strong>The</strong><br />
<strong>Company</strong> ceased amortizing goodwill upon adoption of Statement<br />
of Financial Accounting Standards (“SFAS”) No. 142, “Goodwill and<br />
Other Intangible Assets,” on January 1, 2002 (see Notes A, F and<br />
T to the Consolidated Financial Statements).<br />
Agricultural Sciences—Sales (in millions)<br />
98 $2,408<br />
99<br />
$2,334<br />
00<br />
$2,346<br />
01<br />
$2,612<br />
02<br />
$2,717
Management’s Discussion and Analysis of Financial Condition and Results of Operations<br />
Agricultural Sciences—EBIT (in millions)<br />
98 $(209)<br />
99<br />
$125<br />
00<br />
$212<br />
01<br />
$104<br />
02<br />
$154<br />
Agricultural Sciences Outlook for 2003<br />
Agricultural Sciences sales for 2003 are expected to increase, with<br />
improvements in both price and volume. <strong>The</strong> agricultural chemicals<br />
industry is expected to stabilize from the decline experienced in<br />
recent years. <strong>The</strong> trend toward genetically modified crop plantings<br />
will continue to transform the demand for insecticides and selective<br />
herbicides to biotechnology-derived products. In the near term,<br />
this trend will result in continued pressure on the <strong>Company</strong>’s traditional<br />
agricultural chemicals business. Growth is anticipated<br />
through line extensions of spinosad insect control products and<br />
florasulam, a post emergent broadleaf cereal herbicide that provides<br />
outstanding control of a wide spectrum of broadleaf weeds.<br />
In 2003, <strong>Dow</strong> AgroSciences expects to launch Herculex I insect<br />
protection, a genetically engineered trait in corn that provides<br />
resistance to certain insects. Japanese regulatory agencies<br />
approved Herculex I for full food and feed use in 2002.<br />
Plastics<br />
Sales for the Plastics segment were $6.5 billion in 2002 and 2001,<br />
and $7.1 billion in 2000. Prices declined 8 percent in 2002 compared<br />
with 2001, while volume increased 8 percent. <strong>The</strong> significant<br />
erosion of selling prices during the second half of 2001 continued<br />
through the first quarter of 2002 before improving. Volume<br />
increased 12 percent during the first half of the year compared<br />
with 2001; however, demand growth slowed during the second<br />
half of the year. Sales in 2001 were down 9 percent from 2000, as<br />
prices declined 10 percent and volume improved 1 percent.<br />
EBIT for the year was $151 million, up from $125 million in<br />
2001. EBIT in 2002 improved as increased volume and lower feedstock<br />
and energy costs more than offset the impact of lower selling<br />
prices. Also contributing to the improvement in EBIT was the<br />
continued realization of merger-related cost synergies, the impact<br />
of productivity improvements, and higher equity earnings. Equity<br />
earnings were up 20 percent, primarily due to improved earnings<br />
from DuPont <strong>Dow</strong> Elastomers L.L.C., despite a restructuring<br />
charge of $8 million (<strong>Dow</strong>’s share). EBIT in 2002 includes a $20 million<br />
write-down of ethylene styrene interpolymers market development<br />
assets located in Sarnia, Ontario, Canada. EBIT in 2001 was<br />
down sharply from $945 million in 2000, due to significantly lower<br />
selling prices and equity earnings.<br />
Plastics—Sales (in millions)<br />
98 $4,928<br />
99<br />
$5,764<br />
00<br />
$7,118<br />
01<br />
$6,452<br />
02<br />
$6,476<br />
Plastics—EBIT (in millions)<br />
98 $525<br />
99<br />
$564<br />
00<br />
$945<br />
01<br />
$125<br />
02<br />
$151<br />
Polyethylene sales decreased 4 percent in 2002, as a decline in<br />
prices exceeded volume growth. Prices were down 11 percent in<br />
2002, with significant declines reported in all geographic areas.<br />
Early in the year, prices continued the decline that began in 2001.<br />
Prices improved during the middle of the year but moved lower at<br />
year-end. Certain production capacity remained idle during the year<br />
due to low margins. Volume grew 7 percent versus 2001 with<br />
significant increases for most products in Latin America and Asia<br />
Pacific. Affinity polyolefin plastomers and Saran resins both saw<br />
significant volume growth during the year. EBIT for the business<br />
was flat compared with 2001, as the significant decline in selling<br />
prices offset the favorable impact of lower feedstock and energy<br />
costs, productivity improvements, and the continued realization of<br />
merger-related cost synergies.<br />
Polypropylene sales increased 25 percent in 2002, as volume<br />
increased 21 percent and prices increased 4 percent. Increased<br />
demand was met with capacity that started up at the end of 2000<br />
and a polypropylene plant purchased from Basell in 2001. Demand<br />
for Inspire performance polymers, introduced in mid-2000, continued<br />
to grow at a strong pace. EBIT improved significantly from<br />
2001 due to strong volume, improved prices and the realization of<br />
merger-related cost synergies.<br />
Polystyrene sales grew 8 percent during 2002. Volume<br />
increased 11 percent, returning volume to levels above those<br />
experienced in 2000. Prices declined 3 percent in 2002, reaching<br />
historically low levels in the first quarter of 2002. Increased<br />
demand and tight styrene monomer supply moved prices upward<br />
in the second half of the year, though margins remained under<br />
pressure. EBIT declined significantly in 2002 due to lower prices<br />
and higher feedstock costs.<br />
Plastics Outlook for 2003<br />
Anticipated increases in feedstock and energy costs in 2003 and<br />
continued low operating rates will make 2003 another challenging<br />
year for Plastics.<br />
Polyethylene volumes are expected to increase in most geographic<br />
areas, with improvements in price driven by increases in<br />
feedstock costs. <strong>The</strong> anticipated start-up of a new polyethylene<br />
production facility in Terneuzen, <strong>The</strong> Netherlands, will better position<br />
<strong>Dow</strong> to serve customers in Europe. New industry capacity in the<br />
Middle East will impact markets in Asia Pacific and keep capacity<br />
utilization rates under pressure.<br />
Polypropylene volume is expected to decline in 2003 primarily<br />
due to the temporary shutdown of <strong>Dow</strong> manufacturing facilities in<br />
Germany for required maintenance. New capacity within the industry<br />
is expected to start up in the first half of 2003, keeping supply and<br />
demand balanced in spite of expected demand growth.<br />
New styrene capacity starting up in 2003 in Europe is not<br />
expected to match the anticipated increase in demand, which<br />
should result in higher global styrene operating rates and some<br />
improvement in polystyrene profitability. In October 2002, Styron<br />
Asia Limited, a joint venture between <strong>Dow</strong> and Asahi Kasei, began<br />
operations in Zhangjiagang, <strong>The</strong> People’s Republic of China.<br />
Polystyrene expects improvement in equity earnings, resulting<br />
from a full year of operations at Styron Asia Limited.<br />
<strong>The</strong> <strong>Dow</strong> <strong>Chemical</strong> <strong>Company</strong> 25 >
Management’s Discussion and Analysis of Financial Condition and Results of Operations<br />
<strong>Chemical</strong>s<br />
<strong>Chemical</strong>s sales were $3.4 billion in 2002, compared with $3.6 billion<br />
in 2001 and $4.1 billion in 2000. Prices decreased 11 percent<br />
versus 2001, primarily due to decreases in organic intermediates,<br />
solvents and monomers (“OISM”), caustic soda, and<br />
chloromethanes, somewhat offset by higher vinyl chloride<br />
monomer (“VCM”) and ethylene dichloride (“EDC”) prices.<br />
Volume was up 6 percent from 2001, with increases in ethylene<br />
glycol (“EG”), chlorinated organics and VCM. In 2001, prices<br />
declined 5 percent and volumes declined 9 percent versus 2000.<br />
EBIT was a loss of $78 million in 2002, down from income of<br />
$111 million in 2001, principally due to declining prices that were<br />
only partially offset by lower feedstock and energy costs. EBIT was<br />
also impacted by costs related to the start-up of new VCM facilities<br />
in Freeport, Texas, and chlor-alkali facilities in Stade, Germany; and<br />
a $13 million charge for the write-down of assets related to the<br />
shutdown of a chlor-alkali facility in Fort Saskatchewan, Alberta,<br />
Canada. EBIT in 2001 was down from $422 million in 2000, principally<br />
due to declining prices and volumes.<br />
<strong>Chemical</strong>s—Sales (in millions)<br />
98 $3,646<br />
99<br />
$3,603<br />
00<br />
$4,109<br />
01<br />
$3,552<br />
02<br />
$3,361<br />
<strong>Chemical</strong>s—EBIT (in millions)<br />
98 $76<br />
99<br />
$292<br />
00<br />
$422<br />
01<br />
$111<br />
02<br />
$(78)<br />
VCM pricing in the fourth quarter of 2002 increased over<br />
60 percent from the trough-level prices of the fourth quarter of<br />
2001, due to favorable polyvinyl chloride (“PVC”) supply/demand<br />
balances in North America and Europe. Industry demand for PVC,<br />
the largest end-use product for VCM, was 6 percent higher in<br />
North America in 2002 versus 2001. During the first half of 2002,<br />
caustic soda pricing continued the decline that began in the second<br />
half of 2001. Prices began to improve in the second half of 2002.<br />
Caustic soda volume in 2002 was up 4 percent compared with<br />
2001. Additional chlor-alkali capacity was brought on-line in 2002 in<br />
Stade, Germany, while older capacity in Plaquemine, Louisiana,<br />
and Fort Saskatchewan, Alberta, Canada, was idled. Late in 2002,<br />
the <strong>Company</strong> made the decision to permanently shut down the<br />
chlor-alkali facility at Fort Saskatchewan in early 2003, resulting in<br />
a charge of $13 million for the write-down of the assets. A VCM<br />
manufacturing unit in Freeport, Texas, was restarted after a 40<br />
percent expansion project.<br />
EG prices were down in 2002, compared with 2001, while<br />
volume was up. During 2002, a plant in Louisiana was idled for the<br />
full year, and a plant in Prentiss, Alberta, Canada, was idled for two<br />
months due to slow demand. In the second half of 2002, demand<br />
began to recover and some upward price movement was achieved.<br />
OISM prices declined in 2002 while volume increased. OISM<br />
continued to operate in a highly competitive market. Industry oversupply<br />
of oxo alcohols weakened prices in 2002. Global demand<br />
for vinyl acetate monomers remained weak.<br />
> 26 <strong>The</strong> <strong>Dow</strong> <strong>Chemical</strong> <strong>Company</strong><br />
<strong>Chemical</strong>s Outlook for 2003<br />
Caustic soda pricing is expected to continue improving as a result<br />
of global production shutdowns within the industry, improvement<br />
in underlying demand and higher energy costs. Global chlor-alkali<br />
industry operating rates are expected to significantly improve due<br />
to recent plant shutdowns combined with no planned capacity<br />
expansions through 2005. However, increased energy costs, and<br />
the resulting compressed margins, are expected in early 2003.<br />
PVC demand is expected to improve slightly in 2003, reflecting<br />
the anticipated gradual economic recovery in North America and<br />
Europe. VCM prices are expected to recover in the first half of<br />
2003 with increased activity in the construction industry, the<br />
largest end-user of PVC.<br />
Both price and volume for EG are expected to improve in 2003,<br />
as the supply/demand balance begins to tighten. Polyethylene<br />
terephthalate (“PET”) and polyester, two major end-uses of EG,<br />
are expected to recover to historical market growth rates after two<br />
years of growth significantly below the trend line. New EG capacity<br />
was started up in 2002 by OPTIMAL Glycols (Malaysia) Sdn Bhd,<br />
Union Carbide’s joint venture in Malaysia. No significant industry<br />
capacity for ethylene oxide or ethylene glycol is expected to be<br />
added until late 2004.<br />
OISM volume is expected to slowly trend upward during 2003,<br />
as some improvement in global market conditions is anticipated.<br />
Prices are also expected to rise in the first half of 2003, driven by<br />
higher hydrocarbon and energy costs. Equity earnings are expected<br />
to improve in 2003 following the start-up of new butanol and butyl<br />
acetate capacity in 2002 by Union Carbide’s joint venture in Malaysia.<br />
Hydrocarbons and Energy<br />
Hydrocarbons and Energy sales were $2.4 billion in 2002, compared<br />
with $2.5 billion in 2001 and $2.6 billion in 2000. Prices decreased<br />
7 percent while volume grew 4 percent versus last year. In 2001,<br />
this segment experienced a 14 percent decrease in prices and a<br />
10 percent increase in volume versus 2000.<br />
<strong>The</strong> Hydrocarbons and Energy business transfers materials to<br />
<strong>Dow</strong>’s derivative businesses at cost. EBIT was income of $96 million<br />
in 2002 versus a loss of $22 million in 2001 and income of<br />
$136 million in 2000. EBIT in 2002 included a gain of $63 million on<br />
the sale of the <strong>Company</strong>’s share in the Oasis Pipe Line <strong>Company</strong>,<br />
and a loss of $44 million reflecting the impairment of the ethylene<br />
production facility in Texas City, Texas, which will be shut down in<br />
the first half of 2003. EBIT in 2000 included a gain of $98 million<br />
on the sale of the Cochin pipeline system (see Note C to the<br />
Consolidated Financial Statements).<br />
Hydrocarbons and Energy—Sales (in millions)<br />
98 $1,499<br />
99<br />
$1,731<br />
00<br />
$2,626<br />
01<br />
$2,511<br />
02<br />
$2,435
Management’s Discussion and Analysis of Financial Condition and Results of Operations<br />
Compared with 2001, the <strong>Company</strong>’s cost of purchased feedstocks<br />
and energy in 2002 decreased approximately $850 million,<br />
or 10 percent, due to price, led by significant declines in feedstock<br />
and natural gas costs in North America. This decline primarily<br />
impacted the ethylene-based businesses within <strong>Dow</strong>. Monomer<br />
costs for styrene- and propylene-based businesses were generally<br />
higher in 2002 than in 2001. While there was substantial price<br />
volatility during the year, on average for 2002, crude oil prices were<br />
45 cents per barrel above 2001 levels. Oil-based feedstocks hit a<br />
low point in the first quarter of 2002 as crude oil prices averaged<br />
$21.10 per barrel and rose to an average of $26.90 per barrel for<br />
the third and fourth quarters. North American natural gas prices<br />
started the year below $2.50 per million Btu and ended the fourth<br />
quarter at over $4.00 per million Btu.<br />
Hydrocarbons and Energy Purchase Price Index (2001=100)<br />
98 62<br />
99<br />
72<br />
00<br />
109<br />
01<br />
100<br />
02<br />
90<br />
Major expansions in ethylene and cumene began operating in<br />
2002 at the <strong>Company</strong>’s site in Terneuzen, <strong>The</strong> Netherlands.<br />
Hydrocarbons and Energy Outlook for 2003<br />
Crude oil and feedstock prices are expected to be very volatile during<br />
the year, particularly in the first half of the year, with the full year<br />
up from 2002 levels. Natural gas prices in North America are also<br />
expected to be very volatile and average above 2002 levels, thereby<br />
increasing <strong>Dow</strong>’s overall energy costs for 2003. Monomer prices<br />
are expected to respond to underlying feedstock costs in the first<br />
part of the year, tempered by continuing weak demand. Price<br />
movement in the second half of the year will largely depend on the<br />
pace of the global economic recovery.<br />
In addition to the shutdown of Union Carbide’s ethylene production<br />
facility in Texas City, Texas, in the first half of 2003, the<br />
<strong>Company</strong> announced in late January 2003 that it plans to shut down<br />
Union Carbide’s Seadrift, Texas, ethylene facilities by year-end<br />
2003. <strong>The</strong> shutdown of this plant is expected to have an immaterial<br />
impact on the <strong>Company</strong>’s results of operations.<br />
Sales Price and Volume<br />
Unallocated and Other<br />
Sales were $395 million in 2002, compared with $546 million in<br />
2001 and $589 million in 2000. Sales in 2002 were down primarily<br />
due to divestitures of Sentrachem businesses in 2001 and lower<br />
revenue from insurance operations. Sales in 2001 were down versus<br />
2000 due to two small divestitures of Sentrachem businesses.<br />
Included in the results for Unallocated and Other are:<br />
• expenses related to new business development activities,<br />
• overhead and cost recovery variances not allocated to<br />
the operating segments,<br />
•results of insurance operations,<br />
• gains and losses on sales of financial assets,<br />
•foreign exchange hedging results,<br />
•<strong>Dow</strong>’s share of the earnings/losses of <strong>Dow</strong> Corning<br />
Corporation (“<strong>Dow</strong> Corning”) and Cargill <strong>Dow</strong> Polymers LLC,<br />
and<br />
•the results of several small diversified businesses acquired<br />
in <strong>Dow</strong>’s acquisition of Sentrachem Limited.<br />
EBIT was a loss of $1.5 billion in 2002 and 2001, and a loss of<br />
$175 million in 2000. Results for 2002 were negatively impacted<br />
by several unusual items, including an asbestos-related charge of<br />
$828 million, merger-related integration costs of $41 million,<br />
additional merger-related severance of $66 million, restructuring<br />
severance of $37 million, and the write-down of Sentrachem<br />
assets of $54 million (see Note B to the Consolidated Financial<br />
Statements). Results for 2002 were also negatively impacted by<br />
<strong>Dow</strong>’s share of Cargill <strong>Dow</strong> Polymers LLC losses and lower results<br />
from insurance operations. EBIT in 2001 was negatively impacted<br />
by several unusual items: a special charge of $1.5 billion for<br />
costs related to the Union Carbide merger (see Note B to the<br />
Consolidated Financial Statements); <strong>Dow</strong>’s $11 million share of<br />
a restructuring charge recorded by <strong>Dow</strong> Corning, which reduced<br />
equity earnings; and an $11 million reinsurance loss on the World<br />
Trade Center (reflected in “Cost of sales”); offset by a $266 million<br />
gain on the sale of stock in Schlumberger Ltd. (reflected in “Sundry<br />
income—net”).<br />
2002 2001 2000<br />
PERCENT CHANGE FROM PRIOR YEAR PRICE VOLUME TOTAL PRICE VOLUME TOTAL PRICE VOLUME TOTAL<br />
Operating Segments:<br />
Performance Plastics (6)% 3% (3)% (4)% (1)% (5)% 1% 8% 9%<br />
Performance <strong>Chemical</strong>s (2) 3 1 1 (6) (5) – 6 6<br />
Agricultural Sciences (2) 6 4 (4) 15 11 (4) 5 1<br />
Plastics (8) 8 – (10) 1 (9) 15 8 23<br />
<strong>Chemical</strong>s (11) 6 (5) (5) (9) (14) 18 (4) 14<br />
Hydrocarbons and Energy (7) 4 (3) (14) 10 (4) 46 6 52<br />
Total (6)% 4% (2)% (6)% – (6)% 9% 5% 14%<br />
Geographic Areas:<br />
United States (4)% (2)% (6)% (3)% (5)% (8)% 9% 3% 12%<br />
Europe (4) 8 4 (8) 10 2 8 6 14<br />
Rest of World (11) 10 (1) (8) (2) (10) 11 7 18<br />
Total (6)% 4% (2)% (6)% – (6)% 9% 5% 14%<br />
Price includes the impact of currency.<br />
<strong>The</strong> <strong>Dow</strong> <strong>Chemical</strong> <strong>Company</strong> 27 >
Management’s Discussion and Analysis of Financial Condition and Results of Operations<br />
COMPANY SUMMARY<br />
Earnings before Interest, Income Taxes and Minority<br />
Interests (“EBIT”)<br />
EBIT for the <strong>Company</strong> was $86 million in 2002, compared with $35<br />
million in 2001 and $3.1 billion in 2000. In 2002, selling prices<br />
declined $1.7 billion, exceeding the favorable impact of lower<br />
feedstock and energy costs of approximately $850 million and the<br />
realization of merger- and acquisition-related cost synergies. EBIT<br />
for the year was further reduced by the net impact of several<br />
unusual items: integration costs of $41 million and additional severance<br />
of $66 million related to the Union Carbide merger; severance<br />
of $5 million related to a workforce reduction program at <strong>Dow</strong><br />
AgroSciences; asset write-downs and impairments of $131 million<br />
and severance of $37 million related to restructuring activities<br />
undertaken late in the year, following the appointment of a new<br />
President and CEO (see Note B to the Consolidated Financial<br />
Statements for additional information regarding the preceding<br />
charges and Note T to the Consolidated Financial Statements<br />
for the impact of these charges by operating segment); a charge<br />
of $828 million for asbestos-related expenses, reflected in<br />
Unallocated and Other (see Asbestos-Related Matters of Union<br />
Carbide Corporation); <strong>Dow</strong>’s $10 million share of a restructuring<br />
charge recorded by UOP LLC (reflected in “Equity in earnings of<br />
nonconsolidated affiliates” in the Performance Plastics segment);<br />
<strong>Dow</strong>’s $8 million share of a restructuring charge recorded by<br />
DuPont <strong>Dow</strong> Elastomers L.L.C. (reflected in “Equity in earnings<br />
of nonconsolidated affiliates” in the Plastics segment); goodwill<br />
impairment losses of $16 million related to investments in nonconsolidated<br />
affiliates (reflected in “Equity in earnings of nonconsolidated<br />
affiliates” in Unallocated and Other); and a $63 million gain<br />
on the sale of Oasis Pipe Line <strong>Company</strong> in the fourth quarter<br />
(reflected in “Sundry income—net” in the Hydrocarbons and<br />
Energy segment).<br />
Selling Price Index (2001=100)<br />
98 100<br />
99<br />
98<br />
00<br />
106<br />
01<br />
100<br />
02<br />
94<br />
Volume/Mix Index (2001=100)<br />
98 90<br />
99<br />
95<br />
00<br />
100<br />
01<br />
100<br />
02<br />
104<br />
EBIT for 2001 declined as the favorable impact of lower feedstock<br />
and energy costs of approximately $750 million was more<br />
than offset by the negative impact of lower selling prices of $1.6<br />
billion and lower equity earnings from joint ventures around the<br />
world. EBIT was further reduced in 2001 by the net impact of<br />
several unusual items: merger-related expenses and restructuring<br />
totaling $1.5 billion related to the Union Carbide merger, reflected<br />
in Unallocated and Other (see Note B to the Consolidated Financial<br />
Statements); a charge for IPR&D of $69 million associated with<br />
the acquisition of Rohm and Haas’ agricultural chemicals business,<br />
reflected in the Agricultural Sciences segment (see Note C to the<br />
Consolidated Financial Statements); an $11 million reinsurance<br />
loss on the World Trade Center (reflected in “Cost of sales” in<br />
> 28 <strong>The</strong> <strong>Dow</strong> <strong>Chemical</strong> <strong>Company</strong><br />
Unallocated and Other); <strong>Dow</strong>’s $11 million share of a restructuring<br />
charge recorded by <strong>Dow</strong> Corning (reflected in “Equity in earnings<br />
of nonconsolidated affiliates” in Unallocated and Other); and a<br />
$266 million gain on the sale of stock in Schlumberger Ltd. (reflected<br />
in “Sundry income—net” in Unallocated and Other). EBIT in 2001<br />
included the impact of goodwill amortization of $141 million. <strong>The</strong><br />
<strong>Company</strong> ceased amortizing goodwill upon adoption of SFAS No.<br />
142 on January 1, 2002 (see Notes A, F and T to the Consolidated<br />
Financial Statements).<br />
EBIT in 2000 was reduced $20 million by the net impact of several<br />
unusual items. <strong>The</strong>se items included a gain of $98 million on<br />
the sale of the Cochin pipeline system (reflected in “Sundry<br />
income—net” in the Hydrocarbons and Energy segment), offset by<br />
IPR&D costs of $6 million in the Performance Plastics segment<br />
related to the acquisition of Flexible Products, recognition of the<br />
anticipated $81 million loss on the disposition of certain businesses<br />
required for regulatory approval of the Union Carbide merger<br />
(reflected in “Sundry income—net” in Unallocated and Other), and a<br />
nonrecurring charge of $31 million from UOP related primarily to<br />
losses associated with certain customer contracts coupled with<br />
restructuring charges (reflected in “Equity in earnings of nonconsolidated<br />
affiliates” in the Performance Plastics segment). EBIT in<br />
2000 included the impact of goodwill amortization of $114 million.<br />
Gross margin for 2002 decreased $354 million versus 2001, as<br />
a $1.7 billion decline in selling prices more than offset the favorable<br />
impact of lower feedstock and energy costs of approximately $850<br />
million. Higher volume, cost control efforts and the realization of<br />
merger- and acquisition-related cost synergies reduced the negative<br />
impact of this margin compression. Gross margin for 2001<br />
decreased $1.3 billion compared with 2000. While feedstock and<br />
energy costs in 2001 were down approximately $750 million versus<br />
2000, selling prices fell $1.6 billion, drastically compressing<br />
margins. Gross margin in 2001 was also negatively impacted by<br />
lower operating rates.<br />
<strong>Dow</strong>’s global plant operating rate for its chemicals and plastics<br />
businesses was 78 percent of capacity in 2002, compared with 76<br />
percent in 2001 and 86 percent in 2000. <strong>The</strong> lower operating rates<br />
of the past two years reflect reduced run rates at several of<br />
the <strong>Company</strong>’s plants in an effort to manage inventory levels.<br />
Depreciation expense was $1,680 million in 2002, compared with<br />
$1,595 million in 2001 and $1,554 million in 2000.<br />
Operating Rate (percent)<br />
98 82%<br />
99<br />
87%<br />
00<br />
84%<br />
01<br />
76%<br />
02<br />
78%<br />
Operating expenses (research and development, and selling,<br />
general and administrative expenses) totaled $2,664 million in<br />
2002, down 6 percent from $2,837 million in 2001, and down<br />
almost 10 percent from $2,944 million in 2000, due to continued<br />
cost control efforts and the realization of merger- and acquisitionrelated<br />
cost synergies.<br />
Research and development (“R&D”) expenses were $1,066<br />
million in 2002, compared with $1,072 million in 2001 and $1,119<br />
million in 2000. R&D expenses declined over the past two years<br />
as merger-related cost synergies were realized and spending on<br />
growth initiatives was intensely focused on those opportunities<br />
with the greatest potential for value creation.
Management’s Discussion and Analysis of Financial Condition and Results of Operations<br />
Research and Development Expenses (in millions)<br />
98 $1,026<br />
99<br />
$1,075<br />
00<br />
$1,119<br />
01<br />
$1,072<br />
02<br />
$1,066<br />
Selling, general and administrative (“SG&A”) expenses were<br />
$1,598 million in 2002, down from $1,765 million in 2001 and $1,825<br />
million in 2000. SG&A expenses represented 6 percent of sales<br />
in all three years.<br />
Selling, General and Adminstrative Expenses (in millions)<br />
98 $1,964<br />
99<br />
$1,776<br />
00<br />
$1,825<br />
01<br />
$1,765<br />
02<br />
$1,598<br />
<strong>The</strong> following table illustrates the relative size of the primary<br />
components of total production costs and operating expenses of<br />
<strong>Dow</strong>. More information about each of these components can be<br />
found in other sections of Management’s Discussion and Analysis<br />
of Financial Condition and Results of Operations, Notes to the<br />
Consolidated Financial Statements, and Eleven-Year Summary of<br />
Selected Financial Data.<br />
Production Costs and Operating Expenses<br />
COST COMPONENTS AS A PERCENT OF TOTAL 2002 2001 2000<br />
Hydrocarbons and energy 29% 31% 34%<br />
Salaries, wages and employee benefits 14 13 14<br />
Maintenance 4 4 4<br />
Depreciation 6 6 6<br />
Merger-related expenses and restructuring,<br />
IPR&D and asbestos-related charge 4 5 –<br />
Supplies, services and other<br />
raw materials 43 41 42<br />
Total 100% 100% 100%<br />
During 2001, the <strong>Company</strong> completed the appraisal of the technology<br />
acquired with the purchase of Rohm and Haas’ agricultural<br />
chemicals business and recorded an IPR&D charge of $69 million<br />
in the Agricultural Sciences segment. See Notes B and C to the<br />
Consolidated Financial Statements for further details regarding<br />
the acquisition and IPR&D charge.<br />
During 2002, the <strong>Company</strong> recorded one-time merger and<br />
integration costs of $41 million and additional merger-related<br />
severance of $66 million. “Merger-related expenses and restructuring”<br />
also included the following charges in 2002: severance of<br />
$5 million related to a workforce reduction at <strong>Dow</strong> AgroSciences;<br />
and asset write-downs and impairments of $131 million and severance<br />
of $37 million related to restructuring activities undertaken by<br />
the <strong>Company</strong> following the appointment of a new President and<br />
CEO. Additional decisions on businesses and facilities are expected<br />
in 2003. See Note B to the Consolidated Financial Statements for<br />
additional information.<br />
During 2001, a special charge of $1.5 billion was recorded for<br />
merger-related expenses and restructuring, which included transaction<br />
costs, employee severance, the write-down of duplicate<br />
assets and facilities, and other merger-related expenses. At the<br />
time of the merger, the <strong>Company</strong> expected its integration plans<br />
and synergy activities to result in annual cost savings of $1.1 billion<br />
by the end of the first quarter of 2003. By the end of 2002, the<br />
<strong>Company</strong> had taken actions that will result in annual cost savings<br />
of $1.2 billion, exceeding the original target. <strong>The</strong> cost reductions<br />
will affect cost of sales, research and development expenses, and<br />
selling, general and administrative expenses. <strong>The</strong>se actions are not<br />
expected to have an impact on future revenues. For further details,<br />
see Note B to the Consolidated Financial Statements.<br />
In the fourth quarter of 2002, following the completion of a<br />
study to estimate the cost of resolving pending and potential<br />
future asbestos-related claims filed against Union Carbide and<br />
Amchem Products, Inc., the amount recorded for asbestos-related<br />
liabilities was increased to $2.2 billion, resulting in a charge of $828<br />
million after recording related insurance receivables. See Critical<br />
Accounting Policies, Asbestos-Related Matters of Union Carbide<br />
Corporation, and Note J to the Consolidated Financial Statements<br />
for additional information.<br />
<strong>Dow</strong>’s share of the earnings of nonconsolidated affiliates in<br />
2002 amounted to $40 million, up modestly from $29 million<br />
in 2001, but down significantly from $354 million in 2000. Current<br />
year equity earnings were higher than last year primarily due to<br />
improved earnings by <strong>Dow</strong> Corning and DuPont <strong>Dow</strong> Elastomers<br />
L.L.C., and the addition of earnings from <strong>Dow</strong> Reichhold Specialty<br />
Latex LLC, a newly formed joint venture between <strong>Dow</strong> and<br />
Reichhold, Inc. Equity earnings in 2001 were lower as a result of<br />
the consolidations of Gurit-Essex in the first quarter of 2001 and<br />
BSL in 2000, and the April 2001 divestiture of Union Carbide’s<br />
interest in Polimeri Europa S.r.l., which was required for regulatory<br />
approval of the merger (see Note C to the Consolidated Financial<br />
Statements). Equity earnings in 2000 reflected improved earnings<br />
in several of the <strong>Company</strong>’s joint ventures around the world,<br />
including strong performance by several plastics joint ventures in<br />
Asia Pacific and Latin America, improved results from several<br />
hydrocarbons joint ventures in North America, final resolution of<br />
BSL matters related to the reconstruction period, and significantly<br />
better performance by Union Carbide’s joint ventures in Kuwait<br />
and Europe.<br />
Through May 2000, equity earnings included the <strong>Company</strong>’s<br />
share of the financial results of BSL during the reconstruction period.<br />
On June 1, 2000, BSL became a wholly owned subsidiary of the<br />
<strong>Company</strong>, after which the financial results of BSL were fully consolidated<br />
(see Note C to the Consolidated Financial Statements).<br />
From the first quarter of 1995 through the third quarter of 2000,<br />
the <strong>Company</strong> recorded and reserved its share of equity earnings in<br />
<strong>Dow</strong> Corning due to <strong>Dow</strong> Corning’s filing for bankruptcy protection<br />
under Chapter 11 and the uncertainty of the recovery of that asset.<br />
Following Judge Denise Page Hood’s November 13, 2000 affirmation<br />
of the Bankruptcy Court’s order confirming the Joint Plan of<br />
Reorganization, the <strong>Company</strong> reviewed the value of its investment<br />
in <strong>Dow</strong> Corning and revised its assessment of the recoverability<br />
of its investment. In the fourth quarter of 2000, the <strong>Company</strong><br />
resumed recording its share of <strong>Dow</strong> Corning’s earnings. See Notes<br />
G and J to the Consolidated Financial Statements for additional<br />
information on this matter.<br />
<strong>The</strong> <strong>Dow</strong> <strong>Chemical</strong> <strong>Company</strong> 29 >
Management’s Discussion and Analysis of Financial Condition and Results of Operations<br />
Sundry income includes a variety of income and expense items<br />
such as the gain or loss on foreign currency exchange, dividends<br />
from investments, and gains and losses on sales of investments<br />
and assets. Sundry income for 2002 was $54 million, compared<br />
with $394 million in 2001 and $352 million in 2000. Sundry income<br />
in 2002 included a gain of $63 million on the sale of Oasis Pipe Line<br />
<strong>Company</strong> in the fourth quarter. Sundry income in 2001 included a<br />
gain of $266 million on the sale of stock in Schlumberger Ltd.<br />
Personnel count was 49,959 at December 31, 2002; 52,689<br />
at the end of 2001 and 53,289 at the end of 2000. Headcount<br />
decreased primarily due to the <strong>Company</strong>’s merger-related workforce<br />
reduction program.<br />
Net Income<br />
“Net income (loss) available for common stockholders” in 2002<br />
was a net loss of $338 million, a loss of $0.37 per share, compared<br />
with a net loss of $385 million, a loss of $0.43 per share in 2001,<br />
and net income of $1.7 billion, earnings of $1.85 per share in 2000.<br />
Results for 2002 were negatively impacted by a $1.7 billion decline<br />
in selling prices that exceeded the favorable impact of lower feedstock<br />
and energy costs of approximately $850 million and the realization<br />
of merger- and acquisition-related cost synergies. Results<br />
for 2001 were negatively impacted by lower selling prices of $1.6<br />
billion, which far exceeded the favorable impact of lower feedstock<br />
and energy costs of approximately $750 million, and several<br />
unusual items. In addition to the unusual items for 2002 and 2001<br />
discussed in the preceding section, the net losses for 2002 and<br />
2001 were impacted by changes in accounting principles. In 2002,<br />
an after-tax transition adjustment gain of $67 million was recognized<br />
related to the adoptions of SFAS No. 141, “Business<br />
Combinations” and SFAS No. 142, “Goodwill and Other Intangible<br />
Assets.” In 2001, an after-tax transition adjustment gain of $32<br />
million was recognized related to the adoption of SFAS No. 133,<br />
“Accounting for Derivative Instruments and Hedging Activities.”<br />
See Note A to the Consolidated Financial Statements for additional<br />
information regarding changes in accounting principles.<br />
<strong>The</strong> following table summarizes the impact of unusual items on EBIT and net income (loss):<br />
> 30 <strong>The</strong> <strong>Dow</strong> <strong>Chemical</strong> <strong>Company</strong><br />
Net Income (Loss) Available for Common Stockholders (in millions)<br />
98 $1,707<br />
99<br />
$1,617<br />
00<br />
$1,675<br />
01<br />
$(385)<br />
02<br />
$(338)<br />
Interest income in 2002 was $66 million, compared with $85<br />
million in 2001 and $146 million in 2000. <strong>The</strong> decline in interest<br />
income reflects a decrease in short-term investment activity.<br />
Interest expense (net of capitalized interest) and amortization of<br />
debt discount totaled $774 million in 2002, compared with $733<br />
million in 2001 and $665 million in 2000. Interest expense was up<br />
versus 2001 due to an increase in total debt partially offset by<br />
lower interest rates. Interest expense was lower in 2000 due<br />
principally to lower average levels of borrowing.<br />
<strong>The</strong> credit for income taxes was $280 million in 2002 versus a<br />
credit of $228 million in 2001 and provision of $839 million in 2000.<br />
<strong>Dow</strong>’s overall effective tax rate was 45 percent in 2002, compared<br />
with 37.2 percent for 2001 and 32.4 percent for 2000. U.S. and<br />
other tax law and rate changes during 2002 did not have a material<br />
impact on <strong>Dow</strong>. <strong>The</strong> underlying factors affecting <strong>Dow</strong>’s overall<br />
effective tax rates are summarized in Note S to the Consolidated<br />
Financial Statements.<br />
Minority interests’ share of net income in 2002 was $63 million,<br />
up from $32 million in 2001, and down from $72 million in 2000.<br />
<strong>The</strong> increase in minority interest was primarily due to improved<br />
results at PBBPolisur S.A., which had lower results in 2001 that<br />
corresponded with the lower results in <strong>Dow</strong>’s Plastics businesses.<br />
EBIT NET INCOME (LOSS)<br />
IN MILLIONS 2002 2001 2000 2002 2001 2000<br />
Unusual items:<br />
Merger-related expenses and restructuring $ (280) $(1,487) – $(182) $(992) –<br />
Asbestos-related charge (828) – – (522) – –<br />
Purchased in-process R&D – (69) $ (6) – (43) $ (6)<br />
Reinsurance loss on WTC – (11) – – (8) –<br />
<strong>Dow</strong> Corning restructuring – (11) – – (11) –<br />
UOP restructuring (10) – (31) (7) – (23)<br />
DuPont <strong>Dow</strong> Elastomers restructuring (8) – – (8) – –<br />
Goodwill impairment losses<br />
in nonconsolidated affiliates (16) – – (16) – –<br />
Gain on sale of Schlumberger stock – 266 – – 168 –<br />
Gain on sale of Oasis Pipe Line 63 – – 40 – –<br />
Gain on sale of Cochin Pipeline – – 98 – – 62<br />
Recognition of anticipated loss on disposition<br />
of merger-related businesses – – (81) – – (55)<br />
Cumulative effect of changes in accounting principles – – – 67 32 –<br />
Total unusual items $(1,079) $(1,312) $ (20) $(628) $(854) $ (22)<br />
As reported $ 86 $ 35 $3,105 $(338) $(385) $1,675<br />
Excluding unusual items $ 1,165 $1,347 $3,125 $ 290 $ 469 $1,697
Management’s Discussion and Analysis of Financial Condition and Results of Operations<br />
Liquidity and Capital Resources<br />
<strong>The</strong> <strong>Company</strong>’s cash flows from operating, investing and financing<br />
activities, as reflected in the Consolidated Statements of Cash<br />
Flows, are summarized in the following table:<br />
IN MILLIONS 2002 2001 2000<br />
Cash provided by (used in):<br />
Operating activities $ 2,108 $1,789 $ 1,691<br />
Investing activities (1,626) (2,674) (1,094)<br />
Financing activities 787 831 (857)<br />
Effect of exchange rate<br />
changes on cash (5) (4) (9)<br />
Net change in cash and<br />
cash equivalents $ 1,264 $ (58) $ (269)<br />
Cash provided by operating activities in 2002 increased versus<br />
2001 due to a number of factors. Accounts payable increased and<br />
inventories decreased due to the <strong>Company</strong>’s efforts to optimize<br />
working capital. Trade accounts receivable balances increased due<br />
to improved sales in the fourth quarter of 2002 compared with<br />
the fourth quarter of 2001. Cash provided by operating activities<br />
in 2001 increased versus 2000 as the impact of lower receivables<br />
and inventories offset the impact of lower earnings for the year.<br />
Accounts receivable balances decreased in 2001 due to lower net<br />
trade sales and increased sales of U.S. trade receivables. Inventory<br />
balances at December 31, 2001, (excluding the impact of acquisitions<br />
and divestitures) decreased due to lower feedstock costs<br />
compared with year-end 2000.<br />
Cash used in investing activities decreased in 2002 compared<br />
with 2001 due to a number of factors. Cash used for acquisitions<br />
decreased, but was partially offset by an increase in cash used<br />
for purchases of available-for-sale securities in excess of sales of<br />
similar securities. Cash used in investing activities increased in<br />
2001 compared with 2000, principally due to $2.3 billion invested<br />
in acquisitions, including Rohm and Haas’ agricultural chemicals<br />
business, Ascot, Gurit-Essex, and EniChem’s polyurethanes business,<br />
offset by lower capital expenditures and investments in<br />
nonconsolidated affiliates.<br />
Cash provided by financing activities decreased in 2002 compared<br />
with 2001. An increase in net cash generated from shortand<br />
long-term borrowings was partially offset by an increase in<br />
dividends paid in 2002. In addition, cash was generated in 2001<br />
from the issuance of preferred securities by a new subsidiary.<br />
Cash provided by financing activities in 2001 increased compared<br />
with 2000 also due to an increase in net cash generated from<br />
short- and long-term borrowings. Cash used in financing activities<br />
in 2000 related principally to the payment of dividends.<br />
Working Capital at December 31<br />
IN MILLIONS 2002 2001<br />
Current assets $11,681 $10,308<br />
Current liabilities 8,856 8,125<br />
Working capital $ 2,825 $ 2,183<br />
Current ratio 1.32:1 1.27:1<br />
Working Capital (in millions)<br />
98 $1,570<br />
99<br />
$2,848<br />
00<br />
$1,150<br />
01<br />
$2,183<br />
02<br />
$2,825<br />
Cash, cash equivalents, marketable securities and interest-bearing<br />
deposits increased $1.3 billion in 2002. At December 31, 2002,<br />
total inventories were $4.2 billion, down from $4.4 billion at<br />
December 31, 2001, primarily due to the <strong>Company</strong>’s supply chain<br />
optimization efforts. Days-sales-in-inventory at December 31,<br />
2002 were 64 days versus 77 days at December 31, 2001. At<br />
December 31, 2002, trade receivables were $3.1 billion, up from<br />
$2.9 billion last year. Days-sales-outstanding-in-receivables (excluding<br />
the impact of sales of receivables) were 45 days at December 31,<br />
2002 and 50 days at December 31, 2001.<br />
Short-term borrowings of $580 million at December 31, 2002<br />
were down from $1.2 billion at year-end 2001, primarily due to the<br />
issuance of long-term debt. Long-term debt due within one year<br />
was $797 million compared with $408 million at year-end 2001.<br />
Long-term debt at year-end was $11.7 billion, up from $9.3 billion<br />
at year-end 2001 due to the refinancing of short-term borrowings<br />
and new long-term debt that was used for general corporate<br />
purposes. During the year, $2.9 billion of new long-term debt was<br />
incurred and $472 million of long-term debt was retired. See the<br />
“Contractual Obligations” table presented later in this section for<br />
information regarding <strong>Dow</strong>’s annual installments on long-term debt.<br />
Total debt was $13 billion at year-end compared with $10.9 billion<br />
at December 31, 2001. Net debt, which equals total debt less<br />
cash, cash equivalents, marketable securities and interest-bearing<br />
deposits, was $11.5 billion at December 31, 2002, up from $10.6<br />
billion last year due to the use of funds for general corporate<br />
purposes. Gross debt as a percent of total capitalization was 59.2<br />
percent at the end of 2002, compared with 48.9 percent at year-end<br />
2001. Net debt as a percent of total capitalization was 56.0 percent<br />
at the end of 2002, compared with 48.3 percent at year-end 2001.<br />
Debt as a Percent of Total Capitalization<br />
98 43.6%<br />
99<br />
42.2%<br />
00<br />
42.5%<br />
01<br />
48.9%<br />
02<br />
59.2%<br />
As part of its ongoing financing activities, <strong>Dow</strong> routinely issues<br />
promissory notes under its U.S. and Euromarket commercial paper<br />
programs. At December 31, 2002, there were no outstanding commercial<br />
paper borrowings. In the event <strong>Dow</strong> is unable to access<br />
these short-term markets, due to a systemic market disruption or<br />
other extraordinary events, <strong>Dow</strong> has the ability to access liquidity<br />
through its committed and available credit facilities which are in<br />
excess of $3 billion.<br />
<strong>The</strong> <strong>Dow</strong> <strong>Chemical</strong> <strong>Company</strong> 31 >
Management’s Discussion and Analysis of Financial Condition and Results of Operations<br />
Liquidity and Capital Resources (continued)<br />
During the year, the <strong>Company</strong> completed two shelf registrations<br />
for the issuance of SEC registered securities. On September 12,<br />
2002, a $1.5 billion registration became effective, and on<br />
December 18, 2002, a $2 billion registration became effective. At<br />
December 31, 2002, there was a total of $2.3 billion available<br />
in SEC registered securities, as well as Japanese yen 70 billion<br />
(approximately $583 million) available in yen-denominated securities<br />
through the Japanese Ministry of Finance, and Euro 900 million<br />
(approximately $942 million) available under the <strong>Company</strong>’s Euro<br />
Medium-Term Note Program. On June 21, 2002, the <strong>Company</strong><br />
launched a retail Medium-Term Note Program. As of December 31,<br />
2002, $460 million of notes had been issued under this program,<br />
with maturity dates ranging from 2005 through 2012.<br />
At December 31, 2002, the <strong>Company</strong> had unused and committed<br />
credit facilities with various U.S. and foreign banks totaling $3.1 billion<br />
in support of its working capital requirements and commercial<br />
paper borrowings. <strong>The</strong>se facilities include a $1.75 billion 364-day<br />
revolving credit facility agreement that matures in June 2003, a<br />
$1.25 billion 5-year revolving credit facility agreement that matures<br />
in June 2004, and a $75 million 364-day bilateral facility with a<br />
major financial institution that matures in June 2003. <strong>The</strong> <strong>Company</strong><br />
intends to renew these facilities at their respective maturities.<br />
Additional unused and uncommitted credit facilities totaling $857<br />
million were available for use by foreign subsidiaries.<br />
<strong>Dow</strong>’s public debt instruments and documents for its private<br />
funding transactions contain, among other provisions, certain<br />
covenants and default provisions. See Note K to the Consolidated<br />
Financial Statements for information on such covenants and<br />
default provisions.<br />
Contractual Obligations at December 31, 2002<br />
> 32 <strong>The</strong> <strong>Dow</strong> <strong>Chemical</strong> <strong>Company</strong><br />
<strong>Dow</strong> leases real property, railcars, and certain manufacturing<br />
facilities from various special purpose entities. <strong>The</strong>se entities are<br />
not owned directly or indirectly by the <strong>Company</strong> or any of its<br />
directors, officers or employees. Those transactions that meet the<br />
requirements for operating lease treatment under SFAS No. 13,<br />
“Accounting for Leases,” are recorded as such and are disclosed<br />
in Note M to the Consolidated Financial Statements, including<br />
information regarding future minimum lease commitments. Nine<br />
of the entities qualify as variable interest entities (“VIEs”) under<br />
FASB Interpretation (“FIN”) No. 46, “Consolidation of Variable<br />
Interest Entities.” Based on the current terms of the lease agreements<br />
and the residual value guarantees <strong>Dow</strong> provides to the<br />
lessors, the <strong>Company</strong> expects to be the primary beneficiary of the<br />
VIEs. As a result, if the facts and circumstances remain the same,<br />
the <strong>Company</strong> would be required to consolidate the assets and<br />
liabilities held by these VIEs in the third quarter of 2003.<br />
<strong>The</strong> <strong>Company</strong> has not determined the carrying amount of<br />
the assets that will be included in the Consolidated Financial<br />
Statements. Accordingly, the <strong>Company</strong> has not yet determined<br />
the impact of adoption of FIN No. 46. <strong>The</strong> following table provides<br />
the approximate amount of debt of the VIEs described above at<br />
December 31, 2002 and 2001:<br />
IN MILLIONS LEASE MATURITIES 2002 2001<br />
Manufacturing facilities 2006–2017 $1,032 $ 917<br />
Railcars 2004–2008 418 402<br />
Real property 2005 133 133<br />
Total $1,583 $1,452<br />
Upon termination or expiration of each lease, <strong>Dow</strong> may return<br />
the assets to the lessor, renew the lease, or purchase the assets<br />
for an amount based on a fair market value determination. <strong>Dow</strong> had<br />
provided residual value guarantees totaling $1,694 million, which<br />
included $1,365 million related to VIEs, at December 31, 2002 and<br />
$1,566 million, which included $1,242 million related to VIEs, at<br />
December 31, 2001, to the various lessors. Given the productive<br />
nature of the assets, it is probable they will have continuing<br />
value to <strong>Dow</strong> or another manufacturer in excess of the residual<br />
value guarantees.<br />
<strong>The</strong> following table summarizes the <strong>Company</strong>’s contractual obligations<br />
and commercial commitments at December 31, 2002.<br />
Additional information related to these obligations can be found in<br />
Notes J, K and M to the Consolidated Financial Statements.<br />
PAYMENTS DUE BY YEAR<br />
IN MILLIONS 2003 2004 2005 2006 2007 AND BEYOND TOTAL<br />
Annual installments on long-term debt (1) $ 797 $1,102 $ 598 $1,134 $1,177 $ 7,648 $12,456<br />
Minimum operating lease commitments 260 235 206 150 80 816 1,747<br />
Purchase commitments 556 511 472 408 407 2,041 4,395<br />
Total $1,613 $1,848 $1,276 $1,692 $1,664 $10,505 $18,598<br />
(1) Includes capital lease obligations of $42 million in “2008 and beyond.”<br />
2008
Management’s Discussion and Analysis of Financial Condition and Results of Operations<br />
<strong>The</strong> <strong>Company</strong> also had outstanding guarantees at December 31,<br />
2002. Additional information related to these guarantees can be<br />
found in the “Guarantees” table provided in Note J to the<br />
Consolidated Financial Statements.<br />
Outlook for 2003<br />
During the second half of 2002, the <strong>Company</strong> took advantage of<br />
historically low interest rates by issuing additional long-term debt.<br />
Proceeds from the debt issuance were used to reduce short-term<br />
borrowings and prefund cash requirements for debt payments due<br />
in 2003. On January 31, 2003, Moody’s Investor Services reaffirmed<br />
the <strong>Company</strong>’s senior unsecured debt rating of “A3” and its<br />
short-term debt rating of “Prime-2,” but changed its ratings outlook<br />
to “negative.” On February 3, 2003, Fitch, Inc. lowered the<br />
<strong>Company</strong>’s senior unsecured debt rating from “A” to “A-” and its<br />
short-term debt rating from “F1” to “F2” and maintained its rating<br />
outlook as “negative.” <strong>The</strong> <strong>Company</strong> does not expect its ability to<br />
access credit facilities to be affected as a result of these changes,<br />
although the <strong>Company</strong> may incur higher borrowing costs.<br />
In the fourth quarter of 2002, the <strong>Company</strong> announced a plan<br />
designed to reduce overall spending in 2003. <strong>The</strong> plan includes a<br />
25 percent reduction in overall capital expenditures from 2002<br />
levels, a reduction in structural costs of $400 million from 2002<br />
levels, the divestiture of non-strategic and under-performing<br />
assets, and the shutdown of assets that are underutilized or noncompetitive.<br />
Other than those activities necessary to maintain the<br />
reliability and safety of plants, corporate initiatives have been delayed<br />
or canceled. This program is expected to improve overall cash flow<br />
by $1 billion through 2003. As a result, the <strong>Company</strong> expects to have<br />
overall positive cash flow in 2003, and expects to fund operations,<br />
capital expenditures and dividends from operating activities.<br />
Capital Expenditures<br />
Capital spending for the year was $1.6 billion, essentially flat with<br />
spending in 2001 and down 10 percent from $1.8 billion in 2000.<br />
<strong>The</strong> lower capital spending in 2002 and 2001 reflected the completion<br />
of a new ethylene facility built jointly with NOVA <strong>Chemical</strong>s<br />
Corporation and a polyethylene project, both of which started up in<br />
the second half of 2000, in Alberta, Canada. In 2002, approximately<br />
43 percent of the <strong>Company</strong>’s capital expenditures was directed<br />
toward additional capacity for new and existing products, compared<br />
with 40 percent in 2001. Approximately 18 percent was committed<br />
to projects related to environmental protection, safety, loss prevention<br />
and industrial hygiene in 2002 and 2001. <strong>The</strong> remaining capital<br />
was utilized to maintain the <strong>Company</strong>’s existing asset base, including<br />
projects related to productivity improvements, energy conservation<br />
and facilities support.<br />
Major projects underway during 2002 included expansion of<br />
production facilities for EDC and polymeric MDI in Freeport, Texas;<br />
chlorine and Methocel cellulose ethers in Stade, Germany; and<br />
ABS and latex in Terneuzen, <strong>The</strong> Netherlands. Additional major<br />
projects included installation of a brine pipeline in White Castle,<br />
Louisiana and a hazardous waste incineration kiln in Midland,<br />
Michigan. Because the <strong>Company</strong> designs and builds most of its<br />
capital projects in-house, it had no material capital commitments<br />
other than for the purchase of materials from fabricators.<br />
Capital Expenditures (in millions)<br />
98 $2,328<br />
99<br />
$2,176<br />
00<br />
$1,808<br />
01<br />
$1,587<br />
02<br />
$1,623<br />
Dividends<br />
On February 13, 2003, the Board of Directors announced a quarterly<br />
dividend of $0.335 per share, payable April 30, 2003, to stockholders<br />
of record on March 28, 2003. Since 1912, the <strong>Company</strong> has paid a<br />
dividend every quarter and in each instance <strong>Dow</strong> has maintained or<br />
increased the quarterly dividend. <strong>The</strong> <strong>Company</strong> declared dividends<br />
of $1.34 per share in 2002, $1.295 per share in 2001 and $1.16 per<br />
share in 2000.<br />
OTHER MATTERS<br />
ACCOUNTING CHANGES<br />
See Note A to the Consolidated Financial Statements for a discussion<br />
of accounting changes and recently issued accounting<br />
pronouncements.<br />
CRITICAL ACCOUNTING POLICIES<br />
<strong>The</strong> preparation of financial statements and related disclosures in<br />
conformity with accounting principles generally accepted in the<br />
United States of America (“GAAP”) requires management to make<br />
judgments, assumptions and estimates that affect the amounts<br />
reported in the Consolidated Financial Statements and accompanying<br />
notes. Note A to the Consolidated Financial Statements<br />
describes the significant accounting policies and methods used in<br />
the preparation of the Consolidated Financial Statements.<br />
Following are the <strong>Company</strong>’s critical accounting policies impacted<br />
by judgments, assumptions and estimates:<br />
Litigation<br />
<strong>The</strong> <strong>Company</strong> is subject to legal proceedings and claims arising out<br />
of the normal course of business. <strong>The</strong> <strong>Company</strong> routinely assesses<br />
the likelihood of any adverse judgments or outcomes to these<br />
matters, as well as ranges of probable losses. A determination of<br />
the amount of the reserves required, if any, for these contingencies<br />
is made after thoughtful analysis of each known issue and an<br />
analysis of historical claims experience for incurred but not reported<br />
matters. <strong>Dow</strong> has an active risk management program consisting<br />
of numerous insurance policies secured from many carriers. <strong>The</strong>se<br />
policies provide coverage that is utilized to minimize the impact, if<br />
any, of the legal proceedings. <strong>The</strong> required reserves may change in<br />
the future due to new developments in each matter. For further<br />
discussion, see Note J to the Consolidated Financial Statements.<br />
<strong>The</strong> <strong>Dow</strong> <strong>Chemical</strong> <strong>Company</strong> 33 >
Management’s Discussion and Analysis of Financial Condition and Results of Operations<br />
CRITICAL ACCOUNTING POLICIES (continued)<br />
Asbestos-Related Matters of Union Carbide Corporation<br />
Union Carbide Corporation (“Union Carbide”), a wholly owned<br />
subsidiary of the <strong>Company</strong>, is and has been involved in a large<br />
number of asbestos-related suits filed primarily in state courts<br />
during the past three decades. At the end of 2001 and through the<br />
third quarter of 2002, Union Carbide had concluded it was not<br />
possible to estimate its cost of disposing of asbestos-related<br />
claims that might be filed against Union Carbide and Amchem<br />
Products, Inc. (“Amchem”) in the future due to a number of reasons,<br />
including its lack of sufficient comparable loss history from which<br />
to assess either the number or value of future asbestos-related<br />
claims. During the third and fourth quarters of 2002, Union Carbide<br />
worked with Analysis, Research & Planning Corporation (“ARPC”),<br />
a consulting firm with broad experience in estimating resolution<br />
costs associated with mass tort litigation, including asbestos, to<br />
explore whether it would be possible to estimate the cost of disposing<br />
of pending and future asbestos-related claims that have<br />
been, and could reasonably be expected to be, filed against Union<br />
Carbide and Amchem.<br />
In projecting Union Carbide’s resolution costs for future<br />
asbestos-related claims, ARPC applied two methodologies that<br />
have been widely used for forecasting purposes. As of December 31,<br />
2002, ARPC estimated the undiscounted cost of resolving pending<br />
and future asbestos-related claims against Union Carbide and<br />
Amchem, excluding future defense and processing costs, for the<br />
15-year period from the present through 2017 to be between<br />
approximately $2.2 billion and $2.4 billion, depending on which of<br />
the two accepted methodologies was used.<br />
Although ARPC provided estimates for a longer period of time,<br />
based on ARPC’s advice that forecasts for shorter periods of time<br />
are more accurate and in light of the uncertainties inherent in making<br />
long-term projections, Union Carbide determined that the 15-year<br />
period through 2017 is the reasonable time period for projecting<br />
the cost of disposing of its future asbestos-related claims. Union<br />
Carbide concluded that it is probable that the undiscounted cost of<br />
disposing of asbestos-related pending and future claims ranges<br />
from $2.2 billion to $2.4 billion, which is the range for the 15-year<br />
period ending in 2017 as estimated by ARPC using both methodologies.<br />
Accordingly, Union Carbide increased its asbestos-related<br />
liability for pending and future claims at December 31, 2002 to $2.2<br />
billion, excluding future defense and processing costs. For pending<br />
claims, Union Carbide had an asbestos-related liability of $233 million<br />
at December 31, 2001.<br />
Union Carbide also increased the receivable for insurance<br />
recoveries related to its asbestos liability to $1.35 billion at<br />
December 31, 2002. Union Carbide’s receivable for insurance<br />
recoveries related to its asbestos liability was $223 million at<br />
December 31, 2001. In addition, Union Carbide had receivables for<br />
insurance recoveries for defense and resolution costs of $219 million<br />
at December 31, 2002 and $35 million at December 31, 2001. <strong>The</strong><br />
amounts recorded by Union Carbide for the asbestos-related liability<br />
and related insurance receivable described above were based<br />
upon currently known facts. However, projecting future events,<br />
such as the number of new claims to be filed each year, the average<br />
cost of disposing of each such claim, coverage issues among<br />
insurers, and the continuing solvency of various insurance companies,<br />
as well as the numerous uncertainties surrounding asbestos<br />
> 34 <strong>The</strong> <strong>Dow</strong> <strong>Chemical</strong> <strong>Company</strong><br />
litigation in the United States, could cause the actual costs and<br />
insurance recoveries for Union Carbide to be higher or lower than<br />
those projected or those recorded. Union Carbide expenses<br />
defense and processing costs as incurred. Accordingly, defense<br />
and processing costs incurred by Union Carbide in the future for<br />
asbestos-related litigation, net of insurance, will impact Union<br />
Carbide’s results of operations in future periods. For additional<br />
information, see Asbestos-Related Matters of Union Carbide<br />
Corporation in Management’s Discussion and Analysis of<br />
Financial Condition and Results of Operations and Note J to the<br />
Consolidated Financial Statements.<br />
Environmental Matters<br />
<strong>The</strong> <strong>Company</strong> determines the costs of environmental remediation<br />
of its facilities and formerly owned facilities based on evaluations<br />
of current law and existing technologies. Inherent uncertainties<br />
exist in such evaluations primarily due to unknown conditions,<br />
changing governmental regulations and legal standards regarding<br />
liability, and evolving technologies. <strong>The</strong> recorded liabilities are<br />
adjusted periodically as remediation efforts progress or as additional<br />
technical or legal information becomes available. <strong>The</strong> <strong>Company</strong><br />
had accrued obligations of $444 million at December 31, 2001, for<br />
environmental remediation and restoration costs, including $47<br />
million for the remediation of Superfund sites. At December 31,<br />
2002, the <strong>Company</strong> had accrued obligations of $394 million for<br />
environmental remediation and restoration costs, including $43<br />
million for the remediation of Superfund sites. This is management’s<br />
best estimate of the costs for remediation and restoration<br />
with respect to environmental matters for which the <strong>Company</strong> has<br />
accrued liabilities, although the ultimate cost with respect to these<br />
particular matters could range up to twice that amount. For further<br />
discussion, see Environmental Matters in Management’s Discussion<br />
and Analysis of Financial Condition and Results of Operations<br />
and Note J to the Consolidated Financial Statements.<br />
Merger-Related Expenses and Restructuring<br />
On February 6, 2001, Union Carbide Corporation merged with a<br />
subsidiary of the <strong>Company</strong> and became a wholly owned subsidiary<br />
of <strong>Dow</strong>. On March 29, 2001, <strong>Dow</strong>’s management made certain<br />
decisions relative to employment levels, duplicate assets and<br />
facilities and excess capacity resulting from the Union Carbide<br />
merger. <strong>The</strong>se decisions were based on management’s assessment<br />
of the actions necessary to achieve synergies as a result of<br />
the merger. <strong>The</strong> economic effects of these decisions, combined<br />
with merger-related transaction costs and certain asset impairments,<br />
resulted in a pretax special charge of $1,384 million in<br />
the first quarter of 2001. Subsequent periodic reviews of the<br />
<strong>Company</strong>’s integration plans resulted in minor revisions to the<br />
reserve. <strong>The</strong> planned merger-related program for workforce<br />
reductions was substantially completed in the third quarter of<br />
2002, although during the fourth quarter of 2002, an additional<br />
charge was recorded for merger-related severance to be paid in the<br />
first quarter of 2003. Upon completion of the program, the outstanding<br />
merger-related reserve for employee-related costs associated<br />
with pension and postretirement benefit plans became part of the<br />
<strong>Company</strong>’s regular pension and other postretirement obligations.<br />
<strong>The</strong> reserve related to the abandonment of leased facilities is<br />
included in “Other noncurrent obligations.”
Management’s Discussion and Analysis of Financial Condition and Results of Operations<br />
In late 2002, immediately following the appointment of a new<br />
President and CEO, management began a series of studies to<br />
determine potential actions relative to under-performing assets<br />
and employment levels. Prior to the end of the year, certain studies<br />
were completed and management made decisions relative to certain<br />
assets. <strong>The</strong> economic effects of these decisions resulted in a pretax<br />
charge in the fourth quarter of 2002 of $168 million for severance<br />
and asset write-downs and impairments. <strong>The</strong> program for severance<br />
was based on plans communicated to employees, and is expected<br />
to be completed by the third quarter of 2003. <strong>The</strong> charge related to<br />
asset write-downs was based on the net book value of the manufacturing<br />
plants to be shut down. <strong>The</strong> charge related to asset<br />
impairments was determined using either discounted cash flows<br />
or a fair market value assessment.<br />
Additional decisions on businesses and facilities are expected in<br />
2003. <strong>The</strong> <strong>Company</strong> will account for future workforce reductions<br />
as they occur, in accordance with SFAS No. 146, “Accounting for<br />
Costs Associated with Exit or Disposal Activities.” For further discussion<br />
and information regarding merger-related expenses and<br />
restructuring, see Note B to the Consolidated Financial Statements.<br />
Pension and Other Postretirement Benefits<br />
<strong>The</strong> amounts recognized in the consolidated financial statements<br />
related to pension and other postretirement benefits are determined<br />
from actuarial valuations. Inherent in these valuations are<br />
assumptions including expected return on plan assets, discount<br />
rates at which the liabilities could be settled at December 31,<br />
2002, rate of increase in future compensation levels, mortality<br />
rates and health care cost trend rates. <strong>The</strong>se assumptions are<br />
updated annually and are disclosed in Note L to the Consolidated<br />
Financial Statements. In accordance with GAAP, actual results that<br />
differ from the assumptions are accumulated and amortized over<br />
future periods and, therefore, affect expense recognized and<br />
obligations recorded in future periods.<br />
<strong>The</strong> expected long-term rate of return on assets is developed<br />
with input from the <strong>Company</strong>’s actuarial firm, which includes the<br />
actuary’s review of the asset class return expectations of several<br />
respected consultants and economists, based on broad equity and<br />
bond indices. <strong>The</strong> <strong>Company</strong>’s historical experience with the pension<br />
fund asset performance and comparisons to expected returns of<br />
peer companies with similar fund assets is also considered. <strong>The</strong><br />
long-term rate of return assumption used for determining net<br />
periodic pension expense for 2002 was 9.25 percent. This<br />
assumption was reduced to 9 percent for determining 2003 net<br />
periodic pension expense. Lowering the expected long-term rate<br />
of return of the U.S. qualified plan assets by 0.25 percent (from<br />
9.25 percent to 9 percent) would have reduced the pension<br />
income of the U.S. qualified plans for 2002 by approximately $25<br />
million. <strong>The</strong> <strong>Company</strong>’s historical actual return averaged 9.1 percent<br />
for the ten-year period ending December 31, 2002. Future actual<br />
pension expense will depend on future investment performance,<br />
changes in future discount rates and various other factors related<br />
to the population of participants in the <strong>Company</strong>’s pension plans.<br />
<strong>The</strong> <strong>Company</strong> bases the determination of pension expense<br />
or income on a market-related valuation of plan assets, which<br />
reduces year-to-year volatility. This market-related valuation recognizes<br />
investment gains or losses over a five-year period from the<br />
year in which they occur. Investment gains or losses for this purpose<br />
represent the difference between the expected return calculated<br />
using the market-related value of plan assets and the actual return<br />
based on the market value of plan assets. Since the market-related<br />
value of plan assets recognizes gains or losses over a five-year<br />
period, the future value of plan assets will be impacted when previously<br />
deferred gains or losses are recorded. Over the life of the<br />
plan, both gains and losses have been recognized and amortized.<br />
For the year ending December 31, 2002, $1.2 billion of losses<br />
remain to be recognized by the U.S. qualified plans in the calculation<br />
of the market-related value of plan assets. <strong>The</strong>se losses will<br />
result in decreases in future pension income as they are recognized.<br />
<strong>The</strong> discount rate utilized for determining future pension obligations<br />
of the U.S. qualified plans is based on long-term bonds<br />
receiving an AA- or better rating by a recognized rating agency. <strong>The</strong><br />
resulting discount rate decreased from 7 percent at December 31,<br />
2001, to 6.75 percent at December 31, 2002.<br />
For 2003, the <strong>Company</strong> left its assumption for the long-term<br />
rate of increase in compensation levels for the U.S. qualified plans<br />
unchanged at 5 percent.<br />
Based on the revised pension assumptions and the actual<br />
investment performance of the plan assets in 2002, the <strong>Company</strong><br />
expects to record $100 million of incremental expense for all<br />
pension and other postretirement benefits in 2003.<br />
<strong>The</strong> value of the U.S. qualified plan assets decreased from $9.3<br />
billion at December 31, 2001, to $7.7 billion at December 31, 2002.<br />
<strong>The</strong> investment performance and declining discount rates reduced<br />
the funded status of the U.S. qualified plans, net of benefit obligations,<br />
by $2.2 billion from December 31, 2001 to December 31,<br />
2002. <strong>The</strong> <strong>Company</strong> does not expect significant cash contributions<br />
to be required for the U.S. qualified plans in 2003.<br />
Income Taxes<br />
Deferred tax assets and liabilities are determined using enacted tax<br />
rates for the effects of net operating losses and temporary differences<br />
between the book and tax bases of assets and liabilities.<br />
<strong>The</strong> <strong>Company</strong> records a valuation allowance on deferred tax assets<br />
when appropriate to reflect the expected future tax benefits to be<br />
realized. In determining the appropriate valuation allowance, certain<br />
judgments are made relating to recoverability of deferred tax assets,<br />
use of tax loss carryforwards, level of expected future taxable<br />
income and available tax planning strategies. <strong>The</strong>se judgments are<br />
routinely reviewed by management. At December 31, 2002, the<br />
<strong>Company</strong> had a net deferred tax asset balance of $2.9 billion, after<br />
valuation allowances of $645 million. For additional information,<br />
see Note S to the Consolidated Financial Statements.<br />
<strong>The</strong> <strong>Dow</strong> <strong>Chemical</strong> <strong>Company</strong> 35 >
Management’s Discussion and Analysis of Financial Condition and Results of Operations<br />
ENVIRONMENTAL MATTERS<br />
Environmental Policies<br />
<strong>Dow</strong> is committed to world-class environmental, health and safety<br />
(“EH&S”) performance, as demonstrated by a long-standing<br />
commitment to Responsible Care and progress made toward<br />
the <strong>Company</strong>’s EH&S Goals for 2005. In 1996, <strong>Dow</strong> publicly<br />
announced its voluntary global EH&S 2005 Goals—ambitious<br />
performance targets to measure progress toward sustainable<br />
development, including targets to reduce chemical emissions,<br />
waste and wastewater by 50 percent. Equally aggressive are<br />
<strong>Dow</strong>’s EH&S 2005 Goals to reduce leaks, spills, fires, explosions,<br />
work-related injuries and transportation incidents by 90 percent.<br />
<strong>Dow</strong> continues to work aggressively toward attainment of these<br />
goals and its “Vision of Zero.” More information on <strong>Dow</strong>’s performance<br />
regarding environmental matters can be found online in<br />
<strong>Dow</strong>’s 2001 Public Report.<br />
To meet the <strong>Company</strong>’s public commitments, as well as the<br />
stringent laws and government regulations related to environmental<br />
protection and remediation to which its global operations are subject,<br />
<strong>Dow</strong> has well-defined policies, requirements and management<br />
systems. <strong>Dow</strong>’s EH&S Management System (“EMS”) defines for<br />
the businesses the “who, what, when and how” needed to achieve<br />
the <strong>Company</strong>’s policies, requirements, performance objectives,<br />
leadership expectations and public commitments. EMS is also<br />
designed to minimize the long-term cost of environmental protection<br />
and to comply with these laws and regulations. Furthermore, EMS<br />
is integrated into a company-wide Management System for EH&S,<br />
Operations, Quality and Human Resources, including implementation<br />
of the global EH&S Work Process to improve EH&S performance<br />
and to ensure ongoing compliance worldwide. It is <strong>Dow</strong>’s<br />
stated EH&S policy that all global operations and products meet<br />
<strong>Dow</strong>’s requirements or their country’s laws and regulations,<br />
whichever are more stringent.<br />
It is also <strong>Dow</strong>’s policy to adhere to a waste management hierarchy<br />
that minimizes the impact of wastes and emissions on the<br />
environment. First, <strong>Dow</strong> works to eliminate or minimize the generation<br />
of waste and emissions at the source through research,<br />
process design, plant operations and maintenance. Second, <strong>Dow</strong><br />
finds ways to reuse and recycle materials. Finally, unusable or<br />
non-recyclable hazardous waste is treated before disposal to<br />
eliminate or reduce the hazardous nature and volume of the waste.<br />
Treatment may include destruction by chemical, physical, biological<br />
or thermal means. Disposal of waste materials in landfills is considered<br />
only after all other options have been thoroughly evaluated.<br />
<strong>Dow</strong> has specific requirements for wastes that are transferred to<br />
non-<strong>Dow</strong> facilities.<br />
<strong>Dow</strong> believes third-party verification is a cornerstone of worldclass<br />
EH&S performance and building public trust. Over the last<br />
five years, numerous <strong>Dow</strong> sites in Europe, Latin America, Australia<br />
and North America have received third-party verification of <strong>Dow</strong>’s<br />
compliance with Responsible Care and with outside specifications<br />
such as ISO-14001. In 2002, <strong>Dow</strong> received the American Chemistry<br />
Council’s Responsible Care Employee Health & Safety Code<br />
Sustained Excellence Award. <strong>The</strong> annual Sustained Excellence<br />
Award recognizes companies that have demonstrated outstanding<br />
safety records over a three-year period. This is the first time that<br />
any company from the “large” size category has been eligible for<br />
the award. For the fourth year in a row, <strong>Dow</strong> was also added to the<br />
<strong>Dow</strong> Jones Sustainability Group Index.<br />
> 36 <strong>The</strong> <strong>Dow</strong> <strong>Chemical</strong> <strong>Company</strong><br />
<strong>Dow</strong>’s EMS and EH&S Goals are designed to minimize environmental<br />
risks and impacts, both past and future. <strong>The</strong> following<br />
paragraphs outline some of these potential risks and how they<br />
are managed to minimize environmental impact and overall costs.<br />
Climate Change<br />
<strong>The</strong>re is growing political and scientific consensus that emissions<br />
of greenhouse gases (“GHG”) due to human activities continue<br />
to alter the composition of the global atmosphere in ways that<br />
are affecting the climate. <strong>Dow</strong> takes global climate change very<br />
seriously and is committed to reducing its GHG intensity (lbs. of<br />
GHG per lb. of product), developing climate-friendly products and<br />
processes, and, over the longer term, implementing technology<br />
solutions to achieve even greater climate change improvements.<br />
Since 1995, <strong>Dow</strong> has reduced GHG intensity by over 25 percent.<br />
Total direct emissions of GHG have also been significantly reduced.<br />
This trend could reverse, however, depending on business growth,<br />
capacity utilization and the pace of new technology development.<br />
Given the uncertainties regarding implementation of the Kyoto<br />
Protocol and related climate change policies, it is speculative to<br />
engage in an assessment of either the potential liability or benefit<br />
associated with climate change issues. As noted in the 2001 Public<br />
Report, <strong>Dow</strong> is making progress toward its 2005 goal to improve<br />
energy efficiency by 20 percent. By the time <strong>Dow</strong> achieves this<br />
goal, it will have avoided the production of over 290 trillion Btus,<br />
thus contributing in a positive way to climate change. <strong>Dow</strong> also<br />
contributes to the climate change solution by producing products<br />
that help others reduce GHG emissions, such as lightweight plastics<br />
for automobiles and insulation for energy efficient homes and<br />
appliances. <strong>Dow</strong> does not currently engage in emissions trading<br />
but is studying this concept and engaging in dialogue with governments<br />
about the development of fair and effective mechanisms to<br />
achieve GHG reductions at the lowest possible cost.<br />
Environmental Remediation<br />
<strong>Dow</strong> accrues the costs of remediation of its facilities and formerly<br />
owned facilities based on current law and existing technologies.<br />
<strong>The</strong> nature of such remediation includes, for example, the management<br />
of soil and groundwater contamination and the closure of<br />
contaminated landfills and other waste management facilities. In<br />
the case of landfills and other active waste management facilities,<br />
<strong>Dow</strong> recognizes the costs over the useful life of the facility. <strong>The</strong><br />
policies adopted to properly reflect the monetary impacts of environmental<br />
matters are discussed in Note A to the Consolidated<br />
Financial Statements. To assess the impact on the financial statements,<br />
environmental experts review currently available facts to<br />
evaluate the probability and scope of potential liabilities. Inherent<br />
uncertainties exist in such evaluations primarily due to unknown<br />
conditions, changing governmental regulations and legal standards<br />
regarding liability, and evolving technologies. <strong>The</strong>se liabilities are<br />
adjusted periodically as remediation efforts progress or as additional<br />
technical or legal information becomes available. <strong>Dow</strong> had an<br />
accrued liability of $351 million at December 31, 2002, related to<br />
the remediation of current or former <strong>Dow</strong>-owned sites. <strong>The</strong> liability<br />
related to remediation at December 31, 2001 was $397 million.<br />
<strong>The</strong> <strong>Company</strong> has not recorded any third-party recovery related to<br />
these sites as a receivable. <strong>Dow</strong> filed a lawsuit in November 1999<br />
against several of its insurers seeking recovery of remediation<br />
costs at certain current or former <strong>Dow</strong>-owned sites. Settlements<br />
have been reached with all carriers, except one.
Management’s Discussion and Analysis of Financial Condition and Results of Operations<br />
In addition to current and former <strong>Dow</strong>-owned sites, under the<br />
Federal Comprehensive Environmental Response, Compensation<br />
and Liability Act and equivalent state laws (hereafter referred to<br />
collectively as “Superfund Law”), <strong>Dow</strong> is liable for remediation of<br />
other hazardous waste sites where <strong>Dow</strong> allegedly disposed of, or<br />
arranged for the treatment or disposal of, hazardous substances.<br />
<strong>Dow</strong> readily cooperates in the remediation of these sites where<br />
the <strong>Company</strong>’s liability is clear, thereby minimizing legal and administrative<br />
costs. Because Superfund Law imposes joint and several<br />
liability upon each party at a site, <strong>Dow</strong> has evaluated its potential<br />
liability in light of the number of other companies that also have<br />
been named potentially responsible parties (“PRPs”) at each site,<br />
the estimated apportionment of costs among all PRPs, and the<br />
financial ability and commitment of each to pay its expected share.<br />
Management’s estimate of the <strong>Company</strong>’s remaining liability for<br />
the remediation of Superfund sites at December 31, 2002 was $43<br />
million, which has been accrued, although the ultimate cost with<br />
respect to these sites could exceed that amount. In addition,<br />
receivables of $12 million for probable recoveries from other PRPs<br />
have been recorded related to Superfund sites. At December 31,<br />
2001, the <strong>Company</strong>’s liability for the remediation of Superfund<br />
sites was $47 million; the receivable for probable recoveries from<br />
other PRPs was $7 million.<br />
In total, the <strong>Company</strong>’s accrued liability for probable environmental<br />
remediation and restoration costs was $394 million at<br />
December 31, 2002, compared with $444 million at the end of 2001.<br />
This is management’s best estimate of the costs for remediation and<br />
restoration with respect to environmental matters for which the<br />
<strong>Company</strong> has accrued liabilities, although the ultimate cost with<br />
respect to these particular matters could range up to twice that<br />
amount. It is the opinion of the <strong>Company</strong>’s management that<br />
the possibility is remote that costs in excess of those accrued or<br />
disclosed will have a material adverse impact on the <strong>Company</strong>’s<br />
consolidated financial statements.<br />
<strong>The</strong> amounts charged to income on a pretax basis related to<br />
environmental remediation totaled $52 million in 2002, $47 million<br />
in 2001 and $53 million in 2000. Capital expenditures for environmental<br />
protection were $147 million in 2002, $179 million in 2001<br />
and $166 million in 2000.<br />
ASBESTOS-RELATED MATTERS OF UNION CARBIDE CORPORATION<br />
Union Carbide Corporation (“Union Carbide”), a wholly owned<br />
subsidiary of the <strong>Company</strong>, is and has been involved in a large<br />
number of asbestos-related suits filed primarily in state courts during<br />
the past three decades. <strong>The</strong>se suits principally allege personal<br />
injury resulting from exposure to asbestos-containing products and<br />
frequently seek both actual and punitive damages, often in very<br />
large amounts. <strong>The</strong> alleged claims primarily relate to products<br />
that Union Carbide sold in the past, alleged exposure to asbestoscontaining<br />
products located on Union Carbide’s premises, and Union<br />
Carbide’s responsibility for asbestos suits filed against a former<br />
Union Carbide subsidiary, Amchem Products, Inc. (“Amchem”). In<br />
many cases, plaintiffs are unable to demonstrate that they have<br />
suffered any compensable loss as a result of such exposure, or<br />
that injuries incurred in fact resulted from exposure to Union<br />
Carbide’s products.<br />
<strong>The</strong> rate at which plaintiffs filed asbestos-related suits against<br />
various companies, including Union Carbide and Amchem,<br />
increased in both 2001 and 2002, influenced by the bankruptcy filings<br />
of numerous defendants in asbestos-related litigation. Union<br />
Carbide expects more asbestos-related suits to be filed against<br />
Union Carbide and Amchem in the future. Union Carbide will<br />
aggressively defend or reasonably resolve, as appropriate, both<br />
pending and future claims.<br />
Typically, Union Carbide is only one of many named defendants,<br />
many of which, including Union Carbide and Amchem, were members<br />
of the Center for Claims Resolution (“CCR”), an entity that<br />
defended and resolved asbestos cases on behalf of its members.<br />
As members of the CCR, Union Carbide’s and Amchem’s strategy<br />
was to resolve the claims against them at the relatively small<br />
percentage allocated to them pursuant to the CCR’s collective<br />
defense. <strong>The</strong> CCR ceased operating in February 2001, except to<br />
administer certain settlements. Union Carbide then began using<br />
Peterson Asbestos Claims Enterprise, but only for claims processing<br />
and insurance invoicing.<br />
Certain members of <strong>Dow</strong>’s legal department and certain <strong>Dow</strong><br />
management personnel have been retained to provide their experience<br />
in mass tort litigation to assist Union Carbide in responding<br />
to asbestos-related matters. In early 2002, Union Carbide hired<br />
new outside counsel to serve as national trial counsel. In connection<br />
with these actions, aggressive defense strategies were designed<br />
to reduce the cost of resolving all asbestos-related claims, including<br />
the elimination of claims that lack demonstrated illness or causality.<br />
At the end of 2001 and through the third quarter of 2002, Union<br />
Carbide had concluded it was not possible to estimate its cost of<br />
disposing of asbestos-related claims that might be filed against<br />
Union Carbide and Amchem in the future due to a number of reasons,<br />
including its lack of sufficient comparable loss history from<br />
which to assess either the number or value of future asbestosrelated<br />
claims. During the third and fourth quarters of 2002, Union<br />
Carbide worked with Analysis, Research & Planning Corporation<br />
(“ARPC”), a consulting firm with broad experience in estimating<br />
resolution costs associated with mass tort litigation, including<br />
asbestos, to explore whether it would be possible to estimate the<br />
cost of disposing of pending and future asbestos-related claims<br />
that have been, and could reasonably be expected to be, filed<br />
against Union Carbide and Amchem.<br />
Union Carbide provided ARPC with all relevant data regarding<br />
asbestos-related claims filed against Union Carbide and Amchem<br />
through November 6, 2002. ARPC concluded that it was not possible<br />
to estimate the full range of the cost of resolving future asbestosrelated<br />
claims against Union Carbide and Amchem, because of<br />
various uncertainties associated with the litigation of those claims.<br />
<strong>The</strong>se uncertainties, which hindered Union Carbide’s ability to project<br />
future claim volumes and resolution costs, included the following:<br />
• Until a series of bankruptcies led to the CCR ceasing<br />
operations in early 2001, Union Carbide and Amchem<br />
generally settled claims filed against CCR members according<br />
to a sharing formula that would not necessarily reflect the<br />
cost of resolving those claims had they been separately<br />
litigated against Union Carbide or Amchem.<br />
<strong>The</strong> <strong>Dow</strong> <strong>Chemical</strong> <strong>Company</strong> 37 >
Management’s Discussion and Analysis of Financial Condition and Results of Operations<br />
ASBESTOS-RELATED MATTERS OF UNION CARBIDE<br />
CORPORATION (continued)<br />
• <strong>The</strong> bankruptcies in the years 2000 to 2002 of other<br />
companies facing large asbestos liability were a likely<br />
contributing cause of a sharp increase in filings against<br />
many defendants, including Union Carbide and Amchem.<br />
• It was not until the CCR ceased operating in early 2001 that<br />
Union Carbide took direct responsibility for the defense of<br />
claims against itself and Amchem.<br />
•New defense counsel for Union Carbide and Amchem<br />
implemented more aggressive defense strategies in mid-2002.<br />
Despite its inability to estimate the full range of the cost of<br />
resolving future asbestos-related claims, ARPC advised Union<br />
Carbide that it would be possible to determine an estimate of a<br />
reasonable forecast of the cost of resolving pending and future<br />
asbestos-related claims likely to face Union Carbide and Amchem,<br />
if certain assumptions were made. Specifically, ARPC advised<br />
Union Carbide that for purposes of determining an estimate it is<br />
reasonable to assume that in the near term asbestos-related<br />
claims filed against Union Carbide and Amchem are unlikely to<br />
return to levels below those experienced prior to 2001—when the<br />
recent spike in filings commenced—and that average claim values<br />
are unlikely to return to levels below those experienced in 2001-<br />
2002, the years immediately following CCR’s cessation of operations.<br />
ARPC advised Union Carbide that, by assuming that future<br />
filings were unlikely to exceed the levels experienced prior to 2001<br />
and extrapolating from 2001 and 2002 average claim values, ARPC<br />
could make a reasonable forecast of the cost of resolving<br />
asbestos-related claims facing Union Carbide and Amchem. ARPC<br />
also advised Union Carbide that forecasts of resolution costs for a<br />
10 to 15 year period from the date of the forecast are likely to be<br />
more accurate than forecasts for longer periods of time.<br />
In projecting Union Carbide’s resolution costs for future<br />
asbestos-related claims, ARPC applied two methodologies that<br />
have been widely used for forecasting purposes. Applying these<br />
methodologies, ARPC forecast the number and allocation by disease<br />
category of those potential future claims on a year-by-year basis<br />
through 2049. ARPC then calculated the percentage of claims in<br />
each disease category that had been closed with payments in<br />
2001 and 2002. Using those percentages, ARPC calculated the<br />
number of future claims by disease category that would likely<br />
require payment by Union Carbide and Amchem and multiplied the<br />
number of such claims by the mean values paid by Union Carbide<br />
and Amchem, respectively, to dispose of such claims in 2001 and<br />
2002. In estimating Union Carbide’s cost of resolving pending<br />
claims, ARPC used a process similar to that used for calculating<br />
the cost of resolving future claims.<br />
As of December 31, 2002, ARPC estimated the undiscounted<br />
cost of resolving pending and future asbestos-related claims<br />
against Union Carbide and Amchem, excluding future defense and<br />
processing costs, for the 15-year period from the present through<br />
2017 to be between approximately $2.2 billion and $2.4 billion,<br />
depending on which of the two accepted methodologies was used.<br />
> 38 <strong>The</strong> <strong>Dow</strong> <strong>Chemical</strong> <strong>Company</strong><br />
Although ARPC provided estimates for a longer period of time,<br />
based on ARPC’s advice that forecasts for shorter periods of time<br />
are more accurate and in light of the uncertainties inherent in making<br />
long-term projections, Union Carbide determined that the 15-year<br />
period through 2017 is the reasonable time period for projecting<br />
the cost of disposing of its future asbestos-related claims. Union<br />
Carbide concluded that it is probable that the undiscounted cost of<br />
disposing of asbestos-related pending and future claims ranges<br />
from $2.2 billion to $2.4 billion, which is the range for the 15-year<br />
period ending in 2017 as estimated by ARPC using both methodologies.<br />
Accordingly, Union Carbide increased its asbestos-related<br />
liability for pending and future claims at December 31, 2002 to $2.2<br />
billion, excluding future defense and processing costs. For pending<br />
claims, Union Carbide had an asbestos-related liability of $233 million<br />
at December 31, 2001.<br />
Union Carbide also increased the receivable for insurance<br />
recoveries related to its asbestos liability to $1.35 billion at<br />
December 31, 2002, substantially exhausting its asbestos product<br />
liability coverage. This resulted in a net income statement impact<br />
to Union Carbide of $828 million, $522 million on an after-tax basis,<br />
in the fourth quarter of 2002. Union Carbide’s receivable for insurance<br />
recoveries related to its asbestos liability was $223 million<br />
at December 31, 2001. <strong>The</strong> insurance receivable related to the<br />
asbestos liability was determined by Union Carbide after a thorough<br />
review of applicable insurance policies and the 1985 Wellington<br />
Agreement, to which Union Carbide and many of its liability insurers<br />
are signatory parties, as well as other insurance settlements, with<br />
due consideration given to applicable deductibles, retentions and<br />
policy limits, and taking into account the solvency and historical<br />
payment experience of various insurance carriers.<br />
In addition, Union Carbide had receivables for insurance recoveries<br />
for defense and resolution costs of $219 million at December 31,<br />
2002 and $35 million at December 31, 2001. Defense and resolution<br />
costs for Union Carbide’s asbestos-related litigation were $247<br />
million in 2002, $53 million in 2001 and $53 million in 2000. <strong>The</strong><br />
$247 million in 2002 included $92 million for defense costs (which<br />
included significant costs for the development and implementation<br />
of Union Carbide’s new and more aggressive defense strategies)<br />
and $63 million for bulk settlements with multiple claimants. To<br />
date, substantially all of these defense and resolution costs were<br />
covered by insurance. Insurance coverage for future asbestosrelated<br />
defense costs will exist, but to a lesser extent. <strong>The</strong> pretax<br />
impact to Union Carbide for these defense and resolution costs, net<br />
of insurance, was $9 million in 2002, $9 million in 2001 and $4 million<br />
in 2000, and was reflected in “Cost of sales.”<br />
<strong>The</strong> amounts recorded by Union Carbide for the asbestos-related<br />
liability and related insurance receivable described above were<br />
based upon currently known facts. However, projecting future<br />
events, such as the number of new claims to be filed each year,<br />
the average cost of disposing of each such claim, coverage issues<br />
among insurers, and the continuing solvency of various insurance<br />
companies, as well as the numerous uncertainties surrounding<br />
asbestos litigation in the United States, could cause the actual<br />
costs and insurance recoveries for Union Carbide to be higher or<br />
lower than those projected or those recorded. Union Carbide<br />
expenses defense and processing costs as incurred. Accordingly,<br />
defense and processing costs incurred by Union Carbide in the<br />
future for asbestos-related litigation, net of insurance, will impact<br />
Union Carbide’s results of operations in future periods.
Management’s Discussion and Analysis of Financial Condition and Results of Operations<br />
Because of the uncertainties described above, Union Carbide’s<br />
management cannot estimate the full range of the cost of resolving<br />
pending and future asbestos-related claims facing Union Carbide<br />
and Amchem. Union Carbide’s management believes that it is<br />
reasonably possible that the cost of disposing of Union Carbide’s<br />
asbestos-related claims, including future defense and processing<br />
costs, could have a material adverse impact on Union Carbide’s<br />
results of operations and cash flows for a particular period and<br />
on the consolidated financial position of Union Carbide.<br />
It is the opinion of <strong>Dow</strong>’s management that it is reasonably<br />
possible that the cost of Union Carbide disposing of its asbestosrelated<br />
claims, including future defense and processing costs,<br />
could have a material adverse impact on the <strong>Company</strong>’s results<br />
of operations and cash flows for a particular period and on the<br />
consolidated financial position of the <strong>Company</strong>.<br />
MARKET RISK<br />
<strong>Dow</strong>’s business operations give rise to market risk exposure due<br />
to changes in foreign exchange rates, interest rates, commodity<br />
prices and other market factors such as equity prices. To manage<br />
such risks effectively, the <strong>Company</strong> enters into hedging transactions,<br />
pursuant to established guidelines and policies, which<br />
enable it to mitigate the adverse effects of financial market risk.<br />
Derivatives used for this purpose are designated as hedges per<br />
SFAS No. 133, where appropriate. A secondary objective is to add<br />
value by creating additional non-specific exposure within established<br />
limits and policies; derivatives used for this purpose are not<br />
designated as hedges per SFAS No. 133. <strong>The</strong> potential impact<br />
of creating such additional exposures is not material to the<br />
<strong>Company</strong>’s results.<br />
<strong>The</strong> global nature of <strong>Dow</strong>’s business requires active participation<br />
in the foreign exchange markets. As a result of investments,<br />
production facilities and other operations on a global basis, the<br />
<strong>Company</strong> has assets, liabilities and cash flows in currencies other<br />
than the U.S. dollar. <strong>The</strong> primary objective of the <strong>Company</strong>’s<br />
foreign exchange risk management is to optimize the U.S. dollar<br />
value of net assets and cash flows, keeping the adverse impact of<br />
currency movements to a minimum. To achieve this objective, the<br />
<strong>Company</strong> hedges on a net exposure basis using foreign currency<br />
forward contracts, over-the-counter option contracts, cross-currency<br />
swaps, and nonderivative instruments in foreign currencies. Main<br />
exposures are related to assets and liabilities denominated in the<br />
currencies of Europe, Asia Pacific and Canada; bonds denominated<br />
in foreign currencies—mainly the Euro and Japanese yen; and<br />
economic exposure derived from the risk that currency fluctuations<br />
could affect the U.S. dollar value of future cash flows. <strong>The</strong> majority<br />
of the foreign exchange exposure is related to European currencies<br />
and the Japanese yen.<br />
<strong>The</strong> main objective of interest rate risk management is to reduce<br />
the total funding cost to the <strong>Company</strong> and to alter the interest rate<br />
exposure to the desired risk profile. <strong>Dow</strong> uses interest rate swaps,<br />
“swaptions,” and exchange-traded instruments to accomplish this<br />
objective. <strong>The</strong> <strong>Company</strong>’s primary exposure is to the U.S. dollar<br />
yield curve.<br />
Inherent in <strong>Dow</strong>’s business is exposure to price changes for<br />
several commodities. Some exposures can be hedged effectively<br />
through liquid tradable financial instruments. Cracker feedstocks<br />
and natural gas constitute the main commodity exposures. Overthe-counter<br />
and exchange traded instruments are used to hedge<br />
these risks when feasible.<br />
<strong>Dow</strong> has a portfolio of equity securities derived from its acquisition<br />
and divestiture activity. This exposure is managed in a manner<br />
consistent with the <strong>Company</strong>’s market risk policies and procedures.<br />
<strong>Dow</strong> uses value at risk (“VAR”), stress testing and scenario<br />
analysis for risk measurement and control purposes. VAR estimates<br />
the potential gain or loss in fair market values, given a certain move<br />
in prices over a certain period of time, using specified confidence<br />
levels. On an ongoing basis, the <strong>Company</strong> estimates the maximum<br />
gain or loss that could arise in one day, given a two-standarddeviation<br />
move in the respective price levels. <strong>The</strong>se amounts are<br />
relatively insignificant in comparison to the size of the equity of the<br />
<strong>Company</strong>. <strong>The</strong> VAR methodology used by <strong>Dow</strong> is based primarily<br />
on the variance/covariance statistical model. <strong>The</strong> year-end VAR and<br />
average quarterly VAR for the aggregate of non-trading and trading<br />
positions for 2002 and 2001 are shown below:<br />
Total Daily VAR at December 31*<br />
2002 2001<br />
IN MILLIONS YEAR-END AVERAGE YEAR-END AVERAGE<br />
Foreign exchange $ 7 $10 $ 21 $17<br />
Interest rate 94 83 106 70<br />
Equity exposures,<br />
net of hedges 3 4 7 9<br />
Commodities 17 11 4 5<br />
*Using a 95 percent confidence level<br />
See Note H to the Consolidated Financial Statements for further<br />
disclosure regarding market risk.<br />
<strong>The</strong> <strong>Dow</strong> <strong>Chemical</strong> <strong>Company</strong> 39 >
Management Statement of Responsibility and Independent Auditors’ Report<br />
Management Statement of Responsibility<br />
<strong>The</strong> management of <strong>The</strong> <strong>Dow</strong> <strong>Chemical</strong> <strong>Company</strong> and its<br />
subsidiaries prepared the accompanying consolidated financial<br />
statements and has responsibility for their integrity, objectivity and<br />
freedom from material misstatement or error. <strong>The</strong>se statements<br />
were prepared in accordance with accounting principles generally<br />
accepted in the United States of America. <strong>The</strong> financial statements<br />
include amounts that are based on management’s best estimates<br />
and judgments. Management also prepared the other information<br />
in this annual report and is responsible for its accuracy and consistency<br />
with the financial statements. <strong>The</strong> Board of Directors,<br />
through its Audit Committee, assumes an oversight role with<br />
respect to the preparation of the financial statements.<br />
Management recognizes its responsibility for fostering a strong<br />
ethical climate so that the <strong>Company</strong>’s affairs are conducted according<br />
to the highest standards of personal and corporate conduct.<br />
Management has established and maintains internal controls that<br />
provide reasonable assurance as to the integrity and reliability of the<br />
financial statements, the protection of assets from unauthorized<br />
use or disposition, and the prevention and detection of fraudulent<br />
financial reporting.<br />
Internal controls provide for appropriate division of responsibility<br />
and are documented by written policies and procedures that are<br />
communicated to employees with significant roles in the financial<br />
reporting process and updated as necessary. Management continually<br />
monitors internal controls for compliance. <strong>The</strong> <strong>Company</strong><br />
maintains a strong internal auditing program that independently<br />
assesses the effectiveness of the internal controls and recommends<br />
possible improvements.<br />
Deloitte & Touche LLP, independent auditors, with direct access<br />
to the Board of Directors through its Audit Committee, have audited<br />
the consolidated financial statements prepared by the <strong>Company</strong>,<br />
and their report follows.<br />
Management has considered recommendations from the internal<br />
auditors and Deloitte & Touche LLP concerning internal controls<br />
and has taken actions that are cost-effective in the circumstances<br />
to respond appropriately to these recommendations. Management<br />
further believes the controls are adequate to accomplish the objectives<br />
discussed herein.<br />
<strong>The</strong> undersigned have executed certifications dated February 28,<br />
2003, as required by Sections 302 and 906 of the Sarbanes-Oxley<br />
Act of 2002, and the <strong>Company</strong> has filed those certifications as part<br />
of, or as exhibits to, the <strong>Company</strong>’s Annual Report on Form 10-K<br />
for the year ended December 31, 2002. In addition, William S.<br />
Stavropoulos, Chairman, President and Chief Executive Officer of<br />
the <strong>Company</strong>, has certified to the New York Stock Exchange<br />
(“NYSE”) that he is unaware of any violation by the <strong>Company</strong> of<br />
the NYSE corporate governance listing standards in effect as<br />
of February 28, 2003.<br />
William S. Stavropoulos J. Pedro Reinhard<br />
Chairman, President Executive Vice President<br />
and Chief Executive Officer and Chief Financial Officer<br />
> 40 <strong>The</strong> <strong>Dow</strong> <strong>Chemical</strong> <strong>Company</strong><br />
Independent Auditors’ Report<br />
To the Stockholders and Board of Directors of<br />
<strong>The</strong> <strong>Dow</strong> <strong>Chemical</strong> <strong>Company</strong>:<br />
We have audited the accompanying consolidated balance sheets<br />
of <strong>The</strong> <strong>Dow</strong> <strong>Chemical</strong> <strong>Company</strong> and its subsidiaries as of<br />
December 31, 2002 and 2001, and the related consolidated statements<br />
of income, stockholders’ equity, comprehensive income<br />
and cash flows for each of the three years in the period ended<br />
December 31, 2002. <strong>The</strong>se financial statements are the responsibility<br />
of the <strong>Company</strong>’s management. Our responsibility is to<br />
express an opinion on the financial statements based on our<br />
audits. <strong>The</strong> consolidated financial statements give retroactive<br />
effect to the merger of <strong>The</strong> <strong>Dow</strong> <strong>Chemical</strong> <strong>Company</strong> and Union<br />
Carbide Corporation, which has been accounted for as a pooling of<br />
interests as described in Note C to the consolidated financial statements.<br />
We did not audit the statements of income, stockholders’<br />
equity and cash flows of Union Carbide Corporation for the period<br />
ended December 31, 2000, which consolidated statements reflect<br />
total revenues of $6,550 million. Those consolidated statements<br />
were audited by other auditors whose report has been furnished to<br />
us, and our opinion, insofar as it relates to the amounts included<br />
for Union Carbide Corporation for 2000, is based solely on the<br />
report of such other auditors.<br />
We conducted our audits in accordance with auditing standards<br />
generally accepted in the United States of America. Those standards<br />
require that we plan and perform the audit to obtain reasonable<br />
assurance about whether the financial statements are free of<br />
material misstatement. An audit includes examining, on a test<br />
basis, evidence supporting the amounts and disclosures in the<br />
financial statements. An audit also includes assessing the accounting<br />
principles used and significant estimates made by management,<br />
as well as evaluating the overall financial statement presentation.<br />
We believe that our audits and the report of the other auditors<br />
provide a reasonable basis for our opinion.<br />
In our opinion, based on our audits and the report of the other<br />
auditors, the consolidated financial statements referred to above<br />
present fairly, in all material respects, the financial position of <strong>The</strong><br />
<strong>Dow</strong> <strong>Chemical</strong> <strong>Company</strong> and its subsidiaries at December 31,<br />
2002 and 2001, and the results of their operations and their cash<br />
flows for each of the three years in the period ended December<br />
31, 2002, in conformity with accounting principles generally<br />
accepted in the United States of America.<br />
As discussed in Notes A and H to the consolidated financial<br />
statements, effective January 1, 2001, <strong>The</strong> <strong>Dow</strong> <strong>Chemical</strong><br />
<strong>Company</strong> changed its method of accounting for derivative<br />
instruments and hedging activities to conform to Statement of<br />
Financial Accounting Standards No. 133.<br />
As discussed in Notes A and F to the consolidated financial statements,<br />
effective January 1, 2002, <strong>The</strong> <strong>Dow</strong> <strong>Chemical</strong> <strong>Company</strong><br />
changed its method of accounting for goodwill to conform to<br />
Statements of Financial Accounting Standards Nos. 141 and 142.<br />
Deloitte & Touche LLP<br />
Midland, Michigan<br />
January 30, 2003<br />
(February 13, 2003 as to Note U)
Consolidated Statements of Income<br />
(IN MILLIONS, EXCEPT PER SHARE AMOUNTS) FOR THE YEARS ENDED DECEMBER 31 2002 2001 2000<br />
Net Sales $27,609 $28,075 $29,798<br />
Cost of sales 23,780 23,892 24,310<br />
Research and development expenses 1,066 1,072 1,119<br />
Selling, general and administrative expenses 1,598 1,765 1,825<br />
Amortization of intangibles 65 178 139<br />
Purchased in-process research and development charges – 69 6<br />
Merger-related expenses and restructuring 280 1,487 –<br />
Asbestos-related charge 828 – –<br />
Equity in earnings of nonconsolidated affiliates 40 29 354<br />
Sundry income—net 54 394 352<br />
Interest income 66 85 146<br />
Interest expense and amortization of debt discount 774 733 665<br />
Income (Loss) before Income Taxes and Minority Interests (622) (613) 2,586<br />
Provision (Credit) for income taxes (280) (228) 839<br />
Minority interests’ share in income 63 32 72<br />
Income (Loss) before Cumulative Effect of Changes in Accounting Principles (405) (417) 1,675<br />
Cumulative effect of changes in accounting principles 67 32 –<br />
Net Income (Loss) Available for Common Stockholders $ (338) $ (385) $ 1,675<br />
Share Data<br />
Earnings (Loss) before cumulative effect of changes in accounting principles<br />
per common share—basic $ (0.44) $ (0.46) $ 1.88<br />
Earnings (Loss) per common share—basic $ (0.37) $ (0.43) $ 1.88<br />
Earnings (Loss) before cumulative effect of changes in accounting principles<br />
per common share—diluted $ (0.44) $ (0.46) $ 1.85<br />
Earnings (Loss) per common share—diluted $ (0.37) $ (0.43) $ 1.85<br />
Common stock dividends declared per share of <strong>Dow</strong> common stock $ 1.34 $ 1.295 $ 1.16<br />
Weighted-average common shares outstanding—basic 910.5 901.8 893.2<br />
Weighted-average common shares outstanding—diluted 910.5 901.8 904.5<br />
See Notes to the Consolidated Financial Statements.<br />
<strong>The</strong> <strong>Dow</strong> <strong>Chemical</strong> <strong>Company</strong> 41 >
Consolidated Balance Sheets<br />
(IN MILLIONS) AT DECEMBER 31 2002 2001<br />
Assets<br />
Current Assets<br />
Cash and cash equivalents $ 1,484 $ 220<br />
Marketable securities and interest-bearing deposits 89 44<br />
Accounts and notes receivable:<br />
Trade (net of allowance for doubtful receivables—2002: $127; 2001: $123) 3,116 2,868<br />
Other 2,369 2,230<br />
Inventories 4,208 4,440<br />
Deferred income tax assets—current 415 506<br />
Total current assets 11,681 10,308<br />
Investments<br />
Investments in nonconsolidated affiliates 1,565 1,581<br />
Other investments 1,689 1,663<br />
Noncurrent receivables 577 578<br />
Total investments 3,831 3,822<br />
Property<br />
Property 37,934 35,890<br />
Less accumulated depreciation 24,137 22,311<br />
Net property 13,797 13,579<br />
Other Assets<br />
Goodwill 3,189 3,130<br />
Other intangible assets (net of accumulated amortization—2002: $349; 2001: $346) 613 607<br />
Deferred income tax assets—noncurrent 3,470 2,248<br />
Asbestos-related insurance receivables—noncurrent 1,489 224<br />
Deferred charges and other assets 1,492 1,597<br />
Total other assets 10,253 7,806<br />
Total Assets $39,562 $35,515<br />
Liabilities and Stockholders’ Equity<br />
Current Liabilities<br />
Notes payable $ 580 $ 1,209<br />
Long-term debt due within one year 797 408<br />
Accounts payable:<br />
Trade 2,834 2,713<br />
Other 1,789 926<br />
Income taxes payable 202 190<br />
Deferred income tax liabilities—current 30 236<br />
Dividends payable 326 323<br />
Accrued and other current liabilities 2,298 2,120<br />
Total current liabilities 8,856 8,125<br />
Long-Term Debt 11,659 9,266<br />
Other Noncurrent Liabilities<br />
Deferred income tax liabilities—noncurrent 994 760<br />
Pension and other postretirement benefits—noncurrent 3,775 2,475<br />
Asbestos-related liabilities—noncurrent 2,072 233<br />
Other noncurrent obligations 3,214 3,306<br />
Total other noncurrent liabilities 10,055 6,774<br />
Minority Interest in Subsidiaries 366 357<br />
Preferred Securities of Subsidiaries 1,000 1,000<br />
Stockholders’ Equity<br />
Common stock (authorized 1,500,000,000 shares of $2.50 par value each; issued 981,377,562) 2,453 2,453<br />
Additional paid-in capital – –<br />
Unearned ESOP shares (61) (90)<br />
Retained earnings 9,520 11,112<br />
Accumulated other comprehensive loss (2,097) (1,070)<br />
Treasury stock at cost (shares 2002: 68,721,252; 2001: 76,540,276) (2,189) (2,412)<br />
Net stockholders’ equity 7,626 9,993<br />
Total Liabilities and Stockholders’ Equity $39,562 $35,515<br />
See Notes to the Consolidated Financial Statements.<br />
> 42 <strong>The</strong> <strong>Dow</strong> <strong>Chemical</strong> <strong>Company</strong>
Consolidated Statements of Cash Flows<br />
(IN MILLIONS) FOR THE YEARS ENDED DECEMBER 31 2002 2001 2000<br />
Operating Activities<br />
Income (Loss) before cumulative effect of changes in accounting principles $ (405) $ (417) $1,675<br />
Adjustments to reconcile net income (loss) to net cash provided by operating activities:<br />
Depreciation and amortization 1,825 1,815 1,738<br />
Purchased in-process research and development – 69 6<br />
Provision (Credit) for deferred income tax (311) (391) 143<br />
Earnings/losses of nonconsolidated affiliates less than (in excess of) dividends received 53 25 (222)<br />
Minority interests’ share in income 63 32 72<br />
Net gain on sales of consolidated companies (4) – –<br />
Net (gain) loss on sales of nonconsolidated affiliates (60) 2 (13)<br />
Net gain on sales of property and businesses (8) (49) (102)<br />
Other net gain (65) (245) (340)<br />
Merger-related expenses and restructuring 202 906 –<br />
Asbestos-related charge 828 – –<br />
Tax benefit—nonqualified stock option exercises 31 39 37<br />
Changes in assets and liabilities that provided (used) cash:<br />
Accounts and notes receivable (299) 1,340 (335)<br />
Inventories 223 34 (559)<br />
Accounts payable 474 (586) 429<br />
Other assets and liabilities (439) (785) (838)<br />
Cash provided by operating activities 2,108 1,789 1,691<br />
Investing Activities<br />
Capital expenditures (1,623) (1,587) (1,808)<br />
Proceeds from sales of property and businesses 79 153 166<br />
Acquisitions of businesses, net of cash received (1) (2,301) (678)<br />
Proceeds from sales of consolidated companies 39 – –<br />
Investments in nonconsolidated affiliates (98) (92) (186)<br />
Advances to nonconsolidated affiliates, net of cash received – 203 (179)<br />
Proceeds from sales of nonconsolidated affiliates 89 181 47<br />
Purchases of investments (1,799) (2,561) (3,074)<br />
Proceeds from sales and maturities of investments 1,688 3,330 4,618<br />
Cash used in investing activities (1,626) (2,674) (1,094)<br />
Financing Activities<br />
Changes in short-term notes payable (510) (1,573) 136<br />
Payments on long-term debt (472) (259) (562)<br />
Proceeds from issuance of long-term debt 2,932 3,165 401<br />
Purchases of treasury stock (6) (5) (4)<br />
Proceeds from sales of common stock 138 146 150<br />
Proceeds from issuance of preferred securities of subsidiary – 500 –<br />
Distributions to minority interests (78) (80) (74)<br />
Dividends paid to stockholders (1,217) (1,063) (904)<br />
Cash provided by (used in) financing activities 787 831 (857)<br />
Effect of Exchange Rate Changes on Cash (5) (4) (9)<br />
Summary<br />
Increase (Decrease) in cash and cash equivalents 1,264 (58) (269)<br />
Cash and cash equivalents at beginning of year 220 278 547<br />
Cash and cash equivalents at end of year $1,484 $ 220 $ 278<br />
See Notes to the Consolidated Financial Statements.<br />
<strong>The</strong> <strong>Dow</strong> <strong>Chemical</strong> <strong>Company</strong> 43 >
Consolidated Statements of Stockholders’ Equity<br />
(IN MILLIONS) FOR THE YEARS ENDED DECEMBER 31 2002 2001 2000<br />
Common Stock<br />
Balance at beginning of year $ 2,453 $2,453 $ 818<br />
3-for-1 stock split – – 1,635<br />
Balance at end of year 2,453 2,453 2,453<br />
Additional Paid-in Capital<br />
Balance at beginning of year – – 165<br />
3-for-1 stock split – – (184)<br />
Other – – 19<br />
Balance at end of year – – –<br />
Unearned ESOP Shares<br />
Balance at beginning of year (90) (103) (57)<br />
Transfer from temporary equity – – (64)<br />
Shares allocated to ESOP participants 29 13 18<br />
Balance at end of year (61) (90) (103)<br />
Retained Earnings<br />
Balance at beginning of year 11,112 12,675 13,357<br />
Net income (loss) (338) (385) 1,675<br />
3-for-1 stock split – – (1,451)<br />
Common stock dividends declared (1,228) (1,162) (906)<br />
Other (26) (16) –<br />
Balance at end of year 9,520 11,112 12,675<br />
Accumulated Other Comprehensive Income (Loss)<br />
Unrealized Gains on Investments at beginning of year 6 325 298<br />
Unrealized gains (losses) (29) (319) 27<br />
Balance at end of year (23) 6 325<br />
Cumulative Translation Adjustments at beginning of year (982) (834) (646)<br />
Translation adjustments 333 (148) (188)<br />
Balance at end of year (649) (982) (834)<br />
Minimum Pension Liability at beginning of year (72) (51) (63)<br />
Adjustments (1,307) (21) 12<br />
Balance at end of year (1,379) (72) (51)<br />
Accumulated Derivative Loss at beginning of year (22) – –<br />
Cumulative transition adjustment – 65 –<br />
Net hedging results (23) (45) –<br />
Reclassification to earnings (1) (42) –<br />
Balance at end of year (46) (22) –<br />
Total accumulated other comprehensive loss (2,097) (1,070) (560)<br />
Treasury Stock<br />
Balance at beginning of year (2,412) (2,625) (2,932)<br />
Purchases (6) (5) (4)<br />
Issuance to employees and employee plans 229 218 311<br />
Balance at end of year (2,189) (2,412) (2,625)<br />
Net Stockholders’ Equity $ 7,626 $9,993 $11,840<br />
See Notes to the Consolidated Financial Statements.<br />
> 44 <strong>The</strong> <strong>Dow</strong> <strong>Chemical</strong> <strong>Company</strong>
Consolidated Statements of Comprehensive Income<br />
(IN MILLIONS) FOR THE YEARS ENDED DECEMBER 31 2002 2001 2000<br />
Net Income (Loss) Available for Common Stockholders $ (338) $(385) $1,675<br />
Other Comprehensive Income (Loss), Net of Tax (tax amounts shown below for 2002, 2001, 2000)<br />
Unrealized gains (losses) on investments:<br />
Unrealized holding gains (losses) during the period (less tax of $(12), $(34), $20) (21) (60) 35<br />
Less: Reclassification adjustments for net amounts included in net income (loss)<br />
(less tax of $(5), $(152), $(4)) (8) (259) (8)<br />
Cumulative translation adjustments (less tax of $175, $(21), $(33)) 333 (148) (188)<br />
Minimum pension liability adjustments (less tax of $(729), $(8), $5) (1,307) (21) 12<br />
Net loss on cash flow hedging derivative instruments (less tax of $(11) for 2002, $(13) for 2001) (24) (22) –<br />
Total other comprehensive loss (1,027) (510) (149)<br />
Comprehensive Income (Loss) $(1,365) $(895) $1,526<br />
See Notes to the Consolidated Financial Statements.<br />
Notes to the Consolidated Financial Statements (dollars in millions, except as noted)<br />
A. SUMMARY OF SIGNIFICANT ACCOUNTING POLICIES<br />
AND ACCOUNTING CHANGES<br />
Principles of Consolidation and Basis of Presentation<br />
<strong>The</strong> accompanying consolidated financial statements of <strong>The</strong> <strong>Dow</strong><br />
<strong>Chemical</strong> <strong>Company</strong> and its subsidiaries (“<strong>Dow</strong>” or the “<strong>Company</strong>”)<br />
include the assets, liabilities, revenues and expenses of all majorityowned<br />
subsidiaries over which the <strong>Company</strong> exercises control.<br />
Intercompany transactions and balances are eliminated in consolidation.<br />
Investments in nonconsolidated affiliates (20–50 percent<br />
owned companies, joint ventures and partnerships, and majorityowned<br />
subsidiaries over which the <strong>Company</strong> does not exercise<br />
control) are accounted for on the equity basis.<br />
<strong>The</strong> consolidated financial statements give retroactive effect to<br />
the Union Carbide merger, which was completed on February 6,<br />
2001, and accounted for as a pooling of interests. See Note C for<br />
additional information.<br />
Prior to this annual report, the net results of the <strong>Company</strong>’s<br />
insurance operations were presented on a separate line entitled<br />
“Insurance company operations, pretax income” on the income<br />
statement. <strong>The</strong> consolidated financial statements in this annual<br />
report reflect a reclassification of these results to “Net sales” and<br />
“Cost of sales” for all periods presented.<br />
Certain reclassifications of prior years’ amounts have been<br />
made to conform to the presentation adopted for 2002.<br />
Use of Estimates in Financial Statement Preparation<br />
<strong>The</strong> preparation of financial statements in conformity with accounting<br />
principles generally accepted in the United States of America<br />
(“GAAP”) requires the use of estimates and assumptions that<br />
affect the reported amounts of assets and liabilities, the disclosure<br />
of contingent assets and liabilities at the date of the financial<br />
statements, and the reported amounts of revenues and expenses<br />
during the reporting period. <strong>The</strong> <strong>Company</strong>’s consolidated financial<br />
statements include amounts that are based on management’s<br />
best estimates and judgments. Actual results could differ from<br />
those estimates.<br />
Foreign Currency Translation<br />
<strong>The</strong> local currency has been primarily used as the functional<br />
currency throughout the world. Translation gains and losses of<br />
those operations that use local currency as the functional currency<br />
are included in the consolidated balance sheets as “Accumulated<br />
other comprehensive income (loss)” (“AOCI”). Where the U.S. dollar<br />
is used as the functional currency, foreign currency gains and<br />
losses are reflected in income.<br />
Environmental Matters<br />
Accruals for environmental matters are recorded when it is probable<br />
that a liability has been incurred and the amount of the liability can<br />
be reasonably estimated, based on current law and existing technologies.<br />
<strong>The</strong>se accruals are adjusted periodically as assessment<br />
and remediation efforts progress or as additional technical or legal<br />
information becomes available. Accruals for environmental liabilities<br />
are included in the consolidated balance sheets as “Other<br />
noncurrent obligations” at undiscounted amounts. Accruals for<br />
related insurance or other third-party recoveries for environmental<br />
liabilities are recorded when it is probable that a recovery will be<br />
realized and are included in the consolidated balance sheets as<br />
“Noncurrent receivables.”<br />
Environmental costs are capitalized if the costs extend the life<br />
of the property, increase its capacity, and/or mitigate or prevent<br />
contamination from future operations. Costs related to environmental<br />
contamination treatment and cleanup are charged to expense.<br />
Estimated future incremental operations, maintenance and management<br />
costs directly related to remediation are accrued when such<br />
costs are probable and estimable.<br />
Cash and Cash Equivalents<br />
Cash and cash equivalents include time deposits and readily marketable<br />
securities with original maturities of three months or less.<br />
<strong>The</strong> <strong>Dow</strong> <strong>Chemical</strong> <strong>Company</strong> 45 >
Notes to the Consolidated Financial Statements (dollars in millions, except as noted)<br />
A. SUMMARY OF SIGNIFICANT ACCOUNTING POLICIES<br />
AND ACCOUNTING CHANGES (continued)<br />
Financial Instruments<br />
<strong>The</strong> <strong>Company</strong> calculates the fair value of financial instruments<br />
using quoted market prices whenever available. When quoted<br />
market prices are not available for various types of financial instruments<br />
(such as forwards, options and swaps), the <strong>Company</strong> uses<br />
standard pricing models with market-based inputs, which take into<br />
account the present value of estimated future cash flows.<br />
<strong>The</strong> <strong>Company</strong> utilizes derivative instruments to manage exposures<br />
to currency exchange rates, commodity prices and interest<br />
rate risk. <strong>The</strong> fair values of all derivative instruments are recognized<br />
as assets or liabilities at the balance sheet date. Changes in the<br />
fair value of these instruments are reported in income or AOCI,<br />
depending on the use of the derivative and whether it qualifies for<br />
hedge accounting treatment.<br />
Gains and losses on derivative instruments qualifying as cash<br />
flow hedges are recorded in AOCI, to the extent the hedges<br />
are effective, until the underlying transactions are recognized in<br />
income. To the extent effective, gains and losses on derivative and<br />
nonderivative instruments used as hedges of the <strong>Company</strong>’s net<br />
investment in foreign operations are recorded in AOCI as part of<br />
the cumulative translation adjustment. <strong>The</strong> ineffective portions of<br />
cash flow hedges and hedges of net investment in foreign operations,<br />
if any, are recognized in income immediately.<br />
Gains and losses on derivative instruments designated and qualifying<br />
as fair value hedging instruments, as well as the offsetting<br />
losses and gains on the hedged items, are reported in income in<br />
the same accounting period. Derivative instruments not designated<br />
as hedges are marked-to-market at the end of each accounting<br />
period with the results included in income.<br />
Inventories<br />
Inventories are stated at the lower of cost or market. <strong>The</strong> method<br />
of determining cost is used consistently from year to year at each<br />
subsidiary and varies among last-in, first-out (“LIFO”); first-in, firstout<br />
(“FIFO”); and average cost.<br />
Property<br />
Land, buildings and equipment, including property under capital<br />
lease agreements, are carried at cost less accumulated depreciation.<br />
Depreciation is based on the estimated service lives of depreciable<br />
assets and is provided using the straight-line method. For most<br />
assets capitalized through 1996, the declining balance method was<br />
used. Fully depreciated assets are retained in property and depreciation<br />
accounts until they are removed from service. In the case<br />
of disposals, assets and related depreciation are removed from the<br />
accounts, and the net amounts, less proceeds from disposal, are<br />
included in income.<br />
> 46 <strong>The</strong> <strong>Dow</strong> <strong>Chemical</strong> <strong>Company</strong><br />
Long-Lived Assets<br />
<strong>The</strong> <strong>Company</strong> evaluates long-lived assets and certain identifiable<br />
intangibles for impairment whenever events or changes in circumstances<br />
indicate that the carrying amount of an asset may not<br />
be recoverable. When undiscounted future cash flows will not be<br />
sufficient to recover an asset’s carrying amount, the asset is written<br />
down to its fair value. Long-lived assets to be disposed of other<br />
than by sale are classified as held and used until they are disposed<br />
of. Long-lived assets to be disposed of by sale are classified as<br />
held for sale and are reported at the lower of carrying amount or<br />
fair value less cost to sell, and depreciation is ceased.<br />
Investments<br />
Investments in debt and marketable equity securities, including<br />
warrants, are classified as trading, available-for-sale, or held-tomaturity.<br />
Investments classified as trading are reported at fair<br />
value with unrealized gains and losses included in income. Those<br />
classified as available-for-sale are reported at fair value with<br />
unrealized gains and losses recorded in AOCI. Those classified as<br />
held-to-maturity are recorded at amortized cost. <strong>The</strong> cost of investments<br />
sold is determined by specific identification.<br />
<strong>The</strong> excess of the cost of investments in subsidiaries over the<br />
values assigned to assets and liabilities acquired through June 30,<br />
2001, is shown as goodwill and was amortized on a straight-line<br />
basis over its estimated useful life (maximum 40 years) through<br />
December 31, 2001. Effective January 1, 2002, goodwill is no<br />
longer amortized, but is subject to the impairment provisions of<br />
Statement of Financial Accounting Standards (“SFAS”) No. 142,<br />
“Goodwill and Other Intangible Assets.” See Accounting Changes<br />
below for further discussion.<br />
Revenue<br />
Sales are recognized when the revenue is realized or realizable,<br />
and has been earned. Approximately 97 percent of the <strong>Company</strong>’s<br />
sales are related to sales of product, while 1 percent is related<br />
to the <strong>Company</strong>’s service offerings, 1 percent to its insurance<br />
operations and 1 percent to the licensing of patents and technology.<br />
Revenue for product sales is recognized as risk and title to the<br />
product transfer to the customer, which usually occurs at the time<br />
shipment is made. Substantially all of the <strong>Company</strong>’s products are<br />
sold FOB (“free on board”) shipping point or, with respect to<br />
countries other than the United States, an equivalent basis. Title to<br />
the product passes when the product is delivered to the freight<br />
carrier. <strong>Dow</strong>’s standard terms of delivery are included in its contracts<br />
of sale, order confirmation documents, and invoices. Freight<br />
costs and any directly related associated costs of transporting<br />
finished product to customers are recorded as “Cost of sales.”<br />
<strong>The</strong> <strong>Company</strong>’s primary service offerings are in the form of<br />
contract manufacturing services and services associated with<br />
<strong>Dow</strong> AgroSciences’ termite solution, Sentricon Termite Colony<br />
Elimination System. Revenue associated with these service offerings<br />
is recognized when services are rendered, according to<br />
contractual agreements.<br />
Revenue related to the <strong>Company</strong>’s insurance operations<br />
includes third-party insurance premiums, which are earned over<br />
the terms of the related insurance policies and reinsurance contracts.<br />
Revenue related to the licensing of patents and technology is<br />
recognized according to licensee production levels.
Notes to the Consolidated Financial Statements (dollars in millions, except as noted)<br />
Legal Costs<br />
<strong>The</strong> <strong>Company</strong> expenses legal costs, including those costs expected<br />
to be incurred in connection with a loss contingency, as incurred.<br />
Income Taxes<br />
<strong>The</strong> <strong>Company</strong> accounts for income taxes using the asset and liability<br />
method. Under this method deferred tax assets and liabilities are<br />
recognized for the future tax consequences of temporary differences<br />
between the carrying amounts and tax bases of assets and<br />
liabilities using enacted rates.<br />
Annual tax provisions include amounts considered sufficient to<br />
pay assessments that may result from examinations of prior year<br />
tax returns; however, the amount ultimately paid upon resolution<br />
of issues raised may differ from the amounts accrued. Provision is<br />
made for taxes on undistributed earnings of foreign subsidiaries<br />
and related companies to the extent that such earnings are not<br />
deemed to be permanently invested.<br />
Earnings per Common Share<br />
<strong>The</strong> calculation of earnings per common share is based on the<br />
weighted-average number of the <strong>Company</strong>’s common shares<br />
outstanding during the applicable period. <strong>The</strong> calculation for diluted<br />
earnings per common share reflects the effect of all dilutive potential<br />
common shares that were outstanding during the respective periods.<br />
Periods prior to 2001 have been adjusted to reflect the effects of<br />
the issuance of common shares of the <strong>Company</strong> in exchange for<br />
the common shares of Union Carbide.<br />
Accounting Changes<br />
In May 2000, the Emerging Issues Task Force (“EITF”) of the<br />
Financial Accounting Standards Board (“FASB”) reached a consensus<br />
with respect to EITF Issue 00-10, “Accounting for Shipping<br />
and Handling Fees and Costs.” EITF Issue 00-10 recognized the<br />
inconsistencies in practice with regard to the recording of shipping<br />
and handling costs incurred by most companies that sell goods.<br />
<strong>The</strong> <strong>Company</strong>, with the exception of Union Carbide, historically<br />
recorded freight and any directly related associated cost of transporting<br />
finished product to customers as a reduction of net sales.<br />
At the end of 2000, following the guidance of EITF Issue 00-10, the<br />
<strong>Company</strong> reclassified these costs to cost of sales for all periods<br />
presented. As a result, reported net sales increased approximately<br />
4 percent, with a corresponding increase in cost of sales.<br />
<strong>The</strong> FASB issued SFAS No. 133, “Accounting for Derivative<br />
Instruments and Hedging Activities,” in June 1998. SFAS No.<br />
133 requires an entity to recognize all derivatives as either<br />
assets or liabilities in the statement of financial position and<br />
measure those instruments at fair value. <strong>The</strong> <strong>Company</strong> adopted<br />
SFAS No. 133, as amended and interpreted by the FASB and the<br />
Derivatives Implementation Group through “Statement 133<br />
Implementation Issues,” on January 1, 2001. See Note H regarding<br />
the impact of adoption.<br />
In September 2000, the FASB issued SFAS No. 140,<br />
“Accounting for Transfers and Servicing of Financial Assets and<br />
Extinguishments of Liabilities.” This statement, which replaces<br />
SFAS No. 125, revises the standards for accounting for securitizations<br />
and other transfers of financial assets and collateral, and<br />
requires certain disclosures, but it carries over most of the provisions<br />
of SFAS No. 125 without reconsideration. SFAS No. 140<br />
was effective for transfers and servicing of financial assets and<br />
extinguishments of liabilities occurring after March 31, 2001. It<br />
was effective for recognition and reclassifications of collateral and<br />
for disclosures relating to securitization transactions and collateral<br />
for fiscal years ending after December 15, 2000. <strong>The</strong> adoption of<br />
SFAS No. 140 did not have a material impact on the <strong>Company</strong>’s<br />
consolidated financial statements. See Note I regarding sales of<br />
certain qualifying accounts receivables.<br />
In June 2001, the FASB issued SFAS No. 141, “Business<br />
Combinations,” which replaces Accounting Principles Board<br />
(“APB”) Opinion No. 16, “Business Combinations.” Under SFAS<br />
No. 141, all business combinations initiated after June 30, 2001 are<br />
accounted for using the purchase method. As required by SFAS<br />
No. 141, negative goodwill of $89 associated with the acquisition<br />
of Buna Sow Leuna Olefinverbund (“BSL”) in 1997 was written off<br />
and included in “Cumulative effect of changes in accounting principles”<br />
in the first quarter of 2002. <strong>The</strong> application of SFAS No. 141<br />
did not result in the reclassification of any amounts previously<br />
recorded as goodwill or other intangible assets.<br />
In June 2001, the FASB issued SFAS No. 142, “Goodwill and<br />
Other Intangible Assets,” which replaces APB Opinion No. 17,<br />
“Intangible Assets,” and establishes new accounting and reporting<br />
requirements for goodwill and other intangible assets, effective for<br />
fiscal years beginning after December 15, 2001. Under this statement,<br />
goodwill and intangible assets that are deemed to have<br />
indefinite useful lives are not amortized, but are subject to impairment<br />
testing. Impairment testing is required to be performed at<br />
adoption and at least annually thereafter. On an ongoing basis<br />
(absent any impairment indicators), <strong>Dow</strong> plans to perform impairment<br />
tests during the fourth quarter of each year, in conjunction<br />
with the <strong>Company</strong>’s annual budgeting process. Effective January 1,<br />
2002, <strong>Dow</strong> ceased all amortization of goodwill, which is its only<br />
intangible asset with an indefinite useful life, and tested recorded<br />
goodwill for impairment by comparing the fair value of each reporting<br />
unit, determined using a discounted cash flow method, with its<br />
carrying value.<br />
<strong>The</strong> <strong>Dow</strong> <strong>Chemical</strong> <strong>Company</strong> 47 >
Notes to the Consolidated Financial Statements (dollars in millions, except as noted)<br />
A. SUMMARY OF SIGNIFICANT ACCOUNTING POLICIES<br />
AND ACCOUNTING CHANGES (continued)<br />
As a result of the <strong>Company</strong>’s impairment testing, goodwill<br />
impairment losses totaling $22 were recorded in the first quarter<br />
of 2002 and included in “Cumulative effect of changes in accounting<br />
principles.” Summaries of the impairment losses are as follows:<br />
• <strong>The</strong> Hampshire Fine <strong>Chemical</strong>s reporting unit has<br />
experienced increased competition and the loss of several<br />
large customers. <strong>The</strong> reporting unit has revised its 10-year<br />
earnings forecast to reflect the decreased profitability<br />
outlook, and, as a result, the <strong>Company</strong> recognized a<br />
goodwill impairment loss of $18 in the first quarter of<br />
2002 in the Performance <strong>Chemical</strong>s segment.<br />
• <strong>The</strong> Rubber reporting unit has faced increased competition<br />
and rapidly rising hydrocarbon costs with a significant<br />
oversupply of natural rubber, resulting in steadily declining<br />
margins. Revisions were made to the 10-year earnings<br />
forecast to reflect these negative trends and, as a result,<br />
a goodwill impairment loss of $4 was recognized in the first<br />
quarter of 2002 in the Plastics segment.<br />
As required by SFAS No. 142, the <strong>Company</strong> also reassessed<br />
the useful lives and the classification of its identifiable intangible<br />
assets and determined them to be appropriate. See Note F for<br />
additional disclosures regarding the adoption of SFAS No. 142.<br />
In June 2001, the FASB issued SFAS No. 143, “Accounting for<br />
Asset Retirement Obligations,” which requires an entity to record<br />
the fair value of a liability for an asset retirement obligation in the<br />
period in which it is incurred and a corresponding increase in the<br />
related long-lived asset. <strong>The</strong> liability is adjusted to its present value<br />
each period and the asset is depreciated over its useful life. A gain<br />
or loss may be incurred upon settlement of the liability. SFAS<br />
No. 143 is effective for fiscal years beginning after June 15, 2002.<br />
Adoption of SFAS No. 143 will result in a charge of approximately<br />
$15 in the first quarter of 2003, which will be included in<br />
“Cumulative effect of changes in accounting principles.”<br />
In August 2001, the FASB issued SFAS No. 144, “Accounting<br />
for the Impairment or Disposal of Long-Lived Assets.” This statement<br />
replaces SFAS No. 121, “Accounting for the Impairment of<br />
Long-Lived Assets and for Long-Lived Assets to be Disposed of,”<br />
and provisions of APB Opinion No. 30, “Reporting the Results of<br />
Operations—Reporting the Effects of Disposal of a Segment of a<br />
Business, and Extraordinary, Unusual and Infrequently Occurring<br />
Events and Transactions” for the disposal of segments of a business.<br />
<strong>The</strong> statement creates one accounting model, based on the framework<br />
established in SFAS No. 121, to be applied to all long-lived<br />
assets, including discontinued operations. SFAS No. 144 is effective<br />
for fiscal years beginning after December 15, 2001. <strong>The</strong> <strong>Company</strong><br />
determined that its current accounting policy for the impairment of<br />
long-lived assets is consistent with SFAS No. 144.<br />
In June 2002, the FASB issued SFAS No. 146, “Accounting for<br />
Costs Associated with Exit or Disposal Activities,” which nullifies<br />
EITF Issue 94-3, “Liability Recognition for Certain Employee<br />
Termination Benefits and Other Costs to Exit an Activity.” This<br />
statement, which is effective for exit or disposal activities initiated<br />
after December 31, 2002, will change the measurement and timing<br />
of costs associated with exit and disposal activities undertaken by<br />
the <strong>Company</strong> in the future.<br />
> 48 <strong>The</strong> <strong>Dow</strong> <strong>Chemical</strong> <strong>Company</strong><br />
On August 26, 2002, the <strong>Company</strong> announced that in the first<br />
quarter of 2003 it would begin expensing stock options issued to<br />
employees in accordance with SFAS No. 123, “Accounting for<br />
Stock-Based Compensation.” <strong>Dow</strong> currently uses the accounting<br />
method prescribed by APB Opinion No. 25, “Accounting for Stock<br />
Issued to Employees,” as allowed by SFAS No. 123; however,<br />
expensing stock options is considered the preferable method of<br />
accounting for stock-based compensation. On December 31,<br />
2002, the FASB issued SFAS No. 148, “Accounting for Stock-<br />
Based Compensation—Transition and Disclosure,” which amends<br />
SFAS No. 123. SFAS No. 148, which is effective for fiscal years<br />
ending after December 15, 2002, provides alternative methods of<br />
transition for a voluntary change to the fair value based method<br />
and requires more prominent and more frequent disclosures in the<br />
financial statements about the effects of stock-based compensation.<br />
For its transition, <strong>Dow</strong> will use the transition method originally<br />
provided by SFAS No. 123 and expects the after-tax expense<br />
associated with stock options to be approximately $0.02 per share<br />
in 2003, growing to approximately $0.06 per share in 2005. <strong>The</strong>se<br />
estimates were based on the terms of <strong>Dow</strong>’s stock option plans and<br />
current assumptions for stock option grants and valuation, which<br />
may change when stock options are granted in 2003 and in the<br />
future. See Note N for disclosures related to stock compensation.<br />
In November 2002, the FASB issued FASB Interpretation<br />
(“FIN”) No. 45, “Guarantor’s Accounting and Disclosure<br />
Requirements for Guarantees, Including Indirect Guarantees of<br />
Indebtedness of Others.” FIN No. 45 clarifies the requirements<br />
of SFAS No. 5, “Accounting for Contingencies,” relating to the<br />
guarantor’s accounting for and disclosures of certain guarantees<br />
issued. <strong>The</strong> initial recognition and measurement provisions of the<br />
interpretation are applicable on a prospective basis to guarantees<br />
issued or modified after December 31, 2002, irrespective of the<br />
guarantor’s fiscal year-end. <strong>The</strong> disclosure requirements of the<br />
interpretation are effective for financial statements of interim or<br />
annual periods ending after December 15, 2002. <strong>The</strong> <strong>Company</strong>’s<br />
disclosures related to guarantees for the year ended December 31,<br />
2002 can be found in Note J.<br />
In January 2003, the FASB issued FIN No. 46, “Consolidation of<br />
Variable Interest Entities.” FIN No. 46 clarifies the application of<br />
Accounting Research Bulletin No. 51, “Consolidated Financial<br />
Statements,” to certain entities in which equity investors do not<br />
have the characteristics of a controlling financial interest or in<br />
which equity investors do not bear the residual economic risks.<br />
<strong>The</strong> interpretation applies to variable interest entities (“VIEs”)<br />
created after January 31, 2003, and to VIEs in which an enterprise<br />
obtains an interest after that date. It applies in the fiscal year<br />
or interim period beginning after June 15, 2003, to VIEs in which<br />
an enterprise holds a variable interest that was acquired before<br />
February 1, 2003. See Note M for disclosures regarding the<br />
<strong>Company</strong>’s VIEs, and the expected impact of adoption in the third<br />
quarter of 2003.
Notes to the Consolidated Financial Statements (dollars in millions, except as noted)<br />
B. PURCHASED IN-PROCESS RESEARCH AND DEVELOPMENT,<br />
AND MERGER-RELATED EXPENSES AND RESTRUCTURING<br />
Purchased In-Process Research and Development<br />
Purchased in-process research and development (“IPR&D”) represents<br />
the value assigned in a purchase business combination to<br />
research and development projects of the acquired business that<br />
had commenced but had not yet been completed at the date of<br />
acquisition and which have no alternative future use. In accordance<br />
with SFAS No. 2, “Accounting for Research and Development<br />
Costs,” as clarified by FIN No. 4, amounts assigned to IPR&D meeting<br />
the above-stated criteria must be charged to expense as part of<br />
the allocation of the purchase price of the business combination.<br />
<strong>The</strong> method used to determine the purchase price allocations<br />
for IPR&D for the acquisitions listed below was an income or cash<br />
flow method. <strong>The</strong> calculations were based on estimates of operating<br />
earnings, capital charges (representing the effect of capital expenditures),<br />
trade name royalties, charges for core technology, and<br />
working capital requirements to support the cash flows attributed<br />
to the technologies. <strong>The</strong> after-tax cash flows were bifurcated to<br />
reflect the stage of development of each technology. Discount<br />
rates reflecting the stage of development and the risk associated<br />
with each technology were used to value IPR&D. <strong>The</strong> <strong>Company</strong><br />
has substantial experience in research and development projects<br />
for new products, which enables it to establish realistic time<br />
frames for the completion of such projects; therefore, the<br />
<strong>Company</strong> believes there is limited risk that the projects described<br />
below will not be concluded within reasonable proximity to the<br />
expected completion dates.<br />
In 2000, the <strong>Company</strong> completed the appraisal of the technology<br />
acquired with the purchase of Flexible Products (see Note C) and<br />
recorded a pretax IPR&D charge of $6 in the Performance Plastics<br />
segment. Projects associated with technology acquired are expected<br />
to improve profitability and create new growth opportunities in the<br />
Polyurethanes formulations-based business. At year-end 2002,<br />
projects were approximately 75 percent complete.<br />
In 2001, the <strong>Company</strong> completed the appraisal of the technology<br />
acquired with the purchase of Rohm and Haas <strong>Company</strong>’s agricultural<br />
chemicals business (see Note C) and recorded a pretax<br />
IPR&D charge of $69 in the Agricultural Sciences segment.<br />
Projects associated with technology acquired are expected to<br />
create new growth opportunities for fungicides. At year-end 2002,<br />
the remaining projects were approximately 10 percent complete,<br />
with projected completion in 2008 or beyond.<br />
Merger-Related Expenses and Restructuring<br />
On March 29, 2001, <strong>Dow</strong>’s management made certain decisions<br />
relative to employment levels, duplicate assets and facilities and<br />
excess capacity resulting from the Union Carbide merger. <strong>The</strong>se<br />
decisions were based on management’s assessment of the actions<br />
necessary to achieve synergies as a result of the merger. <strong>The</strong> economic<br />
effects of these decisions, combined with merger-related<br />
transaction costs and certain asset impairments, resulted in a pretax<br />
special charge in the first quarter of 2001 of $1,384, which was<br />
included in Unallocated and Other for segment reporting purposes.<br />
<strong>The</strong> 2001 charge included $122 for transaction costs, which<br />
consisted primarily of investment banking, legal and accounting<br />
fees. All of these costs had been paid at March 31, 2001.<br />
<strong>The</strong> 2001 charge included $619 for the write-down of duplicate<br />
assets and facilities directly related to the merger. Included in the<br />
write-down were charges of $299 for assets and facilities that<br />
were rendered redundant as a result of the merger, $81 for lease<br />
abandonment reserves, $138 for asset impairments and $101 for<br />
losses on divestitures required for regulatory approval of the merger.<br />
Duplicate assets consisted principally of capitalized software costs,<br />
information technology equipment, and research and development<br />
facilities and equipment, all of which were written off during the<br />
first quarter of 2001. <strong>The</strong> fair values of the impaired assets, which<br />
include production facilities and transportation equipment, were<br />
determined based on discounted cash flows and an appraisal,<br />
respectively. <strong>The</strong>se components of the special charge will require<br />
limited future cash outlays, and will result in a decrease in annual<br />
depreciation of approximately $62. In November 2001, the decision<br />
to close a research and development facility in Bound Brook, New<br />
Jersey, was reversed, in light of difficult economic conditions; the<br />
facility will now remain open until at least 2005. Consequently, $55<br />
of the special charge was reversed during the fourth quarter of<br />
2001. At December 31, 2001, $77 of the reserve remained for the<br />
abandonment of leased facilities and demolition costs. <strong>The</strong> leased<br />
facilities will remain open until at least 2005.<br />
In addition to the special charge, one-time merger and integration<br />
costs, exclusively related to the Union Carbide merger, of $115<br />
were recorded in 2001. <strong>The</strong>se costs totaled $41 for 2002.<br />
<strong>The</strong> 2001 charge included $643 for employee-related costs, which<br />
consisted predominantly of provisions for employee severance,<br />
change of control obligations, medical and retirement benefits, and<br />
outplacement services. <strong>The</strong> <strong>Company</strong>’s integration plans included<br />
a workforce reduction of approximately 4,500 people, primarily<br />
from Union Carbide’s administrative, marketing, purchasing, research<br />
and development, and manufacturing workforce. <strong>The</strong> charge for<br />
severance was based upon the severance plan provisions communicated<br />
to employees. According to the initial integration plans, the<br />
<strong>Company</strong> expected to expend approximately 66 percent of the<br />
employee-related costs within the first two years following the<br />
merger, though the timing of severance payments is dependent<br />
upon employee elections. Expenditures with respect to employeerelated<br />
costs associated with pension and postretirement benefit<br />
plans will occur over a much more extended period. During the<br />
fourth quarter of 2001, a review of the <strong>Company</strong>’s integration plans<br />
resulted in a revision to the estimated workforce reduction, as<br />
actual reductions had exceeded the original plans. Consequently,<br />
the severance provision was increased $56 for an additional workforce<br />
reduction of approximately 600 people. As of December 31,<br />
2001, severance of $333 had been paid to approximately 3,100 former<br />
employees. In the first three quarters of 2002, severance of<br />
$132 was paid to approximately 1,750 former employees, bringing<br />
the program-to-date amount to $465 paid to approximately 4,850<br />
former employees. <strong>The</strong> planned merger-related program for<br />
workforce reductions was substantially completed in the third<br />
quarter of 2002.<br />
<strong>The</strong> <strong>Dow</strong> <strong>Chemical</strong> <strong>Company</strong> 49 >
Notes to the Consolidated Financial Statements (dollars in millions, except as noted)<br />
B. PURCHASED IN-PROCESS RESEARCH AND DEVELOPMENT, AND MERGER-RELATED EXPENSES AND RESTRUCTURING (continued)<br />
<strong>The</strong> following table summarizes the activity in the merger-related special charge reserve:<br />
During the fourth quarter of 2002, additional severance of $11<br />
was paid to 123 former employees and an additional charge of $34<br />
was recorded for merger-related severance. Under this revised severance<br />
program, 776 additional employees will receive severance<br />
payments in the first quarter of 2003. Additional reductions in<br />
headcount may continue as the <strong>Company</strong> continues its restructuring<br />
efforts. <strong>The</strong> <strong>Company</strong> will account for future workforce reductions<br />
as they occur.<br />
Other Restructuring<br />
In late 2002, immediately following the appointment of a new<br />
President and CEO, management began a series of studies to<br />
determine potential actions relative to under-performing assets<br />
and employment levels. Prior to the end of the year, certain studies<br />
were completed and management made decisions relative to certain<br />
assets. <strong>The</strong> economic effects of these decisions resulted in a pretax<br />
charge in the fourth quarter of 2002 of $168.<br />
<strong>The</strong> fourth quarter charge included $37 for severance for 624<br />
employees and was included in Unallocated and Other for segment<br />
reporting purposes. <strong>The</strong> charge for severance was based on severance<br />
plans communicated to employees. Employees have been<br />
notified and severance payments will begin in the first quarter; the<br />
program is expected to be completed by the third quarter of 2003.<br />
<strong>The</strong> remaining $131 of the fourth quarter charge related to asset<br />
write-downs and impairments and included the shutdown of a<br />
chlor-alkali production facility in Canada, the shutdown of an ethylene<br />
manufacturing facility in Texas, the impairment of non-strategic<br />
components of <strong>Dow</strong>’s operations in South Africa, and the impairment<br />
of a product development facility in Canada. <strong>The</strong> charge for the<br />
shutdown of facilities was $57 and represented the write-off of<br />
the net book value of those manufacturing plants. <strong>The</strong> impairment<br />
charge was $74 and was based on the fair values of the impaired<br />
business and production facilities: discounted cash flows for the<br />
Canadian facility, and fair market offers for the South African nonstrategic<br />
assets.<br />
In 2002, the <strong>Company</strong> also recorded severance of $5 related to<br />
a workforce reduction program at <strong>Dow</strong> AgroSciences.<br />
> 50 <strong>The</strong> <strong>Dow</strong> <strong>Chemical</strong> <strong>Company</strong><br />
WRITE-DOWN OF ONE-TIME MERGER<br />
TRANSACTION DUPLICATE ASSETS AND INTEGRATION LABOR-RELATED<br />
COSTS AND FACILITIES COSTS COSTS TOTAL<br />
2001<br />
Special charge $ 122 $ 619 – $ 643 $ 1,384<br />
Adjustments to reserve – (55) $ 115 43 103<br />
Charges against reserve (122) (487) (115) (333) (1,057)<br />
Balance at December 31, 2001 – $ 77 – $ 353 $ 430<br />
2002<br />
Adjustments to reserve – – $ 41 $ 21 $ 62<br />
Charges against reserve – $ (12) (41) (132) (185)<br />
Completion of program (1) – (65) – (242) (307)<br />
Balance at December 31, 2002 – – – – –<br />
(1)Upon completion of the program, the outstanding merger-related reserve for employee-related costs associated with pension and postretirement benefit plans is considered part of<br />
the <strong>Company</strong>’s regular pension and other postretirement obligations. <strong>The</strong> reserve related to the abandonment of leased facilities is included in “Other noncurrent obligations.”<br />
C. ACQUISITIONS AND DIVESTITURES<br />
Union Carbide Corporation Merger<br />
In August 1999, <strong>The</strong> <strong>Dow</strong> <strong>Chemical</strong> <strong>Company</strong> and Union Carbide<br />
announced a definitive merger agreement for a tax-free, stock-forstock<br />
transaction. Under the agreement, Union Carbide stockholders<br />
received 1.611 shares of <strong>Dow</strong> stock (on a post-split basis) for each<br />
share of Union Carbide stock they owned, for a total of approximately<br />
219 million shares. Based upon <strong>Dow</strong>’s closing price of $124<br />
11/16 (pre-split) on August 3, 1999, the transaction was valued at<br />
$66.96 per Union Carbide share, or $11.6 billion in aggregate<br />
including the assumption of $2.3 billion of net debt. At the time of<br />
the closing on February 6, 2001, the transaction would have been<br />
valued at $10.0 billion, on the same basis. According to the agreement,<br />
the merger was subject to certain conditions, including<br />
approval by Union Carbide stockholders and review by antitrust<br />
regulatory authorities in the United States, Europe and Canada.<br />
Union Carbide stockholders approved the merger on December 1,<br />
1999. On May 3, 2000, the European Commission approved the<br />
merger subject to certain conditions. On February 6, 2001, after<br />
receiving clearance from the U.S. Federal Trade Commission, the<br />
Canadian Competition Bureau and other jurisdictions around<br />
the world, Union Carbide merged with a subsidiary of <strong>The</strong> <strong>Dow</strong><br />
<strong>Chemical</strong> <strong>Company</strong>, and Union Carbide became a wholly owned<br />
subsidiary of <strong>Dow</strong>. As part of the regulatory approval process, the<br />
<strong>Company</strong> agreed to:<br />
•Divest certain European polyethylene assets. (<strong>The</strong> sale of<br />
Union Carbide’s 50 percent ownership in Polimeri Europa<br />
S.r.l. to EniChem was completed in April 2001.)<br />
•Divest and license certain polyethylene gas-phase technology<br />
globally. (Completed in the first quarter of 2001.)<br />
• Contribute the Unipol polyethylene process technology<br />
licensing and polyethylene conventional catalyst businesses<br />
of Union Carbide to Univation Technologies LLC. (Occurred<br />
simultaneously with the merger.)<br />
•Divest <strong>Dow</strong>’s worldwide ethyleneamines business (with the<br />
exception of <strong>Dow</strong>’s facility in Terneuzen, <strong>The</strong> Netherlands).<br />
(Business was sold to Huntsman International, LLC in the<br />
first quarter of 2001.)
Notes to the Consolidated Financial Statements (dollars in millions, except as noted)<br />
•Divest <strong>Dow</strong>’s worldwide ethanolamines business.<br />
(Business was sold to INEOS plc in the first quarter of 2001.)<br />
•Divest the North American Gas/Spec gas treating business.<br />
(Business was sold to INEOS plc in the first quarter of 2001.)<br />
<strong>The</strong> Union Carbide merger was accounted for as a pooling<br />
of interests. Accordingly, the consolidated financial statements<br />
include the combined results of <strong>Dow</strong> and Union Carbide for all<br />
periods presented. See Note B regarding a special charge for<br />
merger-related expenses and restructuring recorded during 2001.<br />
Other Significant Acquisitions and Divestitures<br />
<strong>The</strong> acquisitions included below were accounted for using the<br />
purchase method of accounting.<br />
In April 1995, the <strong>Company</strong> signed an agreement with<br />
Bundesanstalt für vereinigungsbedingte Sonderaufgaben (“BvS”)<br />
for the privatization of three state-owned chemical companies<br />
in eastern Germany, Buna Sow Leuna Olefinverbund (“BSL”).<br />
Economic transfer of business operations to the <strong>Company</strong>, through<br />
the privatization agreement and various service agreements,<br />
occurred in June 1995, and the <strong>Company</strong> began a reconstruction<br />
program of the sites. In September 1997, the <strong>Company</strong> acquired<br />
80 percent ownership in BSL for an investment of $174; BvS<br />
maintained 20 percent ownership. <strong>The</strong> <strong>Company</strong> had a call option<br />
and BvS a put option for the remaining 20 percent of BSL after<br />
the reconstruction period. In May 2000, the <strong>Company</strong> announced<br />
the completion of the reconstruction program and, for an additional<br />
investment of $156, acquired the remaining 20 percent of BSL. On<br />
June 1, 2000, BSL became a wholly owned subsidiary of the<br />
<strong>Company</strong> and, beginning on that date, the financial results of BSL<br />
are fully consolidated.<br />
BvS provided certain incentives during the reconstruction period<br />
to cover portions of the reconstruction program and retained<br />
environmental cleanup obligations for existing facilities. Incentives<br />
related to property construction reduced the cost basis of such<br />
property. Incentives related to expenses during the reconstruction<br />
period were recognized as such expenses were incurred. During<br />
the reconstruction period, the <strong>Company</strong> included the financial<br />
results of BSL as a nonconsolidated affiliate.<br />
In February 2000, the <strong>Company</strong> acquired Flexible Products<br />
<strong>Company</strong> of Marietta, Georgia, for approximately $160. Flexible<br />
Products <strong>Company</strong> was one of the largest polyurethane systems<br />
suppliers in North America and a leader in custom polyurethane<br />
foam formulations and dispensing technology.<br />
In December 2000, the <strong>Company</strong> sold its 32.5 percent ownership<br />
interest in the Cochin pipeline system to NOVA <strong>Chemical</strong>s<br />
Corporation for $119, resulting in a pretax gain of $98. <strong>The</strong><br />
<strong>Company</strong> initially announced its agreement to sell its interest in the<br />
pipeline to a unit of Williams’ energy services business in August<br />
2000. In October 2000, NOVA <strong>Chemical</strong>s Corporation, one of the<br />
owners of Cochin, exercised its right of first refusal as provided<br />
in the contractual agreements among the Cochin owners.<br />
In January 2001, the <strong>Company</strong> acquired the 50 percent interest<br />
in Gurit-Essex AG that it did not previously own from Gurit-<br />
Heberlein AG for approximately $390, and began fully consolidating<br />
the results of Gurit-Essex AG. Gurit-Essex AG is the largest<br />
European supplier of automotive adhesives, sealants and body<br />
engineered systems for the automotive OEM and aftermarket. <strong>The</strong><br />
acquisition has globalized <strong>Dow</strong> Automotive’s product availability<br />
and doubled the <strong>Company</strong>’s adhesives, sealants and body engineered<br />
systems business.<br />
On February 9, 2001, <strong>Dow</strong> announced it had reached an agreement<br />
with EniChem to acquire its polyurethanes business, which<br />
had annual sales of approximately $500. <strong>The</strong> acquisition, which<br />
strengthens <strong>Dow</strong>’s polyurethanes portfolio by enhancing its<br />
European presence, was completed in April 2001 for a net cash<br />
cost of approximately $80. In the second quarter of 2001, the<br />
<strong>Company</strong> began including the results of this business in its consolidated<br />
financial statements. Under the terms of the agreement,<br />
<strong>Dow</strong> divested Union Carbide’s 50 percent interest in Polimeri<br />
Europa S.r.l. to EniChem in order to satisfy the European<br />
Commission’s conditions for approval of the merger.<br />
On March 8, 2001, <strong>Dow</strong> announced it had reached an agreement<br />
to acquire Rohm and Haas <strong>Company</strong>’s agricultural chemicals<br />
business, including working capital, for approximately $1 billion.<br />
After receiving regulatory approval, the <strong>Company</strong> announced<br />
completion of the acquisition on June 1, 2001, and began including<br />
the results of this business in its consolidated financial statements.<br />
During the third quarter of 2001, the <strong>Company</strong> recorded a pretax<br />
charge of $69 for IPR&D costs as part of the allocation of the<br />
purchase price (see Note B). In the second quarter of 2002, the<br />
<strong>Company</strong> finalized its allocation of the purchase price to the assets<br />
acquired and liabilities assumed, principally resulting in adjustments<br />
to the values assigned to goodwill, property and accounts receivable.<br />
On March 29, 2001, <strong>Dow</strong> announced it was making a tender<br />
offer to acquire 100 percent of the outstanding shares of Ascot Plc,<br />
a publicly traded U.K. company with annual chemical sales of<br />
approximately $335. <strong>The</strong> European Commission granted regulatory<br />
approval of the acquisition on May 11, 2001, and the <strong>Company</strong><br />
declared its offer to acquire Ascot wholly unconditional on June 1,<br />
2001, and began including the results of Ascot in its consolidated<br />
financial statements. <strong>The</strong> acquisition was valued at approximately<br />
$450. <strong>Dow</strong> has integrated the Fine <strong>Chemical</strong>s and Specialty<br />
<strong>Chemical</strong>s businesses of Ascot into the Performance <strong>Chemical</strong>s<br />
segment. In the second quarter of 2002, the <strong>Company</strong> finalized its<br />
allocation of the purchase price to the assets acquired and liabilities<br />
assumed, principally resulting in adjustments to the values<br />
assigned to goodwill, property and other intangible assets.<br />
See Note B regarding certain charges recorded related to<br />
acquisitions and divestitures.<br />
<strong>The</strong> <strong>Dow</strong> <strong>Chemical</strong> <strong>Company</strong> 51 >
Notes to the Consolidated Financial Statements (dollars in millions, except as noted)<br />
D. INVENTORIES<br />
<strong>The</strong> following table provides a breakdown of inventories at<br />
December 31, 2002 and 2001:<br />
2002 2001<br />
Finished goods $2,523 $2,675<br />
Work in process 843 894<br />
Raw materials 452 509<br />
Supplies 390 362<br />
Total inventories $4,208 $4,440<br />
<strong>The</strong> reserves reducing inventories from the first-in, first-out<br />
(“FIFO”) basis to the last-in, first-out (“LIFO”) basis amounted<br />
to $209 at December 31, 2002 and $146 at December 31, 2001.<br />
Inventories valued on a LIFO basis, principally hydrocarbon and<br />
U.S. chemicals and plastics product inventories, represented 40<br />
percent of total inventories at December 31, 2002 and 36 percent<br />
of total inventories at December 31, 2001.<br />
A reduction of certain inventories resulted in the liquidation of<br />
some quantities of LIFO inventory, which reduced pretax loss $71<br />
in 2002 and $19 in 2001, and increased pretax income $67 in 2000.<br />
F. GOODWILL AND OTHER INTANGIBLE ASSETS<br />
E. PROPERTY<br />
Property at December 31<br />
ESTIMATED USEFUL<br />
LIVES (YEARS) 2002 2001<br />
Land – $ 506 $ 445<br />
Land and waterway improvements 15–25 1,060 994<br />
Buildings 5–55 3,169 3,009<br />
Machinery and equipment 3–20 28,135 26,221<br />
Utility and supply lines 5–20 1,732 1,584<br />
Other 3–30 1,968 2,351<br />
Construction in progress – 1,364 1,286<br />
Total $37,934 $35,890<br />
2002 2001 2000<br />
Depreciation expense $1,680 $1,595 $1,554<br />
Manufacturing maintenance<br />
and repair costs 1,090 1,015 1,027<br />
Capitalized interest 51 54 98<br />
<strong>The</strong> <strong>Company</strong> ceased amortizing goodwill upon adoption of SFAS No. 142 on January 1, 2002 (see Note A). <strong>The</strong> following table provides<br />
pro forma results for the years ended December 31, 2001 and 2000, as if the non-amortization provisions of SFAS No. 142 had been<br />
applied in 2001 and 2000, compared with actual results for the year ended December 31, 2002:<br />
2002 2001 2000<br />
Reported income (loss) before cumulative effect of changes in accounting principles $(405) $(417) $1,675<br />
Reported net income (loss) $(338) $(385) $1,675<br />
Adjustments:<br />
Goodwill amortization, net of tax – $ 128 $ 99<br />
Negative goodwill amortization, net of tax – (10) (3)<br />
Equity method goodwill amortization, net of tax – 11 9<br />
Total adjustments – $ 129 $ 105<br />
Adjusted income (loss) before cumulative effect of changes in accounting principles $(405) $(288) $1,780<br />
Adjusted net income (loss) $(338) $(256) $1,780<br />
Reported earnings (loss) before cumulative effect of changes in accounting principles<br />
per common share—basic $(0.44) $(0.46) $ 1.88<br />
Reported earnings (loss) per common share—basic $(0.37) $(0.43) $ 1.88<br />
Adjustments:<br />
Goodwill amortization, net of tax – $ 0.14 $ 0.11<br />
Negative goodwill amortization, net of tax – (0.01) –<br />
Equity method goodwill amortization, net of tax – 0.01 0.01<br />
Total adjustments – $ 0.14 $ 0.12<br />
Adjusted earnings (loss) before cumulative effect of changes in accounting principles<br />
per common share—basic $(0.44) $(0.32) $ 2.00<br />
Adjusted earnings (loss) per common share—basic $(0.37) $(0.29) $ 2.00<br />
Reported earnings (loss) before cumulative effect of changes in accounting principles<br />
per common share—diluted $(0.44) $(0.46) $ 1.85<br />
Reported earnings (loss) per common share—diluted $(0.37) $(0.43) $ 1.85<br />
Adjustments:<br />
Goodwill amortization, net of tax – $ 0.14 $ 0.11<br />
Negative goodwill amortization, net of tax – (0.01) –<br />
Equity method goodwill amortization, net of tax – 0.01 0.01<br />
Total adjustments – $ 0.14 $ 0.12<br />
Adjusted earnings (loss) before cumulative effect of changes in accounting principles<br />
per common share—diluted $(0.44) $(0.32) $ 1.97<br />
Adjusted earnings (loss) per common share—diluted $(0.37) $(0.29) $ 1.97<br />
> 52 <strong>The</strong> <strong>Dow</strong> <strong>Chemical</strong> <strong>Company</strong>
Notes to the Consolidated Financial Statements (dollars in millions, except as noted)<br />
Accumulated amortization for goodwill upon adoption of SFAS No. 142 was $569. <strong>The</strong> following table shows changes in the carrying<br />
amount of goodwill for the year ended December 31, 2002, by operating segment:<br />
PERFORMANCE PERFORMANCE AGRICULTURAL HYDROCARBONS<br />
PLASTICS CHEMICALS SCIENCES PLASTICS AND ENERGY TOTAL<br />
Goodwill at January 1, 2002 $889 $754 $1,303 $121 $63 $3,130<br />
Increase related to acquisition of remaining 49.99%<br />
interest in Branco <strong>Dow</strong> Compostos de Engenharia 1 – – – – 1<br />
Impairment losses:<br />
Hampshire Fine <strong>Chemical</strong>s – (18) – – – (18)<br />
Rubber – – – (4) – (4)<br />
Total impairment losses – (18) – (4) – (22)<br />
Goodwill write-off related to sale of Chlorchem – (3) – – – (3)<br />
Purchase price allocation adjustments:<br />
Ascot – 27 – – – 27<br />
Buildscape 11 – – – – 11<br />
Gurit-Essex 3 – – – – 3<br />
Rohm and Haas agricultural chemicals – – 17 – – 17<br />
Reichhold paper and carpet latex – 25 – – – 25<br />
Total adjustments 14 52 17 – – 83<br />
Goodwill at December 31, 2002 $904 $785 $1,320 $117 $63 $3,189<br />
During the fourth quarter of 2002, the <strong>Company</strong> performed impairment tests for goodwill in conjunction with its annual budgeting<br />
process. As a result of this review, it was determined that no goodwill impairments existed.<br />
<strong>The</strong> following table provides information regarding the <strong>Company</strong>’s other intangible assets:<br />
Other Intangible Assets at December 31<br />
2002 2001<br />
GROSS GROSS<br />
CARRYING ACCUMULATED CARRYING ACCUMULATED<br />
AMOUNT AMORTIZATION NET AMOUNT AMORTIZATION NET<br />
Intangible assets with finite lives:<br />
Licenses and intellectual property $304 $(121) $183 $278 $ (87) $ 191<br />
Patents 156 (66) 90 161 (54) 107<br />
Software 258 (124) 134 291 (188) 103<br />
Trademarks 137 (15) 122 126 (6) 120<br />
Other 107 (23) 84 97 (11) 86<br />
Total $962 $(349) $613 $953 $(346) $ 607<br />
<strong>The</strong> following table provides a summary of acquisitions of<br />
intangible assets during the year:<br />
Acquisitions of Intangible Assets in 2002<br />
ACQUISITION WEIGHTED-AVERAGE<br />
COST AMORTIZATION PERIOD<br />
Intangible assets with finite lives:<br />
Licenses and intellectual property $16 7.6 years<br />
Software 56 5.0 years<br />
Other 4 10.5 years<br />
Total $76 5.9 years<br />
Amortization expense for other intangible assets (not including<br />
software) was $65 for 2002, compared with $48 for 2001 and $29<br />
for 2000. Amortization expense for software, which is included in<br />
cost of sales, totaled $30 in 2002, compared with $18 in 2001 and<br />
$39 in 2000. Total estimated amortization expense for the next five<br />
fiscal years is as follows:<br />
ESTIMATED<br />
AMORTIZATION EXPENSE<br />
2003 $84<br />
2004 80<br />
2005 72<br />
2006 67<br />
2007 57<br />
<strong>The</strong> <strong>Dow</strong> <strong>Chemical</strong> <strong>Company</strong> 53 >
Notes to the Consolidated Financial Statements (dollars in millions, except as noted)<br />
G. SIGNIFICANT NONCONSOLIDATED AFFILIATES AND RELATED<br />
COMPANY TRANSACTIONS<br />
<strong>The</strong> <strong>Company</strong>’s investments in related companies accounted for<br />
by the equity method (“nonconsolidated affiliates”) were $1,565<br />
at December 31, 2002 and $1,581 at December 31, 2001. <strong>The</strong>se<br />
amounts approximate the <strong>Company</strong>’s proportionate share of the<br />
underlying net assets of the companies accounted for by the<br />
equity method. Differences between the <strong>Company</strong>’s investments<br />
in nonconsolidated affiliates and its share of the investees’ net<br />
assets, exclusive of <strong>Dow</strong> Corning Corporation (“<strong>Dow</strong> Corning”)<br />
were $203 at December 31, 2002 and $218 at December 31, 2001.<br />
Prior to 2002, the differences were amortized over estimated useful<br />
lives, which ranged from 5 to 40 years. Amortization ceased effective<br />
January 1, 2002, in accordance with SFAS No. 142, “Goodwill and<br />
Other Intangible Assets” (see Note F).<br />
In May 1995, <strong>Dow</strong> Corning, in which the <strong>Company</strong> is a 50 percent<br />
shareholder, voluntarily filed for protection under Chapter 11 of the<br />
U.S. Bankruptcy Code (see Note J). As a result, the <strong>Company</strong> fully<br />
reserved its investment in <strong>Dow</strong> Corning and reserved its 50 percent<br />
share of equity earnings from that time through the third quarter of<br />
2000. For the first three quarters of 2000, equity earnings totaling<br />
$39 were recorded and reserved. It was the <strong>Company</strong>’s determination<br />
during this period of time that the decline in the value of its<br />
investment in <strong>Dow</strong> Corning was other than temporary. Following<br />
Judge Denise Page Hood’s November 13, 2000 affirmation<br />
of the Bankruptcy Court’s order confirming the Joint Plan of<br />
Reorganization, the <strong>Company</strong> reviewed the value of its investment<br />
in <strong>Dow</strong> Corning, revised its assessment of the recoverability of its<br />
investment, and determined that it had adequately provided for the<br />
other than temporary decline associated with the bankruptcy.<br />
A difference between the <strong>Company</strong>’s recorded share of the<br />
underlying equity of <strong>Dow</strong> Corning and the carrying value of this<br />
investment has existed since May 1995, when the <strong>Company</strong><br />
wrote down its investment to zero in response to <strong>Dow</strong> Corning’s<br />
bankruptcy filing. <strong>The</strong> difference at December 31, 2002 was<br />
approximately $237. <strong>Dow</strong> Corning recognized the financial impact<br />
of implementing the approved Joint Plan of Reorganization during<br />
1998 and 1999, including all liabilities and obligations. With the<br />
exception of the remote possibility of a future bankruptcy related<br />
charge, the <strong>Company</strong> considers the difference between the carrying<br />
value of its investment in <strong>Dow</strong> Corning and its 50 percent share of<br />
<strong>Dow</strong> Corning’s equity to be permanent.<br />
<strong>Dow</strong>’s principal nonconsolidated affiliates and the <strong>Company</strong>’s<br />
direct or indirect ownership interest for each at December 31,<br />
2002, 2001 and 2000 are shown below:<br />
Principal Nonconsolidated Affiliates at December 31<br />
2002<br />
OWNERSHIP INTEREST<br />
2001 2000<br />
<strong>Dow</strong> Corning Corporation 50% 50% 50%<br />
DuPont <strong>Dow</strong> Elastomers L.L.C 50% 50% 50%<br />
EQUATE Petrochemical<br />
<strong>Company</strong> K.S.C. 45% 45% 45%<br />
Gurit-Essex AG – – 50%<br />
Nippon Unicar <strong>Company</strong> Limited 50% 50% 50%<br />
Polimeri Europa S.r.l. – – 50%<br />
Siam Styrene Monomer Co., Ltd. 49% 49% 49%<br />
TOTAL Raffinaderij Nederland N.V. 45% 45% 45%<br />
UOP LLC 50% 50% 50%<br />
> 54 <strong>The</strong> <strong>Dow</strong> <strong>Chemical</strong> <strong>Company</strong><br />
<strong>The</strong> <strong>Company</strong>’s investment in these companies was $1,113 at<br />
December 31, 2002 and $1,007 at December 31, 2001, and its<br />
equity in their earnings was $142 in 2002, $97 in 2001 and $412 in<br />
2000, after reserving the earnings related to <strong>Dow</strong> Corning through<br />
the third quarter of 2000. All of the nonconsolidated affiliates in<br />
which the <strong>Company</strong> has investments are privately held companies;<br />
therefore, quoted market prices are not available. <strong>The</strong> summarized<br />
financial information presented below represents the combined<br />
accounts (at 100 percent) of the principal nonconsolidated affiliates.<br />
On June 1, 2000, BSL became a wholly owned subsidiary of the<br />
<strong>Company</strong> and, beginning on that date, the financial results of BSL<br />
are fully consolidated (see Note C). <strong>The</strong> summarized income statement<br />
information for 2000 includes BSL’s sales, gross profit and<br />
net income from January 1, 2000 through May 31, 2000.<br />
On January 10, 2001, Gurit-Essex AG became a wholly owned<br />
subsidiary of the <strong>Company</strong> and, beginning on that date, the financial<br />
results of Gurit-Essex AG are fully consolidated. In April 2001, in<br />
order to satisfy the European Commission’s condition for approval<br />
of the Union Carbide merger, the <strong>Company</strong> divested its 50 percent<br />
interest in Polimeri Europa S.r.l. to EniChem S.p.A. <strong>The</strong> summarized<br />
balance sheet and income statement information below for the<br />
principal nonconsolidated affiliates for 2001 and 2002 does not<br />
include Gurit-Essex AG or Polimeri Europa S.r.l. (see Note C).<br />
Summarized Balance Sheet Information at December 31<br />
2002 2001<br />
Current assets $3,557 $3,365<br />
Noncurrent assets 6,178 5,849<br />
Total assets $9,735 $9,214<br />
Current liabilities $2,148 $1,843<br />
Noncurrent liabilities 5,018 4,972<br />
Total liabilities $7,166 $6,815<br />
Summarized Income Statement Information<br />
2002 2001 2000<br />
Sales $5,542 $5,291 $8,574<br />
Gross profit 1,628 1,378 2,158<br />
Net income 229 109 710<br />
Dividends received from related companies were $93 in 2002,<br />
$54 in 2001 and $132 in 2000.<br />
<strong>The</strong> <strong>Company</strong> has service agreements with some of these<br />
entities, including contracts to manage the operations of manufacturing<br />
sites and the construction of new facilities; licensing and<br />
technology agreements; and marketing, sales, purchase and lease<br />
agreements. Transactions with related companies and balances<br />
due to related companies were not material to the consolidated<br />
financial statements.
Notes to the Consolidated Financial Statements (dollars in millions, except as noted)<br />
H. FINANCIAL INSTRUMENTS<br />
Investments<br />
<strong>The</strong> <strong>Company</strong>’s investments in marketable securities are primarily<br />
classified as available-for-sale. Maturities for approximately 26<br />
percent of the debt securities were less than five years at<br />
December 31, 2002.<br />
Investing Results<br />
2002 2001 2000<br />
Proceeds from sales of<br />
available-for-sale securities $1,659 $2,900 $4,231<br />
Gross realized gains 333 410 343<br />
Gross realized losses (334) (157) (163)<br />
Risk Management<br />
<strong>The</strong> <strong>Company</strong>’s risk management program for interest rate, foreign<br />
currency and commodity risks is based on fundamental, mathematical<br />
and technical models that take into account the implicit<br />
cost of hedging. Risks created by derivative instruments and the<br />
mark-to-market valuations of positions are strictly monitored at all<br />
times. <strong>The</strong> <strong>Company</strong> uses value at risk and stress tests to monitor<br />
risk. Credit risk arising from these contracts is not significant<br />
because the counterparties to these contracts are primarily major<br />
international financial institutions and, to a lesser extent, major<br />
chemical and petroleum companies, and the <strong>Company</strong> does not<br />
anticipate any such losses. <strong>The</strong> net cash requirements arising<br />
from risk management activities are not expected to be material<br />
in 2003. <strong>The</strong> <strong>Company</strong> reviews its overall financial strategies and<br />
impacts from using derivatives in its risk management program<br />
with the Board of Directors’ Finance Committee and revises its<br />
strategies as market conditions dictate.<br />
<strong>The</strong> <strong>Company</strong> minimizes concentrations of credit risk through<br />
its global orientation in diverse businesses with a large number of<br />
diverse customers and suppliers. No significant concentration of<br />
credit risk existed at December 31, 2002.<br />
Fair Value of Financial Instruments at December 31<br />
Interest Rate Risk Management<br />
<strong>The</strong> <strong>Company</strong> enters into various interest rate contracts with the<br />
objective of lowering funding costs or altering interest rate exposures<br />
related to fixed and variable rate obligations. In these contracts, the<br />
<strong>Company</strong> agrees with other parties to exchange, at specified<br />
intervals, the difference between fixed and floating interest<br />
amounts calculated on an agreed-upon notional principal amount.<br />
Foreign Currency Risk Management<br />
<strong>The</strong> <strong>Company</strong>’s global operations require active participation in<br />
foreign exchange markets. <strong>The</strong> <strong>Company</strong> enters into foreign<br />
exchange forward contracts and options, and cross-currency swaps<br />
to hedge various currency exposures or create desired exposures.<br />
Exposures primarily relate to assets and liabilities and bonds<br />
denominated in foreign currencies, as well as economic exposure,<br />
which is derived from the risk that currency fluctuations could<br />
affect the dollar value of future cash flows related to operating<br />
activities. <strong>The</strong> primary business objective of the activity is to optimize<br />
the U.S. dollar value of the <strong>Company</strong>’s assets, liabilities and<br />
future cash flows with respect to exchange rate fluctuations.<br />
Assets and liabilities denominated in the same foreign currency are<br />
netted, and only the net exposure is hedged. At December 31,<br />
2002, the <strong>Company</strong> had forward contracts and options to buy, sell<br />
or exchange foreign currencies. <strong>The</strong>se contracts and options had<br />
various expiration dates, primarily in the first quarter of the next year.<br />
Commodity Risk Management<br />
<strong>The</strong> <strong>Company</strong> has exposure to the prices of commodities in its<br />
procurement of certain raw materials. <strong>The</strong> primary purpose of<br />
commodity hedging activities is to manage the volatility associated<br />
with these forecasted inventory purchases. <strong>The</strong> <strong>Company</strong> had<br />
futures contracts, options and swaps to buy, sell or exchange<br />
commodities. <strong>The</strong>se agreements had various expiration dates in<br />
2003 through 2004.<br />
2002 2001<br />
COST GAIN LOSS FAIR VALUE COST GAIN LOSS FAIR VALUE<br />
Marketable securities:<br />
Debt securities $ 1,035 $ 85 $ (50) $ 1,070 $ 952 $ 18 $ (12) $ 958<br />
Equity securities 651 5 (86) 570 630 47 (35) 642<br />
Other 22 6 – 28 5 – – 5<br />
Total $ 1,708 $ 96 $(136) $ 1,668 $1,587 $ 65 $ (47) $ 1,605<br />
Long-term debt including<br />
debt due within one year (1) $(12,456) $ 45 $(417) $(12,828) $(9,674) $ 7 $(516) $(10,183)<br />
Derivatives relating to:<br />
Foreign currency – $128 $(510) $ (382) – $154 $(117) $ 37<br />
Interest rates – 67 (86) (19) – 27 (34) (7)<br />
Commodities – 123 (12) 111 – 4 (29) (25)<br />
(1) Cost includes fair value adjustments per SFAS No. 133 of $129 in 2002 and $22 in 2001.<br />
Cost approximates fair value for all other financial instruments.<br />
<strong>The</strong> <strong>Dow</strong> <strong>Chemical</strong> <strong>Company</strong> 55 >
Notes to the Consolidated Financial Statements (dollars in millions, except as noted)<br />
H. FINANCIAL INSTRUMENTS (continued)<br />
Accounting for Derivative Instruments and Hedging Activities<br />
Effective January 1, 2001, the <strong>Company</strong> adopted SFAS No. 133, as<br />
amended by SFAS No. 137 and SFAS No. 138, and as interpreted<br />
by the FASB and the Derivatives Implementation Group through<br />
“Statement 133 Implementation Issues.” <strong>The</strong> adoption of SFAS<br />
No. 133 resulted in the <strong>Company</strong> recording a transition adjustment<br />
gain of $32 (net of related income tax of $19) in net income and a<br />
net transition adjustment gain of $65 (net of related income tax of<br />
$38) in “Accumulated other comprehensive income” (“AOCI”) at<br />
January 1, 2001. <strong>The</strong> short-cut method under SFAS No. 133 is<br />
being used when the criteria are met. <strong>The</strong> <strong>Company</strong> anticipates<br />
volatility in AOCI and net income from its cash flow hedges. <strong>The</strong><br />
amount of volatility varies with the level of derivative activities and<br />
market conditions during any period. Derivative assets are included<br />
in “Deferred charges and other assets” and derivative liabilities are<br />
included in “Accrued and other current liabilities” on the consolidated<br />
balance sheets.<br />
At December 31, 2002, the <strong>Company</strong> had interest rate swaps in<br />
a net gain position of $55 designated as fair value hedges of underlying<br />
fixed rate debt obligations and a net loss position of $68<br />
designated as cash flow hedges of underlying forecasted interest<br />
payments. <strong>The</strong>se hedges had various expiration dates in 2003<br />
through 2022. <strong>The</strong> mark-to-market effects of both the fair value<br />
hedge instruments and the underlying debt obligations were<br />
recorded as unrealized gains and losses in interest expense and<br />
are directly offsetting to the extent the hedges are effective. <strong>The</strong><br />
effective portion of the mark-to-market effects of the cash flow<br />
hedge instrument is recorded in AOCI until the underlying interest<br />
payment affects income. <strong>The</strong> net loss from interest rate hedges<br />
included in AOCI at December 31, 2002 was $51 after tax. <strong>The</strong><br />
amount to be reclassified from AOCI to interest expense within<br />
the next twelve months is expected to be a net loss of $16. <strong>The</strong><br />
unrealized amounts in AOCI will fluctuate based on changes in the<br />
fair value of open contracts at the end of each reporting period. All<br />
existing fair value and cash flow hedges are highly effective. As a<br />
result, there was no material impact on income due to hedge<br />
ineffectiveness. Net gains recorded in interest expense related to<br />
fair value hedge terminations were $11 in 2002 and $3 in 2001.<br />
<strong>The</strong>re was no material impact on income due to cash flow hedge<br />
terminations in 2002 and 2001.<br />
Commodity swaps and futures contracts with maturities of not<br />
more than 36 months are utilized and qualify as cash flow hedges.<br />
Current open contracts hedge forecasted transactions until<br />
December 2004. <strong>The</strong> effective portion of the mark-to-market<br />
effects of the cash flow hedge instrument is recorded in AOCI until<br />
the underlying commodity purchase affects income. <strong>The</strong> net gain<br />
from commodity hedges included in AOCI at December 31, 2002<br />
was $21 after tax. A net after-tax gain of approximately $15 is<br />
expected to be reclassified from AOCI to “Cost of sales” in the<br />
consolidated statements of income within the next twelve<br />
months. <strong>The</strong> unrealized amounts in AOCI will fluctuate based on<br />
changes in the fair value of open contracts at the end of each<br />
reporting period. During 2002 and 2001, there was no material<br />
impact on the financial statements due to hedge ineffectiveness.<br />
> 56 <strong>The</strong> <strong>Dow</strong> <strong>Chemical</strong> <strong>Company</strong><br />
In addition, the <strong>Company</strong> utilizes option and swap instruments<br />
that are effective as economic hedges of commodity price exposures,<br />
but do not meet SFAS No. 133 hedge accounting criteria. At<br />
December 31, 2002, the <strong>Company</strong> had derivative assets of $73<br />
and derivative liabilities of $7 relating to these instruments, with<br />
the related mark-to-market effects included in “Cost of sales” in<br />
the consolidated statements of income.<br />
At December 31, 2002, a net loss of $146 ($92 after tax) resulting<br />
from hedges of the <strong>Company</strong>’s net investment in foreign operations<br />
was included in the cumulative translation adjustment in<br />
AOCI. <strong>The</strong>re was no material impact on income due to hedge ineffectiveness.<br />
At December 31, 2001, the <strong>Company</strong> reported a net<br />
gain of $112 ($70 after tax) from hedges of the <strong>Company</strong>’s net<br />
investment in foreign operations in AOCI and a net gain of $9 ($6<br />
after tax) from net investment hedge ineffectiveness in income.<br />
<strong>The</strong> <strong>Company</strong> also uses other derivative instruments that are<br />
not designated as hedging instruments, primarily to manage foreign<br />
currency exposure, the impact of which was not material to the<br />
consolidated financial statements.<br />
I. SUPPLEMENTARY INFORMATION<br />
Accrued and Other Current Liabilities at December 31<br />
2002 2001<br />
Accrued payroll $ 124 $ 65<br />
Accrued vacations 176 159<br />
Employee retirement plans 296 123<br />
Interest payable 211 206<br />
Accrued miscellaneous taxes 185 204<br />
Insurance companies’ reserves 337 302<br />
Deferred income 233 317<br />
Other 736 744<br />
Total $2,298 $2,120<br />
Sundry Income—Net<br />
2002 2001 2000<br />
Gain on sales of assets<br />
and securities (1) $53 $378 $206<br />
Foreign exchange gain (loss) (7) (24) 37<br />
Other—net 8 40 109<br />
Total $54 $394 $352<br />
(1) 2002 included a gain of $63 on the sale of Oasis Pipe Line <strong>Company</strong>. 2001 included<br />
a gain of $266 on the sale of stock in Schlumberger Ltd. 2000 included a gain of<br />
$98 on the sale of Cochin pipeline system (see Note C) and impairment losses of $77<br />
for the anticipated disposition of businesses related to the Union Carbide merger.<br />
Other Supplementary Information<br />
2002 2001 2000<br />
Cash payments for interest $806 $711 $705<br />
Cash payments for income taxes 105 278 730<br />
Provision for doubtful receivables 12 39 24
Notes to the Consolidated Financial Statements (dollars in millions, except as noted)<br />
Sales of Accounts Receivables<br />
Since 1997, the <strong>Company</strong> has routinely sold, without recourse,<br />
a participation in a pool of qualifying trade accounts receivables.<br />
According to the agreements of the program, <strong>Dow</strong> maintains the<br />
servicing of these receivables. In 2000, a maximum of $450 in<br />
receivables was available for sale in the pool, and as receivables<br />
in the pool were collected, new receivables were added. In June<br />
2001, a new agreement for sales of qualifying trade accounts<br />
Earnings (Loss) Per Share Calculations<br />
J. COMMITMENTS AND CONTINGENT LIABILITIES<br />
Litigation<br />
Breast Implant Matters<br />
On May 15, 1995, <strong>Dow</strong> Corning Corporation (“<strong>Dow</strong> Corning”), in<br />
which the <strong>Company</strong> is a 50 percent shareholder, voluntarily filed<br />
for protection under Chapter 11 of the Bankruptcy Code to resolve<br />
litigation related to <strong>Dow</strong> Corning’s breast implant and other silicone<br />
medical products. As a consequence of that action and prior<br />
charges taken by <strong>Dow</strong> Corning, the <strong>Company</strong> fully reserved its<br />
investment in <strong>Dow</strong> Corning and reserved its 50 percent share of<br />
equity earnings through the third quarter of 2000 (see Note G).<br />
<strong>The</strong> <strong>Company</strong>’s financial statement exposure for breast implant<br />
product liability claims against <strong>Dow</strong> Corning is limited to its investment<br />
in <strong>Dow</strong> Corning, which, after fully reserving its investment<br />
in <strong>Dow</strong> Corning and reserving its share of equity earnings through<br />
the third quarter of 2000, is not material. As a result, any future<br />
charges by <strong>Dow</strong> Corning related to such claims or as a result of the<br />
Chapter 11 proceeding would not have a material adverse impact<br />
on the <strong>Company</strong>’s consolidated financial statements.<br />
<strong>The</strong> <strong>Company</strong> is separately named as a defendant in more than<br />
14,000 breast implant product liability cases, of which approximately<br />
4,000 state cases are the subject of summary judgments in<br />
favor of the <strong>Company</strong>. In these situations, plaintiffs have alleged<br />
that the <strong>Company</strong> should be liable for <strong>Dow</strong> Corning’s alleged torts<br />
based on the <strong>Company</strong>’s 50 percent stock ownership in <strong>Dow</strong><br />
Corning and that the <strong>Company</strong> should be liable by virtue of alleged<br />
“direct participation” by the <strong>Company</strong> or its agents in <strong>Dow</strong><br />
Corning’s breast implant business. <strong>The</strong>se latter, direct participation<br />
claims include counts sounding in strict liability, fraud, aiding and<br />
abetting, conspiracy, concert of action and negligence.<br />
receivables of Union Carbide increased the pool maximum to<br />
$750. In June 2002, the pool maximum was revised to $700. <strong>The</strong><br />
average monthly participation in the pool was $471 in 2002, $432<br />
in 2001 and $155 in 2000. <strong>The</strong> net cash flow in any given period<br />
represents the discount on sales, which is recorded as interest<br />
expense. <strong>The</strong> average monthly discount was approximately $0.7<br />
in 2002, $1.1 in 2001 and $0.7 in 2000.<br />
2002 2001 2000<br />
SHARES IN MILLIONS BASIC DILUTED BASIC DILUTED BASIC DILUTED<br />
Income (Loss) before cumulative effect of<br />
changes in accounting principles $ (405) $ (405) $ (417) $ (417) $1,675 $1,675<br />
Cumulative effect of changes in accounting principles 67 67 32 32 – –<br />
Net income (loss) available for common stockholders $ (338) $ (338) $ (385) $ (385) $1,675 $1,675<br />
Weighted-average common shares outstanding 910.5 910.5 901.8 901.8 893.2 893.2<br />
Add back effect of dilutive securities:<br />
Stock options and awards (1) – – – – – 10.8<br />
Converted preferred stock – – – – – 0.5<br />
Weighted-average common shares for EPS calculations 910.5 910.5 901.8 901.8 893.2 904.5<br />
Earnings (Loss) per common share before cumulative<br />
effect of changes in accounting principles $(0.44) $ (0.44) $(0.46) $ (0.46) $ 1.88 $ 1.85<br />
Earnings (Loss) per common share $(0.37) $ (0.37) $(0.43) $ (0.43) $ 1.88 $ 1.85<br />
(1) Due to reported net losses in 2002 and 2001, the effect of stock options and awards of 7.0 million shares in 2002 and 11.2 million shares in 2001 was antidilutive and was therefore<br />
excluded from the diluted earnings per share calculation.<br />
Judge Sam C. Pointer of the U.S. District Court for the Northern<br />
District of Alabama was appointed by the Federal Judicial Panel on<br />
Multidistrict Litigation to oversee all of the product liability cases<br />
involving silicone breast implants filed in the U.S. federal courts.<br />
Initially, in a ruling issued on December 1, 1993, Judge Pointer<br />
granted the <strong>Company</strong>’s motion for summary judgment, finding that<br />
there was no basis on which a jury could conclude that the<br />
<strong>Company</strong> was liable for any claimed defects in the breast implants<br />
manufactured by <strong>Dow</strong> Corning. In an interlocutory opinion issued<br />
on April 25, 1995, Judge Pointer affirmed his earlier ruling as<br />
to plaintiffs’ corporate control claims but vacated that ruling as to<br />
plaintiffs’ direct participation claims.<br />
On July 7, 1998, <strong>Dow</strong> Corning, the <strong>Company</strong> and Corning<br />
Incorporated (“Corning”), on the one hand, and the Tort Claimants’<br />
Committee in <strong>Dow</strong> Corning’s bankruptcy on the other, agreed on<br />
a binding Term Sheet to resolve all tort claims involving <strong>Dow</strong><br />
Corning’s silicone medical products, including the claims against<br />
Corning and the <strong>Company</strong> (collectively, the “Shareholders”). <strong>The</strong><br />
agreement set forth in the Term Sheet was memorialized in a Joint<br />
Plan of Reorganization (the “Joint Plan”) filed by <strong>Dow</strong> Corning and<br />
the Tort Claimants’ Committee (collectively, the “Proponents”) on<br />
November 9, 1998. On February 4, 1999, the Bankruptcy Court<br />
approved the disclosure statement describing the Joint Plan.<br />
Before the Joint Plan could become effective, however, it was<br />
subject to a vote by the claimants, a confirmation hearing and<br />
all relevant provisions of the Bankruptcy Code. Voting was completed<br />
on May 14, 1999, and the confirmation hearing concluded<br />
on July 30, 1999.<br />
<strong>The</strong> <strong>Dow</strong> <strong>Chemical</strong> <strong>Company</strong> 57 >
Notes to the Consolidated Financial Statements (dollars in millions, except as noted)<br />
J. COMMITMENTS AND CONTINGENT LIABILITIES (continued)<br />
On November 30, 1999, the Bankruptcy Court issued an Order<br />
confirming the Joint Plan, but then issued an Opinion on<br />
December 21, 1999, that, in the view of the Proponents and the<br />
Shareholders, improperly interpreted or attempted to modify certain<br />
provisions of the Joint Plan affecting the resolution of tort claims<br />
involving <strong>Dow</strong> Corning’s silicone medical products against various<br />
entities, including the Shareholders. Many of the parties in interest,<br />
including the Shareholders, filed various motions and appeals<br />
seeking, among other things, a clarification of the December 21,<br />
1999 Opinion. <strong>The</strong>se motions and appeals were heard by U.S.<br />
District Court Judge Denise Page Hood on April 12 and 13, 2000,<br />
and on November 13, 2000, Judge Hood affirmed the Bankruptcy<br />
Court’s November 30, 1999 Order confirming the Joint Plan and<br />
reversed, in part, the Bankruptcy Court’s December 21, 1999<br />
Opinion, including that portion of the Opinion the Shareholders had<br />
appealed. In turn, various parties in interest appealed Judge Hood’s<br />
decision to the United States Court of Appeals for the Sixth Circuit,<br />
which heard oral arguments in the matter on October 23, 2001. On<br />
January 29, 2002, the Sixth Circuit issued its opinion which, among<br />
other things, affirmed Judge Hood’s determination that claims<br />
against various entities, including the Shareholders, may be<br />
enjoined where “unusual circumstances” exist, and remanded the<br />
case to the District Court for certain factual determinations. On<br />
December 11, 2002, Judge Hood found that the release and<br />
injunction provisions of the Plan were appropriate based on the<br />
factual determination that “unusual circumstances” do exist in this<br />
case. <strong>The</strong> effectiveness of the Joint Plan remains subject to any<br />
subsequent appellate action. Accordingly, there can be no assurance<br />
at this time that the Joint Plan will become effective.<br />
It is the opinion of the <strong>Company</strong>’s management that the possibility<br />
is remote that plaintiffs will prevail on the theory that the<br />
<strong>Company</strong> should be liable in the breast implant litigation because<br />
of its shareholder relationship with <strong>Dow</strong> Corning. <strong>The</strong> <strong>Company</strong>’s<br />
management believes that there is no merit to plaintiffs’ claims<br />
that the <strong>Company</strong> is liable for alleged defects in <strong>Dow</strong> Corning’s silicone<br />
products because of the <strong>Company</strong>’s alleged direct participation<br />
in the development of those products, and the <strong>Company</strong><br />
intends to contest those claims vigorously. Management believes<br />
that the possibility is remote that a resolution of plaintiffs’ direct<br />
participation claims, including the vigorous defense against those<br />
claims, would have a material adverse impact on the <strong>Company</strong>’s<br />
financial position or cash flows. Nevertheless, in light of Judge<br />
Pointer’s April 25, 1995 ruling, it is possible that a resolution of<br />
plaintiffs’ direct participation claims, including the vigorous defense<br />
against those claims, could have a material adverse impact on the<br />
<strong>Company</strong>’s results of operations for a particular period, although<br />
it is impossible at this time to estimate the range or amount of<br />
any such impact.<br />
> 58 <strong>The</strong> <strong>Dow</strong> <strong>Chemical</strong> <strong>Company</strong><br />
DBCP Matters<br />
Numerous lawsuits have been brought against the <strong>Company</strong> and<br />
other chemical companies, both inside and outside of the United<br />
States, alleging that the manufacture, distribution or use of pesticides<br />
containing dibromochloropropane (“DBCP”) has caused personal<br />
injury and property damage, including contamination of groundwater.<br />
It is the opinion of the <strong>Company</strong>’s management that the possibility<br />
is remote that the resolution of such lawsuits will have a material<br />
adverse impact on the <strong>Company</strong>’s consolidated financial statements.<br />
Environmental Matters<br />
Accruals for environmental matters are recorded when it is probable<br />
that a liability has been incurred and the amount of the liability<br />
can be reasonably estimated, based on current law and existing<br />
technologies. <strong>The</strong> <strong>Company</strong> had accrued obligations of $444 at<br />
December 31, 2001, for environmental remediation and restoration<br />
costs, including $47 for the remediation of Superfund sites. At<br />
December 31, 2002, the <strong>Company</strong> had accrued obligations of $394<br />
for environmental remediation and restoration costs, including $43<br />
for the remediation of Superfund sites. This is management’s best<br />
estimate of the costs for remediation and restoration with respect<br />
to environmental matters for which the <strong>Company</strong> has accrued<br />
liabilities, although the ultimate cost with respect to these particular<br />
matters could range up to twice that amount. Inherent uncertainties<br />
exist in these estimates primarily due to unknown conditions,<br />
changing governmental regulations and legal standards regarding<br />
liability, and evolving technologies for handling site remediation<br />
and restoration. It is the opinion of the <strong>Company</strong>’s management<br />
that the possibility is remote that costs in excess of those accrued<br />
or disclosed will have a material adverse impact on the <strong>Company</strong>’s<br />
consolidated financial statements.<br />
Asbestos-Related Matters of Union Carbide Corporation<br />
Union Carbide Corporation (“Union Carbide”), a wholly owned<br />
subsidiary of the <strong>Company</strong>, is and has been involved in a large<br />
number of asbestos-related suits filed primarily in state courts<br />
during the past three decades. <strong>The</strong>se suits principally allege<br />
personal injury resulting from exposure to asbestos-containing<br />
products and frequently seek both actual and punitive damages,<br />
often in very large amounts. <strong>The</strong> alleged claims primarily relate to<br />
products that Union Carbide sold in the past, alleged exposure to<br />
asbestos-containing products located on Union Carbide’s premises,<br />
and Union Carbide’s responsibility for asbestos suits filed against<br />
a former Union Carbide subsidiary, Amchem Products, Inc.<br />
(“Amchem”). In many cases, plaintiffs are unable to demonstrate<br />
that they have suffered any compensable loss as a result of such<br />
exposure, or that injuries incurred in fact resulted from exposure<br />
to Union Carbide’s products.<br />
<strong>The</strong> rate at which plaintiffs filed asbestos-related suits against<br />
various companies, including Union Carbide and Amchem,<br />
increased in both 2001 and 2002, influenced by the bankruptcy filings<br />
of numerous defendants in asbestos-related litigation. Union<br />
Carbide expects more asbestos-related suits to be filed against<br />
Union Carbide and Amchem in the future. Union Carbide will<br />
aggressively defend or reasonably resolve, as appropriate, both<br />
pending and future claims.
Notes to the Consolidated Financial Statements (dollars in millions, except as noted)<br />
Typically, Union Carbide is only one of many named defendants,<br />
many of which, including Union Carbide and Amchem, were<br />
members of the Center for Claims Resolution (“CCR”), an entity<br />
that defended and resolved asbestos cases on behalf of its members.<br />
As members of the CCR, Union Carbide’s and Amchem’s<br />
strategy was to resolve the claims against them at the relatively<br />
small percentage allocated to them pursuant to the CCR’s collective<br />
defense. <strong>The</strong> CCR ceased operating in February 2001, except to<br />
administer certain settlements. Union Carbide then began using<br />
Peterson Asbestos Claims Enterprise, but only for claims processing<br />
and insurance invoicing.<br />
Certain members of <strong>Dow</strong>’s legal department and certain<br />
<strong>Dow</strong> management personnel have been retained to provide<br />
their experience in mass tort litigation to assist Union Carbide<br />
in responding to asbestos-related matters. In early 2002, Union<br />
Carbide hired new outside counsel to serve as national trial counsel.<br />
In connection with these actions, aggressive defense strategies<br />
were designed to reduce the cost of resolving all asbestos-related<br />
claims, including the elimination of claims that lack demonstrated<br />
illness or causality.<br />
At the end of 2001 and through the third quarter of 2002, Union<br />
Carbide had concluded it was not possible to estimate its cost of<br />
disposing of asbestos-related claims that might be filed against<br />
Union Carbide and Amchem in the future due to a number of<br />
reasons, including its lack of sufficient comparable loss history<br />
from which to assess either the number or value of future<br />
asbestos-related claims. During the third and fourth quarters of<br />
2002, Union Carbide worked with Analysis, Research & Planning<br />
Corporation (“ARPC”), a consulting firm with broad experience in<br />
estimating resolution costs associated with mass tort litigation,<br />
including asbestos, to explore whether it would be possible to<br />
estimate the cost of disposing of pending and future asbestosrelated<br />
claims that have been, and could reasonably be expected<br />
to be, filed against Union Carbide and Amchem.<br />
Union Carbide provided ARPC with all relevant data regarding<br />
asbestos-related claims filed against Union Carbide and Amchem<br />
through November 6, 2002. ARPC concluded that it was not possible<br />
to estimate the full range of the cost of resolving future asbestosrelated<br />
claims against Union Carbide and Amchem, because of<br />
various uncertainties associated with the litigation of those claims.<br />
<strong>The</strong>se uncertainties, which hindered Union Carbide’s ability to project<br />
future claim volumes and resolution costs, included the following:<br />
• Until a series of bankruptcies led to the CCR ceasing<br />
operations in early 2001, Union Carbide and Amchem generally<br />
settled claims filed against CCR members according to a<br />
sharing formula that would not necessarily reflect the cost<br />
of resolving those claims had they been separately litigated<br />
against Union Carbide or Amchem.<br />
• <strong>The</strong> bankruptcies in the years 2000 to 2002 of other<br />
companies facing large asbestos liability were a likely<br />
contributing cause of a sharp increase in filings against<br />
many defendants, including Union Carbide and Amchem.<br />
• It was not until the CCR ceased operating in early 2001 that<br />
Union Carbide took direct responsibility for the defense of<br />
claims against itself and Amchem.<br />
•New defense counsel for Union Carbide and Amchem<br />
implemented more aggressive defense strategies in mid-2002.<br />
Despite its inability to estimate the full range of the cost of resolving<br />
future asbestos-related claims, ARPC advised Union Carbide<br />
that it would be possible to determine an estimate of a reasonable<br />
forecast of the cost of resolving pending and future asbestosrelated<br />
claims likely to face Union Carbide and Amchem, if certain<br />
assumptions were made. Specifically, ARPC advised Union<br />
Carbide that for purposes of determining an estimate it is reasonable<br />
to assume that in the near term asbestos-related claims filed<br />
against Union Carbide and Amchem are unlikely to return to levels<br />
below those experienced prior to 2001—when the recent spike in<br />
filings commenced—and that average claim values are unlikely to<br />
return to levels below those experienced in 2001–2002, the years<br />
immediately following CCR’s cessation of operations. ARPC<br />
advised Union Carbide that, by assuming that future filings were<br />
unlikely to exceed the levels experienced prior to 2001 and extrapolating<br />
from 2001 and 2002 average claim values, ARPC could<br />
make a reasonable forecast of the cost of resolving asbestos-related<br />
claims facing Union Carbide and Amchem. ARPC also advised<br />
Union Carbide that forecasts of resolution costs for a 10 to 15 year<br />
period from the date of the forecast are likely to be more accurate<br />
than forecasts for longer periods of time.<br />
In projecting Union Carbide’s resolution costs for future<br />
asbestos-related claims, ARPC applied two methodologies that<br />
have been widely used for forecasting purposes. Applying these<br />
methodologies, ARPC forecast the number and allocation by disease<br />
category of those potential future claims on a year-by-year basis<br />
through 2049. ARPC then calculated the percentage of claims in<br />
each disease category that had been closed with payments<br />
in 2001 and 2002. Using those percentages, ARPC calculated the<br />
number of future claims by disease category that would likely<br />
require payment by Union Carbide and Amchem and multiplied the<br />
number of such claims by the mean values paid by Union Carbide<br />
and Amchem, respectively, to dispose of such claims in 2001 and<br />
2002. In estimating Union Carbide’s cost of resolving pending<br />
claims, ARPC used a process similar to that used for calculating<br />
the cost of resolving future claims.<br />
As of December 31, 2002, ARPC estimated the undiscounted<br />
cost of resolving pending and future asbestos-related claims<br />
against Union Carbide and Amchem, excluding future defense and<br />
processing costs, for the 15-year period from the present through<br />
2017 to be between approximately $2.2 billion and $2.4 billion,<br />
depending on which of the two accepted methodologies was used.<br />
<strong>The</strong> <strong>Dow</strong> <strong>Chemical</strong> <strong>Company</strong> 59 >
Notes to the Consolidated Financial Statements (dollars in millions, except as noted)<br />
J. COMMITMENTS AND CONTINGENT LIABILITIES (continued)<br />
Although ARPC provided estimates for a longer period of time,<br />
based on ARPC’s advice that forecasts for shorter periods of time<br />
are more accurate and in light of the uncertainties inherent in making<br />
long-term projections, Union Carbide determined that the 15-year<br />
period through 2017 is the reasonable time period for projecting<br />
the cost of disposing of its future asbestos-related claims. Union<br />
Carbide concluded that it is probable that the undiscounted cost of<br />
disposing of asbestos-related pending and future claims ranges<br />
from $2.2 billion to $2.4 billion, which is the range for the 15-year<br />
period ending in 2017 as estimated by ARPC using both methodologies.<br />
Accordingly, Union Carbide increased its asbestos-related<br />
liability for pending and future claims at December 31, 2002 to $2.2<br />
billion, excluding future defense and processing costs. For pending<br />
claims, Union Carbide had an asbestos-related liability of $233 at<br />
December 31, 2001.<br />
Union Carbide also increased the receivable for insurance<br />
recoveries related to its asbestos liability to $1.35 billion at<br />
December 31, 2002, substantially exhausting its asbestos product<br />
liability coverage. This resulted in a net income statement impact<br />
to Union Carbide of $828, $522 on an after-tax basis, in the fourth<br />
quarter of 2002. Union Carbide’s receivable for insurance recoveries<br />
related to its asbestos liability was $223 at December 31, 2001.<br />
<strong>The</strong> insurance receivable related to the asbestos liability was determined<br />
by Union Carbide after a thorough review of applicable<br />
insurance policies and the 1985 Wellington Agreement, to which<br />
Union Carbide and many of its liability insurers are signatory parties,<br />
as well as other insurance settlements, with due consideration<br />
given to applicable deductibles, retentions and policy limits, and<br />
taking into account the solvency and historical payment experience<br />
of various insurance carriers.<br />
In addition, Union Carbide had receivables for insurance recoveries<br />
for defense and resolution costs of $219 at December 31,<br />
2002 and $35 at December 31, 2001. Defense and resolution costs<br />
for Union Carbide’s asbestos-related litigation were $247 in 2002,<br />
$53 in 2001 and $53 in 2000. <strong>The</strong> $247 in 2002 included $92 for<br />
defense costs (which included significant costs for the development<br />
and implementation of Union Carbide’s new and more<br />
aggressive defense strategies) and $63 for bulk settlements with<br />
multiple claimants. To date, substantially all of these defense and<br />
resolution costs were covered by insurance. Insurance coverage<br />
for future asbestos-related defense costs will exist, but to a lesser<br />
extent. <strong>The</strong> pretax impact to Union Carbide for these defense and<br />
resolution costs, net of insurance, was $9 in 2002, $9 in 2001 and<br />
$4 in 2000, and was reflected in “Cost of sales.”<br />
> 60 <strong>The</strong> <strong>Dow</strong> <strong>Chemical</strong> <strong>Company</strong><br />
<strong>The</strong> amounts recorded by Union Carbide for the asbestos-related<br />
liability and related insurance receivable described above were<br />
based upon currently known facts. However, projecting future<br />
events, such as the number of new claims to be filed each year,<br />
the average cost of disposing of each such claim, coverage issues<br />
among insurers, and the continuing solvency of various insurance<br />
companies, as well as the numerous uncertainties surrounding<br />
asbestos litigation in the United States, could cause the actual<br />
costs and insurance recoveries for Union Carbide to be higher or<br />
lower than those projected or those recorded. Union Carbide<br />
expenses defense and processing costs as incurred. Accordingly,<br />
defense and processing costs incurred by Union Carbide in the<br />
future for asbestos-related litigation, net of insurance, will impact<br />
Union Carbide’s results of operations in future periods.<br />
Because of the uncertainties described above, Union Carbide’s<br />
management cannot estimate the full range of the cost of resolving<br />
pending and future asbestos-related claims facing Union Carbide<br />
and Amchem. Union Carbide’s management believes that it is<br />
reasonably possible that the cost of disposing of Union Carbide’s<br />
asbestos-related claims, including future defense and processing<br />
costs, could have a material adverse impact on Union Carbide’s<br />
results of operations and cash flows for a particular period and on<br />
the consolidated financial position of Union Carbide.<br />
It is the opinion of <strong>Dow</strong>’s management that it is reasonably<br />
possible that the cost of Union Carbide disposing of its asbestosrelated<br />
claims, including future defense and processing costs,<br />
could have a material adverse impact on the <strong>Company</strong>’s results of<br />
operations and cash flows for a particular period and on the consolidated<br />
financial position of the <strong>Company</strong>.<br />
Other Litigation Matters<br />
In addition to the breast implant, DBCP and environmental remediation<br />
matters, the <strong>Company</strong> is party to a number of other claims<br />
and lawsuits arising out of the normal course of business with<br />
respect to commercial matters, including product liability, governmental<br />
regulation and other actions. Certain of these actions purport<br />
to be class actions and seek damages in very large amounts. All<br />
such claims are being contested. <strong>Dow</strong> has an active risk management<br />
program consisting of numerous insurance policies secured<br />
from many carriers at various times. <strong>The</strong>se policies provide coverage<br />
that will be utilized to minimize the impact, if any, of the contingencies<br />
described above.<br />
Except for the possible effect of Union Carbide’s asbestos-related<br />
liability described above and the possible effect on the <strong>Company</strong>’s<br />
net income for breast implant litigation, also described above, it is<br />
the opinion of the <strong>Company</strong>’s management that the possibility is<br />
remote that the aggregate of all claims and lawsuits will have a<br />
material adverse impact on the <strong>Company</strong>’s consolidated financial<br />
statements.
Notes to the Consolidated Financial Statements (dollars in millions, except as noted)<br />
Purchase Commitments<br />
<strong>The</strong> <strong>Company</strong> has three major agreements for the purchase<br />
of ethylene-related products in Canada. <strong>The</strong> purchase prices are<br />
determined on a cost-of-service basis, which, in addition to covering<br />
all operating expenses and debt service costs, provides the owner<br />
of the manufacturing plants with a specified return on capital. Total<br />
purchases under the agreements were $293 in 2002, $221 in 2001<br />
and $178 in 2000.<br />
At December 31, 2002, the <strong>Company</strong> had various outstanding<br />
commitments for take or pay and throughput agreements, including<br />
the purchase agreements referred to above, with terms extending<br />
from one to 25 years. In general, such commitments were at<br />
prices not in excess of current market prices. <strong>The</strong> fixed and determinable<br />
portion of obligations under these purchase commitments<br />
at December 31, 2002 are presented in the following table:<br />
Fixed and Determinable Portion of Take or Pay and<br />
Throughput Obligations at December 31, 2002<br />
2003 $ 556<br />
2004 511<br />
2005 472<br />
2006 408<br />
2007 407<br />
2008 through expiration of contracts 2,041<br />
Total $4,395<br />
In addition to the take or pay obligations at December 31, 2002,<br />
the <strong>Company</strong> had outstanding purchase commitments which<br />
ranged from one to 23 years for steam, electrical power, materials,<br />
property and other items used in the normal course of business<br />
of approximately $158. In general, such commitments were at<br />
prices not in excess of current market prices. <strong>The</strong> <strong>Company</strong> was<br />
also committed to lease manufacturing facilities under construction<br />
in <strong>The</strong> Netherlands and a pipeline under construction in<br />
Germany (see Note M).<br />
Guarantees<br />
<strong>The</strong> <strong>Company</strong> provides a variety of guarantees, as described more<br />
fully in the following sections.<br />
Guarantees<br />
Guarantees arise during the ordinary course of business from<br />
relationships with customers and nonconsolidated affiliates when<br />
the <strong>Company</strong> undertakes an obligation to guarantee the performance<br />
of others (via delivery of cash or other assets) if specified triggering<br />
events occur. Non-performance under a contract by the guaranteed<br />
party triggers the obligation of the <strong>Company</strong>. Such non-performance<br />
usually relates to commercial obligations or loans.<br />
Residual Value Guarantees<br />
<strong>The</strong> <strong>Company</strong> provides guarantees related to leased assets specifying<br />
the residual value that will be available to the lessor at lease<br />
termination through sale of the assets to the lessee or third parties.<br />
<strong>The</strong> following table provides a summary of the aggregate terms,<br />
maximum future payments and associated liability reflected in the<br />
consolidated balance sheet for each type of guarantee:<br />
Guarantees at December 31, 2002<br />
FINAL MAXIMUM FUTURE RECORDED<br />
EXPIRATION PAYMENTS LIABILITY<br />
Guarantees 2009 $ 928 –<br />
Residual value guarantees 2017 1,694 –<br />
Total $ 2,622 –<br />
Warranties<br />
<strong>The</strong> <strong>Company</strong> records a liability when certain special-use products<br />
are sold with an express warranty for which the customer pays<br />
a fee in return for a quality guarantee. <strong>The</strong> guarantee is usually<br />
expressed in a formal surety agreement. Most sureties cover a 15<br />
to 20 year period and <strong>Dow</strong> is obligated to take out specific insurance<br />
to warrant that customers will be paid for any covered loss regardless<br />
of whether <strong>Dow</strong> continues in that line of business. Minor and<br />
recurring adjustments for quality defects on products in general<br />
are handled through routine procedures and charged against sales<br />
revenue upon issuance of a sales credit. Loss experience determines<br />
the potential expense associated with the surety agreements.<br />
Favorable loss experience could result in a profit to <strong>Dow</strong>. <strong>The</strong><br />
<strong>Company</strong>’s product warrant liability at December 31, 2002 and<br />
2001 was $1.<br />
<strong>The</strong> <strong>Dow</strong> <strong>Chemical</strong> <strong>Company</strong> 61 >
Notes to the Consolidated Financial Statements (dollars in millions, except as noted)<br />
K. NOTES PAYABLE, LONG-TERM DEBT AND AVAILABLE<br />
CREDIT FACILITIES<br />
Notes payable consisted primarily of obligations due to banks with<br />
a variety of interest rates and maturities.<br />
Notes Payable at December 31<br />
2002 2001<br />
Commercial paper – $ 205<br />
Other notes payable $580 1,004<br />
Total $580 $1,209<br />
Year-end average interest rates (1) 6.42% 4.07%<br />
(1) <strong>The</strong> increase in 2002 reflects a significant increase in interest rates in Latin America.<br />
Long-Term Debt at December 31<br />
<strong>The</strong> <strong>Company</strong> had unused and committed credit facilities at<br />
December 31, 2002, with various U.S. and foreign banks totaling<br />
$3.1 billion. <strong>The</strong>se credit facilities require the payment of commitment<br />
fees. <strong>The</strong>se facilities include a $1.75 billion 364-day revolving<br />
credit facility agreement that matures in June 2003, a $1.25 billion<br />
5-year revolving credit facility agreement that matures in June<br />
2004, and a $75 364-day bilateral facility with a major financial institution<br />
that matures in June 2003. <strong>The</strong> <strong>Company</strong> intends to renew<br />
these facilities at their respective maturities. Additional unused and<br />
uncommitted credit facilities totaling $857 were available for use<br />
by foreign subsidiaries. <strong>The</strong>se facilities are available in support of<br />
commercial paper borrowings and working capital requirements.<br />
> 62 <strong>The</strong> <strong>Dow</strong> <strong>Chemical</strong> <strong>Company</strong><br />
Annual Installments on Long-Term Debt for Next Five Years<br />
2003 $ 797<br />
2004 1,102<br />
2005 598<br />
2006 1,134<br />
2007 1,177<br />
2002 2001<br />
AVERAGE RATE 2002 AVERAGE RATE 2001<br />
Promissory notes and debentures:<br />
Final maturity 2002 – – 6.95% $ 348<br />
Final maturity 2003 6.62% $ 523 6.62% 523<br />
Final maturity 2004 5.25% 1,010 5.25% 1,000<br />
Final maturity 2005 7.00% 308 7.00% 298<br />
Final maturity 2006 8.63% 197 8.63% 188<br />
Final maturity 2007 5.03% 519 – –<br />
Final maturity 2008 and thereafter (1) 6.84% 6,192 7.12% 4,756<br />
Foreign bonds:<br />
Final maturity 2003, Euro 5.00% 157 5.00% 133<br />
Final maturity 2006, Japanese yen 0.71% 251 0.71% 228<br />
Other facilities:<br />
U.S. dollar loans—various rates and maturities 3.35% 61 3.80% 65<br />
Foreign currency loans—various rates and maturities 5.01% 121 6.42% 66<br />
<strong>Dow</strong> ESOP, final maturity 2004 9.42% 29 9.42% 42<br />
Medium-term notes, varying maturities through 2022 6.10% 753 8.60% 292<br />
Foreign medium-term notes, final maturity 2006, Euro 5.00% 633 5.00% 523<br />
Foreign medium-term notes, final maturity 2007, Euro 5.63% 544 – –<br />
Pollution control/industrial revenue bonds, varying maturities through 2033 3.45% 1,186 3.59% 1,247<br />
Unexpended construction funds – (2) – –<br />
Capital lease obligations – 42 – 46<br />
Unamortized debt discount – (68) – (81)<br />
Long-term debt due within one year – (797) – (408)<br />
Total 5.50% $11,659 6.21% $9,266<br />
(1) Holders of $250 of debentures due in 2025 may request redemption on June 1, 2005.<br />
<strong>The</strong> <strong>Company</strong>’s outstanding public debt has been issued under<br />
indentures which contain, among other provisions, covenants with<br />
which the <strong>Company</strong> must comply while the underlying notes are<br />
outstanding. Such covenants include obligations not to allow liens<br />
on principal U.S. manufacturing facilities, enter into sale and leaseback<br />
transactions with respect to principal U.S. manufacturing<br />
facilities, or merge or consolidate with any other corporation or sell<br />
or convey all or substantially all of the <strong>Company</strong>’s assets. Failure of<br />
the <strong>Company</strong> to comply with any of these covenants could result<br />
in a default under the indenture which would allow the note holders<br />
to accelerate the due date of the outstanding principal and accrued<br />
interest on the subject notes.
Notes to the Consolidated Financial Statements (dollars in millions, except as noted)<br />
<strong>The</strong> <strong>Company</strong>’s primary credit agreements contain covenant<br />
and default provisions in addition to the covenants set forth above<br />
with respect to the <strong>Company</strong>’s public debt. Significant other<br />
covenants and defaults include:<br />
(a)the obligation to maintain the ratio of the <strong>Company</strong>’s<br />
consolidated indebtedness to consolidated capitalization<br />
at no greater than 0.65 to 1.00 at any time the aggregate<br />
outstanding amount of loans under the primary credit<br />
agreements exceeds $500,<br />
(b) a default if the <strong>Company</strong> or any applicable subsidiary fails to<br />
make any payment on indebtedness of $50 or more when<br />
due, or any other default under the applicable agreement<br />
permits the acceleration of $200 or more of principal, or<br />
results in the acceleration of $100 or more of principal, and<br />
(c) a default if the <strong>Company</strong> or any applicable subsidiary fails<br />
to discharge or stay within 30 days after the entry of a final<br />
judgment of more than $200.<br />
Failure of the <strong>Company</strong> to comply with any of the covenants<br />
could result in a default under the applicable credit agreement<br />
which would allow the lenders not to fund future loan requests and<br />
to accelerate the due date of the outstanding principal and accrued<br />
interest on any outstanding loans.<br />
At December 31, 2002, the <strong>Company</strong> was in compliance with<br />
all of the covenants and default provisions, referred to above.<br />
L. PENSION PLANS AND OTHER POSTRETIREMENT BENEFITS<br />
Pension Plans<br />
<strong>The</strong> <strong>Company</strong> has defined benefit pension plans which cover<br />
employees in the United States and a number of other countries.<br />
<strong>The</strong> <strong>Company</strong>’s funding policy is to contribute annually to those<br />
plans where pension laws and economics either require or<br />
encourage funding. Plan assets of $9.6 billion consist mainly of<br />
equity and fixed income securities of U.S. and foreign issuers,<br />
including <strong>Company</strong> common stock with a value of approximately<br />
$269 at December 31, 2002.<br />
<strong>The</strong> U.S. funded plan covering the parent company is the largest<br />
plan. Benefits are based on length of service and the employee’s<br />
three highest consecutive years of compensation.<br />
U.S. Plan Assumptions for Pension Plans<br />
2002 2001<br />
Weighted-average discount rate 6.75% 7.00%<br />
Rate of increase in future compensation levels 5.00% 5.00%<br />
Long-term rate of return on assets 9.25% 9.18%<br />
All other pension plans used assumptions that are consistent<br />
with (but not identical to) those of the U.S. plan.<br />
U.S. employees are eligible to participate in defined contribution<br />
plans (Employee Savings Plans) by contributing a portion of their<br />
compensation, which is partially matched by the <strong>Company</strong>.<br />
Defined contribution plans also cover employees in some subsidiaries<br />
in other countries, including Australia, France, Spain and<br />
the United Kingdom. Contributions charged to income for defined<br />
contribution plans were $49 in 2002, $75 in 2001 and $66 in 2000.<br />
Pension Plans with Accumulated Benefit Obligations in<br />
Excess of Plan Assets at December 31<br />
2002 2001<br />
Projected benefit obligation $11,952 $1,579<br />
Accumulated benefit obligation 11,421 1,394<br />
Fair value of plan assets 9,337 849<br />
Other Postretirement Benefits<br />
<strong>The</strong> <strong>Company</strong> provides certain health care and life insurance benefits<br />
to retired employees. <strong>The</strong> <strong>Company</strong> funds most of the cost of<br />
these health care and life insurance benefits as incurred.<br />
<strong>The</strong> U.S. plan covering the parent company is the largest plan.<br />
<strong>The</strong> plan provides health care benefits, including hospital, physicians’<br />
services, drug and major medical expense coverage, and life<br />
insurance benefits. For employees hired before January 1, 1993,<br />
the plan provides benefits supplemental to Medicare when retirees<br />
are eligible for these benefits. <strong>The</strong> <strong>Company</strong> and the retiree share<br />
the cost of these benefits, with the <strong>Company</strong> portion increasing as<br />
the retiree has increased years of credited service. <strong>The</strong>re is a cap<br />
on the <strong>Company</strong> portion. <strong>The</strong> <strong>Company</strong> has the ability to change<br />
these benefits at any time.<br />
U.S. Plan Assumptions for Other Postretirement Benefits<br />
2002 2001<br />
Discount rate 6.75% 7.00%<br />
Weighted-average 5-year projected<br />
medical cost trend, remaining<br />
constant thereafter 7.05–6.62% 7.47–6.62%<br />
Long-term rate of return on assets 9.25% 9.50%<br />
All other postretirement benefit plans used assumptions that<br />
are consistent with (but not identical to) those of the U.S. parent<br />
company plan.<br />
Increasing the assumed medical cost trend rate by 1 percentage<br />
point in each year would increase the accumulated postretirement<br />
benefit obligation at December 31, 2002, by $9 and the net periodic<br />
postretirement benefit cost for the year by $1. Decreasing the<br />
assumed medical cost trend rate by 1 percentage point in each<br />
year would decrease the accumulated postretirement benefit<br />
obligation at December 31, 2002, by $11 and the net periodic<br />
postretirement benefit cost for the year by $1.<br />
<strong>The</strong> <strong>Dow</strong> <strong>Chemical</strong> <strong>Company</strong> 63 >
Notes to the Consolidated Financial Statements (dollars in millions, except as noted)<br />
L. PENSION PLANS AND OTHER POSTRETIREMENT BENEFITS (continued)<br />
Net Periodic Cost for All Significant Plans<br />
DEFINED BENEFIT PENSION PLANS OTHER POSTRETIREMENT BENEFITS<br />
2002 2001 2000 2002 2001 2000<br />
Service cost $ 219 $ 206 $ 219 $ 31 $ 31 $ 32<br />
Interest cost 748 708 655 135 133 119<br />
Expected return on plan assets (1,105) (1,072) (986) (21) (23) (24)<br />
Amortization of transition obligation – – (5) – – –<br />
Amortization of prior service cost (credit) 20 23 23 (36) (40) (49)<br />
Amortization of unrecognized (gain) loss (20) (73) (54) 11 7 (5)<br />
Special termination/curtailment cost (credit) (1) (7) 113 – (13) 106 –<br />
Net periodic cost (credit) $ (145) $ (95) $(148) $107 $214 $ 73<br />
(1) See Note B regarding a special charge for merger-related expenses and restructuring recorded during 2001.<br />
Change in Projected Benefit Obligation, Plan Assets and Funded Status of All Significant Plans<br />
DEFINED BENEFIT PENSION PLAN OTHER POSTRETIREMENT BENEFITS<br />
Change in projected benefit obligation 2002 2001 2002 2001<br />
Benefit obligation at beginning of year $11,341 $ 9,985 $ 2,035 $ 1,797<br />
Service cost 219 206 31 31<br />
Interest cost 748 708 135 133<br />
Plan participants’ contributions 8 11 – –<br />
Amendments 28 31 (8) (4)<br />
Actuarial changes in assumptions and experience 443 629 61 117<br />
Acquisition/divestiture activity 5 190 2 2<br />
Benefits paid (745) (625) (167) (145)<br />
Currency impact 76 93 (3) (2)<br />
Special termination/curtailment cost (credit) (1) (26) 113 (14) 106<br />
Benefit obligation at end of year $12,097 $11,341 $ 2,072 $ 2,035<br />
Change in plan assets<br />
Market value of plan assets at beginning of year $11,424 $12,435 $ 266 $ 282<br />
Actual return on plan assets (1,230) (611) (4) (16)<br />
Employer contributions 112 30 – 1<br />
Plan participants’ contributions 9 11 – –<br />
Acquisition/divestiture activity 4 158 – –<br />
Benefits paid (741) (599) – (1)<br />
Special settlement paid (17) – – –<br />
Market value of plan assets at end of year $ 9,561 $11,424 $ 262 $ 266<br />
Funded status and net amounts recognized<br />
Plan assets in excess of (less than) benefit obligation $(2,536) $ 83 $(1,810) $(1,769)<br />
Unrecognized net transition obligation 2 5 – –<br />
Unrecognized prior service cost (credit) 132 123 (33) (62)<br />
Unrecognized net (gain) loss 2,796 (34) 169 95<br />
Net amounts recognized in the consolidated balance sheets $ 394 $ 177 $(1,674) $(1,736)<br />
Net amounts recognized in the consolidated balance sheets consist of:<br />
Accrued benefit liability $(2,214) $ (768) $(1,674) $(1,736)<br />
Prepaid benefit cost 309 818 – –<br />
Additional minimum liability—intangible asset 124 15 – –<br />
Accumulated other comprehensive income—pretax 2,175 112 – –<br />
Net amounts recognized in the consolidated balance sheets $ 394 $ 177 $(1,674) $(1,736)<br />
(1) See Note B regarding a special charge for merger-related expenses and restructuring recorded during 2001.<br />
> 64 <strong>The</strong> <strong>Dow</strong> <strong>Chemical</strong> <strong>Company</strong>
Notes to the Consolidated Financial Statements (dollars in millions, except as noted)<br />
M. LEASED PROPERTY AND VARIABLE INTEREST ENTITIES<br />
Leased Property<br />
<strong>The</strong> <strong>Company</strong> routinely leases premises for use as sales and administrative<br />
offices, warehouses and tanks for product storage, motor<br />
vehicles, railcars, computers, office machines, and equipment<br />
under operating leases. In addition, the <strong>Company</strong> leases gas turbines<br />
at two U.S. locations, aircraft in the United States, ethylene plants<br />
in Argentina, Canada, and <strong>The</strong> Netherlands, and a polyethylene<br />
plant in Argentina. At the termination of the leases, the <strong>Company</strong><br />
has the option to purchase these plants and certain other leased<br />
equipment and buildings based on a fair market value determination.<br />
Rental expenses under operating leases, net of sublease rental<br />
income, were $447 for 2002, $469 for 2001 and $431 for 2000.<br />
Minimum Operating Lease Commitments at<br />
December 31, 2002<br />
2003 $ 260<br />
2004 235<br />
2005 206<br />
2006 150<br />
2007 80<br />
2008 and thereafter 816<br />
Total $1,747<br />
Variable Interest Entities<br />
<strong>Dow</strong> has operating leases with various special purpose entities.<br />
Nine of these entities qualify as variable interest entities (“VIEs”)<br />
under FIN No. 46, “Consolidation of Variable Interest Entities.”<br />
Based on the current terms of the lease agreements and the residual<br />
value guarantees <strong>Dow</strong> provides to the lessors, the <strong>Company</strong><br />
expects to be the primary beneficiary of the VIEs. As a result, if the<br />
facts and circumstances remain the same, <strong>Dow</strong> would be required<br />
to consolidate the assets and liabilities held by these VIEs in the<br />
third quarter of 2003.<br />
Two VIEs, established in 1998 and 1999, are foreign trusts<br />
which lease manufacturing facilities to <strong>Dow</strong>, including ethylene<br />
and polyethylene facilities in Argentina valued at $532 at<br />
December 31, 2002 and 2001, and an ethylene facility in <strong>The</strong><br />
Netherlands valued at $356 at December 31, 2002 and $363 at<br />
December 31, 2001.<br />
Two VIEs, established in 2001 and 2002, are foreign trusts<br />
currently constructing manufacturing facilities that <strong>Dow</strong> is committed<br />
to lease upon completion of construction. <strong>The</strong> facilities include a<br />
polyethylene facility in <strong>The</strong> Netherlands valued at $190 and an<br />
ethylene pipeline in Germany valued at $115.<br />
Four VIEs, established between 1997 and 2001, are U.S. trusts<br />
which lease railcars to <strong>Dow</strong> for use in the United States and<br />
Canada. <strong>The</strong> value of the leased railcars was $418 at December 31,<br />
2002 and $402 at December 31, 2001.<br />
One VIE is a U.S. trust established in 2000 to lease office buildings<br />
in Indianapolis, Indiana, valued at $133 at December 31, 2002<br />
and 2001.<br />
<strong>The</strong> <strong>Company</strong> has not determined the carrying amount of the<br />
assets that will be included in the consolidated balance sheet upon<br />
consolidation of the VIEs. Accordingly, the <strong>Company</strong> has not determined<br />
the cumulative effect adjustment that will be required upon<br />
adoption of FIN No. 46. <strong>The</strong> following table provides the approximate<br />
amount of debt of the VIEs described above at December 31,<br />
2002 and 2001:<br />
LEASE MATURITIES 2002 2001<br />
Manufacturing facilities 2006–2017 $1,032 $ 917<br />
Railcars 2004–2008 418 402<br />
Real property 2005 133 133<br />
Total $1,583 $1,452<br />
Upon termination or expiration of each lease, <strong>Dow</strong> may return<br />
the assets to the lessor, renew the lease, or purchase the assets<br />
for an amount based on a fair market value determination. <strong>Dow</strong><br />
has provided residual value guarantees totaling $1,365 at<br />
December 31, 2002 and $1,242 at December 31, 2001, to the<br />
various lessors. Given the productive nature of the assets, it is<br />
probable they will have continuing value to <strong>Dow</strong> or another manufacturer<br />
in excess of the residual value guarantees.<br />
N. STOCK COMPENSATION PLANS<br />
At December 31, 2002, the <strong>Company</strong> had stock-based compensation<br />
plans, which had been approved by the Board of Directors, under<br />
which shares or options could be granted to employees and nonemployee<br />
directors. <strong>The</strong> <strong>Company</strong> measures the compensation<br />
cost for these plans using the intrinsic value method of accounting<br />
prescribed by APB Opinion No. 25, “Accounting for Stock Issued<br />
to Employees.” Given the terms of the <strong>Company</strong>’s plans, no compensation<br />
cost has been recognized for its fixed stock option plans<br />
and its stock purchase plan.<br />
<strong>The</strong> <strong>Company</strong>’s reported net income (loss) and earnings (loss)<br />
per share would have been reduced (increased) had compensation<br />
cost for the <strong>Company</strong>’s stock-based compensation plans been<br />
determined using the fair value based method of accounting<br />
as set forth in SFAS No. 123, “Accounting for Stock-Based<br />
Compensation.” For purposes of estimating the fair value disclosures<br />
below, the fair value of each stock option and subscription to<br />
purchase shares under the <strong>Company</strong>’s Employees’ Stock Purchase<br />
Plans has been estimated on the grant date with a binomial optionpricing<br />
model using the following weighted-average assumptions:<br />
2002 2001 2000<br />
Dividend yield 4.4% 3.8% 3.3%<br />
Expected volatility 42.75% 46.97% 35.83%<br />
Risk-free interest rate 4.18% 4.72% 6.46%<br />
Expected life of stock<br />
option plans 7 years 7 years 7 years<br />
Expected life of stock<br />
purchase plans 0.83 years 0.83 years 0.83 years<br />
<strong>The</strong> <strong>Dow</strong> <strong>Chemical</strong> <strong>Company</strong> 65 >
Notes to the Consolidated Financial Statements (dollars in millions, except as noted)<br />
N. STOCK COMPENSATION PLANS (continued)<br />
<strong>The</strong> effects of using the fair value based method of accounting<br />
are indicated in the pro forma amounts below:<br />
2002 2001 2000<br />
Net income (loss), as reported $(338) $(385) $ 1,675<br />
Deduct: Total stock-based<br />
compensation expense<br />
determined using fair value<br />
based method for all awards,<br />
net of tax 89 112 101<br />
Pro forma net income (loss) $(427) $(497) $ 1,574<br />
Earnings (Loss) per share:<br />
Basic—as reported $(0.37) $(0.43) $ 1.88<br />
Basic—pro forma (0.47) (0.55) 1.77<br />
Diluted—as reported (0.37) (0.43) 1.85<br />
Diluted—pro forma (0.47) (0.55) 1.74<br />
Employees’ Stock Purchase Plans<br />
Stock Option Plans<br />
Under the 1988 Award and Option Plan, a plan approved by stockholders,<br />
the <strong>Company</strong> may grant options or shares of common<br />
stock to its employees subject to certain annual and individual<br />
limits. Under the 1994 Non-Employee Directors’ Stock Plan, the<br />
<strong>Company</strong> may grant up to 300,000 options or shares of common<br />
stock to non-employee directors. Under the 1994 Executive<br />
Performance Plan, the <strong>Company</strong> may grant up to 300,000 options<br />
or shares of common stock to executive officers of the <strong>Company</strong>.<br />
Under all plans, the terms are fixed at the grant date.<br />
On August 26, 2002, the <strong>Company</strong> announced it would begin<br />
expensing stock options issued to employees in accordance with<br />
SFAS No. 123 as of January 1, 2003. <strong>The</strong> <strong>Company</strong> expects the<br />
after-tax effect of expensing stock options to be approximately<br />
$0.02 per share in 2003, growing to approximately $0.06 per share<br />
in 2005. <strong>The</strong>se estimates were based on the terms of <strong>Dow</strong>’s stock<br />
option plans and current assumptions for stock option grants and<br />
valuation, which may change when stock options are granted in<br />
2003 and in the future.<br />
Employees’ Stock Purchase Plans<br />
In each of the last three years, <strong>The</strong> Board of Directors authorized<br />
Employees’ Stock Purchase Plans. Under these plans, most<br />
employees were eligible to purchase shares of common stock of<br />
the <strong>Company</strong> valued at up to 10 percent of their annual base earnings.<br />
<strong>The</strong> value was determined using the plan price times the<br />
number of shares subscribed to by the employee. <strong>The</strong> plan price<br />
of the stock was set each year at no less than 85 percent of market<br />
price. Approximately half of the eligible employees participated in<br />
the annual plans during the last three years. See Note U for information<br />
regarding a related subsequent event.<br />
2002 2001 2000<br />
EXERCISE EXERCISE EXERCISE<br />
SHARES IN THOUSANDS SHARES PRICE* SHARES PRICE* SHARES PRICE*<br />
Outstanding at beginning of year 4,513 $27.45 3,817 $29.52 3,531 $27.82<br />
Granted 5,047 26.95 5,399 27.45 4,263 29.52<br />
Exercised (3,406) 27.43 (3,308) 28.99 (3,461) 27.89<br />
Forfeited/Expired (1,445) 27.38 (1,395) 29.46 (516) 28.68<br />
Outstanding and exercisable at end of year 4,709 $26.95 4,513 $27.45 3,817 $29.52<br />
Fair value of purchase rights granted during the year $ 7.73 $13.07 $10.93<br />
*Weighted-average per share<br />
> 66 <strong>The</strong> <strong>Dow</strong> <strong>Chemical</strong> <strong>Company</strong><br />
At December 31, 2002, there were 11,653,596 shares available<br />
for grant under the 1988 Plan; 212,000 shares available for grant<br />
under the 1994 Non-Employee Directors’ Stock Plan; and 278,837<br />
shares available for grant under the 1994 Executive Performance<br />
Plan. <strong>The</strong> exercise price of each option equals the market price of<br />
the <strong>Company</strong>’s stock on the date of grant, and an option’s maximum<br />
term is 10 years. Options vest from one to three years. In addition,<br />
certain options granted under the 1988 Plan have performance-based<br />
vesting provisions. Total compensation expense for stock option<br />
plans was $0 in 2002, $(35) in 2001 and $0 in 2000. In 2001, management<br />
revised its previous assessment that it was probable that<br />
certain contingent performance goals would be achieved prior to the<br />
expiration of grants issued in 1998 and 1999, resulting in the reversal<br />
of compensation expense of $35 previously recognized in 1999.
Notes to the Consolidated Financial Statements (dollars in millions, except as noted)<br />
<strong>The</strong> following table summarizes the stock option activity of the 1988 Plan and the former Union Carbide plan, which had terms similar<br />
to the 1988 Plan:<br />
Stock Options<br />
2002 2001 2000<br />
EXERCISE EXERCISE EXERCISE<br />
SHARES IN THOUSANDS SHARES PRICE* SHARES PRICE* SHARES PRICE*<br />
Outstanding at beginning of year 67,476 $28.30 65,208 $26.90 54,738 $24.67<br />
Granted 8,214 30.43 6,893 33.65 13.459 34.06<br />
Exercised (4,373) 17.30 (4,172) 16.47 (2,497) 18.63<br />
Forfeited/Expired (351) 17.30 (453) 16.47 (492) 18.63<br />
Outstanding at end of year 70,966 $29.28 67,476 $28.30 65,208 $26.90<br />
Exercisable at end of year 53,356 $28.91 49,578 $26.24 40,206 $22.87<br />
Fair value of options granted during the year $10.65 $13.65 $13.23<br />
*Weighted-average per share<br />
Stock Options at December 31, 2002<br />
OPTIONS OUTSTANDING OPTIONS EXERCISABLE<br />
RANGE OF EXERCISE REMAINING EXERCISE EXERCISE<br />
SHARES IN THOUSANDS PRICE PER SHARE SHARES CONTRACTUAL LIFE PRICE* SHARES PRICE*<br />
$10.00 to $16.00 2,848 0.68 years $12.52 2,848 $12.52<br />
16.01 to 24.00 7,776 1.60 years 20.70 7,775 20.70<br />
24.01 to 30.50 25,717 6.52 years 28.04 17,770 26.98<br />
30.51 to 31.00 6,242 5.16 years 30.52 5,403 30.52<br />
31.01 to 32.00 8,698 6.13 years 39.73 7,696 35.71<br />
32.01 to 43.00 19,685 7.46 years 35.53 11,864 35.96<br />
Total $10.00 to $43.00 70,966 5.84 years $30.34 53,356 $28.91<br />
*Weighted-average per share<br />
Under the 1988 Plan and the former Union Carbide Plan, the<br />
<strong>Company</strong> grants deferred stock to certain employees. <strong>The</strong> grants<br />
vest either after a designated period of time, generally two to five<br />
years, or when the <strong>Company</strong> attains specified financial targets.<br />
<strong>The</strong> <strong>Company</strong> recognizes the expense for deferred stock grants<br />
over the vesting period of the grants.<br />
SHARES IN THOUSANDS 2002 2001 2000<br />
Deferred stock<br />
compensation expense $16 $15 $67<br />
Deferred shares outstanding 3,028 3,690 4,350<br />
<strong>The</strong> <strong>Dow</strong> <strong>Chemical</strong> <strong>Company</strong> 67 >
Notes to the Consolidated Financial Statements (dollars in millions, except as noted)<br />
O. LIMITED PARTNERSHIP<br />
In April 1993, three wholly owned subsidiaries of the <strong>Company</strong><br />
contributed assets with an aggregate fair value of $977 to<br />
Chemtech Royalty Associates L.P. (“Chemtech”), a then newly<br />
formed Delaware limited partnership. In 1993, outside investors<br />
acquired limited partner interests in Chemtech totaling 20 percent<br />
in exchange for $200.<br />
In early 1998, a subsidiary of the <strong>Company</strong> purchased the limited<br />
partner interests of the outside investors in Chemtech for a fair<br />
value of $210 in accordance with wind-up provisions in the partnership<br />
agreement. <strong>The</strong> limited partnership was renamed Chemtech<br />
II L.P. (“Chemtech II”). In June 1998, the <strong>Company</strong> contributed<br />
assets with an aggregate fair value of $783 (through a wholly<br />
owned subsidiary) to Chemtech II and an outside investor acquired<br />
a limited partner interest in Chemtech II totaling 20 percent in<br />
exchange for $200. In September 2000, the <strong>Company</strong> contributed<br />
additional assets with an aggregate fair value of $18 (through a<br />
wholly owned subsidiary) to Chemtech II.<br />
Chemtech II is a separate and distinct legal entity from the<br />
<strong>Company</strong> and its affiliates, and has separate assets, liabilities, business<br />
and operations. Chemtech II affords the <strong>Company</strong> a diversified<br />
source of funding through a cost effective minority equity participation.<br />
<strong>The</strong> partnership has a general partner, a wholly owned<br />
subsidiary of the <strong>Company</strong>, which directs business activities and has<br />
fiduciary responsibilities to the partnership and its other members.<br />
<strong>The</strong> outside investor in Chemtech II receives a cumulative<br />
annual priority return of $13 on its investment and participates<br />
in residual earnings.<br />
Chemtech II will not terminate unless a termination or liquidation<br />
event occurs. <strong>The</strong> outside investor may cause such an event to<br />
occur in the year 2003. In addition, the partnership agreement<br />
provides for various wind-up provisions wherein subsidiaries of the<br />
<strong>Company</strong> may purchase at any time the limited partner interest of<br />
the outside investor. Upon wind-up, liquidation or termination, the<br />
partners’ capital accounts will be redeemed at current fair values.<br />
For financial reporting purposes, the assets (other than intercompany<br />
loans, which are eliminated), liabilities, results of operations<br />
and cash flows of the partnerships and subsidiaries are<br />
included in the <strong>Company</strong>’s consolidated financial statements, and<br />
the outside investors’ limited partner interests are reflected as<br />
minority interests.<br />
> 68 <strong>The</strong> <strong>Dow</strong> <strong>Chemical</strong> <strong>Company</strong><br />
P. PREFERRED SECURITIES OF SUBSIDIARIES<br />
<strong>The</strong> following transactions were entered into for the purpose of<br />
providing diversified sources of funds to the <strong>Company</strong>.<br />
In July 1999, Tornado Finance V.O.F., a consolidated foreign subsidiary<br />
of the <strong>Company</strong>, issued $500 of preferred securities in the<br />
form of preferred partnership units. <strong>The</strong> units provide a distribution<br />
of 7.965 percent, are mandatorily redeemable in 2009, and may be<br />
called at any time by the subsidiary. <strong>The</strong> preferred partnership<br />
units have been classified as “Preferred Securities of Subsidiaries”<br />
in the consolidated balance sheets. <strong>The</strong> distributions are included<br />
in “Minority interests’ share in income” in the consolidated<br />
statements of income.<br />
In September 2001, Hobbes Capital S.A., a consolidated foreign<br />
subsidiary of the <strong>Company</strong>, issued $500 of preferred securities in<br />
the form of equity certificates. <strong>The</strong> certificates provide a floating<br />
rate return (which may be reinvested) based on London Interbank<br />
Offered Rate (“LIBOR”), and may be redeemed in 2008 and at<br />
seven-year intervals thereafter. <strong>The</strong> equity certificates have been<br />
classified as “Preferred Securities of Subsidiaries” in the consolidated<br />
balance sheets. <strong>The</strong> preferred return is included in “Minority<br />
interests’ share in income” in the consolidated statements of<br />
income. Reinvested preferred returns are included in “Minority<br />
Interest in Subsidiaries” in the consolidated balance sheets.<br />
Q. STOCKHOLDERS’ EQUITY<br />
On May 11, 2000, stockholders approved a measure to increase<br />
the number of authorized common shares from 500 million to 1.5<br />
billion and <strong>Dow</strong>’s Board of Directors approved a three-for-one split<br />
of the <strong>Company</strong>’s common stock. On June 16, 2000, <strong>Dow</strong> stockholders<br />
received two additional shares of stock for each share they<br />
owned on the record date of May 23, 2000. All references in the<br />
consolidated financial statements to common shares, share prices,<br />
per share amounts and stock plans have been restated retroactively<br />
for the stock split, unless otherwise noted.<br />
<strong>The</strong> number of treasury shares issued to employees under<br />
option and purchase programs was 8.0 million in 2002, 7.9 million<br />
in 2001 and 9.9 million in 2000. <strong>The</strong> number of treasury shares purchased<br />
was 186,653 in 2002, 117,997 in 2001 and 127,771 in 2000.<br />
Gross undistributed earnings of nonconsolidated affiliates<br />
included in retained earnings were $250 in 2002, $165 in 2001 and<br />
$423 in 2000.<br />
<strong>The</strong>re are no significant restrictions limiting the <strong>Company</strong>’s<br />
ability to pay dividends.<br />
Reserved Treasury Stock at December 31<br />
SHARES IN MILLIONS 2002 2001 2000<br />
Stock option and deferred<br />
stock plans 64.0 72.0 78.2<br />
Employees’ stock<br />
purchase plans 4.7 4.5 3.8<br />
Total shares reserved 68.7 76.5 82.0
Notes to the Consolidated Financial Statements (dollars in millions, except as noted)<br />
R. EMPLOYEE STOCK OWNERSHIP PLANS AND REDEEMABLE<br />
PREFERRED STOCK<br />
<strong>The</strong> <strong>Company</strong> has the <strong>Dow</strong> Employee Stock Ownership Plan<br />
(“<strong>Dow</strong> ESOP”), which is an integral part of <strong>The</strong> <strong>Dow</strong> <strong>Chemical</strong><br />
<strong>Company</strong> Employees’ Savings Plan, and, prior to December 27,<br />
2001, had the Union Carbide Corporation Employee Stock<br />
Ownership Plan (“UCC ESOP”), which was an integral part of the<br />
Union Carbide Savings and Investment Program for Employees of<br />
Union Carbide Corporation and Participating Subsidiary Companies.<br />
On December 27, 2001, the UCC ESOP and the <strong>Dow</strong> ESOP were<br />
merged into one ESOP trust (the “ESOP”) under <strong>The</strong> <strong>Dow</strong><br />
<strong>Chemical</strong> <strong>Company</strong> Employees’ Savings Plan. A significant majority<br />
of full-time employees in the United States are eligible to participate<br />
in the ESOP through the allocation of shares of the <strong>Company</strong>’s<br />
common stock (“ESOP shares”). Shares held by the ESOP are<br />
treated as outstanding shares in the determination of basic and<br />
diluted earnings per share.<br />
In 1989, the <strong>Dow</strong> ESOP borrowed $138 at a 9.42 percent interest<br />
rate with a final maturity in 2004 and used the proceeds to purchase<br />
convertible preferred stock from the <strong>Company</strong>. <strong>The</strong> preferred stock<br />
was convertible into the <strong>Company</strong>’s common stock (on a pre-split<br />
basis) at either:<br />
•a conversion rate of 1:1 if the fair market value of the common<br />
stock equaled or exceeded $86.125 per share, or<br />
•the number of shares of common stock equivalent to $86.125<br />
per share if the fair market value of the common stock was<br />
less than $86.125 per share, subject to the conversion<br />
conditions of the ESOP.<br />
<strong>The</strong> preferred stock was redeemable in whole or in part at the<br />
<strong>Company</strong>’s option any time after January 1, 2000, at $86.125 per<br />
share plus an amount equal to all accrued and unpaid dividends.<br />
<strong>The</strong> dividend yield on the preferred stock was 7.75 percent of the<br />
$86.125 per share redemption value. On February 9, 2000, the<br />
<strong>Company</strong> exercised its option to redeem the preferred stock. On<br />
that same date, the trustee of the ESOP elected to convert the<br />
preferred stock into common stock at a ratio of 1:1.<br />
In 1990, the UCC ESOP borrowed $325 from Union Carbide at<br />
10 percent per annum with a maturity date of December 31, 2005,<br />
which was used to purchase shares of Union Carbide convertible<br />
preferred stock. In 1997, the UCC ESOP trustee exercised its right<br />
to convert all outstanding UCC ESOP preferred stock into Union<br />
Carbide common stock. <strong>The</strong> UCC ESOP shares were converted<br />
into shares of <strong>Dow</strong> common stock on February 6, 2001. On<br />
December 27, 2001, the UCC ESOP note was restructured with a<br />
new maturity date of December 31, 2023, and a new interest rate<br />
of 6.96 percent.<br />
Dividends on shares held by the ESOP are paid to the ESOP<br />
and, together with <strong>Company</strong> contributions, are used, in part, by the<br />
ESOP to make debt service payments on the loans. Shares are<br />
released for allocation to participants based on the ratio of the<br />
current year’s debt service to the sum of the principal and interest<br />
payments over the combined life of the two loans.<br />
Accounting for the plans has followed the principles that were<br />
in effect for the respective plans when they were established.<br />
Expense associated with the ESOP was $6 in 2002, $5 in 2001 and<br />
$16 in 2000. At December 31, 2002, 21.1 million common shares<br />
held by the ESOP were outstanding, 15.2 million of which were<br />
allocated to participants’ accounts. During 2002, 2.0 million ESOP<br />
shares were allocated to participants’ accounts.<br />
Since the conversion of the preferred stock, the <strong>Company</strong>’s<br />
guarantee of the <strong>Dow</strong> ESOP’s borrowings is reported as “Long-<br />
Term Debt” and, combined with the receivable from the UCC<br />
ESOP, as “Unearned ESOP shares” in the consolidated balance<br />
sheets as a reduction of “Stockholders’ Equity.”<br />
S. INCOME TAXES<br />
Operating loss carryforwards at December 31, 2002 amounted to<br />
$4,825 compared with $4,765 at the end of 2001. Of the operating<br />
loss carryforwards, $730 is subject to expiration in the years 2003<br />
through 2007. <strong>The</strong> remaining balances expire in years beyond 2007<br />
or have an indefinite carryforward period. Tax credit carryforwards<br />
at December 31, 2002 amounted to $834, of which $477 is subject<br />
to expiration in the years 2003 through 2007. <strong>The</strong> remaining tax<br />
credit carryforwards expire in years beyond 2007.<br />
Undistributed earnings of foreign subsidiaries and related<br />
companies that are deemed to be permanently invested amounted<br />
to $6,056 at December 31, 2002, $5,202 at December 31, 2001<br />
and $4,297 at December 31, 2000. It is not practicable to calculate<br />
the unrecognized deferred tax liability on those earnings.<br />
<strong>The</strong> <strong>Company</strong>’s valuation allowances of $645 at December 31,<br />
2002 were primarily related to BSL (see Note C) and to foreign tax<br />
credits to be used in the United States. BSL’s valuation allowance<br />
reduces BSL’s deferred tax asset in recognition of the uncertainty<br />
regarding full realization of the tax benefit. BSL’s deferred tax asset<br />
is a result of tax net operating losses during the five-year reconstruction<br />
period and the excess of the tax basis over the GAAP basis of<br />
its fixed assets. <strong>The</strong> <strong>Company</strong> also had valuation allowances for<br />
operations in Argentina, Brazil, Switzerland and South Africa.<br />
In 2000, Germany enacted a lower corporate income tax rate<br />
effective January 1, 2001. This change reduced the value of the<br />
deferred tax asset of BSL by $201 and resulted in a $9 decrease<br />
in the provision for deferred income tax for the other <strong>Dow</strong> subsidiaries<br />
in Germany.<br />
Domestic and Foreign Components of Income (Loss)<br />
Before Income Taxes and Minority Interests<br />
2002 2001 2000<br />
Domestic $(828) $(1,214) $ 861<br />
Foreign 206 601 1,725<br />
Total $(622) $ (613) $ 2,586<br />
<strong>The</strong> <strong>Dow</strong> <strong>Chemical</strong> <strong>Company</strong> 69 >
Notes to the Consolidated Financial Statements (dollars in millions, except as noted)<br />
S. INCOME TAXES (continued)<br />
Reconciliation to U.S. Statutory Rate<br />
T. OPERATING SEGMENTS AND GEOGRAPHIC AREAS<br />
<strong>Dow</strong> is a diversified, worldwide manufacturer and supplier of more<br />
than 3,400 products. <strong>The</strong> <strong>Company</strong>’s products are used primarily<br />
as raw materials in the manufacture of customer products and<br />
services. <strong>The</strong> <strong>Company</strong> serves the following industries: appliance;<br />
automotive; agricultural; building and construction; chemical processing;<br />
electronics; furniture; housewares; oil and gas; packaging;<br />
paints, coatings and adhesives; personal care; pharmaceutical;<br />
processed foods; pulp and paper; textile and carpet; utilities; and<br />
water treatment.<br />
<strong>Dow</strong> conducts its worldwide operations through global businesses,<br />
which are aggregated into reportable operating segments<br />
based on the nature of the products and production processes,<br />
end-use markets, channels of distribution and regulatory environment.<br />
<strong>The</strong> reportable operating segments are: Performance<br />
Plastics, Performance <strong>Chemical</strong>s, Agricultural Sciences, Plastics,<br />
<strong>Chemical</strong>s, and Hydrocarbons and Energy. <strong>The</strong> Corporate Profile<br />
> 70 <strong>The</strong> <strong>Dow</strong> <strong>Chemical</strong> <strong>Company</strong><br />
2002 2001 2000<br />
Taxes at U.S. statutory rate $(218) $(215) $905<br />
Amortization of nondeductible<br />
intangibles – 37 30<br />
Foreign rates other than 35% 101 32 (36)<br />
U.S. tax effect of foreign<br />
earnings and dividends (61) 2 (10)<br />
U.S. business and R&D credits (143) (45) (21)<br />
Other—net 41 (39) (29)<br />
Total tax provision (credit) $(280) $(228) $839<br />
Effective tax rate 45.0% 37.2% 32.4%<br />
Provision (Credit) for Income Taxes<br />
2002 2001 2000<br />
CURRENT DEFERRED TOTAL CURRENT DEFERRED TOTAL CURRENT DEFERRED TOTAL<br />
Federal $(119) $(367) $(486) $(111) $(354) $(465) $179 $158 $ 337<br />
State and local 24 (5) 19 31 (24) 7 23 19 42<br />
Foreign 126 61 187 243 (13) 230 494 (34) 460<br />
Total $ 31 $(311) $(280) $ 163 $(391) $(228) $696 $143 $ 839<br />
Deferred Tax Balances at December 31<br />
2002 2001<br />
DEFERRED DEFERRED DEFERRED DEFERRED<br />
TAX ASSETS TAX LIABILITIES TAX ASSETS TAX LIABILITIES<br />
Property $ 386 $(2,033) $ 878 $(2,046)<br />
Tax loss and credit carryforwards 2,421 – 2,171 –<br />
Postretirement benefit obligations 1,558 (321) 728 –<br />
Other accruals and reserves 865 (56) 247 (257)<br />
Inventory 105 (69) 155 (21)<br />
Long-term debt 545 (258) 126 (194)<br />
Investments 265 (1) 372 –<br />
Other—net 163 (64) 22 (128)<br />
Subtotal $6,308 $(2,802) $4,699 $(2,646)<br />
Valuation allowance (645) – (295) –<br />
Total $5,663 $(2,802) $4,404 $(2,646)<br />
on pages 16-19 describes the operating segments, how they are<br />
aggregated, and the types of products and services from which<br />
their revenues are derived.<br />
Unallocated and Other contains the reconciliation between the<br />
totals for reportable segments and the <strong>Company</strong> totals. It also<br />
represents the operating segments that do not meet the quantitative<br />
threshold for determining reportable segments, research and other<br />
expenses related to new business development activities, and<br />
other corporate items not allocated to the operating segments.<br />
New business development activities include advanced materials<br />
for electronics, industrial biotechnology and new developments<br />
with a focus on identifying and pursuing emerging commercial<br />
and technology opportunities.<br />
Transfers between operating segments are generally valued<br />
at cost. Transfers of products to the Agricultural Sciences segment<br />
from the other segments, however, are generally valued at<br />
market-based prices. <strong>The</strong> revenues generated by these transfers<br />
are immaterial.
Notes to the Consolidated Financial Statements (dollars in millions, except as noted)<br />
Operating Segment Information<br />
PERFORMANCE PERFORMANCE AGRICULTURAL HYDROCARBONS UNALLOCATED<br />
PLASTICS CHEMICALS SCIENCES PLASTICS CHEMICALS AND ENERGY AND OTHER TOTAL<br />
2002<br />
Sales to external customers $7,095 $ 5,130 $2,717 $6,476 $3,361 $ 2,435 $ 395 $27,609<br />
Equity in earnings (losses) of<br />
nonconsolidated affiliates – – (5) 18 44 23 (40) 40<br />
Merger-related expenses<br />
and restructuring and<br />
asbestos-related charge (1) – – 5 20 13 44 1,026 1,108<br />
EBIT (2) 612 650 154 151 (78) 96 (1,499) 86<br />
Total assets 7,534 5,467 3,980 6,856 3,751 1,813 10,161 39,562<br />
Investments in nonconsolidated<br />
affiliates 264 83 37 743 174 205 59 1,565<br />
Depreciation and amortization 426 360 125 481 327 92 14 1,825<br />
Capital expenditures 485 240 71 171 407 242 7 1,623<br />
2001<br />
Sales to external customers $7,321 $ 5,081 $ 2,612 $ 6,452 $3,552 $ 2,511 $ 546 $ 28,075<br />
Equity in earnings (losses) of<br />
nonconsolidated affiliates (13) (2) (5) 15 45 25 (36) 29<br />
IPR&D and merger-related<br />
expenses and restructuring (1) – – 69 – – – 1,487 1,556<br />
EBIT (2) 643 611 104 125 111 (22) (1,537) 35<br />
Total assets 7,297 5,283 4,242 6,857 3,527 1,513 6,796 35,515<br />
Investments in nonconsolidated<br />
affiliates 316 47 55 625 119 236 183 1,581<br />
Depreciation and amortization 415 342 183 516 286 58 15 1,815<br />
Capital expenditures 381 268 119 218 493 103 5 1,587<br />
2000<br />
Sales to external customers $7,667 $ 5,343 $ 2,346 $ 7,118 $4,109 $ 2,626 $ 589 $ 29,798<br />
Equity in earnings (losses) of<br />
nonconsolidated affiliates 2 20 (9) 239 78 36 (12) 354<br />
IPR&D (1) 6 – – – – – – 6<br />
EBIT (2) 1,029 536 212 945 422 136 (175) 3,105<br />
Total assets 6,603 4,805 3,448 7,228 3,796 1,795 8,316 35,991<br />
Investments in nonconsolidated<br />
affiliates 394 76 57 661 277 320 311 2,096<br />
Depreciation and amortization 392 359 185 394 276 97 35 1,738<br />
Capital expenditures 323 214 121 427 289 414 20 1,808<br />
(1) See Note B for a discussion of purchased in-process research and development (“IPR&D”), and merger-related expenses and restructuring. See Note J for additional information<br />
regarding the asbestos-related charge in 2002.<br />
(2) <strong>The</strong> reconciliation between “Earnings (Loss) before Interest, Income Taxes and Minority Interests” (“EBIT”) and “Income (Loss) before Income Taxes and Minority Interests”<br />
is shown below:<br />
2002 2001 2000<br />
EBIT $ 86 $ 35 $3,105<br />
Interest income 66 85 146<br />
Interest expense and<br />
amortization of debt discount 774 733 665<br />
Income (Loss) before Income<br />
Taxes and Minority Interests $(622) $(613) $2,586<br />
<strong>The</strong> <strong>Dow</strong> <strong>Chemical</strong> <strong>Company</strong> 71 >
Notes to the Consolidated Financial Statements (dollars in millions, except as noted)<br />
T. OPERATING SEGMENTS AND GEOGRAPHIC AREAS (continued)<br />
<strong>The</strong> <strong>Company</strong> ceased amortizing goodwill upon adoption of<br />
SFAS No. 142 on January 1, 2002 (see Note A). Total goodwill amortization<br />
expense, including equity method goodwill, impacting<br />
EBIT in 2001 and 2000 are provided below by operating segment:<br />
2001 2000<br />
Performance Plastics $ 32 $ 19<br />
Performance <strong>Chemical</strong>s 28 14<br />
Agricultural Sciences 72 54<br />
Plastics 13 23<br />
Hydrocarbons and Energy 4 4<br />
Unallocated and Other (8) –<br />
Total $141 $114<br />
<strong>The</strong> <strong>Company</strong> operates 191 manufacturing sites in 38 countries.<br />
<strong>The</strong> United States is home to 62 of these sites, representing 57<br />
percent of the <strong>Company</strong>’s long-lived assets. Sales are attributed to<br />
geographic areas based on customer location. Long-lived assets<br />
are attributed to geographic areas based on asset location.<br />
Geographic Area Information<br />
UNITED STATES EUROPE<br />
REST OF<br />
WORLD TOTAL<br />
2002<br />
Sales to external<br />
customers $11,259 $9,209 $7,141 $27,609<br />
Long-lived assets (1) 7,846 3,430 2,521 13,797<br />
2001<br />
Sales to external<br />
customers $ 11,995 $8,891 $7,189 $ 28,075<br />
Long-lived assets 8,032 2,904 2,643 13,579<br />
2000<br />
Sales to external<br />
customers $ 13,051 $8,742 $8,005 $ 29,798<br />
Long-lived assets 8,455 2,533 2,723 13,711<br />
(1) At December 31, 2002, long-lived assets located in Germany represented approximately<br />
11 percent of the total; long-lived assets in Canada represented approximately 9 percent<br />
of the total.<br />
> 72 <strong>The</strong> <strong>Dow</strong> <strong>Chemical</strong> <strong>Company</strong><br />
U. SUBSEQUENT EVENT<br />
On February 13, 2003, the Board of Directors authorized a 10-year<br />
Employees’ Stock Purchase Plan, subject to the approval of shareholders<br />
at the annual meeting on May 8, 2003. Under the plan,<br />
most employees would be eligible to purchase shares of common<br />
stock of the <strong>Company</strong> valued at up to 10 percent of their annual<br />
base earnings. <strong>The</strong> value would be determined using the plan price<br />
times the number of shares subscribed to by the employee. <strong>The</strong><br />
plan price of the stock would be set annually at no less than 85 percent<br />
of market price. See Note N for additional information.
Quarterly Statistics<br />
IN MILLIONS, EXCEPT PER SHARE AMOUNTS (UNAUDITED)<br />
2002 1ST 2ND 3RD 4TH YEAR<br />
Net sales (1) $ 6,305 $7,259 $ 7,084 $ 6,961 $27,609<br />
Merger-related expenses and restructuring and asbestos-related expenses 13 10 32 1,053 1,108<br />
Earnings (Loss) before interest, income taxes and minority interests 243 539 401 (1,097) 86<br />
Income (Loss) before cumulative effect of changes in accounting principles 38 238 128 (809) (405)<br />
Cumulative effect of changes in accounting principles 67 – – – 67<br />
Net income (loss) available for common stockholders 105 238 128 (809) (338)<br />
Earnings (Loss) before cumulative effect of changes in accounting<br />
principles per common share—basic 0.04 0.26 0.14 (0.89) (0.44)<br />
Earnings (Loss) per common share—basic 0.12 0.26 0.14 (0.89) (0.37)<br />
Earnings (Loss) before cumulative effect of changes in accounting<br />
principles per common share—diluted 0.04 0.26 0.14 (0.89) (0.44)<br />
Earnings (Loss) per common share—diluted 0.11 0.26 0.14 (0.89) (0.37)<br />
Common stock dividends declared per share of <strong>Dow</strong> common stock 0.335 0.335 0.335 0.335 1.34<br />
Market price range of common stock: (2)<br />
High 37.00 34.59 34.73 32.21 37.00<br />
Low 23.66 29.71 24.80 24.10 23.66<br />
2001 1ST 2ND 3RD 4TH YEAR<br />
Net sales (1) $7,456 $ 7,416 $ 6,775 $ 6,428 $28,075<br />
Merger-related expenses and restructuring and IPR&D 1,384 24 115 33 1,556<br />
Earnings (Loss) before interest, income taxes and minority interests (882) 558 253 106 35<br />
Income (Loss) before cumulative effect of change in accounting principle (717) 280 57 (37) (417)<br />
Cumulative effect of change in accounting principle 32 – – – 32<br />
Net income (loss) available for common stockholders (685) 280 57 (37) (385)<br />
Earnings (Loss) before cumulative effect of change in accounting<br />
principle per common share—basic (0.80) 0.31 0.06 (0.04) (0.46)<br />
Earnings (Loss) per common share—basic (0.76) 0.31 0.06 (0.04) (0.43)<br />
Earnings (Loss) before cumulative effect of change in accounting<br />
principle per common share—diluted (0.80) 0.31 0.06 (0.04) (0.46)<br />
Earnings (Loss) per common share—diluted (0.76) 0.31 0.06 (0.04) (0.43)<br />
Common stock dividends declared per share of <strong>Dow</strong> common stock 0.29 0.335 0.335 0.335 1.295<br />
Market price range of common stock: (2)<br />
High 37.31 39.67 37.00 38.67 39.67<br />
Low 28.80 31.04 25.06 31.55 25.06<br />
(1) Adjusted for reclassification of insurance operations in 2002 (see Note A to the Consolidated Financial Statements).<br />
(2) Composite price as reported by the New York Stock Exchange.<br />
See Notes to the Consolidated Financial Statements.<br />
Eleven-Year Review of Market Price per Share of Common Stock (1)<br />
IN DOLLARS 1992 1993 1994 1995 1996 1997 1998 1999 2000 2001 2002<br />
50<br />
High $20.96 $20.67 $26.42 $26.00 $30.83 $34.21 $33.81 $46.00 $47.17 $39.67 $37.00<br />
Close on December 31 19.08 18.92 22.42 23.46 26.13 33.83 30.31 44.54 36.63 33.78 29.70<br />
Low 17.08 16.33 18.83 20.46 22.75 25.25 24.90 28.50 23.00 25.06 23.66<br />
(1) Adjusted for 3-for-1 stock split in 2000.<br />
45<br />
40<br />
35<br />
30<br />
25<br />
20<br />
15<br />
10<br />
5<br />
0<br />
<strong>The</strong> <strong>Dow</strong> <strong>Chemical</strong> <strong>Company</strong> 73 >
Eleven-Year Summary of Selected Financial Data<br />
All data presented reflects the retroactive effect of the Union Carbide merger in 2001 (see Note C).<br />
IN MILLIONS, EXCEPT AS NOTED (UNAUDITED) 2002<br />
Summary of Operations (1)<br />
Net sales (2) $27,609<br />
Cost of sales (2) 23,780<br />
Research and development expenses 1,066<br />
Selling, general and administrative expenses 1,598<br />
Amortization of intangibles 65<br />
Purchased in-process research and development charges –<br />
Special charges and merger-related expenses and restructuring 280<br />
Asbestos-related charge 828<br />
Other income 94<br />
Earnings before interest, income taxes and minority interests 86<br />
Interest expense—net 708<br />
Income (Loss) before income taxes and minority interests (622)<br />
Provision (Credit) for income taxes (280)<br />
Minority interests’ share in income 63<br />
Preferred stock dividends –<br />
Income (Loss) from continuing operations (405)<br />
Discontinued operations net of income taxes –<br />
Cumulative effect of changes in accounting principles 67<br />
Net income (loss) available for common stockholders $ (338)<br />
Per share of common stock (in dollars):<br />
Income (Loss) from continuing operations—basic $ (0.44)<br />
Net income (loss) available for common stockholders—basic (3) (0.37)<br />
Income (Loss) from continuing operations—diluted (4) (0.44)<br />
Net income (loss) available for common stockholders—diluted (3,4) (0.37)<br />
Cash dividends declared per share of <strong>Dow</strong> common stock 1.34<br />
Cash dividends paid per share of <strong>Dow</strong> common stock 1.34<br />
Book value $ 8.36<br />
Weighted-average common shares outstanding—basic 910.5<br />
Weighted-average common shares outstanding—diluted 910.5<br />
Convertible preferred shares outstanding –<br />
Year-End Financial Position<br />
Total assets $39,562<br />
Working capital 2,825<br />
Property—gross 37,934<br />
Property—net 13,797<br />
Long-term debt and redeemable preferred stock 11,659<br />
Total debt 13,036<br />
Net stockholders’ equity 7,626<br />
Financial Ratios<br />
Research and development expenses as percent of net sales (1,2) 3.9%<br />
Income (Loss) before income taxes and minority interests as percent of net sales (1,2) (2.3)%<br />
Return on stockholders’ equity (3,5) (4.4)%<br />
Debt as a percent of total capitalization 59.2%<br />
General<br />
Capital expenditures $ 1,623<br />
Depreciation (1) 1,680<br />
Salaries and wages paid 3,202<br />
Cost of employee benefits 611<br />
Number of employees at year-end (in thousands) 50.0<br />
Number of <strong>Dow</strong> stockholders of record at year-end (in thousands) (6) 122.5<br />
(1) Restated for the sale of the pharmaceutical businesses in 1995.<br />
(2) Adjusted for reclassification of freight on sales in 2000 and reclassification of insurance operations in 2002.<br />
(3) Before cumulative effect of change in accounting principle in 1992.<br />
(4) 1992 amounts are based on Fully Diluted Earnings per Common Share as reported in Exhibit II of the <strong>Company</strong>’s Form 10-K.<br />
(5) Included Temporary Equity in 1992–1999.<br />
(6) Stockholders of record as reported by the transfer agent. <strong>The</strong> <strong>Company</strong> estimates that there were an additional 300,000 stockholders<br />
whose shares were held in nominee names at December 31, 2002.<br />
> 74 <strong>The</strong> <strong>Dow</strong> <strong>Chemical</strong> <strong>Company</strong>
Eleven-Year Summary of Selected Financial Data<br />
2001 2000 1999 1998 1997 1996 1995 1994 1993 1992<br />
$28,075 $29,798 $26,131 $25,396 $27,814 $27,267 $27,140 $22,634 $20,691 $21,387<br />
23,892 24,310 20,422 19,566 20,961 19,981 18,702 17,036 16,100 16,892<br />
1,072 1,119 1,075 1,026 990 962 997 960 970 1,004<br />
1,765 1,825 1,776 1,964 2,168 2,426 2,543 2,267 2,159 2,310<br />
178 139 160 106 80 58 52 57 91 65<br />
69 6 6 349 – – – – – –<br />
1,487 – 94 458 – – – – – 433<br />
– – – – – – – – – –<br />
423 706 424 1,166 657 523 200 180 465 124<br />
35 3,105 3,022 3,093 4,272 4,363 5,046 2,494 1,836 807<br />
648 519 432 458 355 246 211 342 335 536<br />
(613) 2,586 2,590 2,635 3,917 4,117 4,835 2,152 1,501 271<br />
(228) 839 874 902 1,320 1,423 1,822 791 592 112<br />
32 72 74 20 113 194 197 200 171 120<br />
– – 5 6 13 17 17 17 17 19<br />
(417) 1,675 1,637 1,707 2,471 2,483 2,799 1,144 721 20<br />
– – – – – – 187 166 71 423<br />
32 – (20) – (17) – – – (97) (1,126)<br />
$ (385) $ 1,675 $ 1,617 $ 1,707 $ 2,454 $ 2,483 $ 2,986 $ 1,310 $ 695 $ (683)<br />
$ (0.46) $ 1.88 $ 1.87 $ 1.92 $ 2.72 $ 2.61 $ 2.73 $ 1.07 $ 0.68 $ 0.02<br />
(0.43) 1.88 1.85 1.92 2.71 2.61 2.91 1.22 0.75 0.43<br />
(0.46) 1.85 1.84 1.89 2.63 2.51 2.62 1.04 0.66 0.02<br />
(0.43) 1.85 1.82 1.89 2.61 2.51 2.80 1.19 0.73 0.41<br />
1.295 1.16 1.16 1.16 1.12 1.00 0.97 0.87 0.87 0.87<br />
1.25 1.16 1.16 1.16 1.08 1.00 0.93 0.87 0.87 0.87<br />
$ 11.04 $ 13.22 $ 12.40 $ 11.34 $ 11.17 $ 10.95 $ 10.09 $ 9.20 $ 8.93 $ 9.05<br />
901.8 893.2 874.9 888.1 898.4 950.1 1,025.8 1,069.8 1,059.0 1,023.8<br />
901.8 904.5 893.5 904.8 936.2 997.2 1,073.4 1,117.6 1,115.2 1,077.0<br />
– – 1.3 1.4 1.4 27.3 27.6 27.9 28.5 28.8<br />
$35,515 $35,991 $33,456 $31,121 $31,004 $31,219 $29,838 $31,573 $30,194 $30,301<br />
2,183 1,150 2,848 1,570 1,925 4,799 6,234 2,580 2,324 1,954<br />
35,890 34,852 33,333 32,844 31,052 30,896 29,575 29,099 27,234 27,174<br />
13,579 13,711 13,011 12,628 11,832 11,893 10,921 11,268 11,000 11,340<br />
9,266 6,613 6,941 5,890 5,703 5,770 6,067 6,268 6,885 7,343<br />
10,883 9,450 8,708 8,099 8,145 7,067 6,726 7,524 7,910 8,940<br />
9,993 11,840 10,940 9,878 9,974 10,068 9,406 9,721 9,462 9,302<br />
3.8% 3.8% 4.1% 4.0% 3.6% 3.5% 3.7% 4.2% 4.7% 4.7%<br />
(2.2)% 8.7% 9.9% 10.4% 14.1% 15.1% 17.8% 9.5% 7.3% 1.3%<br />
(3.9)% 14.1% 14.7% 17.2% 24.5% 24.5% 30.5% 13.4% 7.3% 4.7%<br />
48.9% 42.5% 42.2% 43.6% 43.1% 36.5% 36.7% 37.9% 39.8% 44.0%<br />
$1,587 $ 1,808 $ 2,176 $ 2,328 $ 1,953 $ 2,065 $ 1,959 $ 1,592 $ 1,792 $ 1,954<br />
1,595 1,554 1,516 1,559 1,529 1,552 1,661 1,484 1,505 1,533<br />
3,215 3,395 3,536 3,579 3,640 3,645 3,475 3,980 4,061 4,036<br />
540 486 653 798 839 875 854 989 1,044 1,148<br />
52.7 53.3 51.0 50.7 55.9 52.0 51.0 65.7 68.5 77.1<br />
125.1 87.9 87.7 93.0 97.2 104.6 111.1 114.5 102.5 105.9<br />
<strong>The</strong> <strong>Dow</strong> <strong>Chemical</strong> <strong>Company</strong> 75 >
Stockholder Reference Information<br />
Stockholder Services<br />
Inquiries about stock accounts, dividends, change in name or<br />
address, or requests for financial reports may be directed to<br />
<strong>Dow</strong>’s stock transfer agent:<br />
EquiServe Trust <strong>Company</strong>, N.A.<br />
P.O. Box 43016<br />
Providence, RI 02940-3016 USA<br />
Telephone: 800-369-5606 (U.S. and Canada)<br />
781-575-3899<br />
Fax: 781-828-8813<br />
General information about EquiServe services may be found at:<br />
www.equiserve.com<br />
Telecommunications Devices for the Hearing Impaired (TDDs):<br />
800-368-0328 (U.S. and Canada)<br />
General Information<br />
Web Site: www.dow.com<br />
Telephone: 800-258-2436 (Customer Information Group) or<br />
989-832-1556<br />
989-636-1000 (<strong>Dow</strong> Operator/Switchboard)<br />
Investor Relations<br />
<strong>The</strong> <strong>Dow</strong> <strong>Chemical</strong> <strong>Company</strong><br />
2030 <strong>Dow</strong> Center<br />
Midland, MI 48674 USA<br />
Telephone: 800-422-8193 (U.S. and Canada)<br />
989-636-1463<br />
Fax: 989-636-1830<br />
Office of the Corporate Secretary<br />
<strong>The</strong> <strong>Dow</strong> <strong>Chemical</strong> <strong>Company</strong><br />
2030 <strong>Dow</strong> Center<br />
Midland, MI 48674 USA<br />
Telephone: 989-636-1792<br />
Fax: 989-636-3402<br />
Audiocassette tapes of the 2002 Annual Report are available<br />
by contacting Investor Relations.<br />
> 76 <strong>The</strong> <strong>Dow</strong> <strong>Chemical</strong> <strong>Company</strong><br />
Annual Meeting<br />
<strong>The</strong> 2003 Annual Meeting of Stockholders will be held at 2 p.m.<br />
on Thursday, May 8, 2003, at the Midland Center for the Arts,<br />
1801 West St. Andrews, Midland, Michigan, USA.<br />
<strong>Dow</strong> Dividend Reinvestment Plan<br />
All registered stockholders may reinvest cash dividends in additional<br />
<strong>Dow</strong> shares. For more information on the Plan, please contact<br />
<strong>Dow</strong>’s transfer agent, EquiServe (see Stockholder Services).<br />
Stock Exchange Listings and Trading Privileges<br />
Symbol: DOW<br />
Amsterdam, Bavarian, Berlin, Brussels, Chicago, Düsseldorf,<br />
German, Hamburg, Hannover, London, New York, Pacific, Paris,<br />
Stuttgart, Switzerland and Tokyo.<br />
<strong>The</strong> following trademarks of <strong>The</strong> <strong>Dow</strong> <strong>Chemical</strong> <strong>Company</strong> appear in this<br />
report: Affinity, Aspun, Attane, Betabrace, Betadamp, Betafoam, Betaguard,<br />
Betamate, Betaseal, Blox, BioAqueous, Biobalance, Calibre, Combo<strong>The</strong>rm,<br />
Covelle, D.E.H., D.E.N., D.E.R., Derakane, Derakane Momentum, <strong>Dow</strong>,<br />
<strong>Dow</strong> XLA, <strong>Dow</strong>ex, <strong>Dow</strong>fax, <strong>Dow</strong>flake, <strong>Dow</strong>lex, <strong>Dow</strong>per, <strong>Dow</strong>therm, Drytech,<br />
Elite, Emerge, <strong>The</strong> Enhancer, Envision, Ethafoam, Ethocel, Immotus, Insite,<br />
Inspire, Instill, Intacta, Integral, Isonate, Isoplast, Lamdex, Lifespan, Liquidow,<br />
Magnum, Maxicheck, Maxistab, Methocel, Opticite, Optim, Papi, Peladow,<br />
Pellethane, Prevail, Primacor, Procite, Pulse, Quash, Questra, Retain,<br />
Safe-Tainer, Saran, Saranex, SiLK, Spectrim, Strandfoam, Styrofoam, Styron,<br />
Styron A-Tech, Synergy, Syntegra, Tanklite, Trenchcoat, Trycite, Trymer, Tyril,<br />
Versene, Voracor, Voralast, Voralux, Voranate, Voranol, Voranol Voractiv,<br />
Vorastar, Weathermate, Zetabon<br />
<strong>The</strong> following trademarks of <strong>Dow</strong> AgroSciences LLC appear in this report:<br />
Clincher, Dithane, Dursban, FirstRate, Fortress, Garlon, Glyphomax,<br />
Grandstand, Herculex I, Lontrel, Lorsban, Mustang, Sentricon, Spider, Starane,<br />
Stinger, Strongarm, Telone, Tordon, Tracer Naturalyte, Treflan, Vikane<br />
<strong>The</strong> following trademark of American Chemistry Council appears in this<br />
report: Responsible Care<br />
<strong>The</strong> following trademark of <strong>Dow</strong> BioProducts Ltd. appears in this report:<br />
Woodstalk<br />
<strong>The</strong> following trademark of <strong>Dow</strong> Corning Corporation appears in this report:<br />
Syltherm<br />
<strong>The</strong> following trademark of FilmTec Corporation appears in this report: FilmTec<br />
<strong>The</strong> following trademarks of Flexible Products <strong>Company</strong> appear in this report:<br />
Froth-Pak, Great Stuff, Insta-Stik, Tile Bond<br />
<strong>The</strong> following trademarks of Hampshire <strong>Chemical</strong> Corp. appear in this report:<br />
Daxad, Hamposyl<br />
<strong>The</strong> following trademark of INEOS plc appears in this report: Gas/Spec<br />
<strong>The</strong> following trademark of Michelin North America, Inc. appears in this<br />
report: PAX System<br />
<strong>The</strong> following trademark of Mycogen Corporation appears in this report:<br />
Mycogen<br />
<strong>The</strong> following trademark of PhytoGen Seed <strong>Company</strong>, LLC appears in this<br />
report: PhytoGen<br />
<strong>The</strong> following trademarks or service marks of Union Carbide Corporation<br />
or its subsidiaries appear in this report: Carbowax, Cellosize, Cyracure,<br />
Flexomer, LP Oxo, Meteor, Neocar, Polyox, Polyphobe, Redi-Link, Shac,<br />
Si-Link, Tergitol, Tone, Triton, Tuflin, UCAR, Ucartherm, Ucat, UCON,<br />
Unigard, Unipol, Unipurge, Unival<br />
<strong>The</strong> following federally registered trademark and service mark of the<br />
U.S. Department of Commerce appears in this report: <strong>The</strong> National<br />
Medal of Technology<br />
This report was produced with recyclable paper coated with <strong>Dow</strong> latex.
�Mission<br />
To constantly improve what is essential to human progress by mastering<br />
science and technology.<br />
�Values<br />
Integrity: We believe our promise is our most vital product—our<br />
word is our bond. <strong>The</strong> relationships that are critical to our success<br />
depend entirely on maintaining the highest ethical and moral<br />
standards around the world.<br />
Respect for People: We believe in the inherent worth of people<br />
and will honor our relationships with those who let us be part of<br />
this world: employees, customers, shareholders and society.<br />
Unity: We are one company, one team. Balancing empowerment<br />
and interdependence makes us strong.<br />
Outside-in <strong>Focus</strong>: We will see through the eyes of those whose<br />
lives we affect, identifying unmet needs and producing innovative<br />
and lasting solutions.<br />
Agility: Our future depends on speed and flexibility. Responding<br />
resourcefully to society’s fast-changing needs is the only road<br />
to success.<br />
Innovation: We will make science a way of living. Our job is<br />
to unlock answers that make a fundamental difference to<br />
people’s lives.
<strong>The</strong> <strong>Dow</strong> <strong>Chemical</strong> <strong>Company</strong><br />
Midland, Michigan 48674<br />
*Trademark of <strong>The</strong> <strong>Dow</strong> <strong>Chemical</strong> <strong>Company</strong><br />
161-00585