StatsAPEC - Ministry of International Trade and Industry
StatsAPEC - Ministry of International Trade and Industry
StatsAPEC - Ministry of International Trade and Industry

You also want an ePaper? Increase the reach of your titles
YUMPU automatically turns print PDFs into web optimized ePapers that Google loves.
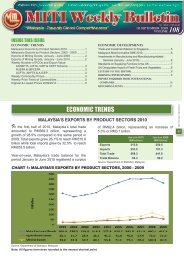
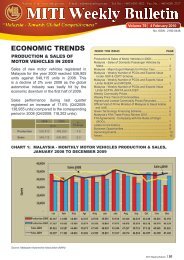
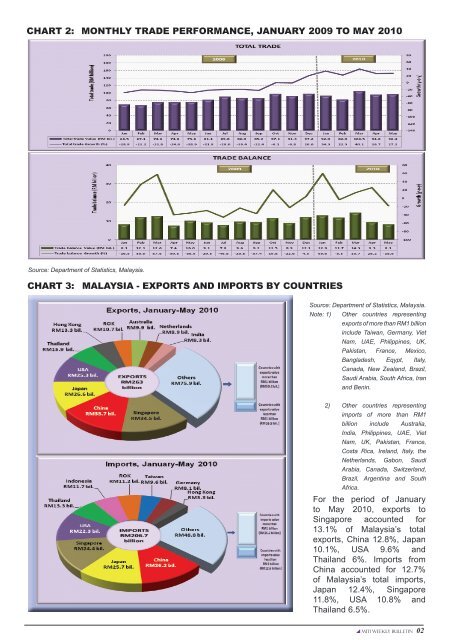
CHART 2: MONTHLY TRADE PERFORMANCE, JANUARY 2009 TO MAY 2010<br />
Source: Department <strong>of</strong> Statistics, Malaysia.<br />
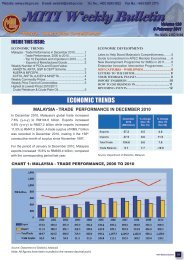
CHART 3: MALAYSIA - EXPORTS AND IMPORTS BY COUNTRIES<br />
Source: Department <strong>of</strong> Statistics, Malaysia.<br />
Note: 1) Other countries representing<br />
exports <strong>of</strong> more than RM1 billion<br />
include Taiwan, Germany, Viet<br />
Nam, UAE, Philippines, UK,<br />
Pakistan, France, Mexico,<br />
Bangladesh, Eqypt, Italy,<br />
Canada, New Zeal<strong>and</strong>, Brazil,<br />
Saudi Arabia, South Africa, Iran<br />
<strong>and</strong> Benin.<br />
2) Other countries representing<br />
imports <strong>of</strong> more than RM1<br />
billion include Australia,<br />
India, Philippines, UAE, Viet<br />
Nam, UK, Pakistan, France,<br />
Costa Rica, Irel<strong>and</strong>, Italy, the<br />
Netherl<strong>and</strong>s, Gabon, Saudi<br />
Arabia, Canada, Switzerl<strong>and</strong>,<br />
Brazil, Argentina <strong>and</strong> South<br />
Africa.<br />
For the period <strong>of</strong> January<br />
to May 2010, exports to<br />
Singapore accounted for<br />
13.1% <strong>of</strong> Malaysia’s total<br />
exports, China 12.8%, Japan<br />
10.1%, USA 9.6% <strong>and</strong><br />
Thail<strong>and</strong> 6%. Imports from<br />
China accounted for 12.7%<br />
<strong>of</strong> Malaysia’s total imports,<br />
Japan 12.4%, Singapore<br />
11.8%, USA 10.8% <strong>and</strong><br />
Thail<strong>and</strong> 6.5%.<br />
MITI Weekly Bulletin 02