Torbay Childcare Sufficiency Assessment - Torbay Council
Torbay Childcare Sufficiency Assessment - Torbay Council
Torbay Childcare Sufficiency Assessment - Torbay Council

You also want an ePaper? Increase the reach of your titles
YUMPU automatically turns print PDFs into web optimized ePapers that Google loves.
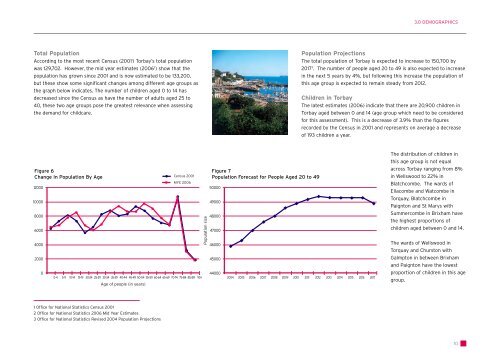
Total Population<br />
According to the most recent Census (2001 1 ) <strong>Torbay</strong>’s total population<br />
was 129,702. However, the mid year estimates (2006 2 ) show that the<br />
population has grown since 2001 and is now estimated to be 133,200,<br />
but these show some significant changes among different age groups as<br />
the graph below indicates. The number of children aged 0 to 14 has<br />
decreased since the Census as have the number of adults aged 25 to<br />
40, these two age groups pose the greatest relevance when assessing<br />
the demand for childcare.<br />
Figure 6<br />
Change In Population By Age<br />
12000<br />
10000<br />
8000<br />
6000<br />
4000<br />
2000<br />
0<br />
0-4 5-9 10-14 15-19 20-24 25-29 30-34 35-39 40-44 45-49 50-54 55-59 60-64 65-69 70-74 75-84 85-89 90+<br />
Age of people (in years)<br />
1 Office for National Statistics Census 2001<br />
2 Office for National Statistics 2006 Mid Year Estimates<br />
3 Office for National Statistics Revised 2004 Population Projections<br />
Census 2001<br />
MYE 2006<br />
Population size<br />
Figure 7<br />
Population Forecast for People Aged 20 to 49<br />
50000<br />
49000<br />
48000<br />
47000<br />
46000<br />
45000<br />
44000<br />
Population Projections<br />
The total population of <strong>Torbay</strong> is expected to increase to 150,700 by<br />
2017 3 . The number of people aged 20 to 49 is also expected to increase<br />
in the next 5 years by 4%, but following this increase the population of<br />
this age group is expected to remain steady from 2012.<br />
Children in <strong>Torbay</strong><br />
The latest estimates (2006) indicate that there are 20,900 children in<br />
<strong>Torbay</strong> aged between 0 and 14 (age group which need to be considered<br />
for this assessment). This is a decrease of 3.9% than the figures<br />
recorded by the Census in 2001 and represents on average a decrease<br />
of 193 children a year.<br />
2004 2005 2006 2007 2008 2009 2010 2011 2012 2013 2014 2015 2016 2017<br />
3.0 DEMOGRAPHICS<br />
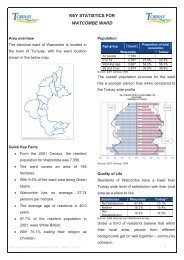
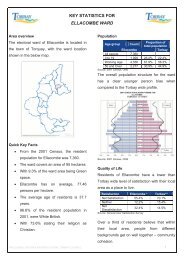
The distribution of children in<br />
this age group is not equal<br />
across <strong>Torbay</strong> ranging from 8%<br />
in Wellswood to 22% in<br />
Blatchcombe. The wards of<br />
Ellacombe and Watcombe in<br />
Torquay, Blatchcombe in<br />
Paignton and St Marys with<br />
Summercombe in Brixham have<br />
the highest proportions of<br />
children aged between 0 and 14.<br />
The wards of Wellswood in<br />
Torquay and Churston with<br />
Galmpton in between Brixham<br />
and Paignton have the lowest<br />
proportion of children in this age<br />
group.<br />
10