Torbay Childcare Sufficiency Assessment - Torbay Council
Torbay Childcare Sufficiency Assessment - Torbay Council
Torbay Childcare Sufficiency Assessment - Torbay Council

You also want an ePaper? Increase the reach of your titles
YUMPU automatically turns print PDFs into web optimized ePapers that Google loves.
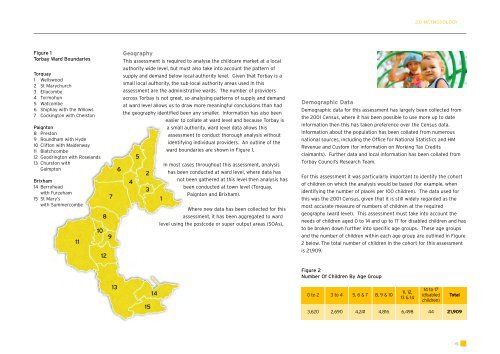
Figure 1<br />
<strong>Torbay</strong> Ward Boundaries<br />
Torquay<br />
1 Wellswood<br />
2 St Marychurch<br />
3 Ellacombe<br />
4 Tormohun<br />
5 Watcombe<br />
6 Shiphay with the Willows<br />
7 Cockington with Chelston<br />
Paignton<br />
8 Preston<br />
9 Roundham with Hyde<br />
10 Clifton with Maidenway<br />
11 Blatchcombe<br />
12 Goodrington with Roselands<br />
13 Churston with<br />
Galmpton<br />
Brixham<br />
14 Berryhead<br />
with Furzeham<br />
15 St Mary’s<br />
with Summercombe<br />
11<br />
10<br />
8<br />
12<br />
7<br />
9<br />
13<br />
Geography<br />
This assessment is required to analyse the childcare market at a local<br />
authority wide level, but must also take into account the pattern of<br />
supply and demand below local authority level. Given that <strong>Torbay</strong> is a<br />
small local authority, the sub-local authority areas used in this<br />
assessment are the administrative wards. The number of providers<br />
across <strong>Torbay</strong> is not great, so analysing patterns of supply and demand<br />
at ward level allows us to draw more meaningful conclusions than had<br />
the geography identified been any smaller. Information has also been<br />
easier to collate at ward level and because <strong>Torbay</strong> is<br />
a small authority, ward level data allows this<br />
assessment to conduct thorough analysis without<br />
identifying individual providers. An outline of the<br />
ward boundaries are shown in Figure 1.<br />
5<br />
In most cases throughout this assessment, analysis<br />
6<br />
2 has been conducted at ward level, where data has<br />
not been gathered at this level then analysis has<br />
4<br />
been conducted at town level (Torquay,<br />
3<br />
Paignton and Brixham).<br />
1<br />
Where new data has been collected for this<br />
assessment, it has been aggregated to ward<br />
level using the postcode or super output areas (SOAs).<br />
15<br />
14<br />
Demographic Data<br />
Demographic data for this assessment has largely been collected from<br />
the 2001 Census, where it has been possible to use more up to date<br />
information then this has taken preference over the Census data.<br />
Information about the population has been collated from numerous<br />
national sources, including the Office for National Statistics and HM<br />
Revenue and Custom (for information on Working Tax Credits<br />
claimants). Further data and local information has been collated from<br />
<strong>Torbay</strong> <strong>Council</strong>’s Research Team.<br />
For this assessment it was particularly important to identify the cohort<br />
of children on which the analysis would be based (for example, when<br />
identifying the number of places per 100 children). The data used for<br />
this was the 2001 Census, given that it is still widely regarded as the<br />
most accurate measure of numbers of children at the required<br />
geography (ward level). This assessment must take into account the<br />
needs of children aged 0 to 14 and up to 17 for disabled children and has<br />
to be broken down further into specific age groups. These age groups<br />
and the number of children within each age group are outlined in Figure<br />
2 below. The total number of children in the cohort for this assessment<br />
is 21,909.<br />
Figure 2<br />
Number Of Children By Age Group<br />
0 to 2 3 to 4 5, 6 & 7 8, 9 & 10<br />
11, 12,<br />
13 & 14<br />
2.0 METHODOLOGY<br />
14 to 17<br />
(disabled<br />
children)<br />
Total<br />
3,620 2,690 4,241 4,816 6,498 44 21,909<br />
6