Torbay Childcare Sufficiency Assessment - Torbay Council
Torbay Childcare Sufficiency Assessment - Torbay Council
Torbay Childcare Sufficiency Assessment - Torbay Council

Create successful ePaper yourself
Turn your PDF publications into a flip-book with our unique Google optimized e-Paper software.
March 2008<br />
<strong>Torbay</strong> <strong>Childcare</strong><br />
<strong>Sufficiency</strong> <strong>Assessment</strong>
FOREWORD<br />
<strong>Torbay</strong> Early Years and <strong>Childcare</strong> Service is responsible for<br />
implementing the government’s ten year strategy for childcare. The<br />
strategy has been developed in the context of the Every Child Matters<br />
agenda, the <strong>Childcare</strong> Act 2006 and the National <strong>Childcare</strong> Strategy.<br />
The <strong>Childcare</strong> Act 2006 is the first Government Act solely concerned<br />
with early years and childcare. It places a number of duties on local<br />
authorities, one of which is to provide sufficient childcare for working<br />
parents.<br />
‘Sufficient childcare’ means ensuring the provision of local childcare<br />
to meet the requirements of parents to enable them to work or<br />
undertake training leading to work. In essence, this means ensuring<br />
there is enough, and the right type of, childcare in <strong>Torbay</strong>, now and in<br />
the future.<br />
To establish the current status of childcare in <strong>Torbay</strong> the <strong>Childcare</strong><br />
<strong>Sufficiency</strong> <strong>Assessment</strong> was undertaken. The results are based on<br />
extensive consultation, which has been carried out with local parents,<br />
children, childcare providers and employers over the last twelve<br />
months.<br />
We would like to take this opportunity to thank everyone who took<br />
part in <strong>Torbay</strong>’s <strong>Childcare</strong> <strong>Sufficiency</strong> <strong>Assessment</strong>. Their valuable<br />
contributions have enabled us to establish a clearer picture of the<br />
childcare needs of parents and families in <strong>Torbay</strong>.<br />
The assessment is an extremely important piece of research and will<br />
be reviewed yearly. This will enable us to map the supply of childcare<br />
in <strong>Torbay</strong> against the demand for it – and continue to provide better<br />
outcomes for local children and their families.<br />
Lyn Armitage<br />
Early Years and <strong>Childcare</strong> Manager
CONTENTS<br />
1. 1 Introduction .................................................................... 2<br />
2. 2 Methodology .................................................................. 5<br />
3. 3 Demographics ................................................................ 9<br />
4. 4 Economic Activity ....................................................... 16<br />
5. 5 Early Years Education ................................................ 21<br />
6. 6 <strong>Childcare</strong> Supply ......................................................... 26<br />
7. 7 <strong>Childcare</strong> Demand ...................................................... 38<br />
8. 8 Matching Supply to Demand .................................... 51<br />
9. 9<br />
Summary of Key Findings ....................................... 56
1.0<br />
INTRODUCTION<br />
The <strong>Childcare</strong> Act 2006 expands the<br />
role that local authorities must take in<br />
delivering the government’s<br />
commitment to give every child the best<br />
start in life and to give parents greater<br />
choice in balancing work and family life.<br />
This Act places duties on local<br />
authorities to improve outcomes for<br />
children and young people and reduce<br />
the inequalities between them. Local<br />
authorities are tasked with ensuring<br />
there is sufficient childcare for working<br />
parents and those wishing to return to<br />
work or undertake training / education<br />
to enable them to return to work. They<br />
are also required to provide information<br />
to parents about childcare and the wide<br />
range of services which are available<br />
and may be of benefit to them.<br />
2
1.0 INTRODUCTION<br />
Under the <strong>Childcare</strong> Act 2006, <strong>Torbay</strong> <strong>Council</strong> has to take a vital role as<br />
strategic leaders in the local childcare market. Together with the<br />
providers from the private, voluntary and independent (PVI) sector,<br />
<strong>Torbay</strong> must work towards creating a strong, sustainable and diverse<br />
childcare market which will meet the needs of parents. From April<br />
2008, <strong>Torbay</strong> has a duty to secure sufficient childcare in the area. In<br />
preparation for this the council was required to undertake a detailed<br />
sufficiency assessment of the supply of local childcare and the demand<br />
for it.<br />
Aims and Objectives<br />
The purpose of this report is to provide a detailed assessment of<br />
childcare sufficiency regarding the supply of childcare against the<br />
parental demand for it. This assessment is the first step in enabling<br />
<strong>Torbay</strong> to secure sufficient provision and meet our duties under Section<br />
11 of the <strong>Childcare</strong> Act 2006.<br />
The assessment is required to be a measurement of the nature and<br />
extent of both the need for, and supply of, childcare within the local<br />
authority area (and sub-authority area). It will help <strong>Torbay</strong> identify<br />
where there are gaps in the market and in consultation with parents,<br />
communities and employers, plan how to support the market to address<br />
these gaps.<br />
This duty to assess childcare must take into consideration the supply of<br />
and demand for formal childcare which may be registered, unregistered,<br />
or approved and which meets the needs of working parents or those<br />
wishing to return to work. This assessment must also take account of<br />
the early years provision for 3 and 4 year olds which local authorities<br />
must secure, free of charge.<br />
This assessment will be a comprehensive and robust analysis of the<br />
local childcare market which will enable <strong>Torbay</strong> <strong>Council</strong> to confidently<br />
plan the action needed to secure sufficient childcare and to take a lead<br />
role in facilitating the local childcare market.<br />
Sufficient childcare is defined in Section 6 of The <strong>Childcare</strong> Act 2006 as<br />
3<br />
“sufficient to meet the requirements of parents in [the local authority’s]<br />
area who require childcare in order to enable them to:<br />
a) Take up or remain in work<br />
b) Undertake education or training which could reasonably be<br />
expected to assist them to obtain work.<br />
In determining whether provision of childcare is sufficient <strong>Torbay</strong> <strong>Council</strong>:<br />
a) Must have regard to the needs of parents in their area for<br />
i) the provision of childcare in respect of which the childcare<br />
element of the Working Tax Credit is payable, and<br />
ii) the provision of childcare which is suitable for disabled<br />
children<br />
b) May have regard to any childcare which they expect to be<br />
available outside their area.”<br />
Outline of this <strong>Assessment</strong><br />
This assessment has followed a series of steps in its preparation:<br />
a) Assessing the supply of childcare in each sub-local authority<br />
area, taking into account the following:<br />
■ The number of childcare places available for children up<br />
to and including the age of 14 (and up to 17 for disabled<br />
children)<br />
■ The number of places available for which parents would<br />
be able to use the childcare element of the Working Tax<br />
Credit<br />
■ The number of free entitlement places available for 3 and<br />
4 year olds<br />
■ The times at which childcare is available, the maximum<br />
length of time that childcare providers will care for<br />
children in a day and their flexibility in catering for<br />
irregular patterns across the day, the week and the year<br />
■ The number and nature of places available for children<br />
who need special care due to a disability or special<br />
educational need<br />
■ The number of vacant places<br />
■ The range of session lengths offered by childcare<br />
providers, and
The purpose of this<br />
report is to provide<br />
a detailed<br />
assessment of<br />
childcare sufficiency<br />
in <strong>Torbay</strong><br />
■ The range of charges for childcare and parents’ ability to<br />
pay those charges<br />
b) Assessing the demand for childcare in each sub local<br />
authority area, taking into account at least the following, by<br />
age range and type:<br />
■ The number of childcare places required for children up<br />
to and including the age of 14 (or 17 for disabled children)<br />
■ The number of childcare places required in respect of<br />
which the childcare element of the Working Tax Credit<br />
may be claimed<br />
■ The number of free entitlement places required for 3 and<br />
4 year olds<br />
■ The times at which childcare is required, including the<br />
demand for flexible childcare that caters for irregular<br />
patterns of usage across the day, the week and year<br />
■ The requirements for specialist childcare for disabled<br />
children and those with special educational needs<br />
c) Analysing the gap between demand and supply in each sublocal<br />
authority area, taking into account at least the<br />
following:<br />
■ Geographical gaps – where a geographical area has a<br />
general shortage of supply<br />
■ Income gaps – where there is a shortage of affordable<br />
childcare for the income groups populating an area<br />
■ Specific need gaps – where there is a shortage of suitable<br />
places for disabled children, or children with other<br />
specific needs or requirements<br />
■ Time gaps – where there is a shortage of childcare at a<br />
time that parents would wish to use childcare<br />
■ Age gaps – where there is a shortage of childcare<br />
suitable to meet the needs and requirements of a certain<br />
age group<br />
■ Type gaps – where there is a shortage in the type of<br />
childcare for which parents may be expressing a<br />
preference<br />
1.0 INTRODUCTION<br />
Firstly, this assessment provides a methodology detailing the<br />
geographic level at which the data has been analysed. This chapter also<br />
identifies the cohort of children which has been used so that we may be<br />
able to identify the potential demand for childcare. The methodology<br />
also outlines how all strands of consultation were designed and<br />
conducted.<br />
The chapters on demographics and economic activity provide this<br />
assessment with some context. The demographics chapter considers<br />
how the population of <strong>Torbay</strong> is made up, the current population of<br />
children and how this may change in future years and outlines the level<br />
of deprivation across the area. The economic activity chapter outlines<br />
patterns of work, levels of income, rank of income deprivation and the<br />
take up of Working Tax Credits (WTC), in particular the take up of the<br />
childcare element. The information in these chapters not only provides<br />
a useful context, but much of the data contained in them will<br />
undoubtedly have an impact on the demand for childcare.<br />
The current supply of, and demand for, free nursery education places is<br />
analysed in chapter 5 which looks at the supply and demand of early<br />
years education places. It considers the number of places available<br />
across the private, voluntary and independent (PVI) sector and<br />
maintained sector, and also considers the take up of these places and<br />
issues around the demand for free nursery education.<br />
The current supply of childcare is considered in chapter 6 which<br />
analyses supply at a local authority wide level and sub-authority level.<br />
It considers the level of supply by type, age group, availability of<br />
flexible / irregular hours and also analyses the cost of provision.<br />
The level of demand for childcare is analysed in chapter 7 which<br />
includes occupancy rates by type of provider, enquiries made to our<br />
children’s information service and the key findings from the<br />
consultation which considers the demand for childcare by type,<br />
location and age group. Following on from this, chapter 8 considers<br />
demand against supply and identifies any gaps in the current<br />
childcare market.<br />
4
5<br />
METHODOLOGY 2.0<br />
This assessment of childcare sufficiency<br />
must take into account a number of<br />
demographic factors. It must identify,<br />
geographically, the supply and demand<br />
of childcare at local authority wide level<br />
and sub-local authority level. Finally it<br />
must consult with parents, children,<br />
employers and the providers themselves<br />
to establish an accurate picture of the<br />
current childcare market in order to<br />
effectively identify any gaps in<br />
provisions. This chapter outlines the<br />
geography at which analysis has taken<br />
place, the data used throughout this<br />
assessment and outlines how parents,<br />
employers, children and providers have<br />
been consulted.
Figure 1<br />
<strong>Torbay</strong> Ward Boundaries<br />
Torquay<br />
1 Wellswood<br />
2 St Marychurch<br />
3 Ellacombe<br />
4 Tormohun<br />
5 Watcombe<br />
6 Shiphay with the Willows<br />
7 Cockington with Chelston<br />
Paignton<br />
8 Preston<br />
9 Roundham with Hyde<br />
10 Clifton with Maidenway<br />
11 Blatchcombe<br />
12 Goodrington with Roselands<br />
13 Churston with<br />
Galmpton<br />
Brixham<br />
14 Berryhead<br />
with Furzeham<br />
15 St Mary’s<br />
with Summercombe<br />
11<br />
10<br />
8<br />
12<br />
7<br />
9<br />
13<br />
Geography<br />
This assessment is required to analyse the childcare market at a local<br />
authority wide level, but must also take into account the pattern of<br />
supply and demand below local authority level. Given that <strong>Torbay</strong> is a<br />
small local authority, the sub-local authority areas used in this<br />
assessment are the administrative wards. The number of providers<br />
across <strong>Torbay</strong> is not great, so analysing patterns of supply and demand<br />
at ward level allows us to draw more meaningful conclusions than had<br />
the geography identified been any smaller. Information has also been<br />
easier to collate at ward level and because <strong>Torbay</strong> is<br />
a small authority, ward level data allows this<br />
assessment to conduct thorough analysis without<br />
identifying individual providers. An outline of the<br />
ward boundaries are shown in Figure 1.<br />
5<br />
In most cases throughout this assessment, analysis<br />
6<br />
2 has been conducted at ward level, where data has<br />
not been gathered at this level then analysis has<br />
4<br />
been conducted at town level (Torquay,<br />
3<br />
Paignton and Brixham).<br />
1<br />
Where new data has been collected for this<br />
assessment, it has been aggregated to ward<br />
level using the postcode or super output areas (SOAs).<br />
15<br />
14<br />
Demographic Data<br />
Demographic data for this assessment has largely been collected from<br />
the 2001 Census, where it has been possible to use more up to date<br />
information then this has taken preference over the Census data.<br />
Information about the population has been collated from numerous<br />
national sources, including the Office for National Statistics and HM<br />
Revenue and Custom (for information on Working Tax Credits<br />
claimants). Further data and local information has been collated from<br />
<strong>Torbay</strong> <strong>Council</strong>’s Research Team.<br />
For this assessment it was particularly important to identify the cohort<br />
of children on which the analysis would be based (for example, when<br />
identifying the number of places per 100 children). The data used for<br />
this was the 2001 Census, given that it is still widely regarded as the<br />
most accurate measure of numbers of children at the required<br />
geography (ward level). This assessment must take into account the<br />
needs of children aged 0 to 14 and up to 17 for disabled children and has<br />
to be broken down further into specific age groups. These age groups<br />
and the number of children within each age group are outlined in Figure<br />
2 below. The total number of children in the cohort for this assessment<br />
is 21,909.<br />
Figure 2<br />
Number Of Children By Age Group<br />
0 to 2 3 to 4 5, 6 & 7 8, 9 & 10<br />
11, 12,<br />
13 & 14<br />
2.0 METHODOLOGY<br />
14 to 17<br />
(disabled<br />
children)<br />
Total<br />
3,620 2,690 4,241 4,816 6,498 44 21,909<br />
6
2.0 METHODOLOGY<br />
Consultation<br />
The consultation with parents and carers was a key factor in this<br />
assessment being able to analyse and establish the demand for<br />
childcare. A number of methods were used to ensure that parents had<br />
the opportunity to have their say about the local childcare market. The<br />
main route through which parents were consulted was a questionnaire.<br />
This questionnaire asked parents to identify their current use of<br />
childcare, what they looked for when choosing childcare and whether<br />
they thought more childcare was needed. Given the importance of this<br />
survey for this assessment, it was decided that an incentive would be<br />
offered to parents to ensure as high a return rate as possible. Parents<br />
who consented were entered into a prize draw to win one of five £100<br />
gift vouchers for a high street shop.<br />
In total 4,000 surveys were issued to parents using a variety of existing<br />
structures. The majority of the questionnaires were distributed through<br />
<strong>Torbay</strong>’s Children’s Centres and staff in these settings went through the<br />
surveys with parents to ensure they were completed. The survey was<br />
distributed through nurseries / pre-schools and schools and was also<br />
available on the <strong>Torbay</strong> <strong>Council</strong> website.<br />
The most successful mechanism for getting parents to complete the<br />
surveys was via family events held throughout the summer. The Early<br />
Years and <strong>Childcare</strong> Service made use of Children’s Week held in August<br />
on Paignton seafront. This event provided a captive audience and the<br />
team offered incentives for completed surveys (free goody bags for<br />
children on completion of a questionnaire). From one day at this event,<br />
just fewer than 200 surveys were completed. Building on this success<br />
the Early Years and <strong>Childcare</strong> Service organised another event, a Family<br />
Fun Day at the end of September which was free for all families to<br />
attend. ‘Free goody bags’ were again used as an incentive for parents<br />
to complete the questionnaire. In total, 946 parents completed the<br />
questionnaire, which equates to a response rate of 23.7%.<br />
The majority of respondents who completed the survey were female<br />
(91%) and aged between 25 and 44 years old (86%), 8% of the<br />
respondents were aged under 24 years old. The majority of parents<br />
7<br />
who completed the survey lived in <strong>Torbay</strong> and the surrounding towns,<br />
although through children’s week, the consultation inevitably reached a<br />
small number of parents who lived further away (see Figure 3).<br />
In terms of the ethnic origin of respondents, the survey was fairly<br />
representative of the population of <strong>Torbay</strong> (see Figure 4). The same<br />
can be said for the make up of households, the sample was fairly<br />
representative of the population (Figure 5).<br />
In addition to the questionnaires, parents were invited to be a part of<br />
focus groups which were arranged at children’s centres. In total eight<br />
focus groups were arranged and 125 parents were invited to participate,<br />
unfortunately take up was low and only 14 parents attended. The<br />
parents who were able to attend came from different backgrounds and<br />
one group in particular involved parents who all had English as their<br />
second language. A focus group session was also arranged with parents<br />
of disabled children, this made use of an existing parents’ group that<br />
the Early Years Inclusion Service organised regularly. A further group<br />
the research team made use of was the disabled parents’ parent and<br />
toddler group. These focus groups provided the opportunity to gain<br />
more in-depth information from parents about any issues they had<br />
relating to childcare.<br />
Children were also consulted through this assessment across all ages<br />
from 3 to 18. The research with 3 to 5 year olds was small scale and<br />
coordinated by the Integrated Nursery Manager. The children all<br />
attended children’s centre nurseries and received integrated care and<br />
education, they attended nursery for at least 1.5 days a week. This<br />
piece of research involved 12 children and aimed to assess their views /<br />
feelings about attending nursery. In order to do this, consent was first<br />
gained by the parents and then three activities were undertaken:<br />
■ Observation of children, on arrival and on departure from<br />
nursery<br />
■ Asking children what makes them happy and sad at nursery<br />
■ Small world play activity<br />
Figure 3<br />
Respondents By Home Town<br />
Town<br />
Torquay 408 43.1<br />
Paignton<br />
Brixham<br />
Newton Abbot<br />
Totnes<br />
Other<br />
No. %<br />
296 31.3<br />
72 7.6<br />
30 3.2<br />
9 1<br />
132 14<br />
Figure 4<br />
Ethnic Origin Of Respondents<br />
120<br />
100<br />
80<br />
60<br />
40<br />
20<br />
0<br />
White<br />
British<br />
Figure 5<br />
Make Up Of Household<br />
90<br />
80<br />
70<br />
60<br />
50<br />
40<br />
30<br />
20<br />
10<br />
0<br />
Two parent<br />
family<br />
Survey<br />
Respondents<br />
Other Ethnic<br />
Group<br />
Single parent<br />
family<br />
Census
The consultation with parents and carers<br />
was a key factor in this assessment to<br />
analyse and establish the demand for<br />
childcare. A number of methods were used<br />
to ensure that parents had the opportunity<br />
to have their say about the local childcare<br />
market.<br />
2.0 METHODOLOGY<br />
Consultation with older children and young people was conducted<br />
through the Youth e-Panel (YEP) which was coordinated by <strong>Torbay</strong>’s<br />
Consultation and Research Team. Questionnaires were sent to over 400<br />
children and young people and only 26 were returned. It is considered<br />
that the reason why this part of the consultation received such a low<br />
response rate is that the panel tends to be quite fluid. Another reason<br />
could be that the consultation, which occurred last year, received much<br />
negative public attention (from adults) because of the subject matter.<br />
This negative attention may well have impacted on young people’s<br />
enthusiasm to complete this survey.<br />
Another key group this assessment had a duty to consult with was<br />
employers. Consultation with this group aimed to gauge what barriers<br />
they understand to be present in terms of childcare. Attempts were<br />
made to contact employers through local business breakfasts. While<br />
many employers did not engage in the consultation responses were<br />
returned from six employers who represented industries ranging from<br />
visitor attractions to publishing.<br />
Finally, a large consultation was undertaken with providers of childcare.<br />
All staff in the Early Years and <strong>Childcare</strong> Service, with assistance from<br />
the Pre-School Learning Alliance (PLA), made visits to providers and<br />
talked them through the survey for childcare providers. This ensured a<br />
100% response rate from day nurseries, pre-schools and independent<br />
schools. In addition to this, our development worker from Devon<br />
Childminding Association (DCMA) visited 50% of <strong>Torbay</strong>’s Childminders.<br />
Through this survey we were able to confirm what providers offer, their<br />
occupancy, costs and charges, care for disabled children or those with<br />
additional needs, as well as their thoughts on the current childcare<br />
market. In addition to the visits, telephone interviews were conducted<br />
with a further ten childminders to gain their thoughts on the childcare<br />
market as this was not covered in their visits.<br />
8
9<br />
3.0<br />
DEMOGRAPHICS<br />
There are a number of demographic<br />
factors which can impact on the demand<br />
for childcare and this chapter will<br />
consider these factors and how the<br />
population is expected to change over<br />
the next couple of years. Information in<br />
this chapter includes:<br />
■ Total population<br />
■ Population projections<br />
■ Household composition<br />
■ Housing developments
Total Population<br />
According to the most recent Census (2001 1 ) <strong>Torbay</strong>’s total population<br />
was 129,702. However, the mid year estimates (2006 2 ) show that the<br />
population has grown since 2001 and is now estimated to be 133,200,<br />
but these show some significant changes among different age groups as<br />
the graph below indicates. The number of children aged 0 to 14 has<br />
decreased since the Census as have the number of adults aged 25 to<br />
40, these two age groups pose the greatest relevance when assessing<br />
the demand for childcare.<br />
Figure 6<br />
Change In Population By Age<br />
12000<br />
10000<br />
8000<br />
6000<br />
4000<br />
2000<br />
0<br />
0-4 5-9 10-14 15-19 20-24 25-29 30-34 35-39 40-44 45-49 50-54 55-59 60-64 65-69 70-74 75-84 85-89 90+<br />
Age of people (in years)<br />
1 Office for National Statistics Census 2001<br />
2 Office for National Statistics 2006 Mid Year Estimates<br />
3 Office for National Statistics Revised 2004 Population Projections<br />
Census 2001<br />
MYE 2006<br />
Population size<br />
Figure 7<br />
Population Forecast for People Aged 20 to 49<br />
50000<br />
49000<br />
48000<br />
47000<br />
46000<br />
45000<br />
44000<br />
Population Projections<br />
The total population of <strong>Torbay</strong> is expected to increase to 150,700 by<br />
2017 3 . The number of people aged 20 to 49 is also expected to increase<br />
in the next 5 years by 4%, but following this increase the population of<br />
this age group is expected to remain steady from 2012.<br />
Children in <strong>Torbay</strong><br />
The latest estimates (2006) indicate that there are 20,900 children in<br />
<strong>Torbay</strong> aged between 0 and 14 (age group which need to be considered<br />
for this assessment). This is a decrease of 3.9% than the figures<br />
recorded by the Census in 2001 and represents on average a decrease<br />
of 193 children a year.<br />
2004 2005 2006 2007 2008 2009 2010 2011 2012 2013 2014 2015 2016 2017<br />
3.0 DEMOGRAPHICS<br />
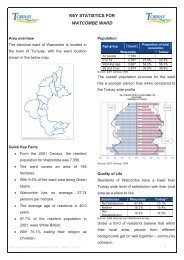
The distribution of children in<br />
this age group is not equal<br />
across <strong>Torbay</strong> ranging from 8%<br />
in Wellswood to 22% in<br />
Blatchcombe. The wards of<br />
Ellacombe and Watcombe in<br />
Torquay, Blatchcombe in<br />
Paignton and St Marys with<br />
Summercombe in Brixham have<br />
the highest proportions of<br />
children aged between 0 and 14.<br />
The wards of Wellswood in<br />
Torquay and Churston with<br />
Galmpton in between Brixham<br />
and Paignton have the lowest<br />
proportion of children in this age<br />
group.<br />
10
3.0 DEMOGRAPHICS<br />
Figure 8<br />
Distribution Of Children<br />
Aged 0 to 14<br />
% of Children<br />
Aged 0 to 14<br />
11<br />
20-23% (3)<br />
17-19.9% (4)<br />
14-16.9% (5)<br />
11-13.9% (2)<br />
8-10.9% (1)<br />
Figure 9<br />
Children By Age Group And Ward<br />
Ward 2 & under 3 to 4 5 to 7 8 to 10 11 to 14 Total<br />
Berryhead with Furzeham 228 175 239 346 539 1,527<br />
Blatchcombe 407 272 448 495 638 2,260<br />
Churston with Galmpton 109 87 155 203 302 856<br />
Clifton with Maidenway 182 155 206 280 356 1,179<br />
Cockington with Chelston 357 230 411 472 612 2,082<br />
Ellacombe 284 196 281 338 432 1,531<br />
Goodrington with Roselands 168 143 196 240 323 1,070<br />
Preston 245 229 276 345 417 1,512<br />
Roundham with Hyde 177 117 179 213 286 972<br />
Shiphay with the Willows 305 228 349 347 406 1,635<br />
St Marychurch 276 214 391 399 584 1,864<br />
St Marys with Summercombe 204 147 248 287 406 1,292<br />
Tormohun 322 226 392 332 556 1,828<br />
Watcombe 248 198 316 382 466 1,610<br />
Wellswood 108 73 154 137 175 647<br />
Total children - <strong>Torbay</strong> 3,620 2,690 4,241 4,816 6,498 21,865<br />
Children Aged Under 2<br />
Children under the age of 2 make up just 3% of the total population<br />
(3,620). The distribution of children in this age group tends to follow<br />
the pattern of overall children. The areas with the highest numbers of<br />
children under 2 are Blatchcombe, Cockington with Chelston and<br />
Tormohun. The areas with the lowest number of children are Wellswood,<br />
Churston with Galmpton and Goodrington with Roselands.<br />
Children Aged 3 and 4<br />
According to the Census, there are 2,690 children who are aged 3 and 4<br />
in <strong>Torbay</strong>, children in this age group make up just 2.1% of the total<br />
population and 12.3% of the total population of children and young<br />
Source: Census 2001, Office for National<br />
Statistics
4 <strong>Torbay</strong> <strong>Council</strong> Schools Census,<br />
August 2007<br />
people (aged 0 to 14). The wards with the highest proportion of children<br />
in this age group are Blatchcombe, Cockington with Chelston, Shiphay<br />
with the Willows and Preston. The population of this age group is of<br />
particular interest when this assessment comes to examine the supply<br />
and demand of early years education.<br />
Children Aged 5, 6 and 7<br />
There are 4,241 children aged 5, 6 and 7, they make up 3.3% of the total<br />
population and just under a fifth of the population of children and<br />
young people. Again, Blatchcombe and Shiphay with the Willows have<br />
the higher proportions of children in this age group, as do Tormohun<br />
and St Marychurch.<br />
Children Aged 8, 9 and 10<br />
Children aged between 8 and 10 make up just over a fifth of the<br />
population of children and young people (22%). The distribution of<br />
children in this age group tends to be fairly even across <strong>Torbay</strong>, with the<br />
exception of Wellswood. Wards with the highest proportion of children<br />
in this age group again are Blatchcombe, Shiphay with the Willows and<br />
St Marychurch.<br />
Children Aged 11, 12, 13 and 14<br />
Children and young people aged between 11 and 14 make up just under a<br />
third (30%) of the population under 14. As above the highest<br />
proportions of children in this age group can be found in Blatchcombe,<br />
Cockington with Chelston and St Marychurch.<br />
Disabled Children<br />
With the requirement for childcare to meet the needs of disabled<br />
children up to and including the age of 17. It is useful to be able to<br />
quantify the number of disabled children and young people in relation<br />
to the overall population aged 0 to 14, and specifically between 15 and<br />
17. Defining the exact number of children with disabilities and special<br />
needs can be difficult as the data tends to be collected about those with<br />
more severe difficulties or disabilities that require additional support.<br />
In 2007, there were 788 4 children identified as having Statements of<br />
Special Education Need (SEN) or are known to the Disability Service,<br />
this represents 2.7% of the population of all children and young people.<br />
There are 44 young people aged between 14 and 17 who are disabled<br />
and known to the Disability Service.<br />
000s<br />
Figure 10<br />
Proportion Of Total Population By Age Group<br />
7.0%<br />
6.0%<br />
5.0%<br />
Figure 11<br />
Projected Population Change<br />
9.0<br />
8.5<br />
8.0<br />
7.5<br />
7.0<br />
6.5<br />
6.0<br />
5.5<br />
Age 15-19<br />
Age 10-14<br />
Age 15-19<br />
Age 10-14<br />
3.0 DEMOGRAPHICS<br />
Age 5-9<br />
Age 0-4<br />
4.0%<br />
2004 2006 2008 2010 2012 2014 2016 2018 2020 2022 2024 2026 2028<br />
Age 5-9<br />
Age 0-4<br />
5.0<br />
2004 2006 2008 2010 2012 2014 2016 2018 2020 2022 2024 2026 2028<br />
Source: Office for National Statistics<br />
12
3.0 DEMOGRAPHICS<br />
Population Forecast for Children<br />
<strong>Torbay</strong> has been identified as a high growth authority area with<br />
projections showing an estimated 26% increase in the overall<br />
population from 132,500 in 2004 to 166,500 in 2029. However, over the<br />
next 25 years the overall proportion of young people in the total<br />
population is projected to decrease, this is shown in Figure 10 (see<br />
previous page).<br />
Despite the proportionate decrease in the younger people population,<br />
the actual number in each age group is projected to increase. Most<br />
notably the early years (0 to 4) age group is projected to increase by<br />
12.9% over the next 25 years. Figure 11 (see previous page) shows the<br />
projected change in numbers by age group over the 25 years.<br />
Birth Rate<br />
Since 1981, the birth rate in <strong>Torbay</strong> has remained fairly static with on<br />
average 1,233 births a year 5 . Data collected from the Registrar<br />
(January 2006 to September 2007) shows that the<br />
highest number of births are in the wards of Shiphay with<br />
the Willows, Cockington with Chelston and Tormohun.<br />
The wards which have seen the lowest number of births<br />
have been Wellswood, Goodrington with Roselands and<br />
Churston with Galmpton. Figure 12 shows the numbers of<br />
new births by ward.<br />
Household Composition<br />
On average the make up of households with dependent children in<br />
<strong>Torbay</strong> is fairly similar to that of England and to the South West,<br />
although the proportion of married couples in <strong>Torbay</strong> is slightly lower<br />
than regional and national averages (see Figure 13).<br />
While the pattern of household composition appears to be fairly<br />
consistent across the bay, it is apparent that there is a higher<br />
proportion of lone parents in the wards of Tormohun, Ellacombe and<br />
Roundham with Hyde.<br />
5 Office for National Statistics<br />
13<br />
Figure 12<br />
Number Of Births By Ward<br />
Births Jan 06 to Sep 07<br />
180 to 225 (3)<br />
134 to 179 (5)<br />
88 to 133 (4)<br />
42 to 87 (3)<br />
Figure 13<br />
Proportion Of Households With Dependent Children<br />
Married couples 13.5% 17.3% 17.6%<br />
Co-habiting couples<br />
Lone parents<br />
Other households<br />
Berryhead with Furzeham<br />
Blatchcombe<br />
Churston with Galmpton<br />
Clifton with Maidenway<br />
Cockington with Chelston<br />
Ellacombe<br />
Goodrington with Roselands<br />
Preston<br />
Roundham with Hyde<br />
Shiphay with the Willows<br />
St Marychurch<br />
St Marys with Summercombe<br />
Tormohun<br />
Watcombe<br />
Wellswood<br />
<strong>Torbay</strong> South West England<br />
3.0% 3.1% 3.2%<br />
6.6% 5.4% 6.4%<br />
2.0% 1.7% 2.2%<br />
0% 20% 40% 60% 80% 100%<br />
Married couples<br />
Lone couples<br />
Co-habiting couples<br />
Other households<br />
Source: Census 2001, Office for National Statistics
Ethnic Origin<br />
The number of people from a black and minority ethnic background<br />
living in <strong>Torbay</strong> has increased significantly since 1991 and now accounts<br />
for 3.2% of the resident population 6 . However, this figure is still well<br />
below the national average, Figure 14 shows the population by ethnic<br />
origin as counted by the Census.<br />
Like many areas across England, <strong>Torbay</strong> has experienced an increase in<br />
the number of people moving from eastern European countries. Figure<br />
15 (below right) shows the number<br />
of applicants to the Workers<br />
Registration Scheme who are<br />
working in <strong>Torbay</strong> (May 2004 to<br />
September 2007) by nationality.<br />
The table shows registered workers<br />
rather than the number of<br />
applications made.<br />
Indices of Deprivation<br />
(2007)<br />
The latest Indices of Multiple<br />
Deprivation (2007) show <strong>Torbay</strong><br />
ranking 71st most deprived Local<br />
Authority in England, this is well<br />
within the top quartile. In the last<br />
three years, since the 2004 index was released the number of super<br />
output areas (SOAs) in <strong>Torbay</strong> which rank in the 30% most deprived<br />
nationally has increased from 28 to 38, with the number of areas<br />
ranking in the 10% most deprived nationally increasing from four to ten.<br />
The map in Figure 16 shows the rank of deprivation across <strong>Torbay</strong>. It is<br />
clear the wards which cover central Torquay and Paignton are some of<br />
the most disadvantaged in England. The wards of Tormohun, Ellacombe,<br />
Watcombe, Roundham with Hyde and Blatchcombe are comprised of<br />
SOAs which rank in the most deprived nationally.<br />
6 Census 2001, Office for National<br />
Statistics<br />
Figure 14<br />
Population By Ethnic Origin<br />
Source: Census 2001,<br />
Office for National Statistics<br />
Figure 15<br />
Worker Registration Scheme<br />
Source: Home Office<br />
*Because of rounding up and<br />
confidentiality figures may not<br />
add up to totals shown<br />
White British 97% 87%<br />
White Irish<br />
White Other<br />
Mixed: White and Black Caribbean<br />
Mixed: White & Black African<br />
Mixed: White and Asian<br />
Mixed: Other<br />
Asian: Indian<br />
Asian: Pakistani<br />
Asian: Bangladeshi<br />
Asian: Other<br />
Black: Black Caribbean<br />
Black: African<br />
Black: Other<br />
Chinese<br />
Other Ethnic Group<br />
<strong>Torbay</strong> England & Wales<br />
0.6% 1.3%<br />
1.3% 2.7%<br />
0.2% 0.5%<br />
0.1% 0.2%<br />
0.2% 0.4%<br />
0.2% 0.3%<br />
0.1% 2.1%<br />
0.1% 1.4%<br />
0.02% 0.6%<br />
0.1% 0.5%<br />
0.1% 1.1%<br />
0.04% 0.1%<br />
0.02% 0.2%<br />
0.2% 0.5%<br />
0.1% 0.4%<br />
Czech Republic 60 5.0<br />
Estonia<br />
Hungary<br />
Latvia<br />
Lithuania<br />
Poland<br />
Slovakia<br />
Slovenia<br />
Total<br />
3.0 DEMOGRAPHICS<br />
Nationality Number<br />
%<br />
20* 1.5<br />
23 1.9<br />
20* 1.5<br />
98 8.2<br />
855 71.3<br />
137 11.4<br />
20* 0.2<br />
1,200* 100%<br />
14
3.0 DEMOGRAPHICS<br />
Housing Developments<br />
The development of new housing in significant quantities has the<br />
potential to impact greatly on the demand for childcare, although the<br />
extent of this impact will depend on the type of housing being<br />
developed. <strong>Torbay</strong> has been identified as one of 29 New Growth Points<br />
across the country. The New Growth Point Programme (2007) sets out<br />
the short and medium term plans for housing development and<br />
regeneration schemes in all three towns.<br />
<strong>Torbay</strong> is committed to delivering at least 500<br />
dwellings per year to 2016 and beyond, although the<br />
Regional Spatial Strategy, due for publication early<br />
2008, will set out the final level of housing so the figure<br />
of 500 dwellings a year could change.<br />
The short and medium term programme will emphasise the<br />
development of brownfield areas at the optimum and housing sites will<br />
be delivered through committed sites, particularly: Torre Marine and<br />
Scotts Bridge in Torquay; Great Parks and Foxhole in Paignton; and<br />
Dolphin in Brixham; as well as windfall development.<br />
In the medium term (2008-2011) key areas of housing to be delivered<br />
are likely to include Scotts Bridge and Hollicombe in Torquay, and Great<br />
Parks in Paignton.<br />
Regeneration will include Brixham Harbourside, waterfront and central<br />
car park to provide a mixed development, including residential, retail<br />
and employment uses. Medium term regeneration includes the Torquay<br />
Harbourside and town centre, together with Paignton town centre.<br />
15<br />
Figure 16<br />
Rank Of Overall<br />
Deprivation<br />
Ward boundary<br />
SOA boundary<br />
2007 Index Of Multiple Deprivation<br />
Top 10% in England (10)<br />
10% to 20% (4)<br />
20% to 30% (24)<br />
Key Findings<br />
■ The number of children aged 0 to 14 is not equally distributed<br />
across the bay, Ellacombe, Watcombe, Blatchcombe and St Marys<br />
with Summercombe have the highest proportion of children and<br />
young people in this age group<br />
■ The early years age group (0 to 4) is expected to see an increase of<br />
approximately 12.9% over the next 25 years<br />
■ The population of children aged 5 and above is set to decrease in<br />
the short term but increase overall over the next 25 years<br />
■ While the birth rate has remained fairly static in recent years, areas<br />
in Torquay such as Shiphay with the Willows, Cockington with<br />
Chelston and Tormohun have seen higher numbers of new births.<br />
Some of this can be attributed to the development of new housing,<br />
particularly in the case of Shiphay with the Willows<br />
■ <strong>Torbay</strong> is committed to delivering at least 500 dwellings a year until<br />
2016 and beyond. The areas which will see this growth are Shiphay<br />
with the Willows in Torquay, Blatchcombe in Paignton and St Marys<br />
with Summercombe in Brixham<br />
30% to 40% (18)<br />
40% to 50% (8)<br />
50% to 60% (15)<br />
60% to 70% (5)<br />
70% to 80% (4)<br />
80% to 90% (1)
4.0<br />
ECONOMIC ACTIVITY<br />
Economic activity in <strong>Torbay</strong> is undoubtedly linked to the need and demand for<br />
childcare. Understanding the economic activity of parents and income of<br />
families is crucial in undertaking this assessment of childcare sufficiency.<br />
A person is considered to be economically active if they are aged 16 to 74 and<br />
employed (in the week before the Census is conducted) or unemployed and<br />
actively looking for work. A person is economically inactive if they are retired,<br />
a student (not including those who are working), looking after home / family<br />
and permanently sick or disabled.<br />
16
4.0 ECONOMIC ACTIVITY<br />
Working Patterns<br />
In <strong>Torbay</strong> 79.2% of adults were economically active in 2006 7 , this is<br />
similar to the national figure of 78.6%, but slightly lower than the<br />
average for the south west, 81%.<br />
Figure 17 (top, right) shows that the proportion of people (as measured<br />
in the Census 2001) in full time employment is 33.3% in <strong>Torbay</strong>,<br />
compared to 39.1% in the south west and 40.8% for England. This table<br />
also shows the proportion of people who are unemployed as slightly<br />
higher than national and regional averages.<br />
Figure 18 (below, right) shows the wards of Shiphay with the Willows,<br />
Blatchcombe and Goodrington with Roselands have the highest<br />
proportions of people who are in full time employment. In contrast to<br />
this, Tormohun, Roundham with Hyde and Ellacombe have higher than<br />
average rates of unemployment 8 . In Tormohun and Roundham with<br />
Hyde just under 10% of the population is unemployed. Wards where<br />
there are higher levels of unemployment may not have the same<br />
requirement from childcare as those areas where there are higher<br />
proportions of people working full time.<br />
Female Economic Activity<br />
Within families women are more likely to be the main carers and tend to<br />
be the person who takes responsibility for childcare. It is important to<br />
consider the proportion of women who work within <strong>Torbay</strong> as this is an<br />
important factor in the demand for childcare. It is also crucial to<br />
consider the working patterns of women given that a higher proportion<br />
of women in the UK now return to work within a year of childbirth than<br />
in previous years, 76% in 2004 compared to 45% in 1988 9 .<br />
7 NOMIS, Annual Population Survey, numbers are people aged 16 and over, % is for<br />
those of working age, January 2006 to December 2006<br />
8 Census 2001, Office for National Statistics<br />
9 Equality Unit. Women and Work: Challenge and Opportunity February 2005<br />
17<br />
Part time employed 12.98% 13.23% 11.81%<br />
Full time employed<br />
Self employed<br />
Unemployed<br />
Berryhead with Furzeham<br />
Blatchcombe<br />
Churston with Galmpton<br />
Clifton with Maidenway<br />
Cockington with Chelston<br />
Ellacombe<br />
Goodrington with Roselands<br />
Preston<br />
Roundham with Hyde<br />
Shiphay with the Willows<br />
St Marychurch<br />
St Marys with Summercombe<br />
Tormohun<br />
Watcombe<br />
Wellswood<br />
<strong>Torbay</strong> South West England<br />
33.30% 39.08% 40.81%<br />
10.78% 10.08% 8.32%<br />
4.14% 2.57% 3.35%<br />
0% 20% 40% 60% 80% 100%<br />
Employed part time Self employed<br />
Employed full time<br />
Unemployed<br />
Figure 17<br />
Proportion Of Population By<br />
Type Of Employment<br />
Figure 18<br />
Economic Activity By Ward
Figure 19<br />
Female Economic Activity By Ward<br />
Ward<br />
% employed<br />
full time<br />
% employed<br />
part time<br />
% self<br />
employed<br />
%<br />
unemployed<br />
%<br />
looking after<br />
home/family<br />
Berryhead with Furzeham 21.8 20.4 6.1 3.2 10.2<br />
Blatchcombe 26.1 21.8 3.6 3.6 14.1<br />
Churston with Galmpton 19.1 21.5 6.0 2.0 9.4<br />
Clifton with Maidenway 26.5 23.9 3.9 2.7 11.2<br />
Cockington with Chelston 24.3 24.0 6.6 2.6 11.1<br />
Ellacombe 27.3 23.4 4.6 4.0 11.8<br />
Goodrington with Roselands 27.0 22.3 5.2 3.2 9.7<br />
Preston 24.8 19.7 5.9 1.6 9.6<br />
Roundham with Hyde 21.9 16.9 9.8 3.7 10.5<br />
Shiphay with the Willows 30.3 24.4 4.4 2.5 10.2<br />
St Marychurch 23.9 22.2 6.6 2.4 10.5<br />
St Marys with Summercombe 21.5 20.7 5.0 2.4 14.1<br />
Tormohun 25.6 20.2 8.1 3.8 10.8<br />
Watcombe 23.5 22.7 3.2 3.1 12.4<br />
Wellswood 22.3 13.8 9.9 3.3 10.0<br />
<strong>Torbay</strong> 24.5 21.3 6.0 2.9 12.0<br />
Figure 20<br />
Mean Gross Pay Comparison<br />
Annual pay £19,012 £22,072 £25,284<br />
Weekly pay<br />
% earning less than £250 per week<br />
<strong>Torbay</strong> South West England & Wales<br />
£336.10 £408.20 £456.50<br />
44.2% 31.4% 28.1%<br />
Source: Office for National Statistics<br />
Source: Census 2001, Office for National Statistics<br />
Across <strong>Torbay</strong> almost a quarter of women<br />
are employed full time (24.5%) compared<br />
to 30% in England. Just under one fifth<br />
(21.3%) work part time, compared to 23%<br />
in England 10 . The number of women who<br />
are looking after home / family is only<br />
slightly higher than the national average<br />
(12% in <strong>Torbay</strong> compared to 11.1% in<br />
England).<br />
4.0 ECONOMIC ACTIVITY<br />
Unsurprisingly, working age women who<br />
have dependent children are less likely to<br />
be economically active than those<br />
without dependent children. The age of the youngest child also appears<br />
to be a factor in the economic activity of mothers, those with children<br />
under 5 are less likely to be in employment than those with children<br />
aged 5 or over. It is also interesting to note that a smaller proportion of<br />
lone mothers are in the labour force than mothers who are married or<br />
co-habiting.<br />
Income<br />
Average earnings in <strong>Torbay</strong> are lower than national and regional<br />
averages. Figure 20 shows the mean gross pay for all employees. The<br />
average annual gross pay for people working in <strong>Torbay</strong> is 75% of the<br />
England and Wales figure, a higher proportion of the population in the<br />
bay are earning less than £250 a week.<br />
The gender breakdown for people in <strong>Torbay</strong> is more pronounced, with<br />
the male earners only earning 73% of the England and Wales figure.<br />
Female earners, however, earn around 91% of the national average<br />
(Figure 21).<br />
10 Census 2001, Office for National Statistics<br />
18
4.0 ECONOMIC ACTIVITY<br />
Average earnings in <strong>Torbay</strong> are lower than<br />
national and regional averages. The<br />
average annual gross pay for people<br />
working in <strong>Torbay</strong> is 75% of the England<br />
and Wales figure and a higher proportion of<br />
the population in <strong>Torbay</strong> are earning less<br />
than £250 per week<br />
Figure 21<br />
Gender Pay Difference<br />
Gender pay gap England & Wales South West <strong>Torbay</strong><br />
All £25,884 £22,072 £19,012<br />
Full time<br />
Part time<br />
Male<br />
Male full time<br />
Female<br />
Female full time<br />
19<br />
£30,463 £27,046 £23,888<br />
£10,241 £10,101 £9,786<br />
£32,119 £27,857 £23,604<br />
£34,284 £29,935 £25,318<br />
£18,145 £16,375 £16,571<br />
£24,286 £22,332 £22,865<br />
Source: ONS 2007 Annual Survey of Hours and Earnings<br />
Income Deprivation<br />
As discussed in chapter 3, <strong>Torbay</strong> has a number of areas which rank<br />
highly in terms of the deprivation indices. This is also the case for the<br />
income domain which is one of the seven indicators which make up the<br />
overall indices. As the map in Figure 22 shows, there are 38 SOAs<br />
across <strong>Torbay</strong> which rank in the 30% most deprived areas for income.<br />
These areas are based in the wards of Tormohun, Ellacombe, Watcombe,<br />
Blatchcombe, Roundham with Hyde and St Marys with Summercombe.<br />
This undoubtedly has a huge impact on the affordability of childcare in<br />
these locations.<br />
Take up of Tax Credits<br />
Data from HM Revenue and Customs on eligibility for tax credits<br />
can provide us with an indication of income levels. There<br />
are two forms of tax credits which families can be<br />
eligible for, Working Tax Credit and Child Tax Credit.<br />
This assessment needs to consider the number of<br />
childcare places which will be eligible for the childcare<br />
element of the Working Tax Credit.<br />
Child Tax Credit (CTC) provides support to families for the<br />
children (up to the 31st August after their 16th birthday) and the<br />
“qualifying” young people for which they are responsible. It is paid<br />
to families in addition to Child Benefit for families with incomes under<br />
the threshold of £55,000 for a family with two working parents.<br />
Working Tax Credit (WTC) is additional to CTC for families with children.<br />
It tops up the earnings of families on low or moderate incomes and<br />
includes an element equal to 80% of eligible childcare costs. A family’s<br />
entitlement to CTC and WTC depends on their income, in general,<br />
Top 10% in England (6)<br />
10% to 20% (10)<br />
20% to 30% (22)<br />
30% to 40% (21)<br />
40% to 50% (12)<br />
50% to 60% (9)<br />
Figure 22<br />
Rank Of Income<br />
Deprivation<br />
Ward boundary<br />
SOA boundary<br />
Source: Department for Communities<br />
and Local Government<br />
SOA Rank Of Income Deprivation<br />
60% to 70% (6)<br />
70% to 80% (2)<br />
80% to 100% (1)
households with a total net income of less than £13,910 a year will<br />
receive maximum tax credits, while families with incomes of up to<br />
£55,000 will receive some benefit.<br />
Of all the families with dependent children in 2005, 88% were claiming<br />
child tax credits 11 . Yet just under a third were families who are classified<br />
as in work and receiving both Working Tax Credits and Child Tax Credits.<br />
However, a small number of families who were classified as in work were<br />
benefiting from the childcare element of tax credits, the proportion of<br />
working families being 7%, whereas 21.5% of lone parents who were in<br />
work were benefiting from the childcare element of tax credits.<br />
In terms of children in families, 32% of children were in families who are<br />
in receipt of both Child Tax Credit and Working Tax Credit.<br />
Key Findings<br />
■ <strong>Torbay</strong> has a slightly higher unemployment rate compared to<br />
national and regional averages<br />
■ The wards of Tormohun in Torquay and Roundham with Hyde in<br />
Paignton have the highest rates of unemployment across <strong>Torbay</strong><br />
■ Almost a quarter of women in <strong>Torbay</strong> are employed full time and<br />
just under one fifth work part time<br />
■ Average earnings in <strong>Torbay</strong> are lower than national and regional<br />
averages, with 44% of people earning less than £250 a week<br />
■ 38 of the 89 super output areas (SOAs) in <strong>Torbay</strong> rank in the 30%<br />
most deprived nationally for income<br />
■ Of all families in <strong>Torbay</strong>, 88% were claiming Child Tax Credit and<br />
just under a third are receiving both Child Tax Credit and Working<br />
Tax Credit<br />
11 Child Tax Credit Statistics, August 2005 HM Revenue and Customs<br />
Figure 23<br />
Number Of Families Receiving A CTC And WTC Award - August 2005<br />
Ward<br />
CTC<br />
recipients<br />
All Families Lone Parents<br />
In work<br />
families –<br />
CTC & WTC<br />
recipients<br />
% benefiting<br />
from<br />
childcare<br />
element<br />
In work<br />
lone parents<br />
% benefiting<br />
from<br />
childcare<br />
element<br />
Berryhead with Furzeham 745 240 5.3 145 13.8<br />
Blatchcombe 1,365 440 5.5 220 22.7<br />
Churston with Galmpton 455 120 4.4 80 0<br />
Clifton with Maidenway 765 255 7.8 140 21.4<br />
Cockington with Chelston 1,100 305 9.1 200 22.5<br />
Ellacombe 915 310 7.7 185 24.3<br />
Goodrington with Roselands 675 225 6.7 120 20.1<br />
Preston 820 230 4.9 135 18.5<br />
Roundham with Hyde 675 255 8.1 130 30.1<br />
Shiphay with the Willows 1,060 310 9.0 200 27.5<br />
St Marychurch 1,050 345 6.7 200 25<br />
St Marys with Summercombe 735 220 5.4 100 15<br />
Tormohun 1,140 415 7.9 235 19.1<br />
Watcombe 895 310 5.6 140 17.9<br />
Wellswood 325 110 10.7 70 35.7<br />
<strong>Torbay</strong> 12,720 3,887 7.0 2,300 21.5<br />
■ Economic activity is clearly an important factor in assessing the<br />
demand for childcare. The number of women who work part time<br />
can provide an indication that some women may have changed their<br />
working patterns to look after / bring up children. What people earn<br />
has an impact on the affordability of childcare, which will be covered<br />
in subsequent chapters<br />
4.0 ECONOMIC ACTIVITY<br />
20
EARLY YEARS EDUCATION 5.0<br />
21<br />
This chapter takes into account the provision of the<br />
free early years education entitlement for all 3 and 4<br />
year olds. This free nursery education entitles each<br />
3 and 4 year old to five 2.5 hour sessions over a<br />
week, these sessions can be accessed in a number of<br />
different settings. The first part of the chapter will<br />
consider the supply of early years education and the<br />
second half of the chapter will take into account the<br />
demand for the free entitlement. Due to the fact<br />
that many private, voluntary and independent<br />
settings will be providing integrated care and<br />
education it is not so straight forward in terms of<br />
analysing the take up of this provision, therefore, the<br />
supply has been calculated on the basis of providers<br />
offering two sessions a day and the take up of places<br />
analysed in accordance with this.
Figure 24<br />
Number Of Providers By Type<br />
Figure 25<br />
Early Years Education Providers<br />
By Ward<br />
Berryhead with Furzeham<br />
Type of provider<br />
Day Nurseries<br />
Maintained Nurseries<br />
Pre-school / Playgroup<br />
Childminders<br />
Independent Schools<br />
Total<br />
Day Nursery Pre-school / Playgroup<br />
Independent<br />
Blatchcombe<br />
Churston with Galmpton<br />
Clifton with Maidenway<br />
Cockington with Chelston<br />
Ellacombe<br />
Goodrington with Roselands<br />
Preston<br />
Roundham with Hyde<br />
Shiphay with the Willows<br />
St Marychurch<br />
St Marys with Summercombe<br />
Tormohun<br />
Watcombe<br />
Wellswood<br />
No.<br />
17<br />
16<br />
13<br />
3<br />
67<br />
0 1 2 3 4 5 6 7 8 9 10<br />
Childminder<br />
Maintained Nursery<br />
18<br />
Supply<br />
Across <strong>Torbay</strong> a mix of statutory, private, voluntary and independent<br />
settings provide early years education for 3 and 4 year old children. In<br />
2007 there were 67 providers of this free entitlement, as can be seen in<br />
Figure 24.<br />
The types of provider offering early years education is not equally<br />
distributed across <strong>Torbay</strong>. In Brixham, for example, provision is only<br />
available through the maintained sector and pre-school settings.<br />
Provision in Ellacombe and Churston with Galmpton is only available<br />
through pre-school settings. Most other wards have a selection of three<br />
different types of providers as can be seen in Figure 25.<br />
Together these 67 settings provided a total of 2,740 sessions. Set<br />
against the population of children in this age group (2,690) this means<br />
there is a place available for every 3 and 4 year old in <strong>Torbay</strong>.<br />
Figure 26 (overleaf) shows the number of sessions which are available<br />
by ward against the number of children in those areas. In five of the 15<br />
wards there are more places available than there are children, the<br />
number of surplus places is particularly high in St. Marychurch, Shiphay<br />
with the Willows and Wellswood. In Ellacombe there are significantly<br />
more children aged 3 and 4 than places available, although it is worth<br />
noting that in close proximity to the Ellacombe ward boundary are a<br />
further two maintained settings.<br />
The number of places available by type of provider is fairly equal, with<br />
the obvious exception of childminders and independent schools. The<br />
reason being the number of children childminders can take is much<br />
smaller and for the case of the independent schools, there is a low<br />
number of providers, please see Figure 27 (overleaf).<br />
5.0 EARLY YEARS EDUCATION<br />
The types of<br />
provider offering<br />
early years<br />
education is not<br />
equally distributed<br />
across <strong>Torbay</strong><br />
22
5.0 EARLY YEARS EDUCATION<br />
Figure 26<br />
Places Available By Ward For 3 And 4 Year Olds<br />
Ward Number of providers<br />
Figure 27<br />
Places By Provider Type<br />
Type of provider<br />
Maintained Nurseries<br />
Pre-school / Playgroup<br />
Childminders<br />
Independent Schools<br />
Total<br />
23<br />
No.<br />
17<br />
16<br />
13<br />
3<br />
67<br />
Places available for<br />
3 & 4 year olds<br />
916<br />
744<br />
82<br />
256<br />
2,740<br />
Places available for<br />
3 & 4 year olds<br />
Figure 28<br />
Numbers Of Children Attending Early Years Education Places<br />
Type of provider<br />
Demand<br />
Whilst the take up of early years education places is voluntary, the take<br />
up of places in settings can provide some indication of the demand.<br />
The table in Figure 28 below shows the number of children attending<br />
sessions. It shows that 2,839 children in the Spring term 2007 attended<br />
nursery education sessions, therefore, this provides a good indication<br />
that the majority of children are taking at least one place. While the<br />
table shows that there is a higher number of children attending than<br />
places available for 2007, this can be explained by the fact that not all<br />
children will take all five sessions available to them. However, if we<br />
exclude the number of children in reception classes then take up is<br />
clearly much lower with only 1,680 children taking an education place.<br />
This suggests that there are more than enough places to meet the<br />
demand.<br />
Analysis of the headcount data for Spring terms of 2007 and 2006<br />
shows that children are accessing an average of 4.3 sessions a week.<br />
Figure 29 shows the average number of sessions attended by age and<br />
year.<br />
Day Nurseries 18 742 Private, Voluntary & Independent 1015 1079 3 year olds 4.2 4.3<br />
Maintained Nurseries<br />
Reception Classes<br />
Total<br />
Number of children<br />
aged 3 & 4 year<br />
Berryhead with Furzeham 2 104 175<br />
Blatchcombe 6 233 272<br />
Churston with Galmpton 2 92 87<br />
Clifton with Maidenway 3 114 155<br />
Cockington with Chelston 5 174 230<br />
Ellacombe 1 34 196<br />
Goodrington with Roselands 4 186 143<br />
Preston 3 166 229<br />
Roundham with Hyde 4 168 117<br />
Shiphay with the Willows 9 345 228<br />
St Marychurch 9 408 214<br />
St Marys with Summercombe 3 136 147<br />
Tormohun 7 219 226<br />
Watcombe 6 173 198<br />
Wellswood 3 188 73<br />
Total 67 2,740 2,690<br />
Spring Term 2006<br />
567<br />
1070<br />
2,652<br />
Spring Term 2007<br />
601<br />
1159<br />
2,839<br />
Source: Early Years Headcount and PLASC data, <strong>Torbay</strong> <strong>Council</strong><br />
Figure 29<br />
Average Number Of Sessions<br />
Attended<br />
4 year olds<br />
3 & 4 year olds<br />
Spring<br />
2007<br />
4.4<br />
4.3<br />
Spring<br />
2006<br />
4.5<br />
4.3<br />
Source: Early Years Headcount
In the PVI sector it is clear that the majority of children are accessing<br />
five sessions and in the Spring term 2007 just under two thirds (62%)<br />
of 3 year olds and three quarters (74%) of 4 year olds were accessing<br />
five sessions. This was very similar to the same period in 2006, as can<br />
be seen in Figure 30.<br />
The consultation showed that parents we spoke to were aware of the<br />
free entitlement and many were, or had, used the sessions available to<br />
them. Although one parent told us that efforts should be made to make<br />
parents aware of the free entitlements much earlier, perhaps when<br />
children are one instead of when they are three. Although this focus<br />
group acknowledged that some parents just won’t be reached and those<br />
who are pro-active will find the information anyway.<br />
Parents told us that the PVI sector is able to offer them more flexibility<br />
than the maintained sector. For one parent, a pre-school which only<br />
provided sessional care also posed a problem for arranging additional<br />
childcare.<br />
However, despite maintained settings being able to offer less flexibility<br />
for the parents, there is still a perception that if children go to the<br />
nursery in a school, there is a guaranteed place in that school when the<br />
child reaches statutory school age – for example, one parent said:<br />
“There is a perception that in a maintained nursery the child<br />
automatically gets a place at the school”.<br />
Providers and parents alike mentioned that the one point of entry into<br />
schools was having an impact. Both were keen to point out the negative<br />
impact and it is also clear also that some parents do not fully<br />
understand what is available to them and what they are entitled to.<br />
Through the consultation two providers also noted the differences in the<br />
way the maintained and PVI sector were funded and how, in their<br />
opinion, maintained settings had an unfair advantage.<br />
Figure 30<br />
Number Of Sessions Attended<br />
Sessions<br />
Five<br />
Four<br />
Three<br />
Two<br />
One<br />
“<br />
% of 3 yr olds in PVI settings<br />
Spring 2006 Spring 2007<br />
The early years education is very rigid in schools.<br />
It is more flexible with the nursery; at least you can<br />
pay for extra sessions if you want them.<br />
The nursery class in school is not flexible in the sessions it<br />
offers. This does not support working parents.<br />
Schools only offer mornings or afternoons. There<br />
is no flexibility. At the pre-school we can do extra<br />
and pay for it. At least by doing a full day at the<br />
pre school my son is getting prepared for going to<br />
school. Also, we can pick and choose our sessions;<br />
so long as they are available the pre-school are<br />
happy to accommodate.<br />
If you don’t work it is easier to take on the education<br />
sessions.<br />
My child has started a nursery class at school<br />
which is part-time. As I work it was difficult to<br />
arrange pick-ups and find a nursery where she<br />
could go for the rest of the day.<br />
13<br />
11<br />
10<br />
2<br />
15<br />
11<br />
10<br />
3<br />
% of 4 yr olds in PVI settings<br />
Spring 2006 Spring 2007<br />
64 62 75 74<br />
12<br />
7<br />
5<br />
2<br />
8<br />
9<br />
6<br />
3<br />
5.0 EARLY YEARS EDUCATION<br />
It is not possible to pay for extra time if my son is at a school<br />
nursery, i.e. lunches, additional care.<br />
My son was offered sessions at a pre-school but I<br />
needed to arrange childcare outside of the free<br />
sessions, so the pre-school was not ideal.<br />
I am very dissatisfied with the current part-time school entry<br />
for rising fives. As a full-time working parent I do not think<br />
the system is at all supportive and will put me under<br />
enormous pressure when my child starts school<br />
”<br />
next<br />
September. I will find it very difficult to find childcare parttime<br />
for that first month as I don’t have family I can rely on.<br />
24
5.0 EARLY YEARS EDUCATION<br />
“<br />
The September term is financially challenging for<br />
us because of the one intake into schools.<br />
(provider)<br />
The one point of entry (into schools) has been a major factor<br />
in some provisions closing and others struggling for<br />
sustainability.<br />
(provider)<br />
My pre-school is ideal because of its links to the<br />
school, although there is an issue with the number<br />
of places. There are not enough places to fulfil the<br />
need for 3 and 4 year olds. With one point of entry<br />
into school, places are kept open and so they get<br />
booked easily and quickly. I would really like my<br />
kids to do two full years at pre-school (some<br />
children do get this) but, because of the way my<br />
kids’ birthdays fall, they will only get a year. (parent)<br />
Day nurseries only have one intake per year due to schools<br />
only having one intake. I therefore have to pay from<br />
September even though I do not need it until January.<br />
(parent)<br />
25<br />
The one intake into schools is the problem because<br />
children are not moving to school throughout the<br />
year so there are not always places available in preschool<br />
when we need them.<br />
(parent)<br />
”<br />
I think availability of free sessions might be an issue for my<br />
daughter. I would like to get her placed in Easter, but there<br />
is not a place available until September.<br />
(parent)<br />
“The funding is geared up to support the schools.<br />
They can take children at 3, yet nurseries have to<br />
wait until the term after their third birthday.<br />
There is unfair competition from schools who receive their<br />
funding whether the place is filled or not. Schools can also<br />
have children before 3. Private nurseries receive the nursery<br />
education grant (NEG) after the child is 3, so nurseries<br />
really struggle and parents are bound to go for the cheaper<br />
option.<br />
Key Findings<br />
■ The 67 Providers of the free entitlement for 3 and 4 year olds offer<br />
a total of 2,740 places which is enough supply to ensure that every<br />
child can access a place<br />
■ We can safely assume that the majority of 3 and 4 year olds are<br />
accessing some of their free entitlement<br />
■ The majority of 3 and 4 year olds were accessing at least four<br />
sessions a week<br />
■ Many parents are aware of the free entitlement and how and where<br />
they can access it<br />
■ For parents, the PVI sector appears to be able to meet the needs of<br />
those who work because they can offer more flexibility and the<br />
ability to provide more ‘wrap around’ care compared to the<br />
maintained sector<br />
■ The one point of entry into schools appears to have had an impact<br />
on both providers in the PVI sector and parents. For parents it<br />
would seem that there is more competition / demand for places as<br />
children are only moving up to school once a year. Parents want to<br />
ensure that when their children will be entitled to their free<br />
sessions, they will get what they want, even if it means having to<br />
pay for an extra term
CHILDCARE<br />
SUPPLY<br />
This assessment is required to<br />
map the existing supply of<br />
childcare and must accurately<br />
measure the supply of all types<br />
of formal childcare and so far as<br />
possible informal (unregistered)<br />
provision. The assessment must<br />
take into account the following:<br />
■ Type of care available<br />
■ Opening hours<br />
■ Number of places offered<br />
■ Age groups catered for<br />
■ Costs and charges<br />
This chapter will focus on all of<br />
the above at local authority wide<br />
and also at the lower<br />
geographical level of<br />
administrative ward. The supply<br />
of provision covered in this<br />
chapter comprises full daycare<br />
and sessional care, childminders,<br />
out of school provision and<br />
crèches registered with Ofsted.<br />
Consultation with parents and<br />
carers showed that 70% relied<br />
on family and friends to provide<br />
childcare, this use of informal<br />
childcare will be covered in<br />
greater detail in chapter 7<br />
(<strong>Childcare</strong> Demand).<br />
6.0<br />
26
6.0 CHILDCARE SUPPLY<br />
Number Of <strong>Childcare</strong> Places<br />
At the time of writing this assessment (November 2007) there were 165<br />
registered providers in <strong>Torbay</strong>, providing a total of 2,825 places. The<br />
breakdown in different types of provision is shown in Figure 31.<br />
The supply of childcare can be measured by taking the number of<br />
registered places in any area and setting it against the resident<br />
population of children. The calculation for this is:<br />
Using this calculation we know that there are 12.9 registered childcare<br />
places per 100 children in <strong>Torbay</strong>.<br />
Compared to our statistical neighbours, <strong>Torbay</strong> has a lower than<br />
average number of childcare places per 100 children and also has the<br />
lowest number across our statistical neighbours 12 , please see Figure 32.<br />
Geographical Spread<br />
Across the bay there are varying levels of childcare provision and some<br />
quite interesting differences in the types of provision available to<br />
parents across wards, see Figure 33. The highest number of places<br />
available can be found in Torquay in the wards of St Marychurch (463)<br />
and Shiphay with the Willows (422). In comparison the wards with the<br />
lowest number of childcare places are Churston with Galmpton (64) in<br />
Brixham and Ellacombe (94) in central Torquay.<br />
Notable differences in the type of provision available can also be seen<br />
across wards. Wellswood, Ellacombe and Roundham with Hyde all have<br />
lower levels of places available with childminders. Clifton with<br />
Maidenway has no daycare places with nurseries but has the second<br />
highest number of places available for out of school childcare. In<br />
Brixham 90% of the places available are in daycare settings or with<br />
childminders, there is one out of school club in the town which provides<br />
a holiday club only and has 24 places.<br />
27<br />
Number of <strong>Childcare</strong> Places<br />
Resident child population<br />
x 100<br />
12 Ofsted Quarterly <strong>Childcare</strong> Statistics as at 30th September 2006 and Census 2001, ONS.<br />
Figure 31<br />
Places By Provider Type<br />
Type of provider<br />
Daycare (full day & sessional) 41<br />
Childminders<br />
Out of school (breakfast, after school & holiday)<br />
Crèches<br />
Total<br />
Number of<br />
providers<br />
97<br />
24<br />
3<br />
165<br />
Figure 32<br />
Statistical Neighbour Comparison <strong>Childcare</strong> Places<br />
Per 100 Children 0-14<br />
Places per 100 children<br />
25<br />
20<br />
15<br />
10<br />
5<br />
0<br />
Blackpool<br />
Average<br />
Bournemouth<br />
Cornwall<br />
Isle of Wight<br />
North<br />
Lincolnshire<br />
Plymouth<br />
Poole<br />
Portsmouth<br />
Southend<br />
Number of<br />
places<br />
1,617<br />
482<br />
665<br />
61<br />
2,825<br />
Telford &<br />
Wrekin<br />
<strong>Torbay</strong>
Figure 33<br />
Number of Registered <strong>Childcare</strong> Places By Type Of Provider And Ward<br />
Berryhead with Furzeham<br />
Daycare Places Childminders<br />
Out of School<br />
Blatchcombe<br />
Churston with Galmpton<br />
Clifton with Maidenway<br />
Cockington with Chelston<br />
Ellacombe<br />
Goodrington with Roselands<br />
Preston<br />
Roundham with Hyde<br />
Shiphay with the Willows<br />
St Marychurch<br />
St Marys with Summercombe<br />
Tormohun<br />
Watcombe<br />
Wellswood<br />
0 50 100 150 200 250 300 350 400 450 500<br />
Crèches<br />
Figure 34<br />
<strong>Childcare</strong> Places Per<br />
100 Children By Ward<br />
<strong>Childcare</strong> places per 100 children<br />
Between 20 and 30 (2)<br />
Between 10 and 20 (6)<br />
Less than 10 (7)<br />
6.0 CHILDCARE SUPPLY<br />
While Figure 33 shows the volume of childcare places available by type<br />
and ward, a more accurate picture can be obtained by considering the<br />
number of registered places against the resident population of<br />
children aged 0 to 14 (and up to 17 for disabled children).<br />
It is clear from Figure 34 that Shiphay with the Willows and<br />
St Marychurch have the highest number of childcare places available<br />
per 100 children, the number of places available is significantly<br />
higher than the average across <strong>Torbay</strong> (13 places per 100 children).<br />
The wards of Ellacombe, Preston and Cockington with Chelston<br />
have the lowest number of places per 100 children.<br />
The charts in Figures 35, 36 and 37 show the number of<br />
childcare places per 100 children broken down into type<br />
of childcare across wards, excluding crèche provision, as<br />
Ward<br />
Number of<br />
places<br />
Berryhead with Furzeham 127<br />
Blatchcombe 271<br />
Churston with Galmpton 64<br />
Clifton with Maidenway 183<br />
Cockington with Chelston 162<br />
Ellacombe 94<br />
Goodrington with Roselands 167<br />
Preston 106<br />
Roundham with Hyde 148<br />
Shiphay with the Willows 422<br />
St Marychurch 463<br />
St Marys with Summercombe 103<br />
Tormohun 274<br />
Watcombe 139<br />
Wellswood 102<br />
Total 2,825<br />
Places per<br />
100 children<br />
8.5<br />
12.1<br />
7.7<br />
15.2<br />
7.9<br />
6.4<br />
14.4<br />
7.1<br />
15.1<br />
26.0<br />
25.1<br />
7.8<br />
15.2<br />
8.7<br />
15.2<br />
13.0<br />
28
6.0 CHILDCARE SUPPLY<br />
the numbers of providers are so low. The graphs below show quite<br />
clearly the wards where the number of places per 100 are higher and<br />
lower than the average across <strong>Torbay</strong>. For daycare noticeably, Shiphay<br />
with the Willows, St Marychurch, Roundham with Hyde and Wellswood<br />
have higher numbers of places per 100 children than the average across<br />
the bay, whereas Clifton with Maidenway, Ellacombe and Cockington<br />
with Chelston have much lower number of places per 100 children than<br />
the average.<br />
In terms of places with childminders (Figure 36), again Shiphay with the<br />
Figure 35<br />
Places Per 100 Children By Ward: Daycare<br />
20<br />
18<br />
16<br />
14<br />
12<br />
10<br />
8<br />
6<br />
4<br />
2<br />
0<br />
29<br />
Berryhead<br />
with Furzeham<br />
Blatchcombe<br />
Churston with Galmpton<br />
<strong>Torbay</strong> Average<br />
Clifton with Maidenway<br />
Cockington with<br />
Chelston<br />
Ellacombe<br />
Goodrington with<br />
Roselands<br />
Preston<br />
Roundham with Hyde<br />
Shiphay with the Willows<br />
St Marychurch<br />
St Marys with<br />
Summercombe<br />
Tormohun<br />
Watcombe<br />
Wellswood<br />
Willows is one of the areas with the<br />
highest number of places per 100<br />
children, but also Clifton with<br />
Maidenway and St Marys with<br />
Summercombe have a high proportion<br />
of places compared to the <strong>Torbay</strong><br />
average. Among the lowest<br />
proportion of places with childminders<br />
is Ellacombe, Roundham with Hyde<br />
and Wellswood.<br />
Figure 36<br />
Places Per 100 Children By Ward: Childminders<br />
4.5<br />
4<br />
3.5<br />
3<br />
2.5<br />
2<br />
1.5<br />
1<br />
0.5<br />
0<br />
Berryhead<br />
with Furzeham<br />
Blatchcombe<br />
Churston with Galmpton<br />
<strong>Torbay</strong> Average<br />
Clifton with Maidenway<br />
Cockington with<br />
Chelston<br />
Ellacombe<br />
Goodrington with<br />
Roselands<br />
Preston<br />
Roundham with Hyde<br />
Shiphay with the Willows<br />
St Marychurch<br />
St Marys with<br />
Summercombe<br />
Tormohun<br />
Watcombe<br />
Wellswood<br />
Across the bay<br />
there are varying<br />
levels of childcare<br />
provision and some<br />
quite interesting<br />
differences in the<br />
types of provision<br />
available to parents
With regards to childcare available out of school, Figure 37 clearly<br />
shows that Clifton with Maidenway and St Marychurch have the highest<br />
number of places available per 100 children (8.7 and 7.2 respectively),<br />
which is higher than the average across <strong>Torbay</strong> of 3.1. In comparison,<br />
eight out of the 15 wards in <strong>Torbay</strong> have lower than average numbers of<br />
registered places per 100 children. Churston with Galmpton, Preston and<br />
St Marys with Summercombe do not have any registered places for out<br />
of school care.<br />
Figure 37<br />
Places Per 100 Children By Ward: Out of School Clubs<br />
10<br />
9<br />
8<br />
7<br />
6<br />
5<br />
4<br />
3<br />
2<br />
1<br />
0<br />
Berryhead<br />
with Furzeham<br />
Blatchcombe<br />
Churston with Galmpton<br />
<strong>Torbay</strong> Average<br />
Clifton with Maidenway<br />
Cockington with<br />
Chelston<br />
Ellacombe<br />
Goodrington with<br />
Roselands<br />
Preston<br />
Roundham with Hyde<br />
Shiphay with the Willows<br />
St Marychurch<br />
St Marys with<br />
Summercombe<br />
Tormohun<br />
Watcombe<br />
Wellswood<br />
Daycare for Pre-school Children<br />
The majority of settings in <strong>Torbay</strong> which provide care for children under<br />
the age of 5 are registered for full daycare, only two settings who are<br />
registered as sessional provide care for less than four hours a day.<br />
Settings who provide full day care for children under 5 include day<br />
nurseries, childminders, independent schools and preschools.<br />
Across <strong>Torbay</strong> there were 1,801 registered full daycare places for<br />
children under 5. This is across 22 day nurseries (1,063 places), 16<br />
playgroups (356 places), three independent schools (158 places), and 96<br />
childminders (224 places). The total population of children in <strong>Torbay</strong><br />
aged under 5 is 6,275. Therefore, 28.7 childcare places per 100 children<br />
under 5 which works out as just over one place for every four children.<br />
However, this is not equally distributed across the wards as can<br />
be seen in Figure 38.<br />
Figure 38 shows that three out of 15 wards have more<br />
than 40 places per 100 children under 5 (Shiphay with<br />
the Willows – 64, St Marychurch – 56.1 and Roundham with<br />
Hyde – 43.3). There are a further three wards where the<br />
number of places per 100 children is lower than the average<br />
across the bay. These areas are Clifton with Maidenway (seven<br />
places), Cockington with Chelston (15.8 places) and Ellacombe (four<br />
places).<br />
Levels of daycare for children under 5 vary across the bay by type, for<br />
example in Wellswood a significant amount of childcare is provided by<br />
the independent sector (provided by a single sex school). In Clifton with<br />
Maidenway all of the childcare is available through childminders. In<br />
Shiphay with the Willows the vast majority of childcare is provided by<br />
day nurseries.<br />
While nine out of the 15 wards have at least three different types of<br />
provision available, in some areas the types of provider are not equally<br />
distributed. For example, in Roundham with Hyde there is a high<br />
proportion of childcare provided by day nurseries and in Wellswood<br />
childcare provision is primarily available through the independent<br />
sector. A third of wards in the bay have two types of provision, again<br />
6.0 CHILDCARE SUPPLY<br />
Figure 38<br />
Daycare Places Per<br />
100 Children Under<br />
5 By Ward<br />
<strong>Childcare</strong> Places Per 100 Children<br />
Under Five<br />
52 to 64 (2)<br />
40 to 51.9 (1)<br />
28 to 39.9 (4)<br />
16 to 27.9 (5)<br />
4 to 15.9 (3)<br />
30
6.0 CHILDCARE SUPPLY<br />
31<br />
Figure 39<br />
Daycare Places Per 100 Children Under 5 by Ward and Type<br />
Berryhead with Furzeham<br />
Blatchcombe<br />
Churston with Galmpton<br />
Clifton with Maidenway<br />
Cockington with Chelston<br />
Ellacombe<br />
Goodrington with Roselands<br />
Day Nurseries Playgroups<br />
Independent Schools<br />
Preston<br />
Roundham with Hyde<br />
Shiphay with the Willows<br />
St Marychurch<br />
St Marys with Summercombe<br />
Tormohun<br />
Watcombe<br />
Wellswood<br />
0 10 20 30 40 50 60 70<br />
Childminders<br />
the types are not equally distributed, for example, in Preston childcare<br />
is primarily available through playgroups / pre-schools. Only<br />
St Marychurch offers a variety of all types of childcare. The type of<br />
childcare available in different areas is important in being able to<br />
provide parents with what they need, offering a choice between day<br />
care and home based settings, as well as flexibility, which parents may<br />
require due to their own working hours.<br />
Daycare for Children Under 2 Years Old<br />
This assessment is required to take into account the availability of<br />
childcare places for children under the age of 2. While this is easy to<br />
assess for day care settings as their registration is broken down into<br />
children under 2, it is not so easy to assess for childminders as their<br />
registration categories are for children under 1 and then children aged<br />
between 1 and 5. Therefore, when calculating the number of very young<br />
children childminders can take, this assessment will only take into<br />
consideration the number of children they are registered to take under<br />
the age of 1.<br />
Geographically, all wards offer childcare for children under 2, although<br />
in some wards this is very limited, for example, Ellacombe, Wellswood<br />
and Preston. The patterns of where this childcare is available is largely<br />
similar to overall pattern of childcare across the bay, with Shiphay with<br />
the Willows and St Marychurch being the wards with the highest number<br />
of places available. Six of the wards only have childcare available for<br />
under 2s with childminders, so the numbers are very limited, see Figure<br />
40.<br />
In terms of places available per 100 children under 2 the average across<br />
the bay is 10.7 and, unsurprisingly, Shiphay with the Willows and<br />
St Marychurch have higher than average places available per 100<br />
children (39.7 and 19.6 respectively). However, when considering places<br />
available in proportion to the actual population, the following wards also<br />
record higher than average places available:<br />
■ Roundham with Hyde (18.1)<br />
■ Goodrington with Roselands (16.7)<br />
■ Tormohun (12.1)
Tormohun and Roundham with Hyde are two wards which cover the<br />
town centre areas of Torquay and Paignton respectively. Shiphay with<br />
the Willows covers the major travel route into Torquay and includes<br />
large housing developments and one of <strong>Torbay</strong>’s biggest employers,<br />
<strong>Torbay</strong> Hospital. Therefore, it is not surprising to find that these are the<br />
areas which offer more childcare places for children under the age of 2.<br />
At the time of writing this assessment there were some vacancies<br />
available for children under the age of 2. Two thirds of the providers<br />
who offer care for children in this age group had occupancy rates under<br />
80%, this is further explored in chapter 7, <strong>Childcare</strong> Demand.<br />
Out of School Care<br />
Out of school childcare is defined as care that is provided before school,<br />
after school and during the school holidays. In most cases this is<br />
available for children aged 4 and over, although only providers who<br />
offer care for children under the age of 8 are able to register. Providers<br />
offering care for children over the age of 8 are able to go on the<br />
Voluntary <strong>Childcare</strong> Register so that parents are able to use their tax<br />
credits towards the cost of this care. In addition to formal out of school<br />
care, there are a number of agencies who provide activities for children<br />
and young people throughout the holidays, especially in the summer<br />
holidays. This could be considered informal childcare if it allows the<br />
parent to work, but as this is not registered it is difficult to quantify the<br />
number of places which are available through these activities, examples<br />
of this in the bay are:<br />
■ <strong>Torbay</strong> Sports Programme<br />
■ Adventure Play in the Bay<br />
■ Youth Service<br />
■ Paignton Zoo and Living Coasts<br />
■ Football Courses<br />
■ Faith Groups<br />
Figure 40<br />
Number Of Providers Who Offer Care For Children Under 2 And Number of Places<br />
Ward<br />
Day<br />
Nurseries<br />
Number of providers Number of places<br />
Childminders Independent<br />
Schools<br />
6.0 CHILDCARE SUPPLY<br />
There are a total of 24 providers (not including childminders) offering<br />
some kind of out of school care across <strong>Torbay</strong>. These 24 providers<br />
generate a total of 689 places, set against the population of children<br />
and young people, there are 3.2 out of school places per 100 children<br />
aged 0 to 14. This calculation is based on children 0 to 14 as some of<br />
the providers do offer out of school in the holidays for children under 4<br />
years old. It is also important to note that this number is likely to<br />
change as two settings are likely to close in the near future, if this does<br />
happen it would bring the number of places available down to 2.9 per<br />
Total<br />
places<br />
Places per<br />
100 children<br />
Berryhead with Furzeham 1 9 0 18 7.9<br />
Blatchcombe 2 8 0 33 8.1<br />
Churston with Galmpton 0 3 0 4 3.7<br />
Clifton with Maidenway 0 8 0 9 4.9<br />
Cockington with Chelston 0 5 0 5 1.4<br />
Ellacombe 0 1 0 1 0.4<br />
Goodrington with Roselands 2 2 0 28 16.7<br />
Preston 0 6 0 6 2.4<br />
Roundham with Hyde 2 1 0 32 18.1<br />
Shiphay with the Willows* 4 11 0 121 39.7<br />
St Marychurch 3 12 1 54 19.6<br />
St Marys with Summercombe 1 10 0 20 9.8<br />
Tormohun 3 3 0 39 12.1<br />
Watcombe 1 3 0 15 6.0<br />
Registered out of school childcare in <strong>Torbay</strong> is primarily provided through<br />
Wellswood 0 1 0 1 0.9<br />
schools, a small number are run by the private or voluntary sector and one<br />
setting is run by the local authority. The majority of childminders (89%) in<br />
Total 19 83 1 386 10.7<br />
<strong>Torbay</strong> are registered to take children over the age of 5. * a new provider is due to open in January 2008<br />
32
6.0 CHILDCARE SUPPLY<br />
Figure 41<br />
Number Of Places For Children Under 2 By Ward And Type Of Provider<br />
Berryhead with Furzeham<br />
33<br />
Blatchcombe<br />
Churston with Galmpton<br />
Clifton with Maidenway<br />
Cockington with Chelston<br />
Ellacombe<br />
Goodrington with Roselands<br />
Preston<br />
Roundham with Hyde<br />
Shiphay with the Willows<br />
St Marychurch<br />
St Marys with Summercombe<br />
Tormohun<br />
Watcombe<br />
Wellswood<br />
0 20 40 60 80 100 120 150<br />
Day Nurseries Childminders Independent Schools<br />
13 Ofsted Quarterly <strong>Childcare</strong> Statistics<br />
as at 30th September 2006<br />
Figure 42<br />
Out Of School Places Statistical Neighbour Comparison<br />
Places per 100 children<br />
9.0<br />
8.0<br />
7.0<br />
6.0<br />
5.0<br />
4.0<br />
3.0<br />
2.0<br />
1.0<br />
0.0<br />
Blackpool<br />
Bournemouth<br />
Cornwall<br />
Isle of Wight<br />
North<br />
Lincolnshire<br />
100 children. This is lower than the average across England which is 5.8<br />
places per 100 children 13 .<br />
As the number of places available per 100 children appears to be quite<br />
low, Figure 42 shows a comparison of the number of places across<br />
<strong>Torbay</strong>’s statistical neighbours. The graph clearly indicates that<br />
compared to similar authorities the number of places <strong>Torbay</strong> offers is<br />
just below the average for all the authorities.<br />
Plymouth<br />
Poole<br />
Portsmouth<br />
Southend<br />
Telford &<br />
Wrekin<br />
Average Source: Ofsted Quarterly <strong>Childcare</strong> Statistics as at 30th September 2006<br />
<strong>Torbay</strong>
Figure 43<br />
Out Of School Places In Term Time<br />
(Before/After School) Per 100 Children<br />
Term Time Places (Before/After<br />
School) Per 100 Children<br />
9.1 to 12 (1)<br />
5.6 to 9 (1)<br />
3.1 to 5.5 (4)<br />
0.1 to 3 (9)<br />
Figure 44<br />
Out Of School Places During School<br />
Holidays Per 100 Children<br />
Holiday Places<br />
Per 100 Children<br />
6.1 to 9 (1)<br />
3.01 to 6 (5)<br />
0 to 3 (9)<br />
6.0 CHILDCARE SUPPLY<br />
If we include the number of registered places with childminders then<br />
the number of out of school places per 100 children increases, but only<br />
slightly to 4.3.<br />
The maps in Figures 43 and 44 show the distribution of places for term<br />
time and holiday childcare including the number of registered places<br />
with childminders for children over the age of 5.<br />
While the distribution of places available for term time and holiday<br />
childcare are fairly similar to one another, the distribution of out of<br />
school care does not follow the same overall pattern of childcare supply.<br />
Noticeably in the case of out of school care, Clifton with Maidenway has<br />
the highest number of places per 100 children with 11.5 places for before<br />
and after school and nine places for holiday care (per 100 children).<br />
The table in Figure 45 shows the number of places by ward compared to<br />
the average across the bay. The area with the lowest number of places<br />
across both types of registered out of school provision is Preston, in<br />
terms of holiday care, Wellswood and Tormohun have low numbers, 0.4<br />
and 0.5 places per 100 children respectively.<br />
The number of places available in Shiphay with the Willows is higher<br />
than the average across both types of care. In St Marychurch (which<br />
has high numbers of childcare overall) there are higher than average<br />
numbers of holiday out of school care (5.9) but slightly lower than<br />
average numbers of before and after school care (2.8).<br />
Holiday Care<br />
In <strong>Torbay</strong> there are 14 providers registered with Ofsted to provide<br />
holiday care. Of these, six are out of school providers, five are daycare<br />
providers (mainly nurseries who are also registered for full day care)<br />
and three holiday schemes are run by schools. The majority are open<br />
between the hours of 8.30am and 5.30pm, with three open until<br />
6.00pm. The majority also provide over all the school holidays, with the<br />
Christmas break being the one holiday which is less well catered for.<br />
Before and After School Care<br />
For out of school care in term time, there are 20 providers registered<br />
with Ofsted to provide care either before or after school. Of these, 11<br />
34
6.0 CHILDCARE SUPPLY<br />
are run through schools, five are run through out of school providers<br />
and four are run through daycare providers (mainly nurseries who are<br />
also registered for full day care). It is quite likely that over the course of<br />
the next couple of years there will be growth in this area. With the<br />
development of extended services, schools may well develop their own<br />
services or build partnerships with existing childcare providers.<br />
Breakfast clubs open from 7.15am, with the majority opening between<br />
7.45am and 8.00am. After school clubs tend to open from 3.00pm and<br />
close at between 5.30pm and 6.00pm, with one provider staying open<br />
until 6.30pm.<br />
Two providers are able to pick up and drop off children, and can collect<br />
from a significant number of schools in Torquay and Paignton. One<br />
additional provider in Torquay told us they are currently able to pick up<br />
children from one school for their after school club, if they are able to<br />
purchase a minibus they could expand this facility.<br />
Opening Times<br />
The opening times of providers varies depending on the type of<br />
provision being offered, many day nurseries will open between 8.00am<br />
and 6.00pm, with a small number opening from 7.30am (Figure 46).<br />
Pre-school settings or playgroups tend to open between 9.00am and<br />
3.30pm, whereas childminders appear to be able to offer the most<br />
flexible provision.<br />
Figure 47 shows that while half of childminders in our sample provide<br />
care between the hours of 8.00am and 6.00pm, 11% offer care 24 hours<br />
a day if required. Just over one third (36%) offer care between the<br />
hours of 7.00am and 7.00pm and 8.3% are offering care between the<br />
hours of 6.00am and 6.00pm.<br />
Of the childminders in our sample, 12 were able to offer parents<br />
overnight care if they required it, with a further two in the process of<br />
applying for this and an additional one being able to provide overnight<br />
care for children aged over 8. Just under half of the sample (42%)<br />
were able to provide care at the weekends, of these, six said they only<br />
provide additional care on Saturdays.<br />
35<br />
Figure 45<br />
Out Of School Places Per 100 Children By Ward<br />
Ward<br />
Term time<br />
places per<br />
100 children<br />
Berryhead with Furzeham 1.4<br />
Blatchcombe 3.2<br />
Churston with Galmpton 1.2<br />
Clifton with Maidenway 11.5<br />
Cockington with Chelston 2.8<br />
Ellacombe 3.9<br />
Goodrington with Roselands 4.4<br />
Preston 0.9<br />
Roundham with Hyde 1.1<br />
Shiphay with the Willows 6.0<br />
St Marychurch 2.8<br />
St Marys with Summercombe 2.2<br />
Tormohun 3.6<br />
Watcombe 2.4<br />
Wellswood 2.8<br />
Average 3.4<br />
Holiday care<br />
places per<br />
100 children<br />
3.0<br />
1.0<br />
1.2<br />
9.0<br />
2.8<br />
3.4<br />
4.4<br />
0.9<br />
1.1<br />
4.5<br />
5.9<br />
2.2<br />
0.5<br />
2.4<br />
0.4<br />
2.9<br />
Figure 46<br />
Day Care Opening Hours<br />
Between the hours of %<br />
7.00am to 6.00pm 5.1<br />
7.30am to 6.00pm 15.4<br />
8.00am to 4.00pm 2.6<br />
8.00am to 6.00pm 25.6<br />
8.30am to 3.30pm 30.8<br />
8.30am to 5.30pm 12.8<br />
9.00am to 1.00pm 7.7<br />
Figure 47<br />
Childminder Opening Hours<br />
Between the hours of %<br />
6.00am to 6.00pm 8.3<br />
7.00am to 7.00pm 36<br />
7.00am to 8.00pm 2.8<br />
7.30am to 6.30pm 16<br />
8.00am to 6.00pm 50<br />
Flexible 2.8<br />
24 hour care available 11
<strong>Childcare</strong> for Disabled Children<br />
Provision for disabled children is provided by mainstream childcare<br />
settings and through a couple of specialist services who provide<br />
childcare only for children with a disability or SEN. One of these<br />
providers only takes children on a referral basis from other agencies.<br />
Our survey of childcare providers showed that the majority of providers<br />
had taken children in the past with a disability or SEN and many had<br />
children attending the setting at the time of interviews. Disabilities /<br />
SEN and additional needs among the children ranged from difficulties<br />
with language and communication to blindness and from Autism to<br />
Cerebral Palsy. Providers also access additional support to ensure that<br />
they are providing the best possible care for the children. This ranges<br />
from regular visits from a speech and language therapist to one to one<br />
support for a particular child from the Early Years Inclusion Team.<br />
Additional support for settings also comes in the form of funding to<br />
help them with staffing costs, although some identified that this could<br />
be better as the minimum wage is not enough to recruit the quality of<br />
support staff needed to support the children.<br />
<strong>Childcare</strong> Costs<br />
<strong>Childcare</strong> providers in <strong>Torbay</strong> have a range of charging structures<br />
(hourly / half day / full day) and charge according to the service they<br />
provide, e.g. different age groups. To gain a broad perspective of fees,<br />
information provided on pricing has been calculated to give an average<br />
for each setting by the number of hours they provide childcare. It is<br />
important to note that not all settings wished to share information on<br />
their pricing structures, so they have not been included in this analysis.<br />
There was a wide range of costs for childcare with the lowest rate<br />
equating to £1.35 per hour to the highest equating to £4.15. The<br />
average hourly amount that parents paid for childcare in 2007 was<br />
£2.87. On average, independent schools provide the most expensive<br />
provision at an average of £3.92 an hour. In contrast, out of school<br />
childcare is the cheapest at an average of £1.79 an hour (see Figure 48).<br />
It is important to note however that out of school childcare will be<br />
cheaper than childcare for children under the age of 5 because the staff<br />
ratios are lower so an out of school provider will not necessarily incur<br />
the same staffing costs as a day nursery for example.<br />
As well as the difference in cost between different types of provider,<br />
childcare settings will also have a range of pricing structures which<br />
differentiate between age groups and times of use. For example, day<br />
nurseries will charge on average £2.70 per hour for children aged under<br />
2, compared to an average hourly rate of £2.18 for children aged<br />
between 3 and 5.<br />
The average hourly cost of childcare also appears to differ depending<br />
on the location of the provider, although the difference is not<br />
significant. Costs range from £2.24 in Cockington with Chelston to<br />
£3.45 in Churston with Galmpton.<br />
Compared against the Indices of Deprivation, and in particular the<br />
income deprivation domain (Figure 22 in chapter 4), it does not<br />
necessarily follow that areas with the lowest childcare costs have the<br />
lower incomes and those with the higher childcare costs have the higher<br />
incomes. For example, areas ranking high for income deprivation such<br />
as Roundham with Hyde, Watcombe and Blatchcombe appear to have<br />
some of the highest childcare costs.<br />
Figure 48<br />
Costs Of <strong>Childcare</strong> By Type Aggregated To An Hourly Rate<br />
£4.50<br />
£4.00<br />
£3.50<br />
£3.00<br />
£2.50<br />
£2.00<br />
£1.50<br />
£1.00<br />
£0.50<br />
£0.00<br />
Pre-schools/<br />
Playgroups<br />
Private Day<br />
Nurseries<br />
Childminders<br />
Independent<br />
Schools<br />
Out of School<br />
Clubs<br />
6.0 CHILDCARE SUPPLY<br />
36
6.0 CHILDCARE SUPPLY<br />
Comparisons with national and regional averages (Figure 50) show that<br />
<strong>Torbay</strong> on average has lower than average childcare costs (with the<br />
exception of childminders) with charges for out of school care being<br />
significantly lower.<br />
Key Findings<br />
■ Across all types of provision (excluding maintained nurseries)<br />
there are a total of 2,825 registered childcare places<br />
available for children aged 0 to 14 and up to 17 for disabled<br />
children<br />
■ This means there are 12.9 registered places per<br />
100 children in <strong>Torbay</strong>. Compared to our<br />
statistical neighbours, <strong>Torbay</strong> is below<br />
average and has one of the lowest rates<br />
■ Geographically, Shiphay with the Willows and<br />
St Marychurch have the highest numbers of<br />
childcare places per 100 children<br />
■ Ellacombe, Cockington with Chelston and Preston have<br />
the lowest level of places available per 100 children<br />
■ For children aged under 5, Shiphay with the Willows, St Marychurch<br />
and Roundham with Hyde have the highest numbers of registered<br />
childcare places<br />
■ The type of provision available for children under the age of 5 is not<br />
always equally distributed across <strong>Torbay</strong>. A third of the wards only<br />
have two types of provision, for example, provision in Ellacombe is<br />
made up by a playgroup and childminders<br />
■ For children aged under 2 there are 10.7 registered places per 100<br />
children across <strong>Torbay</strong>. Shiphay with the Willows and St Marychurch<br />
have the highest number of places available<br />
37<br />
Figure 49<br />
Average Hourly Cost Of<br />
<strong>Childcare</strong> By<br />
Ward<br />
Average Hourly Cost<br />
£3.26 to £3.50 (2)<br />
£3.01 to £3.25 (5)<br />
£2.76 to £3.00 (2)<br />
£2.51 to £2.75 (4)<br />
£2.00 to £2.50 (2)<br />
Figure 50<br />
Average <strong>Childcare</strong> Costs National And Regional Comparisons (2007) 14<br />
Nursery<br />
under 2<br />
<strong>Torbay</strong> £135 .90<br />
South West £154 .00<br />
England £152 .00<br />
Nursery<br />
2 & over<br />
£114 .80<br />
£141 .00<br />
£140 .00<br />
Nursery<br />
highest<br />
Cost<br />
£159 .80<br />
£322 .00<br />
£375 .00<br />
Childminder<br />
Under 2<br />
£148 .00<br />
£139 .00<br />
Childminder<br />
2 & over<br />
£173 .90*<br />
£148 .00<br />
£139 .00<br />
Childminder<br />
highest<br />
cost<br />
£225 .80<br />
£250 .00<br />
£400 .00<br />
Out of<br />
school<br />
care<br />
£26 .85<br />
£36 .00<br />
£36 .00<br />
■ In some areas the availability of places for children under 2 is<br />
limited and only provided through childminders<br />
Out of<br />
school<br />
highest<br />
Cost<br />
£45 .00<br />
£85 .00<br />
£218 .00<br />
Based on 50 hours a week in a nursery and childminder and 15 hours a week for out of school childcare.<br />
*Data on childminder costs in <strong>Torbay</strong> was not collected by age groups<br />
■ There are 24 registered out of school childcare providers in <strong>Torbay</strong><br />
which generate a total of 3.2 places per 100 children<br />
■ Geographically the areas with the highest number of out of school<br />
places available are Clifton with Maidenway, Goodrington with<br />
Roselands and Ellacombe<br />
■ Childminders appear to offer the best flexibility in providing care<br />
outside of normal working hours, with 11% being able to provide care<br />
24 hours a day if required<br />
■ All providers told us that they are able to take children with disabilities,<br />
special educational or additional needs. However, they acknowledged<br />
that they did require extra support but were happy to ask for this<br />
■ The average hourly rate parents paid for childcare in 2007 was<br />
£2.87, although charges vary from types of provider to the age of<br />
the child attending<br />
■ It does not follow that areas with the lowest childcare costs have the<br />
lowest incomes<br />
14 Daycare Trust Annual <strong>Childcare</strong> Cost Survey January 2007
7.0<br />
CHILDCARE DEMAND<br />
To establish sufficiency, an assessment must be undertaken<br />
of the demand for childcare by parents that will enable<br />
them to remain in, return to, or enter into work. There are<br />
two ways in which this assessment can establish the level of<br />
demand for childcare.<br />
Firstly, an indication of demand can be made by considering<br />
the level of occupancy and vacancies in settings, by type<br />
and by area. Where there is a low level of occupancy, there<br />
could be low demand for places. Alternatively, providers<br />
who have higher levels of occupancy, especially those with<br />
less than 20% spare capacity, might find it difficult to take<br />
on any more children. Within an open market, this could<br />
indicate high demand, some unmet demand and / or<br />
sufficient provision.<br />
Secondly, consultation conducted with parents, employers,<br />
children and even providers themselves gives us an insight<br />
into the demand for childcare. This also highlights any<br />
issues and perceptions that impact on demand for childcare<br />
and which will be considered in the gap analysis.<br />
38
7.0 CHILDCARE DEMAND<br />
Figure 51<br />
Rate Of Occupancy By Type Of Provider<br />
Figure 52<br />
Occupancy Rate by Ward<br />
%<br />
Type of provider<br />
Pre-school / Playgroup 59.7%<br />
Day Nursery (incl. Independent School Nurseries)<br />
Childminders<br />
Out of School Clubs<br />
90.0<br />
80.0<br />
70.0<br />
60.0<br />
50.0<br />
40.0<br />
30.0<br />
20.0<br />
10.0<br />
0.0<br />
39<br />
Berryhead<br />
with Furzeham<br />
Blatchcombe<br />
Churston with Galmpton<br />
<strong>Torbay</strong> Average<br />
Clifton with Maidenway<br />
Cockington with<br />
Chelston<br />
Ellacombe<br />
Goodrington with<br />
Roselands<br />
Preston<br />
Roundham with Hyde<br />
Shiphay with the Willows<br />
St Marychurch<br />
St Marys with<br />
Summercombe<br />
Rate of<br />
occupancy<br />
Tormohun<br />
53.2%<br />
92.3%<br />
62%<br />
Watcombe<br />
Wellswood<br />
Aggregated Occupancy<br />
Rates By Ward<br />
Higher than 80% (2)<br />
Between 65% and 80% (3)<br />
Between 45% and 65% (7)<br />
Less than 45% (3)<br />
Occupancy Analysis<br />
Information on the occupancy levels of settings were taken from the<br />
visits staff conducted with providers in September 2007. These rates<br />
only give a ‘snap shot in time’ and were also taken at the time<br />
of year which is generally accepted as the quietest for<br />
childcare providers. It is important to note that analysing and<br />
calculating these rates is not an exact science. Rates have been<br />
calculated from day care and out of school providers based on<br />
the number of sessions they can offer during the week and the<br />
total number of children they have in each of those sessions.<br />
For the sample of childminders, occupancy rates have been<br />
calculated from the number of part time and full time<br />
vacancies they have.<br />
Across <strong>Torbay</strong>, the average rate of occupancy for day<br />
care settings (pre-schools / playgroups / day nurseries<br />
and independent schools) was 56.6%. Figure 51 shows that<br />
childminders have higher rates of occupancy, although we need to bear<br />
in mind that childminders have a lower number of places available in<br />
total and this was only based on a sample of childminders in the bay.<br />
Of the providers surveyed, just over half (51%) had vacancy rates of<br />
20% or more, however, this is not a true picture of occupancy across all<br />
types of providers. Over two thirds (71%) of day care nurseries had<br />
vacancy rates of 20% or higher, compared to 90% of<br />
pre-schools and playgroups. Across the childminders<br />
surveyed, only 15% recorded vacancy rates of 20% or<br />
higher, whereas 80% of out of school clubs had high<br />
vacancy rates. In terms of out of school provision,<br />
breakfast clubs appeared to be less likely than after school<br />
or holiday clubs to have vacancies. Again, it is important to<br />
remember that this is only a snapshot of vacancies taken in September<br />
2007. This is usually considered to be the quietest period for providers,<br />
especially given the one point of entry into schools. Therefore, we<br />
would expect to see lower levels of occupancy at this time of year.<br />
Figure 52 shows the rate of occupancy for all settings aggregated to<br />
ward level. The table also shows the average rate of occupancy across
<strong>Torbay</strong> which is 57.3%. Six out of the 15 wards have occupancy rates<br />
lower than the average, but 12 wards have occupancy rates lower than<br />
80%. This suggests there are places available in these areas and<br />
possibly low demand, especially in areas such as Tormohun and<br />
Watcombe. In terms of deprivation, these areas rank in the top 20%<br />
most deprived nationally, and also rank in the top 20% most deprived<br />
for the income deprivation domain. The level of deprivation in these<br />
areas could possibly provide an explanation of why occupancy rates are<br />
lower in these wards than anywhere else.<br />
The areas of Goodrington with Roselands, Clifton with Maidenway and<br />
Churston with Galmpton have higher rates of occupancy (80% or<br />
higher). This could suggest that there is some unmet demand in these<br />
areas.<br />
Occupancy Rates by Age Group<br />
In considering occupancy rates by age, this assessment has only been<br />
able to take into account children under the age of 5, the reason for this<br />
being that a limited number of providers who offer care for children<br />
over the age 5 supplied the information on occupancy. The level of<br />
information provided does not allow for sufficient analysis to be<br />
undertaken which would provide any meaningful results.<br />
The average occupancy rate for children under the age of 2 across<br />
<strong>Torbay</strong> was 65.8%, although two thirds of the providers who offer care<br />
for children in this age group were over 80% occupied. Only 13% of the<br />
providers had occupancy rates of lower than 50% in this age group at<br />
the time of writing this assessment. Occupancy rates for places in this<br />
age group show no significant geographical trends.<br />
For children aged 2 to 5 the average occupancy rate across <strong>Torbay</strong> was<br />
58.8% and only 10% of providers reported occupancy rates of 80% or<br />
higher. Just under one third (32%) of providers had occupancy rates<br />
lower than 50% for children aged between 2 and 5. For this age group<br />
the majority of providers reporting an occupancy rate higher than 80%<br />
were based in Paignton.<br />
“<br />
There is quite a lot of<br />
demand for after school<br />
childcare and this is more<br />
popular at the moment.<br />
There seems to be a real demand<br />
for after school and early<br />
mornings, especially from<br />
7.30am.<br />
I can see that after school<br />
clubs in schools are<br />
becoming more popular at<br />
the moment, they can offer a<br />
little bit more flexibility in<br />
terms of the notice that<br />
parents can give if they don’t<br />
want their child to attend,<br />
usually now 24 hours.<br />
Parents need someone who can<br />
pick their children up after school.<br />
Figure 53<br />
Number of Enquiries by Type of Provider and Year<br />
Pre-schools<br />
Out of School Clubs<br />
Independent School Nurseries<br />
Maintained Nurseries<br />
Holiday Schemes<br />
Day Nurseries<br />
Crèches<br />
Childminders<br />
Figure 54<br />
Enquiries by Town: Aug 04 to Jul 07<br />
Town<br />
Torquay 3982<br />
Paignton<br />
Brixham<br />
0 200 400 600 800 1100 1200 1400 1600 1800 2000<br />
Aug 04 to Jul 05 Aug 05 to Jul 06 Aug 06 to Jul 07<br />
No. of<br />
enquiries<br />
3083<br />
1037<br />
7.0 CHILDCARE DEMAND<br />
40
7.0 CHILDCARE DEMAND<br />
Doesn’t<br />
“<br />
seem to be enough children to go round at the moment.<br />
”<br />
There should be no more day nurseries in the <strong>Torbay</strong> area until the existing<br />
vacancies are full.<br />
We have vacancies in both our rooms at the moment.<br />
Childminders are fairly quiet at the moment, other provision, especially out of<br />
school clubs are cheaper.<br />
There are too many nurseries in the area.<br />
Awful lot of childcare at the moment and not enough children to fill it, this seems<br />
to be across the whole bay and not just my area.<br />
I am the quietest I have been in 12 years of childminding.<br />
Sustainability is a massive issue. “<br />
“<br />
41<br />
We are considering future<br />
expansion to the baby room<br />
as the demand is high for<br />
children under 2 years old.<br />
”<br />
There is a huge demand for<br />
these places and have had to<br />
refuse 54 places.<br />
“<br />
”<br />
I get enquiries from a<br />
nursery who refer on to<br />
childminders when they are<br />
full, but also to provide more<br />
flexible hours, for example<br />
provide care up until 6.30pm.<br />
The nursery manager actually<br />
refers parents on to childminders<br />
when she is unable to meet<br />
parents’ needs, this arrangement<br />
works very well.<br />
I have seen a definite shift in the age of young children attending childcare. I used to get children as<br />
young as 4 months, I now tend to get children from 10 months, mums are making the most of their<br />
increased maternity allowance.<br />
Patterns of work have changed in the last 10 years, there is more part time work, employers are becoming more flexible.<br />
Parents are keen to take advantage of what’s available to them to improve their work / life balance.<br />
Enquiries Made About <strong>Childcare</strong><br />
Enquiries made to Devon Information Services for Children (DISC) may<br />
also give an indication of parental need for childcare. Information<br />
provided by DISC shows the number of enquiries they received between<br />
August 2004 and July 2007, the enquiries are broken down by type of<br />
provider and by month. Data has also been provided on enquiries made<br />
by the town in which childcare is provided, however this has only been<br />
available between July 2006 and July 2007.<br />
To identify any recent trends, enquiries made in the same time period<br />
over the last 3 years (August to July) have been compared. It is clear<br />
from Figure 53 that the number of enquiries has increased, although<br />
enquiries were lower in 2005 to 2006, this was the case for the<br />
majority of types of provider.<br />
It is also clear across the three years that the most popular types of<br />
childcare parents have enquired about is childminders and day<br />
nurseries. Since 2004 there has been a substantial increase in the<br />
enquiries made about day nurseries, holiday schemes and pre-schools.<br />
Month by month there is some fluctuation in the number of enquiries<br />
made about childcare but nothing significant. Understandably,<br />
December tends to be the quietest month, while enquiries tend to<br />
increase around September and then in May and June.<br />
In terms of enquiries by town, the highest number of enquiries was for<br />
Torquay, and then Paignton. <strong>Childcare</strong> enquiries for Brixham were much<br />
lower than the other two towns, this would be expected given the<br />
population generally is lower.<br />
Perception of <strong>Childcare</strong> Demand: Providers<br />
<strong>Childcare</strong> providers themselves are in an excellent position to have an<br />
appreciation of the childcare market and current levels of demand.<br />
Through consultation, providers informed us that before and after<br />
school care seems to be more in demand than other types of childcare<br />
at this particular time.<br />
From the providers perspective there seems to be less demand for<br />
childcare for children under the age of 5.
The nurseries which tend to consistently demonstrate very high demand<br />
are those attached to the college of further education and the hospital,<br />
this is no doubt because they provide care specifically for students and<br />
staff. One such nursery told us that baby places are an issue, although<br />
they did also identify a decrease in the number of 3 and 4 year olds<br />
with more now going to maintained nurseries, pre-schools and with the<br />
one point of entry into school.<br />
There were also examples of partnership working across providers, in<br />
Torquay especially. One provider has good links with local childminders,<br />
so that when they are full or if they are unable to meet a parent’s needs<br />
(i.e. hours open) then they will refer children onto childminders in the<br />
area.<br />
Providers are also aware that changes in maternity allowances and the<br />
flexibility of employers is having an impact on the demand for childcare.<br />
The Views of Parents and Carers<br />
Throughout the summer in 2007 a consultation exercise was<br />
undertaken to establish the views of parents and carers across <strong>Torbay</strong> in<br />
regard to childcare. A variety of methods were used to seek the<br />
opinions of parents and carers as to the availability and accessibility of<br />
local childcare.<br />
“I took a recommendation from<br />
a friend and went to visit, liked<br />
what I saw and went with that.<br />
My niece was already at the nursery<br />
I chose.<br />
The day nursery was recommended<br />
through a friend.<br />
My brother’s children already<br />
attended the nursery so I knew it<br />
was good.<br />
Knowledge and Information<br />
Parents and carers were asked to state where would you look / did you<br />
find information about childcare. Over half (57%) of respondents said<br />
that they would go to / had gone to friends or family for information<br />
about childcare. Just under a third (31.3%) said they would go / had gone<br />
to their health visitor. A quarter of parents and carers had heard of Devon<br />
Information Services for Children (DISC) and had gone to / would use this<br />
service to get information about childcare provision, see Figure 55.<br />
Parents use a variety of sources to get information about childcare and<br />
value input from schools, health visitors and from their colleagues at<br />
work and in one case through their employer. Recommendations from<br />
friends and family clearly have an impact on where parents look for<br />
childcare, but also on their decision to use a provider.<br />
For those parents who used the DISC service they reported this to be a<br />
fairly positive experience, although one parent who had used this<br />
service recently said that it had not been as easy compared to the last<br />
time she used it.<br />
A small minority were not aware of where they could go to get information<br />
about childcare, and one suggested that it would be really helpful to<br />
have a list of all providers available. One parent told us that they<br />
wouldn’t know where to look and would go to the Children’s Centre first.<br />
I found childcare<br />
arrangements through word of<br />
mouth (other mums at<br />
school).<br />
The nursery was recommended by<br />
my sister so I didn’t need to look<br />
around.<br />
A friend recommended a<br />
holiday club which I also<br />
found on DISC.<br />
“We moved down from the<br />
midlands and used the DISC who<br />
were very helpful and I was able<br />
to arrange visits with the<br />
providers on the list.<br />
Details were on the DISC website, there<br />
were lots to choose from.<br />
When we moved into the area a<br />
nursery was recommended by a<br />
friend, but we used DISC to get a<br />
full list of nurseries.<br />
Figure 55<br />
Where Parents Get Information<br />
About <strong>Childcare</strong><br />
Friends &/or family 525<br />
Health visitor<br />
Internet/phone book<br />
School<br />
DISC<br />
<strong>Torbay</strong> <strong>Council</strong><br />
Children’s Centre<br />
Library<br />
Doctor<br />
Job Centre Plus<br />
Total<br />
7.0 CHILDCARE DEMAND<br />
No. %<br />
288<br />
273<br />
57.0<br />
31.3<br />
29.6<br />
237 25.7<br />
235 25.5<br />
154 16.7<br />
117 12.7<br />
63 6.8<br />
60 6.5<br />
60 6.5<br />
2,079 225.7*<br />
*Multiple response question so % does not<br />
equal 100.<br />
Found the information on DISC<br />
website really helpful, instantly gave me<br />
a list of childcare providers in my area.<br />
We moved to <strong>Torbay</strong> a couple of<br />
years ago and contacted DISC<br />
then and got details of some<br />
providers. It was really easy to<br />
get the information. But I have<br />
contacted them recently and it<br />
was a little bit more difficult and<br />
there were a couple of phone<br />
calls back and forwards.<br />
42
7.0 CHILDCARE DEMAND<br />
Figure 56<br />
Main Reason For Using <strong>Childcare</strong><br />
43<br />
I go to work<br />
I am studying<br />
My child can play with<br />
other children<br />
To give me a break<br />
It is good for my child<br />
So I can attend appointments<br />
Other<br />
Figure 57<br />
<strong>Childcare</strong> Arrangements In The Last 6 Months<br />
Family or Friends<br />
Day Nursery<br />
Pre-school / Playgroup<br />
After School Club<br />
Holiday Club<br />
Childminder<br />
Nursery Class in a School<br />
Breakfast Club<br />
Crèche<br />
Other<br />
0 10 20 30 40 50 60 70<br />
% of respondents<br />
0 10 20 30 40 50 60 70 80<br />
% of respondents<br />
“<br />
My son needed more than I<br />
could give him at home. I<br />
also wanted to help him<br />
prepare for school so he is<br />
doing longer days at the<br />
moment to help him prepare<br />
for that.<br />
My child needed more than we<br />
could offer at home. I also needed<br />
the opportunity to have a bit of a<br />
break with twins.<br />
My child attends a preschool<br />
so that he can<br />
interact with others.<br />
”<br />
I use childcare for my child’s social<br />
and educational development.<br />
Providing information to those parents and carers who are hard to<br />
reach and don’t access services and / or have a computer at home was<br />
discussed in some of the focus groups, it was suggested that more<br />
information could be provided in the libraries, or could go out with the<br />
health visitors who have to visit all families.<br />
Current <strong>Childcare</strong> Use<br />
Through the survey we asked parents and carers to state the main<br />
reason for using childcare. Unsurprisingly, the main reason parents used<br />
childcare arrangements was so that they could work, see Figure 56.<br />
However, parents did tell us that they used childcare as it provided more<br />
than what they could offer at home, this included one mother who had<br />
chosen to stay at home to look after her child.<br />
Figure 58<br />
How Often Are <strong>Childcare</strong> Arrangements Used<br />
Family or Friends<br />
Day Nursery<br />
Pre-school / Playgroup<br />
Childminder<br />
Nursery Class in a School<br />
After School Club<br />
Breakfast Club<br />
5 times or more a<br />
week<br />
At least once a<br />
month<br />
Holiday club<br />
Crèche<br />
Other<br />
0% 20% 40% 60% 80% 100%<br />
2 to 4 times a week Once a week<br />
In school holidays
“ ”<br />
Grandparents are willing to have<br />
our child.<br />
Grandparents are very happy to help<br />
out with our eldest child.<br />
We have fantastic grandparents,<br />
we are very lucky.<br />
Finding childcare has been very easy as<br />
we are lucky enough to have loads of<br />
friends who help.<br />
We have been very lucky with<br />
supportive family and friends so<br />
haven’t needed ‘formal<br />
childcare’.<br />
Parents and carers were also asked to state which type of provider<br />
they had used in the last six months. By far the most popular<br />
choice for childcare was family or friends, with 70% of parents and<br />
carers saying they had used this arrangement recently. Just over a<br />
third said they had used a day nursery and just under a third had<br />
used a pre-school / playgroup (Figure 57). We also asked parents to<br />
state how regularly they used their childcare arrangements and<br />
this can be seen in Figure 58.<br />
Across most types of childcare provider parents and carers are<br />
most likely to use their arrangements between two and four times<br />
“<br />
I shared childcare with a<br />
”<br />
friend; she looked after my<br />
children and I looked after<br />
hers.<br />
Although we do use childcare, we<br />
also use a network of friends and<br />
share childcare arrangements, so<br />
we all look after each other’s<br />
children.<br />
“I don’t use childcare, my son is only<br />
23 months and I am a single mum.<br />
At the moment I haven’t looked into<br />
childcare for my son other than my<br />
family, I have no plans to go back to work<br />
yet.<br />
Since my third child I have given up work and look after my children<br />
myself as childcare is difficult and complicated. Anyway, they are my<br />
little ones and I want to bring them up.<br />
7.0 CHILDCARE DEMAND<br />
Figure 59<br />
How Easy It Was To Find The<br />
<strong>Childcare</strong> You Wanted<br />
17%<br />
Very easy<br />
Quite easy<br />
Neither<br />
Difficult<br />
11% 2%<br />
Very difficult<br />
41%<br />
29%<br />
44
7.0 CHILDCARE DEMAND<br />
a week. Nursery classes in schools tend to be used five times a week<br />
which obviously fits in with what they offer – five sessions across the<br />
week, either in the morning or in the afternoon. Of those respondents<br />
who use family or friends, very few use this arrangement five times a<br />
week or more, parents are more likely to use this option between once<br />
and four times over a week. The usage of day nurseries, pre-schools<br />
and childminders is quite similar across the week, around 20% of<br />
parents who use this type of provision use it five or more times over the<br />
week. Around half of parents who use these types of provision use<br />
them between two and four times a week. Out of school provision is<br />
also used regularly throughout the week, with a third of parents who<br />
use breakfast clubs making use of them five times a week. Just under<br />
half of parents who use afterschool and breakfast clubs use them<br />
between two and four times a week.<br />
The main reason for parents and carers using family and friends for<br />
childcare is the cost, this issue will be explored further under<br />
‘Affordability’. There is also a willingness of family and friends<br />
(especially Grandparents) to help out.<br />
A couple of parents told us that they share childcare responsibilities<br />
with their friends.<br />
Some parents had made the decision to give up work and look after<br />
their children, some because of the cost implications of formal childcare<br />
but some because they wanted to be at home with their children.<br />
Availability<br />
Under availability parents were first asked to consider how easy it had<br />
been to find the childcare they wanted.<br />
The majority of respondents said that they found it easy to find the<br />
childcare they wanted, while 14% said they found it difficult to get the<br />
childcare they wanted, see Figure 59 (see previous page).<br />
Parents were asked if they could tell us why it was easy or difficult to<br />
find childcare. For those parents who found childcare easily it was<br />
45<br />
“<br />
The problem with my children<br />
starting school is that I will need<br />
childcare up until 5pm.<br />
As I am living on benefits it’s hard to<br />
get decent holiday childcare that doesn’t<br />
cost too much.<br />
I will have problems when my<br />
children go to school as there is<br />
no current after school provision<br />
at the school they will be going<br />
to and I work.<br />
As there is only a limited number of<br />
clubs that collect and drop off from<br />
schools, these places are very limited<br />
and you need to go on a waiting list.<br />
“There are long waiting lists at the good nurseries.<br />
It is easy to find the childcare, but getting a vacancy can be<br />
limited.<br />
I easily found the childcare I<br />
needed through the school (in<br />
Paignton) but the after school<br />
club closed and the holiday club<br />
at the other school I used has<br />
also closed so don’t have<br />
anything.<br />
I have a problem now that my daughter<br />
has started secondary school. There is<br />
no childcare provision for children over<br />
11 years and I feel she is far too young<br />
to be left on her own during the school<br />
holidays.<br />
Few holiday clubs in the area for<br />
4 and 7 year olds, no after school<br />
club at the 7 year olds school.<br />
I have a friend who is a single mum<br />
and works until 5.30pm, but the school<br />
finishes at 3.30pm and I am not sure<br />
what she will do to close the gap until<br />
she finishes work.<br />
School holidays are<br />
”<br />
very difficult.<br />
I still haven’t found an after school club<br />
available in the Preston area.<br />
A waiting list is required to obtain a good nursery.<br />
Finding the nursery was no problem I just had to wait a<br />
long time for a place.<br />
The childminder I wanted had a waiting list but I<br />
was prepared to wait.<br />
A relative and friend recommended the nursery and once I’d<br />
checked availability and opening hours I went on a waiting<br />
list, I had quite a wait before a space was free.<br />
It took a while to find a suitable nursery as lots of<br />
places have no availability or waiting lists.<br />
There is a situation in Paignton, I am not really impressed<br />
with some of the closures. Quality is clearly and issue and<br />
there doesn’t seem to be much choice, unless you are<br />
prepared and book early, places in quality settings get<br />
booked up early.
“When my first child was<br />
under the age of 2 it was<br />
difficult to find a nursery that<br />
would take under 2s.<br />
Difficult to find a nursery<br />
accepting children under 2.<br />
Finding a place for under 2s<br />
was difficult.<br />
Family are very willing to help<br />
now children are older but<br />
childcare for babies was very<br />
limited in the nurseries.<br />
Previous nursery closed and<br />
so I had to move my child, I<br />
found it very difficult<br />
because they were under 2<br />
years old.<br />
because of the following reasons:<br />
■ They were using family or friends<br />
■ They were already aware of which provision they wanted to use<br />
■ They lived in close proximity to a provider<br />
■ They had friends / family who worked in childcare<br />
■ They already had children in a setting<br />
■ The school their child attends opened breakfast and / or<br />
after school club.<br />
For those parents who found it difficult, there were a number of<br />
common themes which centred around the type of childcare they<br />
wanted. They required the actual availability, and the need for providers<br />
to be flexible.<br />
One of the biggest problems parents appeared to have was the<br />
availability of childcare out of school.<br />
Many parents mentioned that when they were choosing their childcare<br />
Figure 60<br />
<strong>Childcare</strong> Availability<br />
There is a wide choice of<br />
childcare where I live<br />
There should be more<br />
childcare where I live<br />
<strong>Childcare</strong> is offered at the<br />
times I need it<br />
There is plenty of childcare<br />
where I live<br />
0% 20% 40% 60% 80% 100%<br />
Strongly agree Agree Neither<br />
Disagree Strongly disagree<br />
7.0 CHILDCARE DEMAND<br />
arrangements, they had to be put on waiting lists because there was a<br />
lack of places available.<br />
On the subject of availability of places many parents also commented on<br />
a lack of available places for children under the age of 2.<br />
The questionnaire asked parents to state how strongly they agreed or<br />
disagreed with a series of statements about the availability of childcare,<br />
the results are shown in Figure 60.<br />
Parents generally agreed that where they live there is plenty of<br />
childcare available and two fifths agreed that there is a wide choice of<br />
childcare. However, just over a third of parents felt there should be<br />
more childcare where they live.<br />
The map in Figure 61 (see overleaf) shows where parents agreed there<br />
should be more childcare. Data from the parental survey was<br />
aggregated up to super output area (SOA) and shows the proportion of<br />
people in that area who agree there should be more childcare where<br />
they live. The caveat with this is that in some areas the numbers may<br />
be low. In SOAs across both wards in Brixham, in Goodrington with<br />
Roselands and in St Marychurch over 80% of parents agreed there<br />
should be more childcare. In Ellacombe, which has one of the lowest<br />
levels of supply, approximately half of parents agreed there should be<br />
more childcare in these areas.<br />
In terms of childcare being available at the times it is needed, over 60%<br />
of parents agreed the times childcare is available is suitable to meet<br />
their needs, however, additional comments from the survey and from<br />
the focus groups show that there is a demand for more flexible and ‘out<br />
of normal hours’ childcare.<br />
In addition to more flexible arrangements to meet parents working<br />
hours throughout the week, a couple of parents said that childcare at<br />
the weekends would be of benefit.<br />
As discussed in Chapter 6, some childminders are able to offer more<br />
flexible childcare and meet the needs of some parents who need care<br />
46
7.0 CHILDCARE DEMAND<br />
Figure 61<br />
Parents Who Agree There<br />
Should Be More <strong>Childcare</strong><br />
Where They Live<br />
47<br />
Ward boundary<br />
SOA boundary<br />
Overall Level Of Agreement<br />
80+% (3)<br />
60 to 80% (1)<br />
40 to 60% (33)<br />
20 to 40% (33)<br />
0 to 20% (19)<br />
earlier in the morning, later in the day and over the weekends. Take up<br />
of this care appears to be fairly popular too, with the<br />
childminders in our sample providing care out of normal hours for<br />
81 children which works out at approximately 2 children per<br />
childminder. These 81 children were accessing 151 sessions<br />
between them.<br />
Locality of childcare is an important factor for parents when they<br />
are choosing childcare, 83% of parents said it was important<br />
for childcare to be close to their home, this was significantly<br />
more important than childcare being close to a place of<br />
work or a school (58% and 56% respectively).<br />
Affordability<br />
The cost of childcare arrangements is clearly an issue for all<br />
parents, childcare for younger children can be deemed as particularly<br />
expensive and in an area where average wages are low, paying for<br />
childcare can be a strain on family budgets.<br />
From the parental survey, 82.7% of parents said that costs / charges are<br />
an important factor when choosing childcare arrangements. However,<br />
over half of parents (57%) thought that their childcare costs<br />
were reasonable.<br />
The range of what parents were paying for childcare was<br />
between £5 a week and £400 a week, based on our survey<br />
parents were paying an average of £66.37 a week for<br />
childcare, and just under a third (32%) were receiving tax<br />
credits to support their childcare costs. If childcare costs were to<br />
increase by 5% a week, just under half (42%) of the parents said they<br />
wouldn’t be able to afford this increase, however, 25% said that an<br />
increase of 5% would enable them to access more tax credits. Only a<br />
small number said that an increase of 5% would mean that they would<br />
have to leave work.<br />
For some parents going back to work after maternity leave and having<br />
to pay for childcare is not an option.<br />
“<br />
I would like to go back to work<br />
but have an 8 year old child so<br />
hours are limited and some<br />
employers want flexibility.<br />
The nursery works for now but doesn’t<br />
allow me to get a part time job as<br />
employers want flexibility from employees<br />
and nurseries want a set schedule.<br />
I need flexible childcare as I<br />
work a shift system part time in<br />
the fire service and often work<br />
nights. <strong>Childcare</strong> starting earlier<br />
at 7am would help me get to<br />
Exeter on time, at the moment I<br />
get a friend to drop my child off<br />
at nursery.<br />
”<br />
“ ”<br />
Due to working varied shift work we<br />
need very flexible childcare, sometimes<br />
at short notice. Wasn’t able to find<br />
childcare who could do this.<br />
I have been with our<br />
childminder for 3 years, very<br />
easy and a lovely childminder,<br />
she is very flexible as I work<br />
shifts.<br />
We wanted a nursery that opened<br />
early enough for us to get into work in<br />
good time (before 8am).<br />
I need to start work at 7.30am<br />
there are no provisions for this<br />
so I had to change my hours at<br />
work.<br />
There should be a way of offering a<br />
more flexible childcare structure for<br />
people who work shifts, I can imagine<br />
this would help a lot of people.<br />
Hours available don’t fit in with<br />
the hours I need.<br />
Would have liked to have found a nursery that did Saturdays.<br />
Saturday clubs are not available all year round in Torquay.<br />
Difficult to find hours to fit in with work – including the weekends.<br />
“I was lucky to find a place close<br />
to my home and work after<br />
phoning and visiting other<br />
nurseries in the area.<br />
I am very happy with the nursery where<br />
my daughter has been for the last 17<br />
months, it is close to home but also close<br />
to the school where her siblings are.<br />
The nursery was the closest and<br />
most convenient to where I live.<br />
The nursery and the school are both<br />
within 2 miles of where I live.<br />
Nursery is in a convenient<br />
location for home and work.
“<br />
I have a lot of friends who do<br />
not work as their salaries do not<br />
make it worth it once they have<br />
paid the fees. Salaries here are<br />
not high enough to make it<br />
worth going back to work.<br />
<strong>Childcare</strong> is too expensive to allow me<br />
to go back to work.<br />
<strong>Childcare</strong> just isn’t financially<br />
viable.<br />
“Cost is the main reason we use<br />
a network of friends. To put our<br />
children into childcare means it<br />
wouldn’t be worth working.<br />
I just cannot afford childcare for three<br />
children, so I have to rely on my<br />
elderly parents.<br />
I had to have family look after<br />
my children, costs are too high<br />
so instead I travel 5 miles to<br />
drop the kids off with my sister.<br />
I have a 1 year old and childcare for<br />
him would be too expensive if I was to<br />
go back to work.<br />
I have recently given up work as<br />
I was working to pay for nursery<br />
and as a single mum, it wasn’t<br />
worth it.<br />
”<br />
Difficult to match childcare for both<br />
children, <strong>Childcare</strong> is very expensive<br />
and it’s not really worth working.<br />
<strong>Childcare</strong> is too expensive and so we<br />
have to rely on family to help out.<br />
I had to arrange for someone to<br />
care for my children because<br />
childminders / nurseries were<br />
too expensive.<br />
I have twins and their grandparents<br />
have to have them a day a week, which<br />
makes a huge difference. The costs are<br />
still huge though and you don’t get a<br />
discount for twins!<br />
Using family and friends is clearly one option to help parents and carers<br />
keep the costs down.<br />
Tax credits are clearly a contentious issue for some parents, with many<br />
in the focus groups saying that the system was difficult and not easy to<br />
negotiate. Only a third of our sample were claiming tax credits and<br />
while just under half (44%) said that information about tax credits was<br />
easy to find, 35% of parents told us that the information about tax<br />
credits was not easy to understand. For many parents this is a<br />
complicated and difficult system that for some isn’t worth bothering<br />
with. One parent told us that she wished she just hadn’t bothered with<br />
the whole system because she was overpaid for two years and so she<br />
has not had any help in the last two years.<br />
Inclusion<br />
From a parent’s perspective, finding childcare for children with<br />
disabilities, special or additional needs can be difficult. There is a<br />
perception that childcare providers won’t take children with certain<br />
disabilities and are unable to administer medicines.<br />
Parents received help and support with childcare from their portage<br />
workers which they really valued.<br />
For parents who have a disability themselves, childcare can provide<br />
them with an opportunity to have a rest. For parents with disabilities<br />
there needs to be flexibility with childcare to meet their needs.<br />
Consultation With Employers<br />
While the consultation with employers was not as successful as hoped,<br />
six employers did return our surveys. Between them they employed a<br />
total of 550 people and females made up on average 60% of their<br />
workforces. Two of the six operated shift patterns and these two also<br />
required staff to work at the weekends.<br />
<strong>Childcare</strong> support is offered by three of the employers that returned<br />
their surveys, and this largely takes the form of offering vouchers.<br />
One of the employers also offered employer childcare subsidies for their<br />
7.0 CHILDCARE DEMAND<br />
“<br />
Because we needed special<br />
care, it was a lot harder to find<br />
the right care for our child due<br />
to his demanding list of<br />
special needs.<br />
Due to my son’s Aspergers I find it<br />
very hard to find childcare who will<br />
cater for him.<br />
Very few childminders are able<br />
to cater for children with<br />
severe learning disabilities.<br />
Finding a childminder was hard, not<br />
sure the support is there when it<br />
comes to special needs children.<br />
I had to hunt around and<br />
make lots of phone calls trying<br />
to find space, especially for 2<br />
children.<br />
As a parent of a 16 year old with<br />
learning difficulties I only have the<br />
special needs playscheme, but this<br />
finishes at 17, it will be difficult for<br />
me to work while he is on holiday.<br />
It’s hard finding suitable<br />
childcare and getting names<br />
and recommendations.<br />
There needs to be flexibility from<br />
providers to assist parents who have a<br />
disability. There are often situations<br />
where we cannot get our children to<br />
their childcare and on days like this<br />
the need for childcare is even greater.<br />
There are no formal arrangements<br />
with providers to pick up and drop off<br />
children and this would help parents<br />
with a disability so much.<br />
48
7.0 CHILDCARE DEMAND<br />
Our observation of<br />
children aged 3 and<br />
4 in the Children’s<br />
Centre nurseries<br />
showed that the<br />
majority of children<br />
were happy to<br />
come to nursery all<br />
of the time<br />
49<br />
staff. The table in Figure 62 shows that childcare can be an issue for<br />
retention of staff and for new mothers returning to work.<br />
From the employer’s perspective the cost of childcare appeared to be<br />
the biggest barrier for parents.<br />
Consultation with Children and Young People<br />
The results of the survey with the Youth e-panel should be used for<br />
illustrative purposes only as the response rate was quite low, however<br />
this information does provide a useful insight into what young people<br />
are participating in after school and in the holidays and also what the<br />
barriers are to them doing what they would like.<br />
Young people on this panel were asked what activities they participate<br />
in after school which are supervised by an adult. The following list<br />
represents some of the most popular responses:<br />
■ Guides / Brownies / Scouts<br />
■ Choir<br />
■ Badminton<br />
■ Hockey<br />
■ Trampoline<br />
Young people were also asked to state what activities they participated<br />
in during the school holidays which are supervised by an adult, the list<br />
below represents some the responses:<br />
■ Summer camp<br />
■ Badminton<br />
■ Boys Brigade camp<br />
■ Choir<br />
■ Dance<br />
■ Go to Acorns Centre<br />
■ Tennis Club<br />
■ Swimming<br />
Figure 62<br />
<strong>Childcare</strong> Issues For Employers<br />
<strong>Childcare</strong> issue for recruitment of staff 1<br />
<strong>Childcare</strong> issue for retention of staff<br />
<strong>Childcare</strong> issue for new mothers returning to work<br />
Just over a third of young people who responded said that the activities<br />
they did were not offered where they live. Some of the key reasons as<br />
to why young people are not doing the activities they want to are listed<br />
below:<br />
■ Not offered near my home<br />
■ I would rather stay at home / hang out with my friends<br />
■ Too expensive<br />
■ Not offered at the times I can attend<br />
Yes No<br />
Over half of young people said they would like to access services<br />
through their school, while a quarter said they would like to access<br />
services through their local community centres.<br />
Our small scale observation of children aged 3 and 4 in the Children’s<br />
Centre nurseries showed that the majority (80%) were happy to come<br />
to nursery all of the time and 70% of the children separated well from<br />
their parent / carers. The children were happy at nursery for a variety of<br />
reasons, the predominant reason being that they got to play or do<br />
drawings. The children did recognise that other children at the nursery<br />
might be sad because they missed their mums. So while there is not<br />
necessarily a choice with younger children about going to nursery, the<br />
children that do attend are quite happy to be there.<br />
2<br />
2<br />
5<br />
4<br />
3
Key Findings<br />
■ Based on take up of childcare in September 2007, the average rate<br />
of occupancy across <strong>Torbay</strong> was 56.6%<br />
■ If we consider the occupancy rates alone, then areas where there<br />
could be high demand are in Paignton, especially in Clifton with<br />
Maidenway and in Goodrington with Roselands. Based on these<br />
occupancy rates alone, three wards in Torquay (Watcombe,<br />
Tormohun and Wellswood) show the lowest levels of occupancy<br />
across <strong>Torbay</strong><br />
■ Occupancy rates for children under the age of 2 tended to be higher<br />
compared to other age groups<br />
■ There was higher occupancy in places for children aged 2 to 5 in<br />
Paignton compared to other areas<br />
■ In terms of enquiries made to DISC, childminders and day nurseries<br />
received more enquiries than other types of childcare<br />
■ Providers indicated that there is more demand for childcare before<br />
and after school at this present time and less demand for childcare<br />
for children under the age of 5<br />
■ Changes to maternity allowances and employers becoming more<br />
flexible to meet the needs of working parents could be having an<br />
impact on the demand for childcare<br />
■ The majority of parents (70%) are using family and friends as their<br />
childcare arrangements<br />
■ Recommendations from friends and family are important in a<br />
parent’s choice of childcare<br />
■ The majority of parents had found it easy to find the childcare they<br />
wanted<br />
■ Parents faced more problems trying to find suitable out of school<br />
care, both after school and in the holidays<br />
■ Parents appeared to find it more difficult to get places in childcare<br />
for children under the age of 2<br />
■ A third of parents felt there should be more childcare where they<br />
lived, with high proportions of these parents living in Brixham,<br />
Goodrington with Roselands and St. Marychurch<br />
■ There is demand for more flexible hours and out of normal hours<br />
care to meet the needs of parents who work shift patterns, although<br />
this is fairly limited<br />
■ Just over half of parents thought their childcare costs were<br />
reasonable, although the issue of tax credits is clearly contentious<br />
■ From an inclusion perspective, parents who have children with a<br />
disability, SEN or additional needs said that they did have difficulty<br />
trying to find suitable childcare arrangements. Help from the<br />
portage workers in finding childcare was appreciated<br />
■ For those employers who did respond to the consultation, a couple<br />
said that childcare was an issue with regards to staff retention and<br />
new mothers returning to work after maternity leave<br />
■ The main reasons young people gave for not being able to do the<br />
activities they wanted were because these were not offered near<br />
their homes, they actually just wanted to hang out with their mates,<br />
they were too expensive, and the activity isn’t offered at the right<br />
times<br />
7.0 CHILDCARE DEMAND<br />
50
51<br />
8.0<br />
MATCHING SUPPLY<br />
TO DEMAND<br />
This final chapter brings together evidence gathered<br />
through this assessment on a number of socio-economic<br />
factors, the current supply of childcare and the demand for<br />
it. The evidence presented highlights that although <strong>Torbay</strong><br />
is a small authority it is a diverse one with significant<br />
differences across communities.<br />
This final step completes this assessment and considers the<br />
level of supply and demand across the following categories:<br />
■ Geography<br />
■ Age groups<br />
■ Type of childcare<br />
■ Times of childcare<br />
■ Income<br />
■ Specific needs
Geographical<br />
Based on occupancy rates alone, there could be some current demand<br />
for childcare in Paignton, especially in Clifton with Maidenway and<br />
Goodrington with Roselands. The occupancy rates in these wards are<br />
the highest across <strong>Torbay</strong>. The number of places available in these<br />
wards are also among some of the highest in <strong>Torbay</strong>. In addition to this,<br />
parents in these areas agreed that there should be more childcare, see<br />
maps overleaf.<br />
In Ellacombe, a high proportion of<br />
parents said there should be more<br />
childcare in the area, however,<br />
occupancy rates are lower than<br />
60% suggesting that actual demand<br />
is not that high. In St Marychurch<br />
(Torquay) parents said they agreed<br />
there should be more childcare.<br />
However, Figure 64 shows that in<br />
the SOA where a high proportion of<br />
parents said there should be more<br />
childcare, there is already a<br />
concentration of childcare providers.<br />
In addition to this, occupancy rates<br />
in St Marychurch were average<br />
(57%).<br />
In Tormohun, Watcombe and Wellswood, occupancy rates are lower than<br />
45% and in these areas a small number of parents thought there<br />
needed to be more childcare. We can conclude that in these areas<br />
demand for childcare is much lower than elsewhere.<br />
In Brixham, the occupancy rates of the wards vary from 50% to 70%<br />
yet in parts of these wards parents indicated that there should be more<br />
childcare. This suggests possibly that parents are unaware of the<br />
childcare choices in their localities or they feel that the choices of<br />
childcare are not suitable to meet their needs.<br />
8.0 MATCHING SUPPLY TO DEMAND<br />
Age Groups<br />
Occupancy rates for children under the age of 2 tend to be higher than<br />
across other age groups, indicating there could be some demand for<br />
more places in this age group. From the parental consultation, parents<br />
and carers tended to agree and felt that finding childcare for children<br />
under the age of 2 was more difficult. Some areas across the bay<br />
clearly have more places available for children under 2 than elsewhere.<br />
Shiphay with the Willows has the highest number of places available for<br />
children under 2 (39.7 places per 100 children). Data on the birth rate<br />
shows that the number of places for babies in Shiphay with the Willows<br />
could well be supported, given the higher rate of births in this area.<br />
Tormohun and Cockington with Chelston also have a high number of<br />
births, yet lower levels of supply of places for children aged under 2.<br />
However, Tormohun in particular has lower levels of occupancy<br />
suggesting that parents may not necessarily take up places if they were<br />
available.<br />
Occupancy rates for children aged 2 to 5 are lower compared to other<br />
age groups and only a small number of providers reported occupancy<br />
rates of higher than 80%, many of those who reported these higher<br />
rates were based in Paignton. This could suggest that there is more<br />
demand in Paignton for this age group compared to Torquay and<br />
Brixham.<br />
In terms of the early years education, there are places available for<br />
every 3 and 4 year old in <strong>Torbay</strong>, however, take up of places suggests<br />
that not all children are accessing the full five sessions a week.<br />
Consultation with parents indicates that there is some competition for<br />
places in nurseries which they feel provide good quality childcare and<br />
education. The one point of entry into schools has impacted on this<br />
further and some parents are having to pay for additional sessions a<br />
term earlier, to ensure that their child’s place is guaranteed once they<br />
become entitled to the nursery education grant.<br />
There is clearly a need for out of school care for children of school age,<br />
this will be covered in the following section.<br />
52
8.0 MATCHING SUPPLY TO DEMAND<br />
53<br />
Figure 63a<br />
Occupancy Rates By Ward<br />
Aggregated Occupancy<br />
Rates by Ward<br />
Higher than 80% (2)<br />
Between 65 and 80% (3)<br />
Between 45 and 65% (7)<br />
Less than 45% (3)<br />
<strong>Childcare</strong> Places<br />
Per 100 Children<br />
Figure 63b<br />
Places Per 100 Children<br />
Between 20 and 30 (2)<br />
Between 10 and 20 (6)<br />
Less than 10 (7)<br />
Figure 63c<br />
Should Be More <strong>Childcare</strong><br />
Overall Level Of Agreement<br />
80+% (3)<br />
60 to 80% (1)<br />
40 to 60% (33)<br />
20 to 40% (33)<br />
0 to 20% (19)<br />
Ward boundary<br />
SOA boundary<br />
Figure 64<br />
Should Be More <strong>Childcare</strong><br />
Against Location Of Providers<br />
Overall Level Of Agreement<br />
80+% (3)<br />
60 to 80% (1)<br />
40 to 60% (33)<br />
20 to 40% (33)<br />
0 to 20% (19)<br />
Location of nurseries<br />
Ward boundary<br />
SOA boundary
Figure 65a<br />
Income Deprivation<br />
SOA Rank Of<br />
Income Deprivation<br />
Top 10% in England (6)<br />
10 to 20% (10)<br />
20 to 30% (22)<br />
30 to 40% (21)<br />
40 to 50% (12)<br />
50 to 60% (9)<br />
60 to 70% (6)<br />
70 to 80% (2)<br />
90 to 100% (1)<br />
Ward boundary<br />
SOA boundary<br />
Figure 65b<br />
Occupancy Rates By Ward<br />
Figure 65c<br />
Average Hourly Cost Of<br />
<strong>Childcare</strong><br />
Aggregated Occupancy<br />
Rates By Ward Average Hourly Cost<br />
Higher than 80% (2)<br />
Between 65 and 80% (3)<br />
Between 45 and 65% (7)<br />
Less than 45% (3)<br />
£3.26 to £3.50 (2)<br />
£3.01 to £3.25 (5)<br />
£2.76 to £3.00 (2)<br />
£2.51 to £2.75 (4)<br />
£2.00 to £2.50 (2)<br />
8.0 MATCHING SUPPLY TO DEMAND<br />
54
8.0 MATCHING SUPPLY TO DEMAND<br />
Type of <strong>Childcare</strong><br />
Only out of school care was something that parents expressed the most<br />
demand for. Parents need care that is available after school to close the<br />
gap between the end of the school day and when they finish work.<br />
Holiday provision is also something that parents said they required.<br />
In terms of supply, every ward (with the exception of two) has some kind<br />
of out of school care, although in the following wards this is limited and<br />
in some cases only provided through childminders:<br />
55<br />
■ Berryhead with Furzeham<br />
■ Roundham with Hyde<br />
■ Wellswood<br />
■ Churston with Galmpton<br />
■ Preston<br />
■ St Marys with Summercombe<br />
While this assessment suggests that occupancy rates of out of school<br />
provision should be further investigated, there is a perception among<br />
development workers that places in out of school provision are not<br />
being filled. If this is the case then there could well be an issue with<br />
current provision. This could be because parents are unaware this<br />
provision exists or the quality of the settings does not meet the parents’<br />
requirements or simply that they do not really need to make use of<br />
what is available.<br />
In terms of early years education and the free places for 3 and 4 year<br />
olds, the PVI sector are able to meet the needs of working more flexibly<br />
than the maintained sector, although there is a perception that a place<br />
in a maintained nursery will guarantee a place in the school.<br />
Time <strong>Childcare</strong> Is Available<br />
There are some parents in <strong>Torbay</strong> who do require more flexible<br />
childcare and out of ‘normal hours’ provision. While the numbers of<br />
these parents are not statistically significant, there is clearly some<br />
demand for childcare which meets the needs of shift workers and which<br />
opens earlier, for example from 7.30am. There was also a limited call<br />
for additional childcare available at the weekends.<br />
In terms of supply, there is childcare available which offers earlier<br />
Although the cost<br />
of childcare in<br />
<strong>Torbay</strong> is lower<br />
than national and<br />
regional averages,<br />
some of the more<br />
expensive childcare<br />
can be found in<br />
areas where income<br />
deprivation is<br />
an issue<br />
opening times. Many childminders do offer provision which opens<br />
earlier and closes later, there are also some who offer care overnight<br />
and at the weekend. For parents who require more flexibility from their<br />
childcare arrangements, childminders could well be a viable option.<br />
This assessment would recommend that the numbers of parents who<br />
require more flexible childcare and out of ‘normal hours’ care is not high<br />
enough to warrant setting up additional provision to meet these needs,<br />
as there is currently a level of supply (primarily through childminders)<br />
which could meet the requirements of these parents.<br />
Affordability<br />
Areas which rank highly for overall deprivation and income deprivation<br />
have the lowest occupancy rates across <strong>Torbay</strong> this could suggest that<br />
families in these areas such as Tormohun and Watcombe are unable to<br />
afford childcare, this can be seen in Figures 65a and 65b.<br />
Although the cost of childcare in <strong>Torbay</strong> is lower than national and<br />
regional averages, some of the more expensive childcare can be found<br />
in areas where income deprivation is an issue, areas such as Watcombe,<br />
Blatchcombe and Roundham with Hyde, as outlined in Figure 65a and<br />
65c.<br />
All registered childcare is eligible for parents to use the childcare<br />
element of their Working Tax Credits and we know from HM Revenue<br />
and Customs data that across <strong>Torbay</strong> 7% of families in 2005 were<br />
benefiting from this (21.5% of lone parents). However, consultation with<br />
parents showed that some parents find the system difficult and the bad<br />
press associated with the tax credits system does not fill parents with<br />
confidence in applying for benefits they are / could be entitled to.<br />
Specific Needs<br />
It is recommended that this area is one which needs further<br />
investigation, outside of this assessment. Providers informed us<br />
through this assessment that they are able to take children with<br />
disabilities / SEN / additional needs. Although providers do require<br />
additional support with resources to help them meet the needs of<br />
children. However, from a parent’s perspective trying to find childcare<br />
for disabled children has proved difficult at times and Portage workers<br />
have had to assist some parents in finding the most appropriate care.
9.0<br />
SUMMARY OF KEY FINDINGS<br />
56
9.0 SUMMARY OF KEY FINDINGS<br />
57<br />
Across <strong>Torbay</strong> the numbers of children in the age range 0 to 14 are not<br />
equally distributed, Ellacombe, Watcombe, Blatchcombe and St Marys<br />
with Summercombe have the highest proportion of children and young<br />
people in this age group. In terms of population forecasts, the early<br />
years age group (0 to 5) is expected to see an increase of<br />
approximately 12.9% over the next 25 years, while the population of<br />
children aged 5 and above is set to decrease in the short term but<br />
increase overall over the next 25 years.<br />
The rate of unemployment in <strong>Torbay</strong> is slightly higher compared to<br />
national and regional averages and the wards of Tormohun in Torquay<br />
and Roundham with Hyde in Paignton have the highest rates of<br />
unemployment locally. Average earnings in <strong>Torbay</strong> are lower than<br />
national and regional averages, with 44.2% of people earning less than<br />
£250 a week. In terms of income deprivation, 38 of the 89 super output<br />
areas in <strong>Torbay</strong> rank in the 30% most deprived.<br />
With regards to the free entitlement for 3 and 4 year olds there is<br />
enough supply of places to ensure that every child can access a place<br />
and we can safely assume that the majority of 3 and 4 year olds are<br />
accessing some of their free entitlement. The majority of 3 and 4 year<br />
olds were accessing at least four sessions a week.<br />
For parents, the PVI sector appears to be able to meet the needs of<br />
those who work because they can offer more flexibility and can provide<br />
more ‘wrap around’ care compared to the maintained sector. The one<br />
point of entry into schools appears to have had an impact on both<br />
providers in the PVI sector and parents. For parents it would seem that<br />
there is more competition / demand for places as children are only<br />
moving up to school once a year. Parents want to ensure that when<br />
their children are entitled to their free sessions, they will get what they<br />
want, even if it means having to pay for an extra term.<br />
Across all types of provision (excluding maintained nurseries) there are<br />
a total of 2,825 registered childcare places available for children aged 0<br />
to 14 and up to 17 for disabled children. This means there are 12.9<br />
registered places per 100 children in <strong>Torbay</strong>. Geographically, Shiphay<br />
with the Willows and St Marychurch have the highest numbers of<br />
childcare places per 100 children, while Ellacombe, Cockington with<br />
Chelston and Preston have the lowest level of places available per 100<br />
children.<br />
For children aged under 5, Shiphay with the Willows, St Marychurch and<br />
Roundham with Hyde have the highest numbers of registered childcare<br />
places. The type of provision available for children under the age of 5 is<br />
not always equally distributed across <strong>Torbay</strong>. A third of the wards only<br />
have two types of provision, for example, provision in Ellacombe is made<br />
up by a playgroup and childminders.<br />
For children aged under 2 there are 10.7 registered places per 100<br />
children across <strong>Torbay</strong>. Shiphay with the Willows and St Marychurch<br />
have the highest number of places available. In some areas (Ellacombe<br />
for example) the availability of places for children under 2 is limited and<br />
only provided through childminders.<br />
In terms of out of school care there are 24 registered out of school<br />
childcare providers in <strong>Torbay</strong> which generate a total of 3.2 places per<br />
100 children. Geographically the areas with the highest number of out<br />
of school places available are Clifton with Maidenway, Goodrington with<br />
Roselands and Ellacombe.<br />
Childminders appear to offer the best flexibility in providing care<br />
outside of normal working hours, with 11% being able to provide care 24<br />
hours a day if required.<br />
All providers told us that they are able to take children with disabilities,<br />
special educational or additional needs, although they acknowledged<br />
that they did require extra support, but were happy to ask for this.
The average hourly rate parents paid for childcare in 2007 was £2.87,<br />
although charges vary from types of provider to the age of the child<br />
attending. It does not follow that areas with the lowest childcare costs<br />
have the lowest incomes.<br />
Based on take up of childcare in September 2007, the average rate of<br />
occupancy across <strong>Torbay</strong> was 56.6% and if we consider the occupancy<br />
rates alone then areas where there could be high demand are in<br />
Paignton, especially in Clifton with Maidenway and in Goodrington with<br />
Roselands. Based on these occupancy rates, three wards in Torquay<br />
(Watcombe, Tormohun and Wellswood) show the lowest levels of<br />
occupancy across <strong>Torbay</strong>. Occupancy rates for children under the age<br />
of 2 tended to be higher compared to other age groups. There was<br />
higher occupancy in places for children aged 2 to 5 in Paignton<br />
compared to other areas.<br />
The majority of parents (70%) are using family and friends as their<br />
childcare arrangements.<br />
Providers indicated that there is more demand for childcare before and<br />
after school at this present time and less demand for childcare for<br />
children under the age of 5.<br />
Recommendations from friends and family are important in a parent’s<br />
choice of childcare.<br />
Parents found it was more difficult to find suitable care for children<br />
aged under 2 and out of school care, both after school and in the<br />
holidays.<br />
A third of parents felt there should be more childcare where they lived,<br />
with high proportions of these parents living in Brixham, Goodrington<br />
with Roselands and St Marychurch.<br />
There is demand for more flexible hours and out of normal hours care,<br />
to meet the needs of parents who work shift patterns, although this is<br />
fairly limited.<br />
Just over half of parents thought that their childcare costs were<br />
reasonable, although the issue of tax credits is clearly contentious.<br />
From an inclusion perspective, parents who have children with a<br />
disability, SEN or additional need said that they did have difficulty trying<br />
to find suitable childcare arrangements. Help from the portage workers<br />
in finding childcare was appreciated.<br />
For those employers who did respond to the consultation, a couple said<br />
that childcare was an issue with regard to staff retention and new<br />
mothers returning to work after maternity leave.<br />
The main reasons young people gave for not being able to do the<br />
activities they wanted were because they were not offered near their<br />
homes, they actually just wanted to spend time with their friends, they<br />
were too expensive and the activity is not offered at the right times.<br />
9.0 SUMMARY OF KEY FINDINGS<br />
58
Acknowledgements<br />
The Early Years and <strong>Childcare</strong> Service would like to thank parents, providers and<br />
employers who gave up their time to help us with this assessment.<br />
Also a big thank you to Jeanne Cook (Pre-School Learning Alliance) and Lesley<br />
Nixon-Pearson (Devon Childminding Association) for assisting with visits and<br />
gathering data.<br />
A number of staff from across <strong>Torbay</strong> <strong>Council</strong> also provided their help and<br />
assistance in completing this assessment, for which we are very grateful.<br />
All maps in this document are based upon Ordnance Survey material with the<br />
permission of Ordnance Survey on behalf of the Controller of HMS Office.<br />
© Crown copyright. Unauthorised reproduction infringes Crown copyright<br />
and may lead to prosecution or civil proceedings.<br />
Designed and produced by HD Design Limited.
<strong>Torbay</strong> Early Years Play and <strong>Childcare</strong> Service<br />
T: 01803 207926 email: earlyyears@torbay.gov.uk<br />
website: www.torbay.gov.uk/index/education/early-years.htm