The Netherlands: Health System Review 2010
The Netherlands: Health System Review 2010
The Netherlands: Health System Review 2010

Create successful ePaper yourself
Turn your PDF publications into a flip-book with our unique Google optimized e-Paper software.
<strong>Health</strong> systems in transition <strong>The</strong> <strong>Netherlands</strong> 9<br />
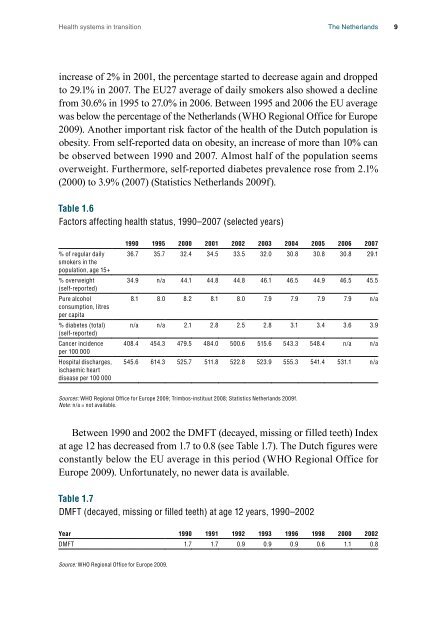
increase of 2% in 2001, the percentage started to decrease again and dropped<br />
to 29.1% in 2007. <strong>The</strong> EU27 average of daily smokers also showed a decline<br />
from 30.6% in 1995 to 27.0% in 2006. Between 1995 and 2006 the EU average<br />
was below the percentage of the <strong>Netherlands</strong> (WHO Regional Office for Europe<br />
2009). Another important risk factor of the health of the Dutch population is<br />
obesity. From self-reported data on obesity, an increase of more than 10% can<br />
be observed between 1990 and 2007. Almost half of the population seems<br />
overweight. Furthermore, self-reported diabetes prevalence rose from 2.1%<br />
(2000) to 3.9% (2007) (Statistics <strong>Netherlands</strong> 2009f).<br />
Table 1.6<br />
Factors affecting health status, 1990–2007 (selected years)<br />
% of regular daily<br />
smokers in the<br />
population, age 15+<br />
% overweight<br />
(self-reported)<br />
Pure alcohol<br />
consumption, litres<br />
per capita<br />
% diabetes (total)<br />
(self-reported)<br />
Cancer incidence<br />
per 100 000<br />
Hospital discharges,<br />
ischaemic heart<br />
disease per 100 000<br />
1990 1995 2000 2001 2002 2003 2004 2005 2006 2007<br />
36.7 35.7 32.4 34.5 33.5 32.0 30.8 30.8 30.8 29.1<br />
34.9 n/a 44.1 44.8 44.8 46.1 46.5 44.9 46.5 45.5<br />
8.1 8.0 8.2 8.1 8.0 7.9 7.9 7.9 7.9 n/a<br />
n/a n/a 2.1 2.8 2.5 2.8 3.1 3.4 3.6 3.9<br />
408.4 454.3 479.5 484.0 500.6 515.6 543.3 548.4 n/a n/a<br />
545.6 614.3 525.7 511.8 522.8 523.9 555.3 541.4 531.1 n/a<br />
Sources: WHO Regional Office for Europe 2009; Trimbos-instituut 2008; Statistics <strong>Netherlands</strong> 2009f.<br />
Note: n/a = not available.<br />
Between 1990 and 2002 the DMFT (decayed, missing or filled teeth) Index<br />
at age 12 has decreased from 1.7 to 0.8 (see Table 1.7). <strong>The</strong> Dutch figures were<br />
constantly below the EU average in this period (WHO Regional Office for<br />
Europe 2009). Unfortunately, no newer data is available.<br />
Table 1.7<br />
DMFT (decayed, missing or filled teeth) at age 12 years, 1990–2002<br />
Year 1990 1991 1992 1993 1996 1998 2000 2002<br />
DMFT 1.7 1.7 0.9 0.9 0.9 0.6 1.1 0.8<br />
Source: WHO Regional Office for Europe 2009.