LONGSHORE SEDIMENT RANSPORT PATTERN ... - GeoEcoMar
LONGSHORE SEDIMENT RANSPORT PATTERN ... - GeoEcoMar
LONGSHORE SEDIMENT RANSPORT PATTERN ... - GeoEcoMar

You also want an ePaper? Increase the reach of your titles
YUMPU automatically turns print PDFs into web optimized ePapers that Google loves.
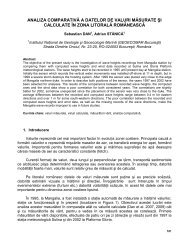
L. Giosan et al. - Longshore Sediment Transport Pattem along Romanian Danube Delta Coast<br />
of Engineers (Hanson and Kraus, 1989), The 140<br />
km-long area extending from Sulina to Midia was<br />
divided in six sectors according to the shoreline<br />
mean orientation (Fig.7) and the potential net<br />
sediment transport was computed for each of<br />
them. The resulting patterns were compared to the<br />
transport rates computed from the sand budget.<br />
RESULTS<br />
The general pattern of the net longshore<br />
transport provided by the sediment budget<br />
compared favourably to that calculated by wave<br />
energy flux method (Fig.8, 9). The net longshore<br />
sediment transport along the entire studied coast is<br />
high on average, mainly as a result of both the<br />
prevailing E-NE waves superimposed on NNE-<br />
SSE general orientation of the coast.<br />
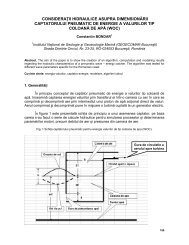
Sulina-Sfdntu Gheorghe<br />
farther south because of an increase in the<br />
submerged beach slope (Fig.7) and the sheltering<br />
effect of Sulina jetties.<br />
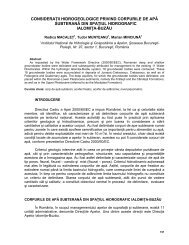
From Sulina to SfAntu Gheorghe, the resulting<br />
net sediment transport scheme was basically<br />
made up of two cells (Fig.8, 10): a sector of<br />
northward directed transport situated immediately<br />
south of the Sulina jetties with an average rate of<br />
190,000 m"/year (ranging between 130,000<br />
m"/year at 6 m depth, and 250,000 m'/year at 12<br />
m depth) and a longer sector of southward<br />
Fig.7 Bathymetry of the study area, and the average<br />
orientation of different coast sectors used in computing the<br />
potential longshore sediment transport.<br />
transport farther south to SfAntu Gheorghe which<br />
had an average rate of 620,p00 m'/year (with a<br />
rafige between 415,000 m'/year and 830,000<br />
4-t<br />
-/--'---.<br />
m"/year). The magnitude of the transport in the<br />
northern cell does not explain the shoaling rate of<br />
at least 500,000 m'/year south of Sulina jetties<br />
(Bondar et al., 1992). Presumably the artificial<br />
nourishment of the beach with an unknown<br />
c-,<br />
quantity of sand, is the main factor affecting the<br />
budget there. The potential transport calculation<br />
also showed a two-cell pattern, but for the northern<br />
cell both the length and the net transport were less<br />
than those obtained from the sand budget. The<br />
two-cell pattern is the result of the sheltering of<br />
waves coming from the NE quadrant, and<br />
diffraction around the jetties. The poor quality of<br />
wave data, poor performance of the wave<br />
refraction model adjacent to jetties, the corrupted<br />
sand budget, and probably the existence of an<br />
attached anticyclonic eddy in this shadow zone<br />
(Almazov et al., 1963), all concur in creating the<br />
difference between patterns. Other investigators<br />
have found that closed attached eddies may from<br />
in the lee of capes, jetties, or other topographic<br />
indentations of the coast, with consequent<br />
modifications to local distributions of sediment<br />
deposition (Ferentinos and Collins, 1980; Davies et<br />
al., 1995). In the southern cell, the net transport<br />
increased from zero at the nodal point, up to<br />
800,000 mt/year at CAsla VSdanei, remaining fairly<br />
constant up to the cell end, at Sf6ntu Gheorghe<br />
(Fig.8). The sediment transport rate north of C6sla<br />
VSdanei is lower relative to the rate of transport<br />
a<br />
05<br />
Suhrfl<br />
MDurh<br />
r0<br />
l<br />
*;-l;,-<br />
15 20 2s<br />
AIONGSHOnE DISTANCE {km)<br />
40 45<br />
Sncdin hled<br />
50<br />
Fig.8 Patterns of net longshore transport (circles) and<br />
potential transport (line) between Sulina and the southern tip of<br />
Sacalin lsland.<br />
t<<br />
ai^ |<br />
tE n,<br />
/- ,2<br />
ls o<br />
E<br />
^ -o.s<br />
d0 s0 60<br />
ciltritr<br />
70 80 90 100 ll0<br />
Porxh<br />
110 I30<br />
ctrihcrPil<br />
140<br />
llhlir<br />
^ron,rr,r",j,ln"lrrr^".o,"r,<br />
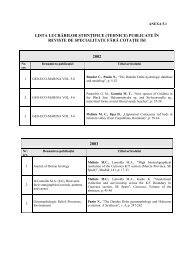
Fig.9 Patterns of net longshore sediment transport for the<br />
deltaic coast south of Sacalin barrier island (using same<br />
conventions as in fig.8).<br />
Sakhalin lsland<br />
Sakhalin island shoreline situated south of<br />
SfAntu Gheorghe mouth receded everywhere<br />
between 1962 and 1993, reaching the highest<br />
retreat rate on the Danube delta coast (66 m/yr.) at<br />
the island centre (Fig.4). Consequently the island<br />
convexity had been reduced (Fig.6). During this<br />
period not only did the island migrate landward but<br />
its length also increased with about 1.5 km at the<br />
northern tip and 5.5 km at the southern end. lt was<br />
,IB<br />
G EO-ECO.M A RI NA, 2/1 9 9 7<br />
National lnstitute of Marine Geology and Geo-ecology of Romania<br />
Proc. lntern. Workshop on 'Fluvial-Marine<br />
lnteractions" in Malnas, Romania, Oct.1-7, 1996<br />
3doo'