New study finds: World Caps & Closures - The Freedonia Group
New study finds: World Caps & Closures - The Freedonia Group
New study finds: World Caps & Closures - The Freedonia Group

You also want an ePaper? Increase the reach of your titles
YUMPU automatically turns print PDFs into web optimized ePapers that Google loves.
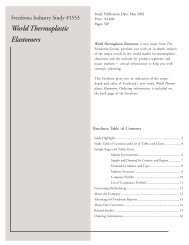
<strong>New</strong> <strong>study</strong> <strong>finds</strong>:<br />
<strong>World</strong><br />
<strong>Caps</strong> & <strong>Closures</strong><br />
with forecasts to 2005 and 2010<br />
• Global demand for caps and closures is forecast to expand at an<br />
annual pace of nearly four percent through 2005, to 1.1 trillion units<br />
<strong>The</strong> best gains are expected in the world's emerging markets,<br />
especially Southeast Asia (particularly China) and Latin America<br />
In 2000, five firms -- Crown Cork & Seal (US), Aptar<strong>Group</strong> (US),<br />
Alcoa (US), Owens Illinois (US) and WhiteCap (Allianz -- Germany)<br />
-- accounted for almost one-fifth of global cap, closure and dispenser<br />
dollar sales
<strong>Freedonia</strong> Industry Study #1452<br />
<strong>World</strong> <strong>Caps</strong> & <strong>Closures</strong><br />
Study Publication Date: July 2001<br />
Price: $4,500<br />
Pages: 307<br />
<strong>World</strong> <strong>Caps</strong> & <strong>Closures</strong>, a new <strong>study</strong> from <strong>The</strong> <strong>Freedonia</strong><br />
<strong>Group</strong>, provides you with an in-depth analysis of the<br />
major trends in the world market for caps and closures and<br />
the outlook for product segments and major markets -critical<br />
information to help you with strategic planning.<br />
This brochure gives you an indication of the scope,<br />
depth and value of <strong>Freedonia</strong>'s new <strong>study</strong>, <strong>World</strong> <strong>Caps</strong> &<br />
<strong>Closures</strong>. Ordering information is included on the back<br />
page of the brochure.<br />
Brochure Table of Contents<br />
Study Highlights ............................................................................... 2<br />
Study Table of Contents and List of Tables and Charts ................... 4<br />
Sample Pages and Tables from:<br />
Market Environment.................................................... 6<br />
<strong>World</strong> Overview/Materials & Markets ........................ 7<br />
Supply and Demand by Country & Region ................. 8<br />
Market Share ............................................................... 9<br />
Company Profiles ...................................................... 10<br />
List of Companies Profiled ........................................ 11<br />
Forecasting Methodology ............................................................... 12<br />
About the Company ....................................................................... 13<br />
Advantages of <strong>Freedonia</strong> Reports ................................................... 13<br />
About Our Customers .................................................................... 14<br />
Related Studies ............................................................................... 15<br />
Ordering Information..................................................................... 16
2<br />
Study Highlights<br />
* Excluded from the <strong>study</strong> are caps or closures that are an<br />
integral part of the container (e.g., aerosol can valve assemblies,<br />
metal and composite beverage can tops, peel-up aluminum lids);<br />
home canning closures; container lids (e.g., those found on<br />
yogurt or cottage cheese containers); glass, rubber and paperboard<br />
closures; caps and closures used on industrial bulk<br />
containers; flexible (e.g., aluminum foil, twist tie) closures;<br />
champagne overcaps and capsules; and caps and closures used in<br />
nonpackaging applications such as valve covers, distributor caps,<br />
pen caps, food storage container lids, etc.<br />
<strong>World</strong> <strong>Caps</strong> & <strong>Closures</strong> #1452<br />
• Global demand for caps and closures is forecast to<br />
expand at an annual pace of nearly four percent<br />
through 2005, to 1.1 trillion units.<br />
Cap and closure sales will benefit from their increased<br />
use in conjunction with traditionally closureless<br />
packaging media such as gabletop and aseptic drink<br />
cartons, although inroads by metal drink cans and<br />
flexible packaging will limit potential gains.<br />
Plastic closures will continue to supplant traditional<br />
metal and (increasingly) cork types, supported by<br />
technological advances and the ongoing shift from glass<br />
to plastic and paperboard in consumer packaging<br />
applications such as soft drinks and pharmaceuticals.<br />
Beverages will continue to account for over two-thirds<br />
of cap and closure unit demand. Best gains in the<br />
beverage industry are expected among mineral waters<br />
and the increasingly popular "<strong>New</strong> Age" beverages<br />
such as ready-to-drink teas, isotonics and<br />
nutraceuticals.<br />
<strong>The</strong> best gains are expected in the world's emerging<br />
markets, especially Southeast Asia (particularly<br />
China) and Latin America.<br />
In 2000, five firms -- Crown Cork & Seal (US),<br />
Aptar<strong>Group</strong> (US), Alcoa (US), Owens Illinois (US)<br />
and WhiteCap (Allianz -- Germany) -- accounted for<br />
almost one-fifth of global cap, closure and dispenser<br />
dollar sales.<br />
<strong>Freedonia</strong> Industry Study
Study Highlights<br />
<strong>World</strong> Cap & Closure Demand<br />
(billion units)<br />
% Annual Growth<br />
Item 1990 2000 2005 2010 00/90 05/00<br />
Population (mil persons) 5266 6058 6424 6795 1.4 1.2<br />
C&C per capita 128 154 175 202 -- --<br />
Cap & Closure Sales 673 931 1127 Sample 1373 Table 3.3 3.9<br />
By Type:<br />
Plastic 209 417 560 743 7.2 6.1<br />
Metal & Cork 464 514 567 630 1.0 2.0<br />
By Region:<br />
North America 144 209 248 294 3.8 3.5<br />
Western Europe 190 199 212 227 0.5 1.3<br />
Asia/Pacific 154 279 371 495 6.1 5.9<br />
Other 185 244 296 357 2.8 3.9<br />
cents/unit 1.6 1.7 1.8 1.9 0.6 1.1<br />
Cap & Closure Sales (bil $) 11.1 16.0 20.4 26.2 3.7 5.0<br />
© Copyright by <strong>The</strong> <strong>Freedonia</strong> <strong>Group</strong>, Inc.<br />
Asia/Pacific<br />
30.0%<br />
<strong>World</strong> Cap & Closure<br />
Demand by Region, 2000<br />
Western Europe<br />
21.4%<br />
North America<br />
22.4%<br />
Other<br />
26.2%<br />
<strong>World</strong> <strong>Caps</strong> & <strong>Closures</strong> #1452 Order form on last page<br />
3
4<br />
Table of Contents I. EXECUTIVE SUMMARY<br />
Summary Table........................................................ 3<br />
Tables and Charts are featured for each region and<br />
country. Historical data and forecasts are presented<br />
for 1995, 2000, 2005 and 2010.<br />
For each country/region, the following are given:<br />
Population<br />
$ GDP per capita<br />
Gross Domestic Product<br />
% food & beverage<br />
Food & Beverage Value-Added<br />
$ <strong>Caps</strong> & <strong>Closures</strong>/capita<br />
$ <strong>Caps</strong> & <strong>Closures</strong>/000$ GDP<br />
$ <strong>Caps</strong> & <strong>Closures</strong>/000$ food & beverage<br />
Cap & Closure Sales<br />
cents/unit<br />
By Material:<br />
Plastic<br />
Metal<br />
Cork<br />
By Market:<br />
Beverages:<br />
Soft Drinks<br />
Beer<br />
Other<br />
Food<br />
Pharmaceuticals<br />
Other<br />
net exports<br />
Cap & Closure Shipments<br />
II. MARKET ENVIRONMENT<br />
General ........................................................................ 4<br />
<strong>World</strong> Economic Overview ......................................... 5<br />
Recent Economic Performance................................ 5<br />
Macroeconomic Outlook......................................... 8<br />
Table - <strong>World</strong> GDP by Region ............................. 9<br />
<strong>World</strong> Population Overview ........................................ 9<br />
Table - <strong>World</strong> Population by Region ..................... 11<br />
<strong>World</strong> Consumer Nondurables Trends ..................... 11<br />
Beverages ............................................................... 12<br />
Table - <strong>World</strong> Ready-to-Drink Beverage<br />
Consumption by Region .................................. 14<br />
Food ...................................................................... 15<br />
Table - <strong>World</strong> Food & Beverage<br />
Manufacturing Value-Added by Region ........... 17<br />
Pharmaceuticals ..................................................... 17<br />
Table - <strong>World</strong> Pharmaceutical<br />
Shipments by Region ....................................... 19<br />
Cosmetics, Toiletries & Cleaning Preparations..... 19<br />
Table - <strong>World</strong> Cosmetic, Toiletry & Cleaning<br />
Preparation Shipments by Region & Type ....... 22<br />
<strong>World</strong> Packaging Outlook ......................................... 22<br />
Environmental & Regulatory Overview ..................... 25<br />
International Trade ................................................... 28<br />
Table - Trade Flows in <strong>Caps</strong> & <strong>Closures</strong>............... 29<br />
III. CAP & CLOSURE MATERIALS & MARKETS<br />
Materials ................................................................... 30<br />
Table - <strong>World</strong> Cap & Closure<br />
Demand by Material ........................................... 31<br />
Chart - <strong>World</strong> Cap & Closure<br />
Demand by Material ........................................... 32<br />
Plastic .................................................................... 32<br />
<strong>World</strong> <strong>Caps</strong> & <strong>Closures</strong> #1452 <strong>Freedonia</strong> Industry Study
Table - <strong>World</strong> Plastic Cap & Closure<br />
Demand by Region .......................................... 34<br />
Metal ..................................................................... 35<br />
Table - <strong>World</strong> Metal Cap & Closure<br />
Demand by Region .......................................... 36<br />
Cork ...................................................................... 37<br />
Table - <strong>World</strong> Cork Closure Demand by Region .... 39<br />
Markets ..................................................................... 39<br />
Table - <strong>World</strong> Cap & Closure Demand by Market .... 40<br />
Chart - <strong>World</strong> Cap & Closure<br />
Demand by Market, 2000 ................................... 41<br />
Soft Drinks ............................................................ 41<br />
Beer ....................................................................... 43<br />
Other Beverages ..................................................... 45<br />
Food ...................................................................... 47<br />
Pharmaceuticals ..................................................... 47<br />
Other ..................................................................... 49<br />
IV. WORLD OVERVIEW<br />
<strong>World</strong> Demand Overview ......................................... 50<br />
Table - <strong>World</strong> Cap & Closure Demand by Region ..... 51<br />
Per Capita Consumption Trends .............................. 52<br />
Chart - Cap & Closure Demand Per Capita /<br />
Food & Beverage Value Added<br />
Per Capita Relationship, 2000 ............................ 54<br />
V. NORTH AMERICA<br />
General ...................................................................... 55<br />
United States ............................................................. 59<br />
Canada ...................................................................... 66<br />
Mexico ...................................................................... 72<br />
VI. LATIN AMERICA<br />
General ...................................................................... 80<br />
Brazil ......................................................................... 84<br />
Other Latin America ................................................. 91<br />
Market Environment<br />
VII. WESTERN EUROPE<br />
General ...................................................................... 99<br />
France ..................................................................... 107<br />
Germany ................................................................. 115<br />
Italy ......................................................................... 122<br />
Netherlands ............................................................. 129<br />
Spain ....................................................................... 135<br />
United Kingdom...................................................... 141<br />
Other Western Europe ............................................ 150<br />
VIII. EASTERN EUROPE<br />
General .................................................................... 157<br />
Russia ...................................................................... 161<br />
Other Eastern Europe ............................................. 168<br />
IX. AFRICA/MIDEAST<br />
General .................................................................... 175<br />
South Africa ............................................................ 179<br />
Other Africa/Mideast .............................................. 186<br />
X. ASIA/PACIFIC<br />
General .................................................................... 192<br />
Australia .................................................................. 197<br />
China ...................................................................... 204<br />
Japan ....................................................................... 211<br />
Other Asia/Pacific .................................................. 218<br />
XI. INDUSTRY STRUCTURE<br />
General .................................................................... 225<br />
Market Share .......................................................... 227<br />
Chart - <strong>World</strong> Cap & Closure<br />
Market Share, 2000........................................... 229<br />
Market Leaders & Competitive Strategies .............. 229<br />
Marketing................................................................ 233<br />
Mergers & Acquisitions .......................................... 234<br />
Table - Selected Acquisitions & Divestitures....... 236<br />
Cooperative Agreements ......................................... 240<br />
Table - Selected Cooperative Agreements ............ 241<br />
Company Profiles ............................................. 242-307<br />
<strong>World</strong> <strong>Caps</strong> & <strong>Closures</strong> #1452 Order form on last page<br />
5
6<br />
Market Environment<br />
<strong>The</strong> Market Environment Section<br />
discusses key indicators that drive<br />
demand for caps and closures, including<br />
packaging trends and <strong>Freedonia</strong>’s<br />
uniquely developed macroeconomic<br />
indicators.<br />
This information provides you with an<br />
understanding and an analysis of the<br />
climate in which the global caps and<br />
closures industry operates and helps<br />
you build your market strategy to<br />
sustain long-term growth.<br />
<strong>World</strong> <strong>Caps</strong> & <strong>Closures</strong> #1452<br />
<strong>World</strong> Packaging Outlook<br />
MARKET ENVIRONMENT<br />
<strong>The</strong> world market for rigid and flexible packaging in 2000 was estimated at<br />
upwards of $500 billion. <strong>The</strong> largest regional markets are North America,<br />
Western Europe and Asia, each of which accounts for between 25 and 30 percent<br />
SAMPLE PAGE<br />
of global demand. <strong>The</strong> remaining 15 percent or so is consumed by Latin America,<br />
Eastern Europe, Africa, the Mideast and Oceania. <strong>The</strong> world’s developing regions,<br />
while accounting for a relatively modest share of global demand, represent the<br />
fastest growing markets for most types of packaging. As these regions continue to<br />
develop and urbanize at a rapid pace, emerging middle classes with rising disposable<br />
incomes will be better able to satiate their appetites for packaged consumer goods.<br />
<strong>The</strong> packaging industry has become increasingly globalized in recent years, with<br />
leading producers like Crown Cork & Seal extending their reach into every region<br />
of the world. Several factors have contributed to the globalization process. Most<br />
importantly, the world’s largest packaging companies, many of which are based in<br />
North America or Western Europe, have sought to exploit the growth opportunities<br />
presented by developing markets as their home countries have become mature<br />
markets for packaged goods. As large consumer product companies ranging from<br />
Coca-Cola to Procter & Gamble have raised their international profile, their<br />
packaging suppliers have followed them into high growth foreign markets. <strong>The</strong><br />
advent of regional free trade pacts in Western Europe, North America and Latin<br />
America has also facilitated the internationalization of manufacturing industries,<br />
including packaging.<br />
Despite these trends, however, foreign trade in packaging per se (as opposed to<br />
either packaging raw materials or finished packaged goods) remains limited in most<br />
regions. This reflects the high cost of transporting empty containers, which take<br />
up a great deal of space relative to their low cost. Indeed, due to the significance<br />
of transportation costs and the importance of timely delivery, container manufac-<br />
© Copyright by <strong>The</strong> <strong>Freedonia</strong> <strong>Group</strong>, Inc.<br />
<strong>Freedonia</strong> Industry Study
<strong>World</strong> Overview/<br />
Materials & Markets<br />
<strong>The</strong> Overview Sections highlight the<br />
key issues that have affected the global<br />
caps and closures market over the past<br />
ten years and summarize contributing<br />
growth factors.<br />
This information helps you:<br />
• Focus your sales and marketing<br />
efforts on high growth areas.<br />
Propose new areas for development<br />
Materials - Cork<br />
CAP & CLOSURE MATERIALS & MARKETS<br />
Global demand for cork closures is projected to advance almost four percent per<br />
annum through 2005 to 17.4 billion units, slowing a bit from the 1995-2000 pace<br />
and slightly below the closure SAMPLE market average. PAGE However, sales will continue to<br />
outpace growth in world wine production.<br />
Growth of the world wine industry is among the most important indicators of cork<br />
demand, as well over 90 percent of cork stoppers are used to seal wine bottles.<br />
After peaking in the late 1970s, world wine output declined more-or-less steadily<br />
through the early 1990s. Since about 1993, however, production has again<br />
increased, bolstered by favorable weather conditions (which resulted in surplus<br />
European crops in the late 1990s), global economic expansion and new evidence<br />
of the potential health benefits of drinking moderate quantities of wine, especially<br />
red wine. Sales late in the decade, especially of sparkling wines, also received a<br />
boost from celebrations relating to the end of the millennium.<br />
Further gains are expected, although at a slower pace than during the past half<br />
decade. Moreover, cork demand will, at least in the near term, continue to rise<br />
faster than growth in wine output. <strong>The</strong> latter is the result of a number of factors,<br />
including use of a greater share of wine for direct consumption (e.g., as an<br />
ingredient in juices, foods and spirits); the popularity of higher-end varietals, which<br />
are more likely to be corked than sealed in other manners; moderating cork costs,<br />
as demand slows and new cork oak crops mature (approximately 120,000 hectares<br />
of highly productive new cork forests have been planted in Spain and Portugal);<br />
and the development of new SAMPLE applications (e.g., TABLE<br />
foods and personal care products)<br />
outside of the bedrock wine market.<br />
<strong>The</strong> pace of growth will slow, however, as the vast US market cools (largely in<br />
response to weakening consumer spending fundamentals) and corkless formats such<br />
as bag-in-box packaging gain ground. <strong>The</strong> greatest long term threat to cork<br />
<strong>World</strong> <strong>Caps</strong> & <strong>Closures</strong> #1452 Order form on last page<br />
7
8<br />
Supply & Demand<br />
by Country & Region<br />
<strong>The</strong>se Sections analyze supply and<br />
demand trends and consider the<br />
threats and opportunities in each<br />
country and region.<br />
Brazil - Cap & Closure Materials & Markets<br />
Australia - Cap & Closure Shipments & Sales<br />
LATIN AMERICA<br />
In value terms, cap and closure sales in Brazil are forecast to increase 6.3 percent<br />
per annum to $615 million in 2005. In unit terms, sales are projected to rise over<br />
five percent per annum to 55 billion units, accelerating from the 1990s pace.<br />
SAMPLE PAGE<br />
Recovery of the macroeconomy, and of the processed food and beverage industries<br />
in particular, will be the primary growth factors. Also important will be rapid<br />
growth of the noncarbonated drink markets, as well as the slowing penetration of<br />
large (e.g., 1.5- and two-liter) PET soft drink bottles.<br />
Item<br />
(million U.S. Plastics dollars) have made rapid inroads in the Brazilian closure market over the past<br />
decade, tracking the penetration of plastic bottles in the nonalcoholic beverage,<br />
food and consumer chemical markets. Metal closures will continue to lead the<br />
1990 mix, however, 1995 holding 2000 a large 2005 majority 2010 of the bedrock beverage market outside of<br />
the soft drink and (much smaller) wine markets, which are now respectively<br />
Population (mil persons) 17.1 18.1 19.0 19.9 20.7<br />
controlled by plastic and cork stoppers.<br />
$ GDP per capita South 17250 Africa 18840 - Cap 22260 & Closure 25030 Sales 27920 by Material & Market<br />
Gross Domestic Product (bil US98$) 295 341 423 498 578<br />
While Brazil consumes more (million soft drinks units) than beer, the latter has surpassed soft<br />
% food & bev 2.8 2.5 2.3 2.3 2.2<br />
Food & Bev Value-Added (bil US98$) 8.2<br />
drinks as<br />
8.6<br />
the largest<br />
9.9<br />
single cap<br />
11.3<br />
and closure<br />
12.8<br />
market over the past half decade or so.<br />
$ C&C/capita<br />
Item<br />
This largely reflects changes in the beverage packaging mix. While glass beer<br />
1990 1995 2000 2005 2010<br />
7.6 bottles have 8.4 lost share 9.5 to closureless 11.1 metal 12.8cans,<br />
growth in the beer market has<br />
$ C&C/000$ GDP Cap & Closure 0.44 meant Sales that 0.45 (mil demand $) 0.43 for beer bottles, 0.44 and 61 0.46 hence closures 69 such 80 as steel crowns, 100 has 125<br />
$ C&C/000$ food & bev cents/unit 15.9 fallen off 17.7 only modestly 18.2 since 19.5 the mid 0.77 20.7 1990s. By 0.81contrast, 0.84 glass soft 0.92 drink bottles 1.00<br />
in Brazil have been supplanted not only by cans but also by PET containers.<br />
Cap & Closure Sales Cap & Closure 130 While Sales the 152 latter also 180 use closures, 220 they 7880 tend 265 to 8475 be much larger 9480 than 10900 their glass 12555<br />
net exports<br />
counterparts; most fall into the one- to two-liter range, versus 300-milliliters for<br />
By Material: -15 -25 -30 -20 -10<br />
glass. As such, far fewer closures are now required per volume of soft drinks.<br />
Plastic 3130 3773 4590 5705 7065<br />
Cap & Closure Shipments<br />
© Copyright by <strong>The</strong> <strong>Freedonia</strong> <strong>Group</strong>, Inc.<br />
Metal<br />
Cork<br />
115 127 150 200 4695 255 4612 4780 5060 5330<br />
However, these dynamics have largely run their course, with glass now accounting<br />
55 90 110 135 160<br />
SAMPLE TABLE<br />
By Market:<br />
Beverages 6265 6565 7040 7875 8850<br />
Soft Drinks 1625 1905 2160 2550 3000<br />
Beer 3400 3200 3100 3150 3200<br />
Other 1240 1460 1780 2175 2650<br />
Food 350 420 580 750 960<br />
Pharmaceuticals 40 50 60 75 95<br />
Other 1225 1440 1800 2200 2650<br />
<strong>World</strong> <strong>Caps</strong> & <strong>Closures</strong> #1452<br />
© Copyright by <strong>The</strong> <strong>Freedonia</strong> <strong>Group</strong>, Inc.<br />
<strong>Freedonia</strong> Industry Study
Industry Structure<br />
Sample page from<br />
<strong>Freedonia</strong> Industry Study<br />
Gain #1111 a better <strong>World</strong> global Security understanding Products of & Sys-<br />
your temscompetition<br />
and analyze your<br />
company's position in the industry with<br />
information about:<br />
market share<br />
market leaders<br />
competitive strategies<br />
marketing<br />
mergers & acquisitions<br />
cooperative agreements<br />
Marketing<br />
INDUSTRY STRUCTURE<br />
As the end-user base (e.g., major food and beverage firms) has consolidated and<br />
closure systems have become more sophisticated, marketing requirements have<br />
become a rather formidable impediment to entry in the highly competitive caps<br />
and closures industry. This is especially true given the trend among end users<br />
toward consolidating their packaging supply base among a few major producers<br />
capable of offering custom development services and a full range of products on a<br />
global basis.<br />
SAMPLE PAGE<br />
In general, end users of caps and closures evaluate potential vendors according to<br />
price, product quality, product mix, technical support capabilities, company<br />
reputation and service factors. <strong>The</strong> primary competitive factors in this industry<br />
are generally price, performance and the ability to develop innovative products.<br />
Marketing dexterity is particularly important given the relatively low level of<br />
product differentiation in most applications. Since many cap and closure vendors<br />
market similar product lines, customers often select suppliers on the basis of<br />
service factors. Service encompasses a wide assortment of variables, including<br />
delivery time, credit terms, emergency shipments, special order production runs,<br />
and the design and engineering support available. In recent years, the ability to<br />
shorten lead times and bring new products to market quickly has also emerged as a<br />
critical competitive variable in the packaging industries of the developed world,<br />
closures not excepted.<br />
Firms in the cap and closure industry are increasingly emphasizing custom services<br />
designed to meet individual end-user specifications. Since standardized, stock caps<br />
and closures are purchased almost solely on the basis of price, the ability to custom<br />
design and produce specialty closures represents a significant competitive<br />
© Copyright by <strong>The</strong> <strong>Freedonia</strong> <strong>Group</strong>, Inc.<br />
<strong>World</strong> <strong>Caps</strong> & <strong>Closures</strong> #1452 Order form on last page<br />
9
Company Profiles<br />
<strong>The</strong> profiles section analyzes 37<br />
companies active in the world caps<br />
and closures industry. <strong>The</strong>se profiles<br />
represent a sampling or cross-section<br />
of the types of companies involved in<br />
the industry.<br />
Divisions, subsidiaries, joint<br />
ventures, etc., are discussed under<br />
appropriate parent companies.<br />
Sources for profiles included:<br />
Information provided by<br />
key staff members in the<br />
respective companies<br />
Annual reports<br />
10-K reports<br />
Security analysts reports<br />
Corporate product literature<br />
<strong>World</strong> <strong>Caps</strong> & <strong>Closures</strong> #1452<br />
10<br />
Allianz AG<br />
Koeniginstrasse 28<br />
80802 Munich<br />
Germany<br />
49-89-38000<br />
http://www.allianz.com<br />
White Cap LLC<br />
1140 31st Street<br />
Downers Grove, IL 60515<br />
630-515-8383<br />
http://www.whitecapinc.com<br />
COMPANY PROFILES<br />
<strong>The</strong> Company is active in the worldwide caps and closures industry through its<br />
Allianz Capital Partners GmbH subsidiary (Germany). <strong>The</strong> subsidiary’s operations<br />
include AV Packaging GmbH (Germany), a joint venture that is 51-percent owned<br />
by Allianz Capital Partners and 49-percent owned by E.ON AG (Germany). AV<br />
Packaging operates in the packaging industry through its 97.2-percent interest in<br />
SAMPLE PAGE<br />
Schmalbach-Lubeca AG (Germany), a leading packaging manufacturer for food,<br />
beverages and other consumer goods. AV Packaging acquired its ownership of<br />
Schmalbach-Lubeca beginning in August 2000, when E.ON folded a 37.4-percent<br />
stake of Schmalbach-Lubeca into AV Packaging. Later in August, E.ON transferred<br />
an additional 59.8-percent interest to AV Packaging.<br />
Schmalbach-Lubeca operated in three units in 2000: White Cap Incorporated,<br />
Beverage Cans and Polyethylene Terephthalate (PET) Containers. Schmalbach-<br />
Lubeca’s revenues outside of Germany annually account for over 80 percent of total<br />
revenues.<br />
Prior to mid 2001, closures and capping technology were produced through USbased<br />
White Cap Incorporated. <strong>The</strong> company operated plants in North America<br />
© Copyright by <strong>The</strong> <strong>Freedonia</strong> <strong>Group</strong>, Inc.<br />
<strong>Freedonia</strong> Industry Study
Companies<br />
Profiled<br />
Alcan Incorporated<br />
algroup wheaton<br />
Alusuisse Lonza <strong>Group</strong> Limited<br />
fibrenyle<br />
Wheaton Science Products<br />
Alcoa Incorporated<br />
MCG <strong>Closures</strong> Limited<br />
Southern Plastics Incorporated<br />
Allianz AG<br />
AV Packaging GmbH<br />
Schmalbach-Lubeca AG<br />
White Cap LLC<br />
ALTANA AG<br />
DS-Chemie GmbH<br />
Alucaps Mexicana SA de CV<br />
Alucapvit SpA<br />
<strong>Caps</strong>ulas Metalicas SA<br />
Daniel Montgomery & Son Limited<br />
Metal <strong>Closures</strong><br />
Amcor Limited<br />
Bericap Incorporated<br />
Aptar<strong>Group</strong> Incorporated<br />
Emsar Incorporated<br />
Englemann (H.) SA<br />
Seaquist <strong>Closures</strong> LLC<br />
Somova Srl<br />
Bericap GmbH & Company<br />
Bericap Incorporated<br />
Berry Plastics Corporation<br />
<strong>Caps</strong>ol SpA<br />
Cardinal Packaging Incorporated<br />
CPI Holding Corporation<br />
Poly-Seal Corporation<br />
Companhia de Bebidas das Americas<br />
AmBev<br />
Corticeira Amorim SGPS SA<br />
Amorim Cork America Incorporated<br />
Cork & Seals Pty Limited<br />
Industria Corchera SA<br />
Croma SA<br />
Crown Cork & Seal Company Incorporated<br />
Risdon-Pharma<br />
Zeller Plastik Incorporated<br />
Dragon Plastics Limited<br />
FEMSA<br />
<strong>Group</strong>e Massilly<br />
Bannex International Incorporated<br />
Guala <strong>Closures</strong> SpA<br />
Indesco International Incorporated<br />
AFA Products Incorporated<br />
Continental Sprayers International Incorporated<br />
Industrias Innopack SA de CV<br />
ZapatA Innovative <strong>Closures</strong> Incorporated<br />
Manaksia <strong>Group</strong><br />
Nampak Limited<br />
Bevcap<br />
Menshen Packaging UK Limited<br />
Nord Est <strong>Group</strong><br />
ARMEP<br />
Ileos<br />
Innocos<br />
Niob Plastique<br />
Novembal<br />
Owens-Illinois Incorporated<br />
Pechiney<br />
Capalux<br />
Cebal<br />
Techpack International<br />
Pepsi-Gemex SA de CV<br />
Portola Packaging Incorporated<br />
CapSnap Europe Packaging GmbH<br />
Consumer Cap Corporation<br />
Northern Engineering and Plastics Corporation<br />
Shanghai Portola Packaging Company<br />
Rexam plc<br />
Royal Ten Cate NV<br />
Sabaté<br />
Sibel<br />
Suber<br />
Saint-Gobain<br />
Calmar Incorporated<br />
Samhwa Crown & Closure Company Limited<br />
San Miguel Corporation<br />
Silgan Holdings Incorporated<br />
RXI Holdings Incorporated<br />
White Cap LLC<br />
Tetra Laval International SA<br />
Novembal<br />
Toyo Seikan Kaisha Limited<br />
Japan Crown Cork Company Limited<br />
West Pharmaceutical Services Incorporated<br />
<strong>World</strong> <strong>Caps</strong> & <strong>Closures</strong> #1452 Order form on last page<br />
11
12<br />
Forecasting Methodology<br />
<strong>Freedonia</strong> does not just collect and reprint<br />
data; <strong>Freedonia</strong> develops data. Our analysts<br />
thoroughly investigate an industry by<br />
extensively interviewing key industry<br />
participants and analyzing information<br />
from sources such as associations, government<br />
and trade literature. Once this<br />
research is complete, <strong>Freedonia</strong> establishes<br />
one set of forecasts. All writing, editing<br />
and forecasting is done in-house to assure<br />
quality and consistency. In cases where<br />
data does not exist, <strong>Freedonia</strong> develops the<br />
data based on input/output ratios, bills of<br />
materials and flow charts. <strong>The</strong> following<br />
chart summarizes <strong>Freedonia</strong>'s methodology.<br />
<strong>World</strong> <strong>Caps</strong> & <strong>Closures</strong> #1452<br />
<strong>The</strong> <strong>Freedonia</strong><br />
Economics <strong>Group</strong><br />
Consistent framework<br />
of indicators on . . .<br />
Beverage Consumption<br />
Gross Domestic Product<br />
<strong>World</strong> Population<br />
. . . and many others<br />
Extensive Interviews<br />
• Key participants<br />
Industry experts<br />
End-users<br />
Methodology for<br />
<strong>World</strong> <strong>Caps</strong> & <strong>Closures</strong><br />
<strong>Freedonia</strong><br />
In-house Research<br />
Quantitative forecasting<br />
Industry structure & market<br />
share analyses<br />
Product analyses & forecasts<br />
Proprietary<br />
Electronic Database<br />
Trade publications<br />
Government reports<br />
Corporate literature<br />
Online databases<br />
. . . and many others<br />
<strong>Freedonia</strong> Industry Study
About<br />
<strong>The</strong> <strong>Freedonia</strong> <strong>Group</strong><br />
Advantages<br />
of <strong>Freedonia</strong> Reports<br />
<strong>The</strong> <strong>Freedonia</strong> <strong>Group</strong>, Inc. is a leading international industry <strong>study</strong>/<br />
database company.<br />
Since 1985, <strong>Freedonia</strong> has published over 1,600 titles covering areas such<br />
as plastics, chemicals, coatings and adhesives, building materials, industrial<br />
components and equipment, health care, packaging, household goods,<br />
security, and many other industries.<br />
<strong>Freedonia</strong> has produced a wide variety of titles, including:<br />
<strong>World</strong> Beer Containers<br />
Plastic Containers<br />
Labels<br />
Pharmaceutical Packaging<br />
Because <strong>Freedonia</strong> is a reliable information source, our forecasts are cited<br />
in numerous publications such as <strong>The</strong> Wall Street Journal, Packaging<br />
Digest and Plastics <strong>New</strong>s.<br />
In-house operations<br />
Because all of our staff work at the same location, interaction<br />
between analysts and departments provides a strong system<br />
of checks and balances.<br />
Consistency<br />
Our Economics <strong>Group</strong> develops indicators that are used by<br />
all analysts. <strong>The</strong>refore, every <strong>Freedonia</strong> <strong>study</strong> is based on a consistent<br />
set of economic assumptions (GDP, global population, beverage<br />
consumption, etc.).<br />
Reliable forecasts<br />
Because all of our forecasts consider the environment in<br />
which a product or industry is operating, as well as threats<br />
and opportunities to the market, <strong>Freedonia</strong> forecasts are<br />
reliable indicators of future performance.<br />
One-on-one interviews<br />
All studies are produced by conducting interviews with key industry<br />
participants and end-users.<br />
Proprietary electronic database<br />
<strong>Freedonia</strong>’s analysts can tap into an extensive in-house electronic<br />
database containing corporate literature (including private company<br />
information), trade publications, government reports and many<br />
other sources of information.<br />
<strong>World</strong> <strong>Caps</strong> & <strong>Closures</strong> #1452 Order form on last page<br />
13
14<br />
About Our Customers<br />
<strong>World</strong> <strong>Caps</strong> & <strong>Closures</strong> #1452<br />
<strong>Freedonia</strong>'s clients include major US and international companies in the<br />
manufacturing, services, consulting and financial sectors.<br />
Typical purchasers of <strong>Freedonia</strong> studies :<br />
Key Executives<br />
Corporate Planners<br />
Market Researchers<br />
Financial Analysts<br />
Information Centers<br />
<strong>New</strong> Product Developers<br />
Merger & Acquisition Specialists<br />
Since 1985 we have provided research to customers ranging in size from<br />
global conglomerates to one person consulting firms. More than 90% of<br />
the industrial companies in the Fortune 500 use <strong>Freedonia</strong> research to<br />
help with their strategic planning.<br />
Some of <strong>Freedonia</strong>'s customers in the caps and closures industry include:<br />
Alcoa, Crown Cork & Seal, Owens-Illinois and Saint-Gobain.<br />
<strong>Freedonia</strong> Industry Study
Related Studies<br />
From <strong>Freedonia</strong><br />
For more information about<br />
these or other <strong>Freedonia</strong> titles,<br />
please contact us at:<br />
<strong>The</strong> <strong>Freedonia</strong> <strong>Group</strong>, Inc.<br />
Phone: (440) 684-9600<br />
(800) 927-5900<br />
Fax: (440) 646-0484<br />
<strong>World</strong> Pharmaceutical Packaging<br />
<strong>The</strong> world drug packaging industry is analyzed<br />
in this <strong>study</strong>. It presents historical data and forecasts<br />
to 2005 and 2010 by type (e.g., plastic<br />
bottles, blister packs, pouches and strip packs,<br />
tubes, prefillable syringes, vials and ampuls, IV<br />
containers, glass bottles and jars, caps and closures,<br />
secondary containers, shipping containers,<br />
prescription containers, labels); by region and<br />
for major drug-producing countries. <strong>The</strong> <strong>study</strong><br />
also examines the market environment, details<br />
market share and profiles key firms.<br />
#1467. . . . . . . . 9/01. . . . . . . . . . $4,500<br />
Beverage Containers<br />
This <strong>study</strong> analyzes the US rigid and flexible drink<br />
container industry. It presents historical data<br />
(1990, 1995, 2000) and forecasts to 2005 and<br />
2010 for beverage shipments and sales by container<br />
type in both gallon and unit terms. Product<br />
segments include metal cans, plastic bottles<br />
and pouches (by resin), glass bottles and paperboard<br />
containers (composite, gabletop, aseptic<br />
carton and bag-in-box). <strong>The</strong> <strong>study</strong> also discusses<br />
economic variables, details industry structure and<br />
market share, and profiles key firms.<br />
#1462. . . . . . . . 9/01. . . . . . . . . . $3,700<br />
<strong>Caps</strong> & <strong>Closures</strong> -<br />
Private Companies Report<br />
Six private producers each had total cap and closure<br />
sales of over $50 million in 2000, two of<br />
which had over $100 million. All six are active in<br />
the fast-growing plastic packaging segment, and<br />
one is also a leader in metal closures. This report<br />
profiles over 140 private US companies (e.g., Berry<br />
Plastics, Courtesy, Indesco International, Kerr<br />
<strong>Group</strong>, Portola Packaging, ZapatA International).<br />
It also presents market share data, reviews acquisitions,<br />
lists firms by product and location, and<br />
forecasts industry demand.<br />
#1427. . . . . . . . 5/01. . . . . . . . . . $3,200<br />
<strong>World</strong> Beer Containers<br />
Global demand for beer containers will reach 315<br />
billion units in 2005, as the average container<br />
size grows slightly. One-way packaging, including<br />
metal, glass and (increasingly) plastic types,<br />
will further supplant returnable glass bottles, especially<br />
in developing countries. Glass beer bottles<br />
will outpace metal cans. This <strong>study</strong> analyzes the<br />
world beer container industry to 2005 and 2010<br />
by type, material, region and for 23 countries. It<br />
also details market share and profiles key brewers<br />
and beer container producers.<br />
#1416. . . . . . . . 5/01. . . . . . . . . . $4,400<br />
<strong>Caps</strong> & <strong>Closures</strong><br />
US cap and closure demand will grow 5.3% annually<br />
to 2005, driven by a shift in the mix toward<br />
value-added configurations such as dispensing<br />
and child-resistant closures. Also supporting<br />
unit gains will be the development of novel closure<br />
applications like aseptic liquid food packaging,<br />
as well as rising use of dual closure packaging<br />
configurations. This <strong>study</strong> analyzes the $3.8<br />
billion US cap and closure industry to 2005 and<br />
2010 by material, product and market. It also<br />
details market share and profiles key companies.<br />
#1392. . . . . . . . 4/01. . . . . . . . . . $3,700<br />
Paper Versus Plastic in Packaging<br />
Demand for competitive paper and plastic packaging<br />
in the US will reach 86 billion pounds in 2004.<br />
Advances will be stimulated by steady growth in<br />
the foodservice sector and improvements in barrier<br />
properties and strength. Plastic will continue<br />
to encroach on paper’s market share. This <strong>study</strong><br />
analyzes the 77 billion pound US competitive paper<br />
and plastic packaging industry to 2004 and<br />
2009. It provides data and forecasts by material,<br />
type and end-use, presents market share data and<br />
profiles leading companies.<br />
#1357. . . . . . . . 1/01. . . . . . . . . . $3,700<br />
Labels<br />
US shipments of labels will grow nearly 7% annually.<br />
Paper will remain the dominant stock but<br />
plastics will make further inroads. Pressure sensitive<br />
adhesive (PSA) labels, which already account<br />
for over two-thirds of industry value, will continue<br />
capturing market share from glue-applied,<br />
gummed and heat-seal labels. This <strong>study</strong> analyzes<br />
the $9.9 billion US labels industry to 2004 and<br />
2009 by material, application method, printing<br />
technology and use. It also details market share<br />
and profiles key companies.<br />
#1326. . . . . . . . 9/00. . . . . . . . . . $3,700<br />
Plastic Containers<br />
Plastic container demand in the US will grow<br />
over 4% annually. Three-fourths of all plastic containers<br />
by weight are bottles, which will also log<br />
the best growth driven by markets such as drugs,<br />
soft drinks and beer. High density polyethylene<br />
(HDPE) will remain the most widely used resin,<br />
while polyethylene terephthalate (PET) grows the<br />
fastest. This <strong>study</strong> analyzes the $10 billion US<br />
plastic container industry to 2004 and 2009 by<br />
resin, type and market. It also details market<br />
shares and profiles key firms.<br />
#1306. . . . . . . . 8/00. . . . . . . . . . $3,600<br />
<strong>World</strong> <strong>Caps</strong> & <strong>Closures</strong> #1452 Order form on last page<br />
15
Name:<br />
Title:<br />
Company:<br />
Division:<br />
Street:<br />
City/State/Zip:<br />
Country:<br />
Phone:<br />
Email:<br />
For more information about our products,<br />
please call the <strong>Freedonia</strong> Customer Service<br />
Department at (440) 684-9600 or<br />
(800) 927-5900 or fax (440) 646-0484.<br />
THE THE FREEDONIA FREEDONIA GROUP, GROUP, INC.<br />
INC.<br />
767 Beta Drive<br />
Cleveland, OH 44143-2326 USA<br />
Phone: (440) 684-9600 • (800) 927-5900<br />
Fax: (440) 646-0484<br />
F-SM.1452<br />
F-SM.1452<br />
Corporate Use Licenses<br />
Now every decision maker in your organization<br />
can act on the key intelligence found in<br />
all <strong>Freedonia</strong> studies. For an additional<br />
$2,000, you receive unlimited use of an electronic<br />
version (PDF) of the <strong>study</strong>. Place it on<br />
your Intranet, e-mail it to coworkers around<br />
the world, or print it as many times as you<br />
like! Order it today.<br />
(no PO Box please)<br />
Fax:<br />
SHIPPING and HANDLING charges are FREE FREE via UPS<br />
(USA only) or airmail (Outside USA). Express delivery<br />
available at cost. Please inquire.<br />
How to Order<br />
Ordering Information<br />
Fill out the coupon below and mail it to <strong>The</strong> <strong>Freedonia</strong> <strong>Group</strong>, or<br />
send your order by fax (440) 646-0484, E-mail to<br />
info@freedoniagroup.com<br />
Handling and Shipping is FREE<br />
<strong>The</strong>re is NO charge for handling and shipping. In the US we ship via<br />
UPS. Outside the US, we provide free airmail service. If you would<br />
like express delivery, we provide this to you at cost.<br />
Save Fifteen Percent<br />
If you order three (3) different titles at the same time, you can receive a<br />
discount of 15 percent. If your order is accompanied by a check, you may<br />
take a 5 percent cash discount (discounts do not apply to corporate use<br />
licenses)<br />
Use Credit Card<br />
You may charge your order to either Visa, MasterCard or American<br />
Express. Please include your credit card account number, expiration<br />
date and your signature.<br />
Orders Outside of the US<br />
Checks must be paid in US funds and drawn against a US bank. Wire<br />
transfers should be sent to: Fifth Third Bank, Cincinnati, Ohio; <strong>The</strong><br />
<strong>Freedonia</strong> <strong>Group</strong>, Inc.; SWIFT #FTBCUS3C; ABA #042000314;<br />
Account # 830-51814 (please include <strong>study</strong> number and/or invoice<br />
number with all wire transfers).<br />
Additional Copies<br />
Additional copies are available to original purchasers at $400 per title.<br />
Online Access<br />
<strong>The</strong> complete text and tables from our studies and reports can be found<br />
on our Web site www.freedoniagroup.com and through major commercial<br />
online vendors.<br />
TITLE<br />
TITLE<br />
Please check method of payment:<br />
Total: $<br />
Enclosed is my check (5% discount) drawn on a US bank and payable to <strong>The</strong><br />
<strong>Freedonia</strong> <strong>Group</strong>, Inc., in US funds. (Ohio residents add 7% sales tax).<br />
Bill my company MasterCard Visa American Express<br />
MO. YR.<br />
Credit Card # Expiration Date<br />
Signature:<br />
PRICE<br />
PRICE<br />
#1452 <strong>World</strong> <strong>Caps</strong> & <strong>Closures</strong> $4,500<br />
Corporate Use License (add to <strong>study</strong> price)<br />
Additional Print Copies @ $400 Each<br />
+ $2,000