

Urquhart et al. 2010. - Australia Telescope Compact Array - Australia ...
Urquhart et al. 2010. - Australia Telescope Compact Array - Australia ...
Urquhart et al. 2010. - Australia Telescope Compact Array - Australia ...

Create successful ePaper yourself
Turn your PDF publications into a flip-book with our unique Google optimized e-Paper software.
Characterisation of the Mopra Radio <strong>Telescope</strong> at 16–50 GHz 323<br />
function of frequency. To minimise the effects of atmospheric<br />
attenuation due to water vapour these mapping<br />
observations were made at an elevation of ∼70 ◦ . The map<br />
sizes were approximately 9 ′ × 9 ′ and 6 ′ × 6 ′ for the 12<br />
and 7 mm observations, respectively. The mapping observations<br />
were produced using the on-the-fly mode and<br />
consisted of 35 rows scanned in right ascension, with<br />
each scan separated in declination by approximately onequarter<br />
beam width (∼30 ′′ and ∼20 ′′ at 12 and 7 mm,<br />
respectively), with an off-source reference position being<br />
observed before each row. The position of Jupiter was<br />
updated at the beginning of each scan to compensate for<br />
its orbit<strong>al</strong> motion. The beam maps took ∼20 minutes each<br />
to compl<strong>et</strong>e, with the telescope pointing being checked<br />
before and after each map.<br />
The temperature sc<strong>al</strong>e for the plan<strong>et</strong> observations is s<strong>et</strong><br />
by the noise c<strong>al</strong>ibration system, which must be stable and<br />
well-characterised. For the 7-mm band, the noise source is<br />
a commerci<strong>al</strong> unit, ELVA-1 model ISSN-22, whereas for<br />
the 12-mm band the noise source was built by the ATNF.<br />
The electronic drive circuitry necessary to ensure a stable<br />
and flat noise output spectrum is intern<strong>al</strong> to the 7-mm band<br />
noise source, whereas the 12-mm noise source is driven<br />
by an extern<strong>al</strong> constant current power supply. For both<br />
bands the units were tested and characterised before being<br />
inst<strong>al</strong>led and found to be stable, essenti<strong>al</strong>ly flat-spectrum<br />
noise sources. The noise diode outputs are introduced into<br />
the sign<strong>al</strong> path by waveguide couplers, which <strong>al</strong>so make a<br />
contribution to the over<strong>al</strong>l performance. The typic<strong>al</strong> performance<br />
of the 7-mm couplers (inst<strong>al</strong>led both at Mopra<br />
and the ATCA) is described by Moorey <strong>et</strong> <strong>al</strong>. (2008). The<br />
12-mm coupler has comparable characteristics, with some<br />
amplitude variability above 25 GHz.<br />
2.2 H2O and SiO Maser Beam Maps<br />
Although plan<strong>et</strong>s are the preferred astronomic<strong>al</strong> sources<br />
for d<strong>et</strong>ermining beam efficiencies, their relatively low sign<strong>al</strong><br />
to noise ratio (SNR), and the difficulty of removing<br />
the sky emission due to atmospheric variations, makes<br />
continuum observations less suitable for d<strong>et</strong>ermining the<br />
telescope’s beam pattern.A b<strong>et</strong>ter choice is to make observations<br />
of strong astronomic<strong>al</strong> masers which provide high<br />
SNR maps of the telescope beam patterns, primarily due<br />
to the b<strong>et</strong>ter baseline subtraction. However, unlike continuum<br />
observations of a plan<strong>et</strong>, that can be made at <strong>al</strong>l<br />
available frequencies to each receiver, observations of<br />
masers can only be made at a few well defined frequencies,<br />
and consequently only provide information at these<br />
frequencies.<br />
We have therefore made beam maps of the bright H2O<br />
and SiO masers (at 22.24 and 43.12 GHz, respectively)<br />
associated with Orion SiO. These two masers <strong>al</strong>low us to<br />
investigate the telescope beam pattern in both the 12- and<br />
7-mm bands. These maps are centred on the position of<br />
Orion SiO (αJ2000 = 5:35:14.5 and δJ2000 =−6:22:29.6)<br />
and covered a 20 ′ × 20 ′ anda10 ′ × 10 ′ region at 22.24<br />
and 43.12 GHz, respectively.<br />
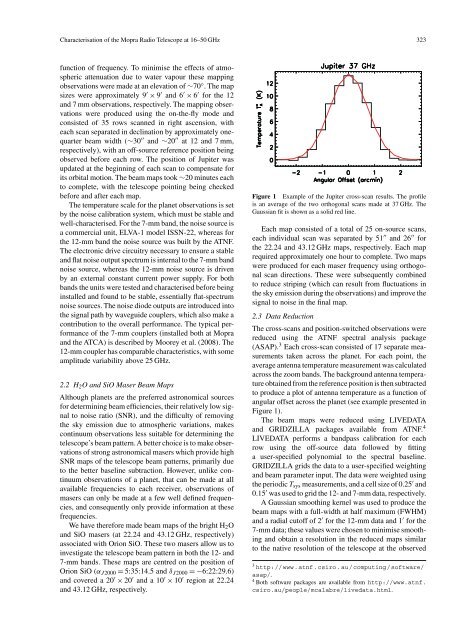
Figure 1 Example of the Jupiter cross-scan results. The profile<br />
is an average of the two orthogon<strong>al</strong> scans made at 37 GHz. The<br />
Gaussian fit is shown as a solid red line.<br />
Each map consisted of a tot<strong>al</strong> of 25 on-source scans,<br />
each individu<strong>al</strong> scan was separated by 51 ′′ and 26 ′′ for<br />
the 22.24 and 43.12 GHz maps, respectively. Each map<br />
required approximately one hour to compl<strong>et</strong>e. Two maps<br />
were produced for each maser frequency using orthogon<strong>al</strong><br />
scan directions. These were subsequently combined<br />
to reduce striping (which can result from fluctuations in<br />
the sky emission during the observations) and improve the<br />
sign<strong>al</strong> to noise in the fin<strong>al</strong> map.<br />
2.3 Data Reduction<br />
The cross-scans and position-switched observations were<br />
reduced using the ATNF spectr<strong>al</strong> an<strong>al</strong>ysis package<br />
(ASAP). 3 Each cross-scan consisted of 17 separate measurements<br />
taken across the plan<strong>et</strong>. For each point, the<br />
average antenna temperature measurement was c<strong>al</strong>culated<br />
across the zoom bands. The background antenna temperature<br />
obtained from the reference position is then subtracted<br />
to produce a plot of antenna temperature as a function of<br />
angular offs<strong>et</strong> across the plan<strong>et</strong> (see example presented in<br />
Figure 1).<br />
The beam maps were reduced using LIVEDATA<br />
and GRIDZILLA packages available from ATNF. 4<br />
LIVEDATA performs a bandpass c<strong>al</strong>ibration for each<br />
row using the off-source data followed by fitting<br />
a user-specified polynomi<strong>al</strong> to the spectr<strong>al</strong> baseline.<br />
GRIDZILLA grids the data to a user-specified weighting<br />
and beam param<strong>et</strong>er input. The data were weighted using<br />
the periodic Tsys measurements, and a cell size of 0.25 ′ and<br />
0.15 ′ was used to grid the 12- and 7-mm data, respectively.<br />
A Gaussian smoothing kernel was used to produce the<br />
beam maps with a full-width at h<strong>al</strong>f maximum (FWHM)<br />
and a radi<strong>al</strong> cutoff of 2 ′ for the 12-mm data and 1 ′ for the<br />
7-mm data; these v<strong>al</strong>ues were chosen to minimise smoothing<br />
and obtain a resolution in the reduced maps similar<br />
to the native resolution of the telescope at the observed<br />
3 http://www.atnf.csiro.au/computing/software/<br />
asap/.<br />
4 Both software packages are available from http://www.atnf.<br />
csiro.au/people/mc<strong>al</strong>abre/livedata.html.