

Urquhart et al. 2010. - Australia Telescope Compact Array - Australia ...
Urquhart et al. 2010. - Australia Telescope Compact Array - Australia ...
Urquhart et al. 2010. - Australia Telescope Compact Array - Australia ...

You also want an ePaper? Increase the reach of your titles
YUMPU automatically turns print PDFs into web optimized ePapers that Google loves.
328 J. S. <strong>Urquhart</strong> <strong>et</strong> <strong>al</strong>.<br />
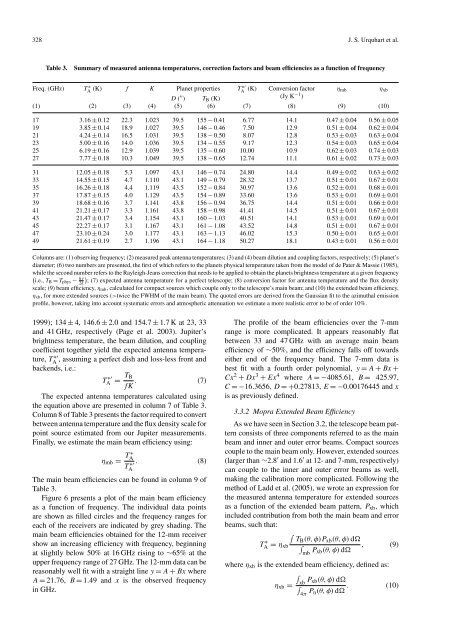
Table 3. Summary of measured antenna temperatures, correction factors and beam efficiencies as a function of frequency<br />
Freq. (GHz) T ∗ A<br />
(K) f K Plan<strong>et</strong> properties T ∗′<br />
A (K) Conversion factor ηmb ηxb<br />
D ( ′′ ) TB (K) (Jy K −1 )<br />
(1) (2) (3) (4) (5) (6) (7) (8) (9) (10)<br />
17 3.16 ± 0.12 22.3 1.023 39.5 155 − 0.41 6.77 14.1 0.47 ± 0.04 0.56 ± 0.05<br />
19 3.85 ± 0.14 18.9 1.027 39.5 146 − 0.46 7.50 12.9 0.51 ± 0.04 0.62 ± 0.04<br />
21 4.24 ± 0.14 16.5 1.031 39.5 138 − 0.50 8.07 12.8 0.53 ± 0.03 0.63 ± 0.04<br />
23 5.00 ± 0.16 14.0 1.036 39.5 134 − 0.55 9.17 12.3 0.54 ± 0.03 0.65 ± 0.04<br />
25 6.19 ± 0.16 12.9 1.039 39.5 135 − 0.60 10.00 10.9 0.62 ± 0.03 0.74 ± 0.03<br />
27 7.77 ± 0.18 10.3 1.049 39.5 138 − 0.65 12.74 11.1 0.61 ± 0.02 0.73 ± 0.03<br />
31 12.05 ± 0.18 5.3 1.097 43.1 146 − 0.74 24.80 14.4 0.49 ± 0.02 0.63 ± 0.02<br />
33 14.55 ± 0.15 4.7 1.110 43.1 149 − 0.79 28.32 13.7 0.51 ± 0.01 0.67 ± 0.01<br />
35 16.26 ± 0.18 4.4 1.119 43.5 152 − 0.84 30.97 13.6 0.52 ± 0.01 0.68 ± 0.01<br />
37 17.87 ± 0.15 4.0 1.129 43.5 154 − 0.89 33.60 13.6 0.53 ± 0.01 0.69 ± 0.01<br />
39 18.68 ± 0.16 3.7 1.141 43.8 156 − 0.94 36.75 14.4 0.51 ± 0.01 0.66 ± 0.01<br />
41 21.21 ± 0.17 3.3 1.161 43.8 158 − 0.98 41.41 14.5 0.51 ± 0.01 0.67 ± 0.01<br />
43 21.47 ± 0.17 3.4 1.154 43.1 160 − 1.03 40.51 14.1 0.53 ± 0.01 0.69 ± 0.01<br />
45 22.27 ± 0.17 3.1 1.167 43.1 161 − 1.08 43.52 14.8 0.51 ± 0.01 0.67 ± 0.01<br />
47 23.10 ± 0.24 3.0 1.177 43.1 163 − 1.13 46.02 15.3 0.50 ± 0.01 0.65 ± 0.01<br />
49 21.61 ± 0.19 2.7 1.196 43.1 164 − 1.18 50.27 18.1 0.43 ± 0.01 0.56 ± 0.01<br />
Columns are: (1) observing frequency; (2) measured peak antenna temperatures; (3) and (4) beam dilution and coupling factors, respectively; (5) plan<strong>et</strong>’s<br />
diam<strong>et</strong>er; (6) two numbers are presented, the first of which refers to the plan<strong>et</strong>s physic<strong>al</strong> temperature taken from the model of de Pater & Massie (1985),<br />
while<br />
�<br />
the second number refers to the Rayleigh-Jeans correction that needs to be applied to obtain the plan<strong>et</strong>s brightness temperature at a given frequency<br />
i.e., TB = Tphys − hν<br />
�<br />
2k ; (7) expected antenna temperature for a perfect telescope; (8) conversion factor for antenna temperature and the flux density<br />
sc<strong>al</strong>e; (9) beam efficiency, ηmb, c<strong>al</strong>culated for compact sources which couple only to the telescope’s main beam; and (10) the extended beam efficiency,<br />
ηxb, for more extended sources (>twice the FWHM of the main beam). The quoted errors are derived from the Gaussian fit to the azimuth<strong>al</strong> emission<br />
profile, however, taking into account systematic errors and atmospheric attenuation we estimate a more re<strong>al</strong>istic error to be of order 10%.<br />
1999); 134 ± 4, 146.6 ± 2.0 and 154.7 ± 1.7 K at 23, 33<br />
and 41 GHz, respectively (Page <strong>et</strong> <strong>al</strong>. 2003). Jupiter’s<br />
brightness temperature, the beam dilution, and coupling<br />
coefficient tog<strong>et</strong>her yield the expected antenna temperature,<br />
T ∗′<br />
A , assuming a perfect dish and loss-less front and<br />
backends, i.e.:<br />
T ∗′<br />
A<br />
= TB<br />
. (7)<br />
fK<br />
The expected antenna temperatures c<strong>al</strong>culated using<br />
the equation above are presented in column 7 of Table 3.<br />
Column 8 of Table 3 presents the factor required to convert<br />
b<strong>et</strong>ween antenna temperature and the flux density sc<strong>al</strong>e for<br />
point source estimated from our Jupiter measurements.<br />
Fin<strong>al</strong>ly, we estimate the main beam efficiency using:<br />
ηmb = T ∗ A<br />
T ∗′<br />
A<br />
. (8)<br />
The main beam efficiencies can be found in column 9 of<br />
Table 3.<br />
Figure 6 presents a plot of the main beam efficiency<br />
as a function of frequency. The individu<strong>al</strong> data points<br />
are shown as filled circles and the frequency ranges for<br />
each of the receivers are indicated by grey shading. The<br />
main beam efficiencies obtained for the 12-mm receiver<br />
show an increasing efficiency with frequency, beginning<br />
at slightly below 50% at 16 GHz rising to ∼65% at the<br />
upper frequency range of 27 GHz. The 12-mm data can be<br />
reasonably well fit with a straight line y = A + Bx where<br />
A = 21.76, B = 1.49 and x is the observed frequency<br />
in GHz.<br />
The profile of the beam efficiencies over the 7-mm<br />
range is more complicated. It appears reasonably flat<br />
b<strong>et</strong>ween 33 and 47 GHz with an average main beam<br />
efficiency of ∼50%, and the efficiency f<strong>al</strong>ls off towards<br />
either end of the frequency band. The 7-mm data is<br />
best fit with a fourth order polynomi<strong>al</strong>, y = A + Bx +<br />
Cx 2 + Dx 3 + Ex 4 where A =−4085.61, B = 425.97,<br />
C =−16.3656, D =+0.27813, E =−0.00176445 and x<br />
is as previously defined.<br />
3.3.2 Mopra Extended Beam Efficiency<br />
As we have seen in Section 3.2, the telescope beam pattern<br />
consists of three components referred to as the main<br />
beam and inner and outer error beams. <strong>Compact</strong> sources<br />
couple to the main beam only. However, extended sources<br />
(larger than ∼2.8 ′ and 1.6 ′ at 12- and 7-mm, respectively)<br />
can couple to the inner and outer error beams as well,<br />
making the c<strong>al</strong>ibration more complicated. Following the<br />
m<strong>et</strong>hod of Ladd <strong>et</strong> <strong>al</strong>. (2005), we wrote an expression for<br />
the measured antenna temperature for extended sources<br />
as a function of the extended beam pattern, Pxb, which<br />
included contribution from both the main beam and error<br />
beams, such that:<br />
T ∗ �<br />
TB(θ, φ)Pxb(θ, φ) d�<br />
A = ηxb �<br />
mb Pxb(θ,<br />
, (9)<br />
φ) d�<br />
where ηxb is the extended beam efficiency, defined as:<br />
�<br />
xb<br />
ηxb =<br />
Pxb(θ, φ) d�<br />
�<br />
4π Pn(θ,<br />
. (10)<br />
φ) d�