Causal risk models of air transport - NLR-ATSI
Causal risk models of air transport - NLR-ATSI
Causal risk models of air transport - NLR-ATSI

You also want an ePaper? Increase the reach of your titles
YUMPU automatically turns print PDFs into web optimized ePapers that Google loves.
<strong>Causal</strong> <strong>risk</strong> <strong>models</strong> <strong>of</strong> <strong>air</strong> <strong>transport</strong><br />
Comparison <strong>of</strong> user needs and model capabilities<br />
Alfred Roelen<br />
i
<strong>Causal</strong> <strong>risk</strong> <strong>models</strong> <strong>of</strong> <strong>air</strong> <strong>transport</strong><br />
Comparison <strong>of</strong> user needs and model capabilities<br />
Proefschrift<br />
ter verkrijging van de graad van doctor<br />
aan de Technische Universiteit Delft,<br />
op gezag van de Rector Magnificus pr<strong>of</strong>. dr. ir. J.T. Fokkema,<br />
voorzitter van het College voor Promoties,<br />
in het openbaar te verdedigen op maandag 10 november 2008 om 15:00 uur<br />
door<br />
Alfred Lambertus Cornelis ROELEN<br />
ingenieur in de Luchtvaart en Ruimtevaart<br />
geboren te Vught<br />
iii
Dit proefschrift is goedgekeurd door de promotor:<br />
Pr<strong>of</strong>. dr. A.R. Hale<br />
Samenstelling promotiecommissie:<br />
Rector Magnificus voorzitter<br />
Pr<strong>of</strong>. dr. A.R. Hale Technische Universiteit Delft, promotor<br />
Pr<strong>of</strong>. dr. B.J.M. Ale Technische Universiteit Delft<br />
Pr<strong>of</strong>. dr. ir. M.J.L. van Tooren Technische Universiteit Delft<br />
Pr<strong>of</strong>. dr. A. Mosleh University <strong>of</strong> Maryland<br />
Pr<strong>of</strong>. dr. ir. A.C. Brombacher Technische Universiteit Eindhoven<br />
Dr. H.A.P. Blom Nationaal Lucht- en Ruimtevaartlaboratorium<br />
© 2008 The author and IOS Press<br />
All rights reserved. No part <strong>of</strong> this book may be reproduced, stored in a retrieval system, or<br />
transmitted, in any form or by any means, without prior permission from the publisher.<br />
ISBN<br />
Keywords: Safety, <strong>risk</strong> modelling, aviation, safety management.<br />
Published and distributed by IOS Press under the imprint Delft University Press<br />
Publisher & Distributor Distributor in the USA and Canada<br />
IOS Press IOS Press, Inc.<br />
Nieuwe Hemweg 6b 4502 Rachael Manor Drive<br />
1013 BG Amsterdam F<strong>air</strong>fax, VA 22032<br />
Netherlands USA<br />
fax:+31-20-687 0019 fax: +1-703-323 3668<br />
email: info@iospress.nl e-mail: sales@iospress.com<br />
LEGAL NOTICE<br />
The publisher is not responsible for the use which might be made <strong>of</strong> the following<br />
information.<br />
PRINTED IN THE NETHERLANDS<br />
iv
“People in those days fancied, as people generally fancy when they catch sight for the first<br />
time <strong>of</strong> a new problem, that it was far easier and simpler than was actually the case; they<br />
did not know till experience taught them how painfully they would be compelled to advance<br />
from step to step, and to unravel the intricate chain <strong>of</strong> causes which have gone to bring the<br />
earth into its present shape; and still less how one principal result <strong>of</strong> the enquiry would<br />
prove that the most interesting questions lay outside the reach <strong>of</strong> human knowledge”.<br />
Leslie Stephen, The playground <strong>of</strong> Europe, Fredonia Books, Amsterdam, The Netherlands,<br />
2004, reprint from the 1910 edition.<br />
v
Acknowledgements<br />
A PhD study has been compared with running a marathon, where every ten kilometres<br />
symbolise one year <strong>of</strong> research [Roelen 1997]. Although this is an interesting comparison, I<br />
believe that a PhD study is better compared with climbing a mountain; even though the<br />
route in general might be known, you’ll have to find your way while you go along and<br />
some bits are easy going, but other sections require all your strength and technical abilities.<br />
You’ll <strong>of</strong>ten think you have the peak in sight, only to discover the mountain continuing<br />
beyond the ridge you believed to be the top. Perhaps more importantly, running a marathon<br />
is a solitary effort, but climbing a mountain is a group endeavour. The rope group is vitally<br />
important for the probability <strong>of</strong> success. The connecting and life-saving rope allows the<br />
weaker to find support from the stronger member <strong>of</strong> the team [Harrer 1988]. A<br />
commonality between running, climbing and a PhD study is <strong>of</strong> course the inverse relation<br />
between ‘distance remaining’ and ‘desire to finish’. But then, even a bit unexpectedly,<br />
you’ll find yourself near the summit. ‘A few more whacks <strong>of</strong> the ice-axe in the firm snow<br />
and we stood on top’ [Hunt 1953]. It is here, on the top <strong>of</strong> the mountain, that one shakes<br />
hands with all members <strong>of</strong> the rope-group, acknowledging their contribution to the success.<br />
First <strong>of</strong> all many thanks to Andrew Hale for persuading me to start this endeavour for being<br />
such a thoughtful and kind promotor. John Lapointe and Kathy Fazen <strong>of</strong> the FAA Tech<br />
Center in Atlantic City and Hok Goei <strong>of</strong> the Transport and Water Management Inspectorate<br />
provided the first opportunity for me to do some serious research on <strong>risk</strong> modelling for <strong>air</strong><br />
<strong>transport</strong>. Ali Mosleh kindly shared his knowledge from the field <strong>of</strong> nuclear safety<br />
engineering and his wisdom in many other disciplines, and this helped me a lot in getting a<br />
firm grip on the subject. The CATS people were indispensable for further development <strong>of</strong><br />
resulting ideas and insights, so thank you Ben Ale, Roger Cooke, Dorota Kurowicka, Pei-<br />
Hui Lin, Oswaldo Morales-Napoles, Linda Bellamy, Louis Goossens, Dan Ababei, John<br />
Spouge, John Cooper and Rob van der Boom. While being involved in the various projects<br />
that were directly or indirectly related to the research topic, I have enjoyed working<br />
together with my colleagues at <strong>NLR</strong>, in particular Peter van der Geest, Gerard van Es,<br />
Rombout Wever, Gerben van Baren, Bart Klein Obbink, Hans de Jong, Bas van Doorn,<br />
Jelmer Scholte, Hans Post, Jeroen van der Zee, Mariken Everdij, Sybert Stroeve, Lennaert<br />
Speijker, Juan Coelho, Harry Smit, Arjen Balk, Joram Verstraeten, Johan Weijts, Ton<br />
Nieuwpoort, Arun Karwal, Carolynne Montijn, Margriet Klompstra, Bert Bakker, Koen de<br />
Jong, Udo Dees, Tom van Birgelen, Patricia Sijaranamual and Anna Kurlanc. Marijn<br />
Giesberts and Job Smeltink deserve special recognition for being such cheerful roommates!<br />
Henk Blom conducted a much appreciated review <strong>of</strong> an early draft <strong>of</strong> this thesis and Michel<br />
Piers and Alex Rutten encouraged me start and also to complete the work.<br />
While the rope group is fighting its way up the mountain slope, the people in base camp<br />
actually make it all possible. They provide the necessary supplies and allow the climber to<br />
recover from his efforts. I would like to thank the people <strong>of</strong> my base camp; Rob & Ellen<br />
and Jim & Henriëtte for their friendship and Caroline Veugelers for always being interested<br />
in the topic <strong>of</strong> my research. Dear mom, thank you for being the best mother in the world.<br />
Bernard and Susana are my base camp heroes. Obviously, the most important member <strong>of</strong><br />
the base camp is my partner Mijntje Pikaar. I am very grateful for sharing my life with you.<br />
Harrer, H. (1988). Das Buch vom Eiger, Pinguin Verlag, Innsbruck, Austria.<br />
Roelen, B. (1997). TGF-βs and their receptors in early mammalian development, Febodruk<br />
B.V., Enschede.<br />
Hunt, J. (1953). The ascent <strong>of</strong> Everest, Hodder & Stoughton, London.<br />
vi
Table <strong>of</strong> contents<br />
List <strong>of</strong> abbreviations ................................................................................................. 4<br />
Chapter 1. Introduction............................................................................................ 7<br />
1.1. Research question.................................................................................... 9<br />
1.2. Scope....................................................................................................... 9<br />
1.3. Directions for the reader........................................................................ 11<br />
Chapter 2. Fundamentals <strong>of</strong> <strong>risk</strong>............................................................................ 12<br />
2.1. Definition <strong>of</strong> safety ............................................................................... 12<br />
2.2. Risk perception...................................................................................... 13<br />
2.3. Risk metrics........................................................................................... 14<br />
2.4. Risk criteria ........................................................................................... 17<br />
2.5. Theories about accident causation......................................................... 19<br />
2.6. Risk analysis and <strong>risk</strong> modelling........................................................... 20<br />
2.7. Conclusions for this section .................................................................. 21<br />
Chapter 3. Fundamentals <strong>of</strong> causation and probability.......................................... 23<br />
3.1. What is causation?................................................................................. 23<br />
3.2. Conditional independence..................................................................... 26<br />
3.3. Causation to predict the future .............................................................. 27<br />
3.4. Singular and generic causal relations.................................................... 28<br />
3.5. Strong and weak causal relations .......................................................... 29<br />
3.6. The beginning and the end <strong>of</strong> causation................................................ 29<br />
3.7. What is a causal model?........................................................................ 30<br />
3.8. Conclusions for this section .................................................................. 31<br />
Chapter 4. User needs............................................................................................ 33<br />
4.1. A brief history <strong>of</strong> aviation safety........................................................... 33<br />
4.2. Who are the users? ................................................................................ 43<br />
4.3. Perspectives on aviation safety ............................................................. 43<br />
4.3.1. Airlines.................................................................................................. 43<br />
4.3.2. Rep<strong>air</strong> stations....................................................................................... 45<br />
4.3.3. Aircraft manufacturer............................................................................ 47<br />
4.3.4. Air navigation service provider............................................................. 49<br />
4.3.5. Airports ................................................................................................. 51<br />
4.3.6. Policy makers and regulatory bodies .................................................... 52<br />
4.3.7. Passengers ............................................................................................. 58<br />
4.3.8. People living or working in the vicinity <strong>of</strong> <strong>air</strong>ports .............................. 60<br />
4.4. Summary <strong>of</strong> user requirements and discussion on consistency............. 62<br />
4.5. User expectations: lessons from CATS................................................. 72<br />
4.6. Conclusions for this section .................................................................. 74<br />
Chapter 5. Examples <strong>of</strong> aviation safety analyses................................................... 78<br />
5.1. Safety <strong>of</strong> mixed VFR/IFR <strong>air</strong> traffic at Geneva Airport ....................... 78<br />
5.2. Safety assessment <strong>of</strong> parallel approaches at Helsinki-Vantaa Airport.. 79<br />
5.3. Safety assessment <strong>of</strong> <strong>of</strong>fset steep approaches at Lugano Airport.......... 80<br />
5.4. Reduced vertical separation minimum in Europe ................................. 81<br />
5.5. VEMER ATM System increment 2002 ................................................ 83<br />
5.6. Conclusions for this section .................................................................. 84<br />
1
Chapter 6. Risk <strong>models</strong> in other industries............................................................ 86<br />
6.1. Nuclear power ....................................................................................... 86<br />
6.2. Manned spaceflight ............................................................................... 87<br />
6.3. Offshore industry .................................................................................. 88<br />
6.4. Process industry .................................................................................... 90<br />
6.5. Rail <strong>transport</strong>......................................................................................... 90<br />
6.6. Health care ............................................................................................ 91<br />
6.7. Conclusions for this section .................................................................. 93<br />
Chapter 7. Modelling............................................................................................. 95<br />
7.1. Model representation............................................................................. 95<br />
7.2. Modelling techniques............................................................................ 97<br />
7.2.1 Boolean Trees ....................................................................................... 97<br />
7.2.2 Bayesian Belief Nets........................................................................... 101<br />
7.2.3 Petri nets.............................................................................................. 105<br />
7.3. Size, depth, complexity and uncertainty ............................................. 106<br />
7.4. Time dependency ................................................................................ 107<br />
7.5. Conclusions for this section ................................................................ 108<br />
Chapter 8. Quantification .................................................................................... 110<br />
8.1. Measurements, quantities, units and values. ....................................... 110<br />
8.2. The need for ratio scales...................................................................... 114<br />
8.3. Uncertainty.......................................................................................... 115<br />
8.4. Model assumptions.............................................................................. 116<br />
8.5. Data sources ........................................................................................ 117<br />
8.5.1 Accident or incident data?................................................................... 117<br />
8.5.2 Accident investigation......................................................................... 118<br />
8.5.3 Incident reporting................................................................................ 119<br />
8.5.4 In-flight recorded data......................................................................... 122<br />
8.5.5 Expert judgement ................................................................................ 124<br />
8.5.6 Empirical studies................................................................................. 124<br />
8.5.7 Safety audits........................................................................................ 126<br />
8.6. Denominator data................................................................................ 128<br />
8.7. Using the data...................................................................................... 129<br />
8.8. Conclusions for this section ................................................................ 132<br />
Chapter 9. Modelling challenges ......................................................................... 134<br />
9.1. Modelling human operators ................................................................ 134<br />
9.2. Modelling safety management ............................................................ 140<br />
9.3. Complexity, completeness and dependencies ..................................... 148<br />
9.4. Conclusions for this section ................................................................ 157<br />
Chapter 10. Model validation .............................................................................. 159<br />
10.1. Introduction......................................................................................... 159<br />
10.2. Validation <strong>of</strong> the generic accident scenarios....................................... 160<br />
10.2.1. Validation <strong>of</strong> take-<strong>of</strong>f and landing overrun probability estimates ...... 160<br />
10.2.2. Completeness <strong>of</strong> the accident scenarios.............................................. 161<br />
10.3. Validation <strong>of</strong> a model for missed approaches: case validity............... 161<br />
10.3.1. Qualitative description <strong>of</strong> the model................................................... 161<br />
10.3.2. Quantification <strong>of</strong> the model variables (the parent nodes) ................... 163<br />
2
10.3.3. Dependencies ...................................................................................... 168<br />
10.3.4. Comparison <strong>of</strong> model results with observations in practice ............... 169<br />
10.4. Face validity and peer review.............................................................. 171<br />
10.5. Assumption analysis............................................................................ 171<br />
10.6. Conclusions for this section ................................................................ 172<br />
Chapter 11. Summary, discussion and conclusions............................................. 173<br />
References ............................................................................................................ 186<br />
Summary............................................................................................................... 214<br />
Samenvatting ........................................................................................................ 217<br />
Appendix A: The history <strong>of</strong> third party <strong>risk</strong> regulation at Schiphol..................... 221<br />
Background....................................................................................................... 221<br />
Stand still for Schiphol <strong>risk</strong> .............................................................................. 222<br />
New law for Schiphol....................................................................................... 222<br />
<strong>Causal</strong> model as a solution?.............................................................................. 224<br />
Appendix B: The aviation system......................................................................... 225<br />
A typical flight.................................................................................................. 226<br />
Subsidiary processes......................................................................................... 231<br />
Flight crew training .......................................................................................... 231<br />
Air Traffic Control ........................................................................................... 231<br />
Aircraft design and certification....................................................................... 232<br />
Aircraft maintenance ........................................................................................ 233<br />
Airport processes.............................................................................................. 235<br />
Safety regulation and oversight........................................................................ 237<br />
Appendix C: <strong>Causal</strong> Model for Air Transport Safety (CATS)............................. 241<br />
Curriculum Vitae .................................................................................................. 243<br />
3
List <strong>of</strong> abbreviations<br />
AC Advisory Circular<br />
ACC Area Control Centre<br />
AD Airworthiness Directive<br />
ADREP Accident/Incident Reporting System<br />
ALARA As Low As Reasonably Achievable<br />
ALARP As Low As Reasonably Practicable<br />
ANS Air Navigation System<br />
ANSP Air Navigation Service Provider<br />
AOC Air Operator Certificate<br />
ATC Air Traffic Control<br />
ATCo Air Traffic Controller<br />
ATHEANA A Technique for Human Event Analysis<br />
ATIS Automatic Terminal Information System<br />
ATL Aircraft Technical Log<br />
ATM Air Traffic Management<br />
BBN Bayesian Belief Net<br />
BFU Büro für Flugunfalluntersuchungen<br />
CAA Civil Aviation Authority<br />
CATS <strong>Causal</strong> Model for Air Transport System<br />
CFIT Controlled Flight Into Terrain<br />
CIL Critical Item List<br />
CREAM Cognitive Reliability and Analysis Method<br />
CRM Crew Resource Management<br />
CS Certification Specification<br />
CTR Control Zone<br />
CVR Cockpit Voice Recorder<br />
DME Distance Measuring Equipment<br />
EASA European Aviation Safety Agency<br />
EC European Commission<br />
ECCAIRS European Co-ordination Centre for Aviation Incident Reporting Systems<br />
EMF Electric and Magnetic Field<br />
EPC Error Producing Condition<br />
ESARR Eurocontrol Safety Regulatory Requirement<br />
ESD Event Sequence Diagram<br />
EU European Union<br />
FAA Federal Aviation Administration<br />
FANOMOS Flight Track and Aircraft Noise Monitoring System<br />
FAR Federal Aviation Regulation<br />
FAS Final Approach Speed<br />
FDR Flight Data Recorder<br />
FHA Functional Hazard Assessment<br />
FMECA Failure Modes Effects and Criticality Analysis<br />
FMS Flight Management System<br />
FOCA Federal Office for Civil Aviation<br />
FSF Flight Safety Foundation<br />
GGR Gesommeerd Gewogen Risico (summed weighted <strong>risk</strong>)<br />
GPS Global Positioning System<br />
4
GPWS Ground Proximity Warning System<br />
GR Group Risk<br />
GTS Gezamenlijke Tandienst Schiphol (joint fuel service Schiphol)<br />
HEART Human Error Assessment and Reduction Technique<br />
HEP Human Error Probability<br />
HIL Hold Item List<br />
HP Horse Power<br />
HSE Health and Safety Executive<br />
IATA International Air Transport Association<br />
ICAO International Civil Aviation Organisation<br />
IFR Instrument Flight Rules<br />
ILS Instrument Landing System<br />
IOSA IATA Operational Safety Audit<br />
IR Individual Risk<br />
JAA Joint Aviation Authorities<br />
LOSA Line Operations Safety Audit<br />
MDA Minimum Descent Altitude<br />
MEL Minimum Equipment List<br />
MER Milieu Effect Rapportage (Environmental Impact Assessment)<br />
MRB Maintenance Review Board<br />
MSAW Minimum Safe Altitude System<br />
MTOW Maximum Take-Off Weight<br />
NASA National Aeronautics and Space Administration<br />
NLL Nationaal Luchtvaart Laboratorium (National Aviation Laboratory)<br />
<strong>NLR</strong> Nationaal Lucht- en Ruimtevaartlaboratorium (National Aerospace<br />
Laboratory)<br />
NOTAM Notice To Airmen<br />
NRC National Regulatory Commission<br />
NTSB National Transportation Safety Board<br />
PDP Piecewise Deterministic Markov Process<br />
PF Pilot Flying<br />
PNF Pilot Not Flying<br />
PSA Probabilistic Safety Assessment<br />
PSF Performance Shaping Factor<br />
PSSA Preliminary System Safety Assessment<br />
PSZ Public Safety Zone<br />
QAR Quick Access Recorder<br />
QRA Quantitative Risk Assessment<br />
RSL Rijks Studiedienst voor de Luchtvaart (State research <strong>of</strong>fice for aviation)<br />
RVSM Reduced Vertical Separation Minima<br />
SADT Structured Analysis and Design Technique<br />
SAFA Safety <strong>of</strong> Foreign Airlines<br />
SAM Safety Assessment Methodology<br />
SARPs Standards and Recommended Practices<br />
SASO Systems Approach to Safety Oversight<br />
SB Service Bulletin<br />
SES Single European Sky<br />
SID Standard Instrument Departure<br />
SMS Safety Management System<br />
SOP Standard Operating Procedure<br />
SSS Stanford Sleepiness Scale<br />
5
STAR Standard Arrival Route<br />
STCA Short Term Conflict Alert System<br />
TCAS Traffic alert and Collision Avoidance System<br />
TLS Target Level <strong>of</strong> Safety<br />
TMA Terminal Manoeuvring Area<br />
TOPAZ Traffic Organization and Perturbation AnalyZer<br />
TRG Totaal Risico Gewicht (total <strong>risk</strong> weight)<br />
UK United Kingdom<br />
US United States<br />
USAF United States Air Force<br />
UAV Uninhabited Areal Vehicle<br />
V1 Take-<strong>of</strong>f decision speed<br />
VACS Veiligheids Advies Commissie Schiphol (Safety Advisory Committee<br />
Schiphol)<br />
VEM Veiligheid Efficiency Milieu (Safety Efficiency Environment)<br />
VEMER VEM Effect Report<br />
VFR Visual Flight Rules<br />
VHF Very High Frequency<br />
VOR VHF Omni-Directional Range<br />
V/STOL Vertical / Short Take-Off and Landing<br />
6
Chapter 1. Introduction<br />
Affordable and reliable aviation plays a vital role in supporting economic growth and<br />
expanding personal options for where individuals can live, work, travel, and conduct<br />
business. As the world becomes increasingly interdependent, aviation services will take on<br />
even greater importance [JPDO 2004]. In the Netherlands, Amsterdam Airport Schiphol<br />
plays an important role as a <strong>transport</strong> node and in the regional economy [Hakfoort et al<br />
2001]. To maintain its position as main <strong>transport</strong>er in Europe, the Netherlands must<br />
continuously develop its <strong>transport</strong>ation infrastructure. The <strong>air</strong>port, like many other large<br />
international <strong>air</strong>ports, is located in a densely populated area. Further growth <strong>of</strong> the <strong>air</strong>port is<br />
an economic requirement, but this should not lead to increased burdens in terms <strong>of</strong> noise,<br />
pollution and accident <strong>risk</strong>.<br />
A main difference between accident <strong>risk</strong> and other detrimental aspects <strong>of</strong> aviation, such as<br />
noise and pollution, is that <strong>risk</strong> cannot be directly measured. In particular because the<br />
probability <strong>of</strong> accidents is low with respect to the period that is available for observations,<br />
statistical analysis alone is an insufficient basis for <strong>risk</strong> control. Aviation safety is so well<br />
developed that the current accident rate for large commercial <strong>air</strong>craft in Europe is<br />
approximately one accident in five million flights. Because <strong>of</strong> this low accident rate,<br />
individual organisations such as <strong>air</strong>lines or <strong>air</strong>ports cannot rely on the number <strong>of</strong> accidents<br />
as a useful indicator <strong>of</strong> the safety level <strong>of</strong> their operation. How can an <strong>air</strong>line that operates<br />
200.000 flights each year and that most likely has not experienced an accident in many<br />
years know if their current safety level is better or worse than last year’s? Adequate control<br />
<strong>of</strong> <strong>risk</strong> requires the availability <strong>of</strong> a method to determine the level <strong>of</strong> accident <strong>risk</strong> as a<br />
function <strong>of</strong> changes to the aviation system. This method must be methodologically sound.<br />
Determining the level <strong>of</strong> <strong>risk</strong> as a function <strong>of</strong> the status <strong>of</strong> the aviation system requires<br />
insight into cause-effect relations pertaining to accident <strong>risk</strong>.<br />
The Dutch Ministry <strong>of</strong> Transport, Public Works and Water Management has recognised<br />
this and the Ministry’s aviation safety policy plans have proposed the development <strong>of</strong><br />
system-wide 1 causal <strong>risk</strong> <strong>models</strong>. Unfortunately however, they failed to specify or even<br />
describe such <strong>models</strong> and their requirements other than in the most general <strong>of</strong> terms. Other<br />
organisations such as the FAA, NASA and Eurocontrol, have also called for the<br />
development <strong>of</strong> new methods for aviation safety analysis and assessment, albeit without<br />
using the term ‘causal <strong>risk</strong> model’ [FAA 2004, Luxhøj 2003, Eurocontrol 2004]. Several<br />
feasibility studies have been conducted and prototype causal <strong>risk</strong> <strong>models</strong> for aviation have<br />
been developed in a direct response to the Ministry’s policy plans [Roelen et al 2000a,<br />
Roelen et al 2002, DNV 2002b, Ale et al 2006, 2007, 2008].<br />
The aviation system is a prime example <strong>of</strong> a complex multi-actor system. System-wide<br />
causal <strong>models</strong> are currently not used for controlling and managing <strong>air</strong>craft accident <strong>risk</strong>,<br />
although more limited accident <strong>risk</strong> <strong>models</strong> are, for some specific problems, already wellaccepted<br />
2 . The complexity <strong>of</strong> the subject and the problems that arise in validating the<br />
1<br />
i.e. describing the complete <strong>air</strong> <strong>transport</strong> system.<br />
2<br />
An example is the ICAO collision <strong>risk</strong> model, see section 4.3.6.<br />
7
esults <strong>of</strong> such <strong>models</strong> are possible reasons for this. Research has primarily been focussed<br />
on the technical feasibility <strong>of</strong> <strong>models</strong>, without close consideration <strong>of</strong> the methodological<br />
consistency in relation to user requirements. One <strong>of</strong> the biggest bottlenecks in the past has<br />
been the fact that causal model development was stated as a goal in itself, without<br />
considering how such a model should be used [VACS 2003b]. From interviews held with<br />
expert groups regarding user requirements for a causal <strong>risk</strong> model for <strong>air</strong> <strong>transport</strong>, it was<br />
concluded that “It does not appear clear what the goal behind the causal model is, and this<br />
is hampering its development as different goals and scopes ask for different choices in<br />
developing the model” [De Jong 2006]. A complicating factor is that the Ministry and the<br />
Dutch Parliament completely misunderstood what a causal model could do; a causal model<br />
was considered to provide a solution for the problem <strong>of</strong> setting a maximum allowable value<br />
for third party <strong>risk</strong> around <strong>air</strong>ports when this was not a feasible objective <strong>of</strong> such a model<br />
[VACS 2003b] (see Appendix A for details).<br />
The objective <strong>of</strong> this thesis is to clarify these issues. The approach taken is not to develop<br />
yet another prototype model. It is also not the aim to provide a critical analysis and<br />
comparison <strong>of</strong> existing <strong>risk</strong> <strong>models</strong>. Existing methodologies such as CATS and TOPAZ are<br />
only used to illustrate some <strong>of</strong> the issues and are not put forward as the primary object <strong>of</strong><br />
the thesis.<br />
Instead, this thesis will systematically identify and compare user requirements with the<br />
performance that can be delivered by various existing modelling techniques. In doing so,<br />
the thesis will show what a causal <strong>risk</strong> model can add to current management approaches<br />
and what the criteria are for ensuring it makes a contribution. For practical reasons the<br />
thesis will be limited to existing and well-known modelling techniques, lesser known<br />
techniques and advanced approaches that are under development are considered to be out <strong>of</strong><br />
scope. For the purpose <strong>of</strong> this thesis, a causal <strong>risk</strong> model will be defined as a mathematical<br />
object that provides an interpretation and computation <strong>of</strong> causal queries about accident<br />
<strong>risk</strong>. A causal model can be associated with a directed graph 3 in which each node<br />
corresponds to a variable <strong>of</strong> the model and the arrows point from the variables that have<br />
direct influence to each <strong>of</strong> the other variables that they influence.<br />
Economic impact <strong>of</strong> Schiphol<br />
In 2006 Schiphol Airport facilitated 440.153 <strong>air</strong>craft movements which resulted in 40<br />
million passenger movements and the shipment <strong>of</strong> 1.5 million tonnes <strong>of</strong> cargo, ranking it<br />
the 4 th largest European Airport in terms <strong>of</strong> passenger movements. Schiphol Airport’s<br />
aviation business had a revenue <strong>of</strong> 631 million €, the consumer business (<strong>air</strong>port shopping,<br />
car parks, etc) had a revenue <strong>of</strong> 231 million €, and the real estate’s business totalled 109<br />
million €. There were 61.691 people, including temporary staff, working in the <strong>air</strong>port<br />
region. [Schipol Group 2007]. The multiplier <strong>of</strong> direct employment on Amsterdam<br />
Schiphol Airport is approximately 2: one job on the <strong>air</strong>port leads to approximately one job<br />
in indirect and induced employment in the greater Amsterdam region [Hakfoort et al 2001].<br />
3<br />
Examples <strong>of</strong> directed graphs are fault trees, event trees, Petri nets, Bayesian belief nets.<br />
8
1.1. Research question<br />
The main research question is the following:<br />
What does causal <strong>risk</strong> modelling add to current safety management approaches,<br />
and what are the criteria for ensuring it makes a successful contribution?<br />
To answer this question we must first make the term causal <strong>risk</strong> model more specific. This<br />
is done by asking the following sub questions:<br />
How can <strong>risk</strong> be made tangible? What is a proper way to express <strong>risk</strong>?<br />
What is a causal relation and which characteristics <strong>of</strong> causal relations are<br />
important for causal <strong>risk</strong> model development?<br />
What is a causal <strong>risk</strong> model?<br />
We must then widen the scope a bit and consider the context to search for clues to help<br />
answer the main question. This will be done with the following sub questions:<br />
What are the needs <strong>of</strong> users?<br />
What are currently the drivers for aviation safety improvement and what could be<br />
the role <strong>of</strong> a causal <strong>risk</strong> model in the process <strong>of</strong> safety improvement?<br />
What are shortcomings <strong>of</strong> the current methods for aviation safety analysis?<br />
What can be learned from <strong>risk</strong> modelling in other industries?<br />
Having looked at the ‘why’ we will then focus on the mechanisms for <strong>risk</strong> modelling to<br />
analyse how quantified <strong>models</strong> could support the users:<br />
Which modelling techniques are most appropriate?<br />
How should a causal <strong>risk</strong> model be quantified, what numerical accuracy is<br />
required and how can that be obtained?<br />
As the aviation system is a complex multi-actor distributed system we may expect that<br />
some characteristics are more difficult to represent in a model than others.<br />
What are, from a modelling point <strong>of</strong> view, the biggest bottlenecks?<br />
Finally, the use <strong>of</strong> a model cannot be justified when there is not some sort <strong>of</strong> pro<strong>of</strong> <strong>of</strong> the<br />
validity. The last question addresses this issue:<br />
How can we demonstrate the validity <strong>of</strong> a causal <strong>risk</strong> model?<br />
1.2. Scope<br />
The scope <strong>of</strong> this study must be described along three dimensions. The first is that <strong>of</strong> the<br />
aviation processes that are the subject <strong>of</strong> the study. Is it the straightforward gate to gate<br />
processes <strong>of</strong> an <strong>air</strong>craft, or are the subsidiary processes like design and certification,<br />
maintenance, etc. involved as well? If so, what are the boundaries <strong>of</strong> the subsidiary<br />
9
processes? The second dimension is that <strong>of</strong> the hierarchy <strong>of</strong> the organisation. Is only the<br />
operational level considered, or are higher managerial levels (procedures level, policy) and<br />
even those <strong>of</strong> the regulators also <strong>of</strong> interest? The third scoping dimension is that <strong>of</strong> the<br />
accident ‘processes’, including the causal factors. How far back in time must the causes <strong>of</strong><br />
the event be traced? Are consequences <strong>of</strong> the accident also within the scope? For each<br />
scoping dimension we need to indicate whether the boundary in scoping is the result <strong>of</strong><br />
practical or theoretical considerations. These scoping questions are basically part <strong>of</strong> the user<br />
needs and will be addressed in the associated chapter <strong>of</strong> this thesis.<br />
Apart from the scoping <strong>of</strong> the causal modelling that will be determined by the user<br />
requirements, the scope <strong>of</strong> the thesis will have to be limited for practical reasons. The study<br />
focuses on commercial <strong>air</strong> <strong>transport</strong>. Leisure flights, military aviation and aerial work (e.g.<br />
crop dusting) are considered out <strong>of</strong> scope. In practice this limits the study to fixed wing<br />
<strong>air</strong>craft as commercial <strong>air</strong> <strong>transport</strong> by helicopter and lighter-than-<strong>air</strong> vehicles is negligible<br />
in volume and number <strong>of</strong> flights compared to fixed wing <strong>air</strong>craft. The situation in the<br />
Netherlands is taken as example to answer the research questions, with a focus on the safety<br />
issues related to the growth <strong>of</strong> Amsterdam Airport Schiphol. Risk for people on-board as<br />
well as on the ground (both inside and outside the <strong>air</strong>port perimeter) will be taken into<br />
consideration. Environmental impact effects are excluded. The actors involved include the<br />
<strong>air</strong>lines, the <strong>air</strong>port and the <strong>air</strong> traffic control provider, but also the Ministry <strong>of</strong> Transport,<br />
the Ministry <strong>of</strong> Spatial Planning and the Environment, local municipalities and<br />
commissions and advisory groups such as the Dutch Expertgroup on Aviation Safety<br />
(DEGAS) and its predecessor the Safety Advisory Committee Schiphol (VACS) and the<br />
Commissie MER. Because <strong>of</strong> the general desire to harmonise regulation within Europe,<br />
because <strong>of</strong> the desire for a ‘level playing field’ in Europe, and because <strong>of</strong> the international<br />
character <strong>of</strong> aviation in general, the problem should also be addressed in a European<br />
context.<br />
For pragmatic reasons the scope <strong>of</strong> the thesis will be limited to direct <strong>air</strong>craft crash <strong>risk</strong>.<br />
Post crash events, such as the development <strong>of</strong> post-traumatic stress disorders in people<br />
directly involved, are not considered. From a technical point <strong>of</strong> view it is perhaps perfectly<br />
feasible to extend a causal <strong>risk</strong> model to post-crash events, but such a model would require<br />
different subject matter expertise and is therefore considered to be outside the scope.<br />
Aircraft crash <strong>risk</strong>s as a result <strong>of</strong> unlawful acts (terrorism, revengeful employees, unruly<br />
passengers), or military intervention (either on purpose or accidental) are considered out <strong>of</strong><br />
scope because the information on associated causal influences is considered to be<br />
confidential and not suitable for general dissemination.<br />
Primary (flying from A to B) as well as subsidiary processes (<strong>air</strong> traffic control, <strong>air</strong>craft<br />
design and maintenance, etc) are relevant for flight safety. While each accident always<br />
involves the primary process, the causal chain <strong>of</strong> events for an accident sequence nearly<br />
always involves the subsidiary processes as well. Therefore a causal <strong>risk</strong> model must<br />
encompass the primary and the subsidiary processes. The model should encompass those<br />
subsidiary processes that are directly linked to the primary process. They include flight<br />
crew training, <strong>air</strong>craft design, certification and maintenance, <strong>air</strong> traffic management and<br />
<strong>air</strong>port processes. A description <strong>of</strong> these processes is provided in Appendix B.<br />
The primary and subsidiary processes are embedded in national and international policies<br />
and regulation. Control <strong>of</strong> the processes’ products, including safety, actually involves a<br />
socio technical system <strong>of</strong> several hierarchical levels. Rasmussen [1997] identifies the<br />
10
following 6 levels: Government, Regulator, Company, Management, Staff and Work. The<br />
scope <strong>of</strong> the causal <strong>risk</strong> model should encompass the primary and subsidiary processes<br />
across all hierarchical levels from government down to work.<br />
1.3. Directions for the reader<br />
This thesis starts by explaining very briefly and superficially, the basics that are required<br />
before the research question can be really addressed. A proper discussion on causal<br />
modelling <strong>of</strong> aviation <strong>risk</strong> requires first a definition <strong>of</strong> the concepts <strong>of</strong> <strong>risk</strong> and safety in<br />
Chapter 2 and in Chapter 3 an explanation <strong>of</strong> ‘causality’ in itself, including a description <strong>of</strong><br />
what constitutes a ‘causal model’. User needs are introduced in Chapter 4. The focus then<br />
narrows to current practice beginning in Chapter 5 with a look at the way in which today<br />
safety assessments for <strong>air</strong> <strong>transport</strong> are typically conducted. Chapter 6 follows with an<br />
overview <strong>of</strong> other <strong>risk</strong> bearing industries with particular attention for the way in which <strong>risk</strong><br />
<strong>models</strong> are used in those sectors for managing and controlling <strong>risk</strong>. Comparison <strong>of</strong> current<br />
practice with user needs is decisive in selecting modelling techniques to be used in causal<br />
<strong>risk</strong> <strong>models</strong>. Different techniques and their characteristics are described in Chapter 7.<br />
Quantification is <strong>of</strong>ten mentioned as one <strong>of</strong> the main problems and will be the topic <strong>of</strong><br />
Chapter 8. Three traditionally difficult subjects in <strong>risk</strong> modelling are described in Chapter<br />
9: modelling human operators, modelling safety management and dealing with<br />
interdependencies between various parts <strong>of</strong> the model, while the fourth, validation, is dealt<br />
with in Chapter 10. All the ingredients are then available to come to a conclusion and to<br />
answer the main research question, which is done in Chapter 11. Additional background<br />
information is provided in the Appendices: Appendix A gives an overview <strong>of</strong> the history <strong>of</strong><br />
third party <strong>risk</strong> regulation at Schiphol <strong>air</strong>port. This information is relevant to appreciate the<br />
context from which a call for causal <strong>risk</strong> <strong>models</strong> was explicitly generated. Appendix B<br />
describes the main and subsidiary process in <strong>air</strong> <strong>transport</strong>. Appendix C gives information <strong>of</strong><br />
the CATS project. CATS is used throughout this thesis as an illustration <strong>of</strong> several issues.<br />
11
Chapter 2. Fundamentals <strong>of</strong> <strong>risk</strong><br />
Before being able to say something about a causal <strong>risk</strong> model for <strong>air</strong> <strong>transport</strong>, it must be<br />
clear what is meant by ‘<strong>risk</strong>’ and if and how this <strong>risk</strong> can be ‘measured’. Policies to control<br />
<strong>risk</strong>s are <strong>of</strong>ten based on some sort <strong>of</strong> quantification <strong>of</strong> the <strong>risk</strong> that is allowed to exist. There<br />
are different views on how to achieve a certain ‘amount’ <strong>of</strong> safety and these are discussed.<br />
Such information is required to determine what and how to model and what output metrics<br />
are needed. It will shed some light on what can and cannot be done with a causal <strong>risk</strong><br />
model. This chapter also describes the most relevant theories on accident causation and<br />
contains a brief historical overview <strong>of</strong> <strong>risk</strong> modelling. This information is relevant because<br />
further development <strong>of</strong> current practice is more likely to be accepted by projected users <strong>of</strong> a<br />
causal <strong>risk</strong> model than a radically different approach.<br />
2.1. Definition <strong>of</strong> safety<br />
The word safety can be used to indicate freedom from harm or freedom from <strong>risk</strong>, where<br />
<strong>risk</strong> is a combination <strong>of</strong> the probability <strong>of</strong> harm and its severity. The latter use <strong>of</strong> the word<br />
safety, which allows a distinction between degrees <strong>of</strong> safety instead <strong>of</strong> just a Boolean safe /<br />
unsafe distinction, is more suitable for safety management, because to manage safety it is<br />
necessary to know whether the situation is getting better or worse in order to be able to take<br />
measures before the harm can occur. A formal, generic definition <strong>of</strong> safety was given by the<br />
International Standards Organisation (ISO) and the International Electrotechnical<br />
Commission (IEC) [ISO 1999] and is adopted in this thesis:<br />
Safety is freedom from unacceptable <strong>risk</strong>.<br />
Risk is a combination <strong>of</strong> the probability <strong>of</strong> occurrence <strong>of</strong> harm and the severity <strong>of</strong><br />
the harm.<br />
Harm is physical injury or damage to the health <strong>of</strong> people either directly or<br />
indirectly as a result <strong>of</strong> damage to property or the environment 4 .<br />
The harm in this definition is limited to injury and health effects. Other types <strong>of</strong> harm, e.g.<br />
economic or financial, are excluded and consequently other types <strong>of</strong> <strong>risk</strong>s, such as financial<br />
<strong>risk</strong>, economic <strong>risk</strong>, etc. are also excluded. Combining the probability <strong>of</strong> occurrence <strong>of</strong><br />
harm and the severity <strong>of</strong> the harm to obtain <strong>risk</strong> is similar to, but more general than, the<br />
<strong>of</strong>ten used definition <strong>of</strong> <strong>risk</strong> as ‘probability times consequences’. The former definition<br />
allows <strong>risk</strong> to have a more complex dependence on probability and severity. Although not<br />
common, the square <strong>of</strong> severity is sometimes used to obtain a measure <strong>of</strong> <strong>risk</strong> for situations<br />
where people consider high consequence, low probability events to be worse than low<br />
consequence, high probability events [Hubert et al 1990, Joyce et al 2001]. In this thesis the<br />
scope will be limited to direct effects <strong>of</strong> aviation accidents on the health <strong>of</strong> people. Direct<br />
effects are deaths, physical injuries and physical damage that are immediately apparent<br />
following an accident. Indirect effects <strong>of</strong> accidents will not be considered. Indirect effects<br />
4<br />
For the purpose <strong>of</strong> this study we explicitly exclude environmental impact. We do not want<br />
to get into deliberations on, say, global warming and aviation fuel taxation.<br />
12
are those that are not immediately apparent but manifest themselves some time after the<br />
accident. Examples <strong>of</strong> indirect effects are health problems <strong>of</strong> rescue workers caused by<br />
exposure to toxic substances, or the development <strong>of</strong> post traumatic stress disorders among<br />
people that have witnessed or were involved in <strong>air</strong>craft accidents. The manifestation and<br />
degree <strong>of</strong> indirect effects is largely governed by social, psychological and epidemiological<br />
factors and requires different knowledge and expertise than estimating direct <strong>air</strong>craft crash<br />
effects.<br />
2.2. Risk perception<br />
The definition <strong>of</strong> safety in the previous section introduces acceptability <strong>of</strong> <strong>risk</strong>.<br />
Acceptability <strong>of</strong> <strong>risk</strong> is strongly influenced by <strong>risk</strong> perception. The level <strong>of</strong> perceived <strong>risk</strong><br />
has been found in several studies to be dependent on the degree to which people believe<br />
that <strong>risk</strong> can be controlled and by whom, trusted or not [Slovic et al 1976, Hale & Glendon<br />
1987]. Voluntary and involuntary exposure to <strong>risk</strong> is also a main driver for <strong>risk</strong><br />
acceptability (Figure 2). Another factor that is related to <strong>risk</strong> perception and the level <strong>of</strong><br />
accepted <strong>risk</strong> is the chance <strong>of</strong> multiple fatality accidents [O’Banion 1980, ETSC 1997]. A<br />
fourth factor that plays a role is the time passed since a similar event took place. The more<br />
retrievable the event, the greater its intuited probability. News media’s extensive coverage<br />
<strong>of</strong> <strong>air</strong>craft accidents make them particularly ‘retrievable’. For instance in a 1996 Associated<br />
Press survey, U.S. newspaper editors and television news directors said that the Trans<br />
World Airlines Flight 800 accident 5 was the ‘biggest’ news story <strong>of</strong> 1996 [Barnett & Wang<br />
2000]. A 1990 study <strong>of</strong> page-one newspaper articles regarding fatalities in the United States<br />
said that coverage <strong>of</strong> <strong>air</strong> carrier accidents in The New York Times was 60 times greater than<br />
its coverage <strong>of</strong> AIDS, 1,500 times greater than coverage <strong>of</strong> automobile-related hazards and<br />
6,000 times greater than coverage <strong>of</strong> cancer [Barnett & Wang 2000]. Events that result in<br />
‘identifiable’ victims have more impact than events resulting in anonymous or ‘statistical’<br />
victims. An accident, such as an <strong>air</strong>craft crash, therefore has more impact on public<br />
perception than for instance exposure <strong>of</strong> large and hence anonymous populations to toxic<br />
substances due to general environmental pollution [Health Council <strong>of</strong> the Netherlands<br />
1999].<br />
As <strong>risk</strong> implies possible loss, <strong>risk</strong> perception is also a direct reflection <strong>of</strong> perceptions <strong>of</strong><br />
value [Brauer 2004]. As such, there are differences in <strong>risk</strong> perception across cultures and<br />
across time. Accidental death is likely to be more acceptable (to society as a whole) in<br />
regions where the life expectancy is lower than the world average due to ‘natural’ causes <strong>of</strong><br />
death such as infectious diseases and famine. A comparison <strong>of</strong> <strong>air</strong>craft accident rates and<br />
gross domestic product across world regions indeed show a strong inverse relation [Roelen<br />
et al 2000c, Visser 1997]. Likewise <strong>risk</strong> acceptability depends on the benefit associated<br />
with <strong>risk</strong> exposure. The greater the reward, the higher the <strong>risk</strong> we are willing to take.<br />
5<br />
On 17 July 1996, Trans World Airlines Flight 800 crashed minutes after take <strong>of</strong> from John<br />
F. Kennedy International Airport, New York. The cause <strong>of</strong> the accident was an explosion <strong>of</strong><br />
the centre wing fuel tank. The source <strong>of</strong> ignition energy for the explosion could not be<br />
determined with certainty, but, <strong>of</strong> the sources evaluated by the investigation, the most likely<br />
was a short circuit outside <strong>of</strong> the centre wing tank that allowed excessive voltage to enter it<br />
through electrical wiring associated with the fuel quantity indication system [NTSB 2000].<br />
13
Figure 1: Voluntary exposure to <strong>risk</strong> is more acceptable than involuntary exposure.<br />
The causal <strong>risk</strong> model must be restricted to ‘objective’ <strong>risk</strong> because <strong>of</strong> the lack <strong>of</strong><br />
uniformity in subjective <strong>risk</strong> between groups, players, times and places. It might be<br />
tempting to require the causal <strong>risk</strong> model to (also) have perceived <strong>risk</strong> as output parameter<br />
but if the model were to include perceived <strong>risk</strong> it would have to include too many factors<br />
that are most likely very difficult to quantify and to represent in the model. The history <strong>of</strong><br />
noise level calculations for <strong>air</strong>ports provides a clear example <strong>of</strong> the difficulty <strong>of</strong> expressing<br />
‘perceived levels <strong>of</strong> burden’. See for example Everdijk [2006]. For the purpose <strong>of</strong> a causal<br />
<strong>risk</strong> model, the level <strong>of</strong> <strong>risk</strong> must be expressed in objectively quantifiable units. This is<br />
needed because the results <strong>of</strong> the model should be utilizable to make comparisons, for<br />
instance on the level <strong>of</strong> aviation <strong>risk</strong> before and after the introduction <strong>of</strong> a technological or<br />
managerial change.<br />
2.3. Risk metrics<br />
The objective <strong>of</strong> this section is to decide on an appropriate metric for a causal <strong>risk</strong> model.<br />
There is no single common metric for <strong>risk</strong>. Even when the scope is restricted to mortality<br />
<strong>risk</strong>, there are various ways to express this, such as number <strong>of</strong> accidents with fatalities per<br />
<strong>air</strong>craft hour, fatalities per <strong>air</strong>craft hour, fatalities per passenger mile, fatal accidents per<br />
passenger mile and fatal accidents per flight. Expressing mortality <strong>risk</strong> per flight hour or<br />
per passenger mile has the advantage that it makes comparison with other modes <strong>of</strong><br />
<strong>transport</strong> possible in a realistic way. But because most accidents occur during the take-<strong>of</strong>f<br />
and approach and landing phase <strong>of</strong> flight [CAA-NL 2007] this metric is also somewhat<br />
misleading; the <strong>risk</strong> per passenger mile is lower for a long flight than for a short flight but<br />
14
the <strong>risk</strong> per trip is similar for a long flight and a short flight. Using ‘fatal accidents’ as the<br />
numerator for mortality <strong>risk</strong> has the drawback that the term fatal accident includes all<br />
accidents that cause at least one death and does not distinguish between an accident that<br />
kills one passenger among 400 and an accident that kills all on-board. According to Barnett<br />
& Wang [2000], ‘death <strong>risk</strong> per flight’ is the most appropriate metric <strong>of</strong> aviation <strong>risk</strong>. It is<br />
based on the following question: If a passenger chooses a (nonstop) flight completely at<br />
random, what is the probability that he or she will be killed during the flight?<br />
However, this metric ignores that <strong>air</strong>craft accidents are not only hazardous for those onboard,<br />
but also for people on the ground. Risk for those on the ground is called third party<br />
<strong>risk</strong>. Third party <strong>risk</strong> became a major concern as a result <strong>of</strong> some major disasters in the<br />
chemical industry such as the Bhopal disaster in 1984 when more than 3000 people were<br />
killed as a result <strong>of</strong> the accidental release <strong>of</strong> some 40 tons <strong>of</strong> methyl-isocyanate [Ale &<br />
Piers 2000]. For stationary installations, the term third party <strong>risk</strong> is used to indicate the <strong>risk</strong><br />
for those people that are not employees <strong>of</strong> the concerned company, i.e. those that are<br />
‘outside the gate’. This definition was also used by the Dutch Ministry <strong>of</strong> Transport when<br />
developing policies for aviation third party <strong>risk</strong> (see Appendix A). Only <strong>risk</strong>s for those<br />
people outside the <strong>air</strong>port boundary are taken into account, ignoring thousands <strong>of</strong> people<br />
that can be present inside the <strong>air</strong>port boundaries. Also <strong>of</strong>ten only those living and working<br />
in the area are included, excluding those temporarily there such as motorway travellers. The<br />
decisions to take the <strong>air</strong>port boundary and temporality <strong>of</strong> the stay as criteria are policy<br />
decisions and are not inherent to the definition <strong>of</strong> third party <strong>risk</strong>. There are different<br />
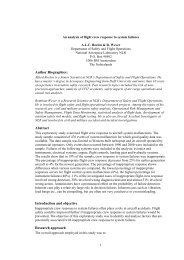
metrics for third party <strong>risk</strong>, the most well-known are individual <strong>risk</strong> and group <strong>risk</strong>.<br />
Individual <strong>risk</strong> (IR) is the probability – per year – that an imaginary person that is<br />
permanently residing at the same location (in the vicinity <strong>of</strong> the <strong>air</strong>port) dies as a direct<br />
result <strong>of</strong> an <strong>air</strong>craft accident. Individual <strong>risk</strong> is a metric for the personal safety <strong>of</strong><br />
(imaginary) persons that reside permanently in the vicinity <strong>of</strong> a <strong>risk</strong>-bearing activity.<br />
Individual <strong>risk</strong> is location dependent and is present regardless <strong>of</strong> the presence <strong>of</strong> persons. In<br />
general, IR-values become less when the distance to the <strong>risk</strong> source increases. Individual<br />
<strong>risk</strong> values are <strong>of</strong>ten represented as iso-IR contours on a topographical map.<br />
Group <strong>risk</strong> (GR) is defined as the probability - per year- that a group <strong>of</strong> more than a<br />
particular number <strong>of</strong> persons (denoted with ‘N’), other than occupants <strong>of</strong> the <strong>air</strong>craft, dies<br />
as a result <strong>of</strong> a single <strong>air</strong>craft accident. GR is <strong>of</strong>ten represented in a graph that plots the<br />
probability <strong>of</strong> having an accident with N or more fatalities (the so-called FN curve). The<br />
notion <strong>of</strong> group <strong>risk</strong> is used to indicate ‘calamities with potentially many victims under the<br />
population’. Group <strong>risk</strong> is sometimes popularly referred to as the ‘disaster probability’.<br />
Because group <strong>risk</strong> not only concerns the probability <strong>of</strong> a calamity, but also its size, group<br />
<strong>risk</strong> to a certain extent is a metric for the probability <strong>of</strong> societal disruption. Group <strong>risk</strong><br />
applies to an entire area and is not location specific within that area. However the ‘area’ can<br />
be defined as quite small, so that it approximates to a location specific metric. Whereas<br />
individual <strong>risk</strong> concerns imaginary persons (there is no relation with actually present<br />
people), group <strong>risk</strong> does concern the actual population. When there are no residents in the<br />
vicinity <strong>of</strong> the <strong>risk</strong>-bearing activity, the group <strong>risk</strong> is zero.<br />
15
Y (RDC) [km]<br />
495<br />
490<br />
485<br />
480<br />
475<br />
470<br />
110 115 120 125<br />
X (RDC) [km]<br />
Figure 2: Result <strong>of</strong> a calculation <strong>of</strong> individual <strong>risk</strong> around an <strong>air</strong>port.<br />
Third party <strong>risk</strong> is a consequence <strong>of</strong> <strong>air</strong>craft accident <strong>risk</strong>. Calculating third party <strong>risk</strong><br />
usually requires combining the <strong>air</strong>craft crash probability with the likely location <strong>of</strong> the<br />
accident and the consequences for those on the ground 6 . The <strong>air</strong>craft accident probability is<br />
hence one <strong>of</strong> the main inputs for calculating third party <strong>air</strong>craft <strong>risk</strong>, albeit that not every<br />
<strong>air</strong>craft accident has third party <strong>risk</strong> potential; an occurrence where an <strong>air</strong>craft hits severe<br />
turbulence causing some <strong>of</strong> the passengers to be thrown around in the cabin and sustaining<br />
injuries is an accident according to the definition <strong>of</strong> the International Civil Aviation<br />
Organization (ICAO), but it does not contribute to third party <strong>risk</strong>. In this study, we will<br />
focus the attention on a causal <strong>risk</strong> model with <strong>air</strong>craft accident probability as output; the<br />
scope is restricted to modelling accident causes, modelling <strong>of</strong> accident consequences is not<br />
considered. Nevertheless, because the <strong>air</strong>craft accident probability is an input for third party<br />
<strong>risk</strong> calculations the causal <strong>risk</strong> model could be used rather straightforwardly in third party<br />
<strong>risk</strong> analysis as well.<br />
6 Consequences are usually expressed as a combination <strong>of</strong> crash area and lethality within<br />
the crash area.<br />
16<br />
IR = 10-5 IR = 10-6 IR = 10-7 IR = 10-5 IR = 10-6 IR = 10-7 IR = 10-5 IR = 10-6 IR = 10-7 residential<br />
area<br />
runway
Fatal accidents are rare events. When using accident data (i.e. the realization <strong>of</strong><br />
probabilities) to quantify aviation <strong>risk</strong>, this must be taken into account. Because fatal<br />
accidents are so rare even large observed differences need not attain significance. If a coin<br />
is tossed only four times, then no possible outcome - even four heads or four tails- would<br />
provide statistically significant evidence that the coin is not f<strong>air</strong> [Czerwinski & Barnett<br />
2004]. The number <strong>of</strong> aviation accidents with fatalities has become so low that it is<br />
problematic to use those as the only indicator <strong>of</strong> <strong>air</strong> <strong>transport</strong> <strong>risk</strong>, there is too much<br />
randomness in the data. Therefore non-fatal accidents and incidents should be included in<br />
the considerations on the construction <strong>of</strong> a causal <strong>risk</strong> model. But the question then arises<br />
which occurrences should be considered. Incidents and (fatal) accidents are not necessarily<br />
causally related. Trips and falls for instance result in many injuries but are rarely causally<br />
related to catastrophic accidents. Therefore only those occurrences, associated with the<br />
operation <strong>of</strong> an <strong>air</strong>craft, which affect or could affect the safety <strong>of</strong> operation 7 should be<br />
included.<br />
2.4. Risk criteria<br />
Unfortunately, safety is not self-sustainable [SAE 2003]. Some sort <strong>of</strong> safety management<br />
is required to improve or even maintain the current level <strong>of</strong> safety. Policies to control major<br />
<strong>risk</strong>s have been in development from the 1960s onwards. Many <strong>of</strong> these policies are based<br />
on some sort <strong>of</strong> quantification <strong>of</strong> the <strong>risk</strong> that could be allowed to continue. This section<br />
explains how causal <strong>risk</strong> <strong>models</strong> can be used in relation to such quantitative <strong>risk</strong> criteria and<br />
<strong>risk</strong> control policies.<br />
A Target Level <strong>of</strong> Safety (TLS) is the ‘amount’ <strong>of</strong> safety that is aimed for. The concept <strong>of</strong> a<br />
TLS appears intuitively obvious [Joyce et al 2001]. The prime user <strong>of</strong> the TLS concept in<br />
aviation has been ICAO. Over the years, ICAO has developed TLS concepts in various<br />
safety critical areas <strong>of</strong> the industry, using international groups <strong>of</strong> experts. Such areas have<br />
included the North Atlantic System Planning Group (1992), the All Weather Operations<br />
Panel (1994), the Obstacle Clearance Panel (1980) and the Review <strong>of</strong> the General Concept<br />
<strong>of</strong> Separation Panel (1995). The latter work panel has <strong>of</strong>fered the following definition:<br />
“A Target <strong>of</strong> Safety (TLS) specifies an acceptable value <strong>of</strong> <strong>risk</strong> which can be used as a<br />
yardstick against which the <strong>risk</strong>s associated with a system or procedures can be evaluated.<br />
The concept <strong>of</strong> a TLS is particularly useful when planning changes in safety critical<br />
operations such as <strong>air</strong> traffic control.”<br />
[RGCSP 1995].<br />
The definition for the TLS concept that is <strong>of</strong>fered will vary in accordance with its particular<br />
application and its intended use. For example, the UK Civil Aviation Authority (an<br />
organisation which has also been instrumental in the development <strong>of</strong> TLS concepts),<br />
defines the TLS concept for controlled <strong>air</strong>space as:<br />
“…a fundamental concept in any mathematical / statistical approach to systems planning<br />
when questions <strong>of</strong> safety are involved…The target level <strong>of</strong> safety is the level <strong>of</strong> safety which<br />
the system is designed to achieve. Put the other way round, the system is designed to an<br />
assured level <strong>of</strong> safety. By this specification it is possible to define planning objectives<br />
which fit in with the safety constraints, and also provide a safety yardstick against which<br />
potential changes can be assessed and objectives pursued.” [Brooker & Ingham 1977].<br />
A Target Level <strong>of</strong> Safety is a level <strong>of</strong> safety that either must be achieved in order to carry<br />
out some activity (i.e. a mandatory target) or must be aimed for but need not necessarily be<br />
7<br />
This is ICAO’s definition <strong>of</strong> an ‘incident’.<br />
17
achieved (i.e. an aspirational target). Most TLS used to date in aviation are mandatory<br />
targets, set by the safety regulator. They specify a minimum level <strong>of</strong> safety (or maximum<br />
permissible <strong>risk</strong>) that must be demonstrated before some equipment or system can become<br />
operational, or remain in operation. The safety regulator or the industry may also use a TLS<br />
with the purpose <strong>of</strong> allocating <strong>risk</strong> space to different players and system elements. The<br />
main use <strong>of</strong> aspirational targets is motivational, like the ‘zero accidents’ action plan <strong>of</strong> the<br />
Federal Aviation Administration (FAA) in 1995 [FAA 1995a]. These are promotional<br />
carrots, or sticks to beat those lower in the hierarchy.<br />
The concept <strong>of</strong> a level <strong>of</strong> safety has a number <strong>of</strong> implications. Because safety cannot be<br />
measured directly, an alternative approach to quantifying safety is necessary to be able to<br />
demonstrate that a certain target has been or will be met. A causal <strong>risk</strong> model can be used<br />
for this purpose. The results from the model should then be reproducible: a person<br />
determining a level <strong>of</strong> safety from the same data on different occasions should obtain the<br />
same result. The results should also be objective: different persons running the model<br />
should obtain the same result.<br />
Setting a target level <strong>of</strong> safety and calculating whether a target has been met are two<br />
separate steps in a decision making process. Failure to make this distinction may lead to<br />
confusion. Setting safety targets is not very useful if the processes that govern safety are not<br />
known. It is in this sense that a causal <strong>risk</strong> model is valuable for it can show the effect <strong>of</strong><br />
certain decisions on the level <strong>of</strong> safety. Results <strong>of</strong> a model can be used to determine that a<br />
certain TLS has been met, but can also be helpful if a target has not been met. A causal <strong>risk</strong><br />
model can then be a tool to determine (effective or efficient) measures to meet safety<br />
targets.<br />
Conceptually different from a TLS is the ALARA or ALARP approach; As Low As<br />
Reasonably Achievable / Practicable. Here, the main focus is that there should be an<br />
improvement and rather less what the end point should be. Whereas a TLS defines the <strong>risk</strong><br />
space to be utilized and is static, ALARA or ALARP is aimed at continuous improvement<br />
and is dynamic. In this approach, a computation must be made in which a quantum <strong>of</strong> <strong>risk</strong><br />
is placed on one side and the sacrifice (in money, time, trouble, etc) involved in the<br />
measures necessary to avert the <strong>risk</strong> is placed on the other. If the sacrifice is considered<br />
grossly disproportional it is considered unreasonable. Because <strong>of</strong> the gross<br />
disproportionality criterion, it is not required that the cost and quantum <strong>of</strong> <strong>risk</strong> are estimated<br />
very accurately [Ale 2005]. What is ‘reasonably achievable or practicable’ is usually<br />
established from engineering judgement. A causal <strong>risk</strong> model can be used in an<br />
ALARA/ALARP approach to calculate the quantum <strong>of</strong> <strong>risk</strong>. The required accuracy <strong>of</strong> a<br />
model for such application is less than for a TLS application.<br />
A causal <strong>risk</strong> model has the potential to provide an understanding <strong>of</strong> the inherent <strong>risk</strong>s <strong>of</strong><br />
the <strong>air</strong> <strong>transport</strong> system over a wide range <strong>of</strong> conditions. A causal <strong>risk</strong> model which takes<br />
an integrated look at the <strong>air</strong> <strong>transport</strong> system, uses realistic criteria for performance and<br />
tries to quantify the uncertainties is a basis for ‘<strong>risk</strong> informed’ decision making 8 . The<br />
increased insight is expected to improve safety beyond the level that can be reached by a<br />
‘<strong>risk</strong> based’ approach in which safety requirements are translated in pass/fail rules that are<br />
straightforward to implement and to verify compliance [NRC 1998]. It is therefore clear<br />
8<br />
Risk informed decision making represents a philosophy whereby <strong>risk</strong> insights are<br />
considered together with other factors to establish decisions on design and operational<br />
issues commensurate with their importance to safety.<br />
18
that, while a causal <strong>risk</strong> model can be used in a TLS approach, the model can fully come to<br />
justice in an ALARP approach which strives for continuous improvement.<br />
2.5. Theories about accident causation<br />
Risk from <strong>air</strong> <strong>transport</strong> is almost exclusively related to accidents 9 . In a desire to understand<br />
and prevent the occurrence <strong>of</strong> accidents, many researchers have tried to develop a concept<br />
or framework for describing accident causation. Some <strong>of</strong> these theories have been very<br />
influential on the way we think about accidents and the representation <strong>of</strong> accidents in<br />
mathematical <strong>models</strong>. For that reason this section provides a brief overview <strong>of</strong> some <strong>of</strong> the<br />
most important accident causation theories and concludes with what this means for <strong>risk</strong><br />
model requirements.<br />
For the purpose <strong>of</strong> accident investigation, it is <strong>of</strong>ten assumed that accidents involve the<br />
occurrence <strong>of</strong> a set <strong>of</strong> successive events that produce unintentional harm. The start <strong>of</strong> this<br />
sequence is a deviation or perturbation that disturbs the existing equilibrium or state <strong>of</strong><br />
homeostasis. Benner [1975] pointed out that events during accidents occur both in series<br />
and in parallel and proposed flow charting methods to represent this. Accident investigation<br />
tools like Event and <strong>Causal</strong> Factors Analysis (ECFA) [Buys & Clark 1995] and<br />
Management Oversight and Risk Tree (MORT) [Johnson 1975] use this concept to provide<br />
a structure for integrating and subsequently communicating investigation findings. Already<br />
in 1935, Heinrich developed a theory that introduces an additional dimension to such<br />
accident chain model. He compared the occurrence <strong>of</strong> an accident to a set <strong>of</strong> lined-up<br />
dominoes [Heinrich et al 1980]. The five dominoes were a) ancestry and social<br />
environment, b) worker fault, c) unsafe act or unsafe condition, d) accident and e) damage<br />
or injury. Central to Heinrich’s original statement <strong>of</strong> the model is the assertion that the<br />
immediate causes <strong>of</strong> accidents are <strong>of</strong> two different types; unsafe acts and unsafe conditions.<br />
Heinrich’s domino model was also useful to explain how by removing one <strong>of</strong> the<br />
intermediate dominoes, the remaining ones would not fall and the injury would not occur.<br />
Reason [1990] took Heinrich’s unsafe acts and unsafe conditions a step further by refining<br />
the distinction between different types <strong>of</strong> failures that line up to create an accident. Building<br />
upon work by Rasmussen [1983], Reason describes an accident as a situation in which<br />
latent failures, arising mainly in the managerial and organisational spheres, combine<br />
adversely with local trigger events (weather, location etc) and with active failures <strong>of</strong><br />
individuals at the operational level. Latent failures are failures that are created a long time<br />
before the accident, but lie dormant until an active failure triggers their operation. Their<br />
defining feature is that they were present within the system well before the onset <strong>of</strong> an<br />
accident sequence. Like many other high-hazard, low-<strong>risk</strong> systems, the aviation system has<br />
developed such a high degree <strong>of</strong> technical and procedural protection that it is largely pro<strong>of</strong><br />
against single failures, either human or mechanical. The aviation system is more likely to<br />
suffer ‘organizational accidents’ [Reason 1990]. That is, a situation in which latent failures,<br />
arising mainly at the managerial and organizational level, combine adversely with local<br />
triggering events and with the active failures <strong>of</strong> individuals at the execution level [Reason<br />
1997]. This concept is <strong>of</strong>ten graphically illustrated as slices <strong>of</strong> holed cheese, each slice<br />
representing a barrier at a different organisational level. The holes in the cheese are barrier<br />
failures and an accident occurs when the holes line up. The ‘Swiss cheese’ model has been<br />
useful to underline the importance <strong>of</strong> organisational factors in accidents. Perrow [1984] also<br />
describes accidents as occurrences where apparently trivial events cascade through the<br />
system to cause a large event with severe consequences. He uses the term ‘normal<br />
9<br />
Examples <strong>of</strong> non-accident <strong>risk</strong> in <strong>air</strong> <strong>transport</strong> are deep vein thrombosis and possible<br />
health effects <strong>of</strong> exposure to higher levels <strong>of</strong> electromagnetic radiation.<br />
19
accidents’ because these accidents start with an event that seems ordinary and happens<br />
frequently, almost always without causing great harm. Perrow also uses the term ‘system<br />
accidents’; accidents are the result <strong>of</strong> interaction between components <strong>of</strong> a system rather<br />
than failures <strong>of</strong> individual components. Leveson is another advocate <strong>of</strong> a systems approach.<br />
Leveson [2004a] regards safety as an emergent property <strong>of</strong> a system. Emergent properties<br />
are properties observed at one level <strong>of</strong> abstraction which cannot be predicted (maybe even<br />
not explained) at another level <strong>of</strong> abstraction. According to Leveson’s conception <strong>of</strong> safety,<br />
accidents occur when external disturbances, component failures, or dysfunctional<br />
interactions among system components are not adequately handled by the control system.<br />
They result from inadequate control or enforcement <strong>of</strong> safety-related constraints on the<br />
development, design and operation <strong>of</strong> the system. Safety is then viewed as a control<br />
problem [Leveson 2004b]. This view on safety is shared by Rasmussen [1997], who<br />
described safety management as keeping the organisation within a safe region, away from<br />
the boundaries <strong>of</strong> controllability. The organisation may be constantly pushed towards these<br />
boundaries by competitive pressures and financial restrictions, or may drift towards them<br />
through complacency. Risk control measures are then defined in terms <strong>of</strong> measures to<br />
detect, diagnose and act on close encounters with the boundary <strong>of</strong> the safe envelope [Hale<br />
et al 2007]. Hollnagel proposes to use non-linear system <strong>models</strong>. His functional resonance<br />
accident model uses the principle <strong>of</strong> stochastic resonance to describe accidents. Stochastic<br />
resonance is a phenomenon in which the combination <strong>of</strong> a stochastic (random noise) signal<br />
and a periodic modulated signal results in resonance, i.e. a relatively large selective<br />
response <strong>of</strong> the system to which the signals are fed [Hollnagel et al 2006]. Latent factors are<br />
not necessarily factors that are ‘wrong’ or outside the norm. Particular combinations <strong>of</strong><br />
factors that are within the boundaries that one would expect can create a ‘resonance’ that<br />
leads to an accident. Dekker [2005] also emphasises the role <strong>of</strong> ‘normal’ factors in accident<br />
causation and calls it the ‘drift to danger’ in reference to Rasmussen. He claims that new,<br />
‘organic, co-evolutionary’ concepts <strong>of</strong> accident causation are required. Hollnagel and<br />
Dekker were not the first to try to capture the seemingly ‘stochastic’ and ‘organic’<br />
behaviour <strong>of</strong> accidents. Some researchers have made a comparison with epidemiological<br />
<strong>models</strong> to try to account for this ‘randomness’. The threshold theorem, which states that the<br />
density <strong>of</strong> susceptible individuals must exceed a certain critical value in order for an<br />
epidemic to occur [Bailey 1975] seems to describe similar phenomena to latent failures and<br />
functional resonance. This proposition was already established in 1927 [Anderson 1991],<br />
even before Heinrich published his domino theory.<br />
What do these theories tell us about (requirements for) causal <strong>risk</strong> <strong>models</strong>? The call for<br />
more systemic views on accident causation and the underlining <strong>of</strong> the role <strong>of</strong> ‘normal’<br />
occurrences in accident causation emphasises the need for <strong>risk</strong> <strong>models</strong> that go beyond<br />
traditional ‘hard wired’ approaches like fault trees and events trees. The causal <strong>risk</strong> model<br />
should be able to represent the seemingly stochastic and evolving nature <strong>of</strong> the system in<br />
relation to its hazards.<br />
2.6. Risk analysis and <strong>risk</strong> modelling<br />
This section gives a brief historical overview <strong>of</strong> <strong>risk</strong> analysis and <strong>risk</strong> modelling. This is<br />
relevant as it is assumed that further development <strong>of</strong> current practice is more likely to be<br />
accepted by projected users <strong>of</strong> a causal <strong>risk</strong> model than a radically different approach.<br />
Risk modelling has its roots in business forecasting and reliability engineering. Business<br />
forecasting developed in the late 17<br />
20<br />
th century when entrepreneurs began collecting raw data<br />
for estimating the probabilities <strong>of</strong> uncertain outcomes. Lloyds list was launched in a<br />
London c<strong>of</strong>fee house in 1696 and was filled with information on arrivals and departures <strong>of</strong>
ships and intelligence on conditions abroad and at sea [Bernstein 1996]. That information<br />
was used by ships’ captains as well as insurance underwriters to estimate <strong>risk</strong>s for the many<br />
sea routes that were being travelled. In the same period, the brilliant works <strong>of</strong> people like<br />
Jacob Bernouilli (1654-1705), Abraham de Moivre (1667-1754) and Thomas Bayes (1701-<br />
1761) provided the basic mathematical theories for <strong>risk</strong> analysis. Application <strong>of</strong> those<br />
theories was primarily in the field <strong>of</strong> financial <strong>risk</strong> analysis. The industrial revolution and<br />
increased mechanisation <strong>of</strong> society led to the application <strong>of</strong> the same mathematical tools for<br />
reliability analysis. Hardware designers however needed more than the ability to predict<br />
when their product would fail; they needed formal techniques to help improve the<br />
reliability <strong>of</strong> their products. For the US military it was important that hardware failures<br />
should not lead to failure <strong>of</strong> the mission. Therefore, Failure Modes, Effects and Criticality<br />
Analysis (FMECA) was formally introduced by the US military in 1949 (MIL-P-1629).<br />
This is regarded as one <strong>of</strong> the first systematic techniques for failure analysis. FMECA is a<br />
qualitative, systematic analysis <strong>of</strong> all conceivable failures and their effects.<br />
The probabilistic approach to <strong>risk</strong> analysis and systematic analysis <strong>of</strong> failure effects were<br />
combined through representing whole sequences <strong>of</strong> events that could produce an accident;<br />
the ‘causal chain’, and calculating the probability <strong>of</strong> occurrence <strong>of</strong> those sequences. In <strong>risk</strong><br />
assessments for technical systems this approach is <strong>of</strong>ten referred to as Probabilistic Safety<br />
Assessment (PSA) 10 . The representation <strong>of</strong> the ‘causal accident chain’ in a PSA is what we<br />
call a ‘<strong>risk</strong> model’. The causal chains in PSAs were very limited and almost exclusively<br />
hardware related. Even when human factors came were introduced by Swain & Guttmann<br />
[1983] it was as a hardware analogy in terms <strong>of</strong> failure modes. The first attempts to put in<br />
the errors <strong>of</strong> commission and the underlying management factors came in the 1980s and are<br />
still ongoing. PSA was first applied for the US manned spaceflight program in the 1960s.<br />
NASA had posed a requirement for 0.999 probability <strong>of</strong> crew safety and 0.99 probability <strong>of</strong><br />
mission success for each Apollo missions [Kelly 2001]. PSA was developed further in the<br />
nuclear power industry in the US. The first full-scale application <strong>of</strong> these methods to a<br />
commercial powerplant was undertaken in the Reactor Safety Study WASH-1400<br />
published by the American Nuclear Regulatory Commission NRC in 1975 [NRC 1975].<br />
Major accidents in chemical factories resulted in the introduction <strong>of</strong> similar techniques in<br />
those industries. After the Flixborough disaster 11 it was recommended that some method<br />
should be developed and used to estimate realistic accident consequences and to associate<br />
these estimates with a probability [Ale 2005]. Similar developments took place in other<br />
countries and probabilistic <strong>risk</strong> analysis is now applied in most safety critical industries. In<br />
several countries or industries there is some degree <strong>of</strong> standardisation in methodology in<br />
order to make the use <strong>of</strong> quantitative <strong>risk</strong> analysis viable in policy making and execution.<br />
2.7. Conclusions for this section<br />
Risk is a combination <strong>of</strong> the probability <strong>of</strong> occurrence <strong>of</strong> harm and the severity <strong>of</strong> the harm.<br />
Safety is freedom from unacceptable <strong>risk</strong>. The current research will be limited in scope to<br />
direct effects on the health <strong>of</strong> people. The acceptability <strong>of</strong> <strong>risk</strong> is influenced by <strong>risk</strong><br />
perception. The level <strong>of</strong> perceived <strong>risk</strong> is influenced by many factors, including the level <strong>of</strong><br />
control, the chance <strong>of</strong> multiple fatalities, the time passed since a similar event took place,<br />
whether the exposure to <strong>risk</strong> is voluntary, etc. For the purpose <strong>of</strong> this study the scope will<br />
10<br />
Probabilistic Risk Assessment (PRA) and Quantitative Risk Assessment (QRA) are also<br />
commonly used but the meaning is the same.<br />
11<br />
This accident happened on June 1, 1974 in a chemical plant in Flixborough, UK. A crack<br />
in a temporary bypass pipe caused the accidental release <strong>of</strong> a vapour cloud <strong>of</strong> cyclohexane.<br />
The vapour cloud exploded, as a result <strong>of</strong> which 28 people were killed.<br />
21
e restricted to ‘objective’ <strong>risk</strong>. The focus <strong>of</strong> the study are causal <strong>risk</strong> <strong>models</strong> that have<br />
<strong>air</strong>craft crash <strong>risk</strong> as an output. The research is not extended to third party <strong>risk</strong>, although the<br />
results <strong>of</strong> such <strong>models</strong> can easily be used as input for third party <strong>risk</strong> calculations.<br />
Policies to control major <strong>risk</strong>s have been in development from the 1960s onwards. Many <strong>of</strong><br />
these policies are based on some sort <strong>of</strong> quantification <strong>of</strong> the <strong>risk</strong> that could be allowed to<br />
continue. The concept <strong>of</strong> a level <strong>of</strong> safety has certain implications. Because safety cannot<br />
be measured directly, an alternative approach to quantifying safety is necessary to be able<br />
to demonstrate that a certain target has been or will be met. In most safety critical<br />
industries, Probabilistic Safety Assessment is used to quantify <strong>risk</strong>. A causal model can be a<br />
tool for conducting probabilistic safety assessments. It is a probabilistic representation <strong>of</strong><br />
the ‘causal chain’, the sequence <strong>of</strong> events that could produce an accident. Such a model can<br />
be used in both a TLS and an ALARP approach to safety. For both approaches it is<br />
necessary that the model produces output in objectively quantifiable units and that the<br />
results are reproducible, but the required accuracy <strong>of</strong> the causal <strong>risk</strong> model output is less for<br />
application in an ALARP approach than for a TLS application. Inclusion <strong>of</strong> human and<br />
organisational factors in the <strong>models</strong> is essential because they have a strong effect on safety<br />
and are influenced by managerial decisions. The call for more systemic views on accident<br />
causation and the underlining <strong>of</strong> the role <strong>of</strong> ‘normal’ occurrences in accident causation<br />
emphasise the need for <strong>risk</strong> <strong>models</strong> that go beyond traditional ‘hard wired’ approaches like<br />
fault trees and events trees. The causal <strong>risk</strong> model should be able to represent the seemingly<br />
stochastic and evolving nature <strong>of</strong> the system in relation to its hazards.<br />
The following requirements were derived in this chapter:<br />
• The model output should be ‘objective’ <strong>risk</strong>.<br />
• The model output should be expressed in objectively quantifiable units.<br />
• The model results should be reproducible.<br />
• Human and organisational influences on safety should be represented in the<br />
model.<br />
22
Chapter 3. Fundamentals <strong>of</strong> causation and probability<br />
The subject <strong>of</strong> this research is causal <strong>risk</strong> modelling. A causal <strong>risk</strong> model describes,<br />
probabilistically, the causal relations between certain parameters and <strong>risk</strong>. To better<br />
understand these <strong>models</strong> and how they can be used for <strong>risk</strong> reduction and safety<br />
management it is necessary to describe ‘causation’ and some <strong>of</strong> its characteristics. To do<br />
that, we must also briefly touch some aspects <strong>of</strong> probability theory. Their consequences for<br />
the feasibility <strong>of</strong> building causal <strong>risk</strong> <strong>models</strong> will be summarised as a set <strong>of</strong> requirements<br />
and issues to be resolved.<br />
3.1. What is causation?<br />
Intuitively, we think <strong>of</strong> a cause as “something that can bring about an effect or result”.<br />
Cause and effect are inseparable. Without some kind <strong>of</strong> effect the word cause has no<br />
meaning. However, the causes <strong>of</strong> an effect may not always be evident. This can be the<br />
result <strong>of</strong> our lack <strong>of</strong> knowledge, but there is also a second, more subtle characteristic that<br />
can make discussions about cause and effect rather complicated. Consider the example <strong>of</strong> a<br />
forest fire, which can be caused by, say, lightning or a match. In both cases however, there<br />
would be no forest fire without the oxygen that is in the <strong>air</strong>. Is it therefore correct to say that<br />
the oxygen is a cause <strong>of</strong> the fire? [Halpern & Pearl 2001]. Any fire requires three elements:<br />
Combustible material, oxidizer and heat. From the viewpoint <strong>of</strong> fire physics, all three<br />
elements are equally important: remove any one <strong>of</strong> these three elements and the fire will not<br />
start, or will die-out (Figure 3).<br />
OXYGEN IGNITION<br />
FUEL<br />
Figure 3: Fire triangle.<br />
In the example <strong>of</strong> the forest fire, the lightning strike or the match is the final element that<br />
completes the fire triangle and as such is the initiator <strong>of</strong> the event. In legal terms the dried<br />
leaves and wood <strong>of</strong> the forest and the oxygen each are a causa sine qua non and the match<br />
is a causa causans. Most people think <strong>of</strong> ‘cause’ in terms <strong>of</strong> causa causans. This is not<br />
something new. In ancient Greek the word αιτια not only means cause, but also guilt and<br />
accusation [Muller & Thiel 1986]. When the objective is to assign blame for the forest fire,<br />
the difference between causa sine qua non and causa causans is considered relevant, the<br />
responsible is the causa causans. When the objective is to extinguish the fire, the difference<br />
23
is irrelevant. The fire-fighter will remove any one <strong>of</strong> the three elements <strong>of</strong> the fire triangle.<br />
Which causal factor is removed depends on practical issues. For a forest fire it is more<br />
convenient to remove the heat by applying water, for a fire in a confined space, such as a<br />
frying pan on fire, it may be more practical to remove the oxygen by covering the fire with<br />
a blanket.<br />
Causation versus association<br />
Our knowledge <strong>of</strong> the chemistry <strong>of</strong> a fire allows us to determine the causes <strong>of</strong> the forest<br />
fire. In other cases our knowledge <strong>of</strong> underlying processes is limited, but we may observe<br />
that the occurrence <strong>of</strong> an event and a certain factor is <strong>of</strong>ten correlated. Such statistical<br />
associations are <strong>of</strong>ten used, for instance to demonstrate the beneficial effect <strong>of</strong> a new kind<br />
<strong>of</strong> medicine. Yet association is not necessarily causation. In Macedonia there is a strong<br />
correlation (in location) between the number <strong>of</strong> children being born and the number <strong>of</strong><br />
nesting storks but storks do not cause children to be born. Instead there is a common cause,<br />
the villages, which also provide a good habitat for the storks [Van den Brink & Koele<br />
1985]. If one compares sales figures for, say, ice-cream and sunscreen lotion, it will be<br />
discovered that these are statistically associated. When figures for ice-cream sales go up, so<br />
do figures for sunscreen sales. When sales figures for ice-cream go down, sunscreen sales<br />
also drop. Ice-cream sales and sunscreen sales are statistically associated but the one does<br />
not cause the other. They are both caused by a third common factor; hot sunny weather.<br />
Information on a statistical association between parameters A and B can be very useful<br />
when it is difficult to measure parameter A. Data on parameter B can be used to estimate<br />
parameter A values. It is not necessary to know the origin <strong>of</strong> the association to provide this<br />
estimate as long as the correlations hold across all conditions covered, but it is vital to<br />
distinguish these ‘proxy’ parameters from the causal ones, in case the model moves outside<br />
the region where the correlation holds. When the objective is to control parameter A, for<br />
instance increase its average value, a statistical association alone is quite useless. The<br />
owner <strong>of</strong> an ice-cream parlour, knowing the statistical association between ice-cream sales<br />
and sunscreen sales can put up bill boards for sunscreen lotion, but this will not increase his<br />
sales figures for ice-cream. To be able to control, it is necessary to have knowledge on<br />
causation. Because the goal <strong>of</strong> a causal <strong>risk</strong> model <strong>of</strong> aviation is to manage and improve<br />
safety (i.e. to control), these <strong>models</strong> must capture causation.<br />
It is generally agreed that where an association is found it is, in the absence <strong>of</strong> a known or<br />
proven mechanism, ultimately a question <strong>of</strong> judgement whether the evidence is sufficient to<br />
establish a causal relationship [Court <strong>of</strong> Session 2005]. <strong>Causal</strong> claims cannot be<br />
substantiated from associations alone. Behind every causal conclusion there must lie some<br />
causal assumptions or known mechanisms [Pearl 2003]. Inferring causal relations requires<br />
subject-specific background knowledge. This means that in order to build a causal <strong>risk</strong><br />
model <strong>of</strong> a particular system, we must understand that system. We must know the<br />
‘mechanisms’ within the system. In the example <strong>of</strong> ice-cream and sunscreen, the causal<br />
relationship may seem obvious and even trivial, but in many (complex) systems causal<br />
relations are far from obvious. Extensive knowledge <strong>of</strong> the system mechanisms is required<br />
to correctly identify causal relations and thus to be able to construct a causal <strong>risk</strong> model.<br />
This may seem trivial, but apparently it is not. According to Stephen Jay Gould [1981], the<br />
invalid assumption that correlation implies cause is probably among the two or three most<br />
serious and common errors <strong>of</strong> human reasoning. A few examples <strong>of</strong> the difficulties and<br />
controversies with statistical associations and causation are given below.<br />
24
Confusion between causation and statistical associations<br />
Post war diseases<br />
War syndromes have been associated with armed conflicts at least since the U.S. Civil War<br />
(1861-1865) but research efforts to date have been unable to conclusively show causality<br />
[Hyams et al 1996, Jones et al 2002]. Explanatory causes that were proposed have varied<br />
from the heavy marching packs compressing the chest (U.S. Civil War 1861-1865, Boer<br />
War 1899-1902) to concussion from modern weapons (World War I 1914-1918), the use <strong>of</strong><br />
Agent Orange (Vietnam War 1957-1975) and the use <strong>of</strong> depleted uranium in armour<br />
penetrating ammunition (Persian Gulf War 1991).<br />
Health effects <strong>of</strong> electromagnetic fields<br />
Concern about possible adverse health effects from exposure to extremely low-frequency<br />
electric and magnetic fields (EMF) emanating from the generation, transmission and use <strong>of</strong><br />
electricity was first brought about by an epidemiologic study concerning a relation between<br />
<strong>risk</strong> <strong>of</strong> childhood leukaemia and exposure to EMF [Wertheimer & Leeper 1979]. But a<br />
more recent review <strong>of</strong> the epidemiologic literature on EMF and health concludes that in the<br />
absence <strong>of</strong> experimental evidence and given the methodological uncertainties in the<br />
epidemiologic literature, there is no chronic disease for which an explanatory relation to<br />
EMF can be regarded as established [Ahlbohm et al 2001].<br />
These examples demonstrate why inferring causal relations requires subject-specific<br />
background knowledge. It is therefore essential for developers <strong>of</strong> a causal model <strong>of</strong> aviation<br />
safety to have substantial knowledge on all relevant aspects <strong>of</strong> aviation, including<br />
technology, operations, regulation and procedures for the complete lifecycle. Absence <strong>of</strong><br />
subject matter knowledge will lead to causal <strong>risk</strong> <strong>models</strong> that produce misleading results.<br />
Going back to the example <strong>of</strong> post war diseases, it is easy to imagine how ineffective or<br />
even counterproductive treatments will be prescribed if any one <strong>of</strong> the above mentioned<br />
cause effect relations are reproduced alone in, say, a diagnostic model.<br />
Indeed, statistical associations can be hopelessly confusing, as is illustrated by Simpson’s<br />
paradox. Simpson’s paradox refers to the phenomenon whereby an event C increases the<br />
probability <strong>of</strong> E in a given population p and, at the same time, decreases the probability <strong>of</strong><br />
E in every subpopulation <strong>of</strong> p. For example, in Table 1, if we associate C (connoting cause)<br />
with taking a drug, E (connoting effect) with recovery, then the drug seems to have no<br />
beneficial effect on both males and females compared to no drug and yet is beneficial to the<br />
population as a whole.<br />
Table 1: Simpson’s paradox.<br />
Combined Effect No effect Recovery rate<br />
Drug 20 20 50%<br />
No drug 16 24 40%<br />
Males Effect No effect Recovery rate<br />
Drug 18 12 60%<br />
No drug 7 3 70%<br />
Females Effect No effect Recovery rate<br />
Drug 2 8 20%<br />
No drug 9 21 30%<br />
25
In this example, the drug appears beneficial overall because the males, who recover<br />
(regardless <strong>of</strong> the drug) more <strong>of</strong>ten then the females, are also more likely then the females<br />
to use the drug. Being a male is a factor that influences both C and E [Pearl 2000a].<br />
3.2. Conditional independence<br />
The notion <strong>of</strong> conditional independence can be used to further illustrate the difference<br />
between causality and statistical association. Consider again the events IC that describes<br />
ice-cream sales and SC that describes sunscreen sales. We may observe a high correlation<br />
between IC and SC. Whenever we observe high values <strong>of</strong> SC, we observe high values <strong>of</strong> IC<br />
as well. We might well infer that SC causes IC. However, someone points out that IC and<br />
SC may have a common cause. Sunshine (SU) may cause IC and SC. In other words, there<br />
is no real causal link between SC and IC, but the constant association is caused by some<br />
other factor, SU, which causes both. We capture this by saying that given SU, SC tells us<br />
nothing about IC. In other words, SC and IC are independent given SU. SC does not cause<br />
IC.<br />
Independent events; definition<br />
Events A and B are independent if P(A∩B) = P(A)p(B)<br />
Conditionally independent events; definition<br />
Events A and B are conditionally independent given the event C, written A┴B│C, if<br />
P(A∩B│C) = P(A│C) P(B│C)<br />
This is a symmetric relation between A and B: A┴B│C implies B┴A│C. It also implies<br />
A┴B c │C. However, it neither implies nor is implied by A┴B│C c . To assume that A┴B│C<br />
means that A and B are independent if C occurs and does not say anything <strong>of</strong> the relation<br />
between A and B if C does not occur.<br />
Figure 4: Flight control system.<br />
As an example, consider the flight control system <strong>of</strong> Figure 4. Let A and B denote the<br />
events that actuators A and B fail to operate. Let C be a common mode failure that can<br />
cause an operational failure <strong>of</strong> both actuators, for instance loss <strong>of</strong> hydraulic pressure. If C<br />
occurs, then if B fails to operate, A will fail as well. If C does not occur, then A and B may<br />
still fail to operate, but then they would fail independently. Hence A and B are independent<br />
given that C does not occur, but given that C does occur, they are highly dependent.<br />
26
Notice also that P(A|C) does not necessarily imply that A is the effect and C is the cause.<br />
Take the example A = car does not start, C = empty fuel tank. Both P(A|C) and P(C|A)<br />
exist. In order to be able to differentiate between cause and effect there must be additional<br />
information on the direction <strong>of</strong> the relation between C and A. In a causal model this<br />
direction is indicated by a directed edge (see section 3.7).<br />
3.3. Causation to predict the future<br />
One <strong>of</strong> the main reasons why we are interested in causation is because it allows us to<br />
predict system behaviour if we assume that the past and present determine the future.<br />
Among the first scientists to seriously address this issue were the German philosopher<br />
Immanuel Kant (1724-1804) and the French mathematician Pierre Simon Laplace (1749-<br />
1827). Kant stated that every effect has a cause which is a prior event and that this cause<br />
effect relation is ‘fixed’. Therefore, if we have observed, in the past, that certain causes<br />
have certain effects we can assume that the same causes will have the same effects in the<br />
future [Kant 1781]. Laplace went even further when he published his theory <strong>of</strong> scientific<br />
determinism. He wrote [Laplace 1814]:<br />
"We may regard the present state <strong>of</strong> the universe as the effect <strong>of</strong> its past and the cause<br />
<strong>of</strong> its future. An intellect which at any given moment knew all <strong>of</strong> the forces that animate<br />
nature and the mutual positions <strong>of</strong> the beings that compose it, if this intellect were vast<br />
enough to submit the data to analysis, could condense into a single formula the<br />
movement <strong>of</strong> the greatest bodies <strong>of</strong> the universe and that <strong>of</strong> the lightest atom; for such<br />
an intellect nothing could be uncertain and the future just like the past would be<br />
present before its eyes."<br />
According to Laplace’s conception <strong>of</strong> nature, all laws in nature are deterministic, and<br />
randomness surfaces merely due to our ignorance <strong>of</strong> the underlying boundary conditions<br />
[Pearl 2000b]. Werner Heisenberg‘s (1901-1976) uncertainty principle shows that Laplace's<br />
vision, <strong>of</strong> a complete prediction <strong>of</strong> the future, cannot be realised (although Albert Einstein<br />
(1879-1955) did not agree with Heisenberg, because, according to Einstein, “God does not<br />
play dice with the universe”). According to Heisenberg’s principle, effects do not follow<br />
causes in a rigorous chain <strong>of</strong> events [Feynman 1965]. Nevertheless, we assume that to a<br />
very good approximation the laws <strong>of</strong> science behave deterministically. The problem then<br />
becomes one <strong>of</strong> complexity, there are simply too many variables (or in Laplace’s words,<br />
too many forces and beings that compose nature) to encompass. Because <strong>of</strong> this, all theories<br />
and <strong>models</strong> are approximations and we use probabilities to express the resulting<br />
uncertainty 12 . Apparent stochastic behaviour is then introduced in our deterministic view <strong>of</strong><br />
the world as a result <strong>of</strong> our approximations. Each approximation introduces an error term<br />
with respect to the ‘true’ value. The error propagates when numerical operations with other<br />
uncertain quantities are being conducted. Under some conditions the error term may grow<br />
disproportionately fast. Prigogine [1977] introduced the concept <strong>of</strong> bifurcation points.<br />
According to this theory a system which has bifurcations will imply both deterministic and<br />
probabilistic elements. In between two bifurcation points the system behaves<br />
deterministically, but in the neighbourhood <strong>of</strong> the bifurcation points fluctuations play an<br />
essential role and determine the ‘branch’ that the system will follow. The outcome <strong>of</strong> the<br />
model will then be increasingly uncertain when more cause effect relations are called upon,<br />
typically when predictions further into the future are made. Rapid error accumulation may<br />
12<br />
De Finetti (1906-1985) stated that probability is an expression <strong>of</strong> the observer’s view <strong>of</strong><br />
the world and has no existence <strong>of</strong> its own – probability does not exist (quoted by Lindley<br />
[1986]).<br />
27
ender the model outcome too uncertain to be <strong>of</strong> practical use. This is the reason why longterm<br />
weather forecasts are unreliable. The behaviour <strong>of</strong> the system can also be extremely<br />
sensitive to the values <strong>of</strong> the input parameters such that ‘the flap <strong>of</strong> a butterfly wing in<br />
Brazil may cause a tornado in Texas’ [Lorenz 1993]. Small variations in the input<br />
parameters may lead to large differences in the model results. For these reasons uncertainty<br />
analysis and sensitivity analysis are an essential element <strong>of</strong> model development.<br />
But as long as extreme conditions (such as <strong>air</strong>craft approaching the speed <strong>of</strong> light) are<br />
avoided and the model is not used to look far into the future (i.e. we do not look beyond the<br />
next bifurcation point), there is no fundamental reason why a causal model would not be<br />
able to predict the future, albeit with some uncertainty. How far ahead the model is able to<br />
predict and with which accuracy depends on the level <strong>of</strong> detail <strong>of</strong> the required output, the<br />
accuracy <strong>of</strong> the model input, and the validity <strong>of</strong> the model.<br />
The challenge is to “know all <strong>of</strong> the forces that animate nature and the mutual positions <strong>of</strong><br />
the beings that compose it”. As mentioned before, this task is too big and we must think <strong>of</strong><br />
approximations. For the purpose <strong>of</strong> this study we are not interested in a complete prediction<br />
<strong>of</strong> the future but only a part <strong>of</strong> it. We must therefore define a boundary <strong>of</strong> what we need to<br />
represent in the model. The ‘rest <strong>of</strong> the world’ can then be ignored, except for changes (e.g.<br />
in technology or organisation) outside the defined boundary that affect changes in the<br />
elements and structure <strong>of</strong> the model. Instead <strong>of</strong> determining ‘the forces that animate nature’,<br />
we could choose to look for causation at a higher level <strong>of</strong> aggregation. Another solution<br />
would be to leave out parts with a (predictable) minor effect.<br />
3.4. Singular and generic causal relations<br />
Confusion between singular and generic causal relations is a potential source for<br />
misunderstanding which can undermine one’s confidence in model results. Therefore the<br />
difference is addressed in this section.<br />
Singular causal relationships are those between concrete singular occurrences <strong>of</strong> events. An<br />
example <strong>of</strong> a singular causal relationship is “Cigarette smoking is the cause <strong>of</strong> mrs.<br />
McTear’s lung cancer”. A generic causal relationship would be that “smoking cigarettes<br />
causes lung cancer”. A causal <strong>risk</strong> model is most likely a set <strong>of</strong> generic causal relations; it<br />
does not make much sense to construct a model that can only represent a concrete singular<br />
occurrence <strong>of</strong> events. In most cases, we arrive at generic causal relations by generalising<br />
from individual cases <strong>of</strong> occurrence and then apply this general knowledge to other<br />
individual occurrences [Hesslow 1988]. Under current law, evidence <strong>of</strong> a generic causal<br />
influence is not always strong enough to enforce liability claims in court. There must be<br />
pro<strong>of</strong> that a given phenomenon was the actual singular cause <strong>of</strong> the observed effect. The<br />
following statement by a judge when delivering judgement in the case <strong>of</strong> an individual<br />
against a tobacco company illustrates this:<br />
“Given that there are possible causes <strong>of</strong> lung cancer other than cigarette smoking, and<br />
given that lung cancer can occur in a non-smoker, it is not possible to determine in any<br />
individual case whether but for an individual’s cigarette smoking he probably would not<br />
have contracted lung cancer. Epidemiology cannot be used to establish causation in any<br />
individual case, and the use <strong>of</strong> statistics applicable to the general population to determine<br />
the likelihood <strong>of</strong> causation in an individual is fallacious [Court <strong>of</strong> Session 2005]. 13<br />
13<br />
This is one judgment but there are others, especially on asbestos, placing the onus <strong>of</strong><br />
pro<strong>of</strong> on the company to show that a generic cause was not valid in a specific case.<br />
28
The difference between singular and generic causal relations is particularly important when<br />
causation is used to determine responsibility or guilt, but that is not the purpose <strong>of</strong> the<br />
causal <strong>risk</strong> <strong>models</strong> that are subject <strong>of</strong> this thesis.<br />
The other way around, the absence <strong>of</strong> a singular cause effect relation is not sufficient to<br />
negate a generic causal relation. A 95 year old heavy smoker without health problems is not<br />
a pro<strong>of</strong> that smoking is not harmful. Yet such singular examples may be compelling and<br />
people’s faith in causal <strong>risk</strong> <strong>models</strong> may very well be eroded if they happen to know a few<br />
<strong>of</strong> such singular examples that are seemingly contradictory to the generic model relations.<br />
A <strong>risk</strong> model that not only explicitly represents failure scenarios but also success scenarios<br />
would be helpful in this respect.<br />
3.5. Strong and weak causal relations<br />
Another potential source <strong>of</strong> confusion is the difference between weak and strong<br />
relationships. In some cases, cause effect relations can be considered strong, in the sense<br />
that the occurrence <strong>of</strong> the cause will always result in the effect. An example is the cause<br />
‘empty fuel tank’ and the effect ‘car does not start’. Other cause-effect relations may be<br />
weaker. An example is the cause ‘cigarette smoking’ and the effect ‘lung cancer’. The fact<br />
that someone has a habit <strong>of</strong> smoking cigarettes does not always results in the person<br />
developing lung cancer, although the probability for lung cancer is greatly increased when<br />
someone smokes. The ‘weakness’ <strong>of</strong> the cause-effect relation depends on the conditional<br />
probability P (effect | cause). If this conditional probability is 1 or close to 1 (as in the case<br />
<strong>of</strong> the car example) the cause-effect is strong. If the conditional probability is close to 0, the<br />
relation is weak. A weak statistical association should however not be taken as indicating a<br />
non-causal relationship. Weak statistical associations may be seen for instance if an effect<br />
is common and there are numerous possible causal pathways towards that effect.<br />
A weak cause-effect relationship does not require high probabilities to be acceptable. What<br />
is important is the statistical relevance <strong>of</strong> the relationship. When a certain drug increases the<br />
recovery rate from 5% to 10% it is the statistical significance <strong>of</strong> the difference between the<br />
treatment group and the control group that determines whether we accept that there is pro<strong>of</strong><br />
that the drug is working.<br />
3.6. The beginning and the end <strong>of</strong> causation<br />
An obvious question to ask when the cause <strong>of</strong> an effect has been determined is “What<br />
causes the cause?” This question is not only interesting from a philosophical point <strong>of</strong> view<br />
but is also relevant for accident prevention. If the cause <strong>of</strong> an accident is determined to be<br />
pilot fatigue this is interesting to know but in order to prevent similar occurrences from<br />
happening we usually need to know what caused the fatigue, i.e. what caused the cause 14 .<br />
Only then are we able to take measures to safeguard against similar events. If we are<br />
sufficiently clever and persevering we can continue determining the causes <strong>of</strong> causes right<br />
up to the big bang that created the universe. In a similar fashion we can think <strong>of</strong> the effects<br />
<strong>of</strong> effects. In the event <strong>of</strong> an <strong>air</strong>craft crash an immediate effect may for instance be the<br />
release <strong>of</strong> toxic substances into the atmosphere if the <strong>air</strong>craft was carrying hazardous<br />
materials as cargo. This may then cause, perhaps even years later, health problems for<br />
people exposed to those materials. <strong>Causal</strong> chains never really end, but for practical<br />
purposes the model must.<br />
14<br />
Unless we can detect the presence <strong>of</strong> this proximal cause and take preventive measures<br />
on it, i.e. in this case detect fatigued pilots and prevent them from flying.<br />
29
If we adopt Leveson’s [2004a] system approach to accidents, where safety is seen as an<br />
emergent property <strong>of</strong> a system, we are still faced with a similar problem: the operation <strong>of</strong><br />
the processes at the lower level <strong>of</strong> abstraction cause the emergent properties at the higher<br />
level <strong>of</strong> complexity. The question ‘how far back or forward the causal chain’ is replaced by<br />
‘how many levels down or up the scale <strong>of</strong> abstraction’.<br />
So how do we decide how far back or up along the causal chains to model? In the past the<br />
answer to this question has <strong>of</strong>ten been data driven. We know how <strong>of</strong>ten component X fails,<br />
so we do not have to model why. This approach is satisfactory if the purpose <strong>of</strong> the model<br />
is the measurement <strong>of</strong> <strong>risk</strong> but if the purpose is to help determine where and how to<br />
intervene to control <strong>risk</strong> we need to use different criteria to determine how far to extend the<br />
causal model. We will need to go back along the causal chain until we find a place<br />
convenient for intervention. This then needs defining. According to Reason et al [2006],<br />
attempts to track down possible errors’ and accidents’ contributions further back in the<br />
causal chain, identifying factors that are widely separated in both time and place from the<br />
events themselves, have gone too far. In practice a useful criterion for the extent <strong>of</strong> the<br />
causal <strong>risk</strong> model is that it will have to include decisions and actions up to the highest<br />
managerial level <strong>of</strong> the actors that are directly involved.<br />
3.7. What is a causal model?<br />
The previous sections addressed causality in general and now and then referred to a causal<br />
<strong>risk</strong> model. But what exactly is a causal <strong>risk</strong> model? According to a formal definition, a<br />
causal model is a mathematical object that provides an interpretation and computation <strong>of</strong><br />
causal queries about the domain [Galles & Pearl 1998]. A causal model can be associated<br />
with a directed graph in which each node corresponds to a variable <strong>of</strong> the model and the<br />
directed edges (arrows) point from the variables that have direct influence to each <strong>of</strong> the<br />
other variables that they influence. This formal definition will be adopted in this thesis.<br />
Such a causal model can be used for backward reasoning and forward reasoning.<br />
Backward reasoning.<br />
Consider a situation where a patient visits a doctor because <strong>of</strong>, say, unremitting pain in the<br />
abdomen. The doctor will investigate the patient using a series <strong>of</strong> tests and use the results <strong>of</strong><br />
the tests to come up with a diagnosis and start treatment. The doctor uses the symptoms, i.e.<br />
the effects, to determine the most likely cause <strong>of</strong> the problem. This is called backward<br />
reasoning or causal inference: determining the most likely cause, given some observed<br />
effects.<br />
Forward reasoning.<br />
Consider a situation where a meteorologist observes particular phenomena, such as the<br />
location <strong>of</strong> a region <strong>of</strong> low pressure above the North Sea. The meteorologist will investigate<br />
the observed phenomena to come up with a weather prediction. The meteorologist uses the<br />
causes to determine the most likely effects. This is forward reasoning: determining the most<br />
likely effect, given a certain cause.<br />
<strong>Causal</strong> <strong>models</strong> for backward reasoning are specifically applied in medical sciences, but<br />
some applications in other fields have also been developed, for instance in social sciences.<br />
Examples are found in Onisko et al [1998] and Strotz & Wold [1960]. For <strong>air</strong> <strong>transport</strong><br />
safety, a causal model for backward reasoning could be applied during accident<br />
investigation. The model would then help to determine the most likely cause <strong>of</strong> the<br />
accident, given the evidence found by the investigators. However, given the thoroughness<br />
30
with which aviation accidents are currently investigated, it seems highly unlikely that a<br />
causal model would be able to add anything useful here. 15 However, it could order and<br />
organize the results across many accidents and that is essentially useful in support <strong>of</strong> the<br />
forward reasoning.<br />
<strong>Causal</strong> <strong>models</strong> for forward reasoning are applied in a wide range <strong>of</strong> sciences, including<br />
meteorology, finance and engineering. Models for <strong>risk</strong> assessment are examples <strong>of</strong> causal<br />
<strong>models</strong> for forward reasoning. As will be shown in the next sections, there is a need for<br />
such causal <strong>risk</strong> <strong>models</strong> for <strong>air</strong> <strong>transport</strong> safety. Therefore in the remainder <strong>of</strong> this thesis the<br />
scope will be limited to causal <strong>models</strong> for forward reasoning. Most importantly, there is<br />
need for a special case <strong>of</strong> forward reasoning; predicting the effect <strong>of</strong> changes. This has<br />
added complications because it may require the potential to change the model, thus setting<br />
requirements for the dynamics <strong>of</strong> the model.<br />
3.8. Conclusions for this section<br />
For the purpose <strong>of</strong> this thesis, the following definition <strong>of</strong> a causal model was adopted:<br />
A causal model is a mathematical object that provides an interpretation and computation <strong>of</strong><br />
causal queries about the domain [Galles & Pearl 1998]. A causal model can be associated<br />
with a directed graph in which each node corresponds to a variable <strong>of</strong> the model and the<br />
directed edges (arrows) point from the variables that have direct influence to each <strong>of</strong> the<br />
other variables that they influence.<br />
Usability requirements <strong>of</strong> the model determine whether statistical associations alone can be<br />
used to construct the model. If the purpose <strong>of</strong> the model is to predict, then a model based on<br />
statistical associations can be useful. But in our case the objective <strong>of</strong> the model is to<br />
intervene and statistical associations alone are not sufficient, there has to be an underlying<br />
assumption, a causal assumption. This causal assumption should be based on deeper<br />
knowledge on cause and effect through theoretical studies and accumulated knowledge.<br />
Statistical associations should be used carefully, as demonstrated by Simpson’s paradox<br />
and the examples <strong>of</strong> controversies related to interpreting statistical associations. It is<br />
therefore essential for developers <strong>of</strong> a causal model <strong>of</strong> aviation safety to have substantial<br />
knowledge on relevant aspects <strong>of</strong> aviation, including technology, operations, regulation and<br />
procedures for the complete lifecycle.<br />
What is actually the cause or causes <strong>of</strong> an event is not always unambiguous. To a certain<br />
extent, it is an assumption that has to be agreed upon by those who work with it. The<br />
agreement is necessary because the assumption has consequences. It is therefore necessary<br />
that the underlying assumptions are transparent. <strong>Causal</strong> chains never really end, but for<br />
practical purposes the model must. In practice a useful criterion for the extent <strong>of</strong> the causal<br />
<strong>risk</strong> model is that it will have to include decisions and actions up to the highest managerial<br />
level <strong>of</strong> the actors that are directly involved.<br />
Part <strong>of</strong> the complexity <strong>of</strong> causal relations is their apparent probabilistic nature. We <strong>of</strong>ten<br />
arrive at generic causal relations by generalising from individual cases <strong>of</strong> occurrence and<br />
then apply this general knowledge to other individual occurrences. But evidence <strong>of</strong> a<br />
generic causal relationship is not sufficient to prove a singular causal relationship, and the<br />
absence <strong>of</strong> a singular cause effect relation is not sufficient to negate a generic causal<br />
relation. This can lead to confusion and can seriously erode the confidence in causal <strong>risk</strong><br />
15<br />
Aircraft accident investigation is a process that takes approximately 2 years to complete<br />
and involves dozens <strong>of</strong> people, many <strong>of</strong> them working almost full time on a single accident.<br />
31
<strong>models</strong>. A strategy for avoiding this mistrust is explicitly representing failures scenarios as<br />
well as success scenarios in the model.<br />
The following requirements were derived in this chapter:<br />
• Model developers should have substantial knowledge on all relevant aspects <strong>of</strong><br />
aviation, including technology, operations, regulations and procedures for the<br />
complete lifecycle.<br />
• The <strong>risk</strong> model should explicitly represent failure scenarios as well as success<br />
scenarios.<br />
• The model will have to include decisions and actions up to the highest managerial<br />
level <strong>of</strong> the actors that are directly involved.<br />
The following issue needs to be resolved:<br />
• A boundary must be defined <strong>of</strong> what needs to be represented in the model.<br />
• The highest managerial level <strong>of</strong> the actors that are directly involved needs to be<br />
defined.<br />
32
Chapter 4. User needs<br />
This section will describe user needs for a causal <strong>risk</strong> model and model design<br />
specifications. When explicitly asked, most potential users have difficulty in listing their<br />
requirements because they do not have a clear picture <strong>of</strong> the possible performance <strong>of</strong> a<br />
causal <strong>risk</strong> model. Therefore user requirements must be derived in a different way. This is<br />
done by first describing how flight safety has evolved over the years and identifying the<br />
obstacles for further safety improvement. These obstacles are basically the problem that a<br />
causal <strong>risk</strong> model must help solving and are therefore the basis for the requirements. We<br />
then ask the question <strong>of</strong> who the expected users will be. A review <strong>of</strong> existing quantitative<br />
safety regulation in aviation, including a description <strong>of</strong> how the industry is expected to<br />
demonstrate compliance to those regulations, will provide insight into the type <strong>of</strong><br />
regulatory requirements that can be expected for a causal <strong>risk</strong> model. Being one <strong>of</strong> the<br />
possible areas <strong>of</strong> application <strong>of</strong> a causal <strong>risk</strong> model, the use <strong>of</strong> quantitative <strong>risk</strong> assessment<br />
is discussed to be able to comprehend the resulting methodological requirements. Emphasis<br />
is placed on the position <strong>of</strong> the test pilot, because this explains the fundamentally different<br />
views on the ability to make quantitative assessments <strong>of</strong> accident <strong>risk</strong>, specifically when it<br />
comes to modelling human actions and decisions, between <strong>air</strong>craft design and <strong>air</strong> traffic<br />
management. As a matter <strong>of</strong> fact, all stakeholders in the aviation system hold a different<br />
view on aviation safety and consequently have different needs with respect to aviation<br />
safety modelling. Nevertheless, some common requirements can be identified.<br />
4.1. A brief history <strong>of</strong> aviation safety<br />
Aviation has realised tremendous improvements in flight safety since the first commercial<br />
<strong>air</strong>lines started operating around 1920. While flying in those pioneering years was still an<br />
adventure, and pilots like Jean Mermoz [Mermoz 1937] and Charles Lindbergh [Lindbergh<br />
1953] were true death defying heroes, <strong>air</strong> <strong>transport</strong> today is fundamentally safe and the<br />
<strong>air</strong>craft has become a means <strong>of</strong> mass <strong>transport</strong>ation. More than 2100 million passengers<br />
were carried on scheduled flights in 2006, and 39 million tonnes <strong>of</strong> freight were <strong>transport</strong>ed<br />
(ICAO statistics, December 2006). Continuous technological and operational improvements<br />
have led to today’s exemplary safety record. This section describes the history <strong>of</strong> aviation<br />
safety improvements and explains why further improvements cannot be expected unless<br />
something different is done to find possible ways for improvement. The ‘something<br />
different’ includes the development and use <strong>of</strong> causal <strong>risk</strong> <strong>models</strong>.<br />
33
Number <strong>of</strong> accidents per 100,000 flights<br />
0.35<br />
0.3<br />
0.25<br />
0.2<br />
0.15<br />
0.1<br />
0.05<br />
0<br />
Fatal accident rate, commerical operations<br />
1950 1955 1960 1965 1970 1975 1980 1985 1990 1995 2000 2005<br />
Year<br />
Figure 5: Accident rate history Source: <strong>NLR</strong> Air Safety Database.<br />
In the early days <strong>of</strong> aviation, from 1903 to 1914, the man (they were all men) who built the<br />
<strong>air</strong>craft was <strong>of</strong>ten also the first person to fly the <strong>air</strong>craft, and he used what he felt and saw<br />
during the test flights to further improve the vehicle. After World War I (1914-1918)<br />
commercial aviation rapidly developed and so did regulation. Most states established some<br />
sort <strong>of</strong> aeronautics branch that was made responsible for defining and ensuring the<br />
<strong>air</strong>worthiness <strong>of</strong> <strong>air</strong>craft, licensing <strong>of</strong> <strong>air</strong>men and development and enforcement <strong>of</strong> <strong>air</strong><br />
traffic rules [Hansen et al 2005]. A Certificate <strong>of</strong> Airworthiness became a mandatory<br />
requirement for each <strong>air</strong>craft model. In the Netherlands, the Certificate was only obtained if<br />
the engineers <strong>of</strong> the ‘Rijks Studiedienst voor Luchtvaart’ 16 (R.S.L.) had provided a positive<br />
verdict to the ‘Commissie voor Keuring van Luchtvaartmaterieel’ 17 . In addition, the State<br />
appointed pilot <strong>of</strong> the R.S.L. had to make a test flight. The description <strong>of</strong> the certification<br />
flight tests <strong>of</strong> the Lambach HL II provides a vivid example <strong>of</strong> how such a flight was<br />
conducted in 1937 in the Netherlands.<br />
Description <strong>of</strong> the certification test flights <strong>of</strong> the Lambach HL II.<br />
The Lambach HL II was a single seat aerobatics <strong>air</strong>craft, designed by Dutch engineer Hugo<br />
Lambach in 1937. It was powered by a 130 H.P. Gipsy Major engine and specifically<br />
developed to compete in aerobatics contests that were very popular in that time.<br />
Certification test flights took place in May 1937 from the <strong>air</strong>field “Ypenburg”, near The<br />
Hague. Three test flights were made, but only after the weight <strong>of</strong> the <strong>air</strong>craft had been<br />
determined under close supervision <strong>of</strong> ir. A.G. Von Baumhauer <strong>of</strong> the ‘Commissie voor<br />
Keuring van Luchtvaartmaterieel’.<br />
16<br />
Government Service for Aeronautical Studies<br />
17<br />
Commission for Approval <strong>of</strong> Aviation Equipment<br />
34
The first flight was made by dr. ir. H.J. van der Maas according to a previously established<br />
program. The objective <strong>of</strong> this flight was to determine the flight characteristics <strong>of</strong> the<br />
<strong>air</strong>craft. As part <strong>of</strong> the flight the longitudinal stability was determined, a yaw test was<br />
executed, stick forces and stick displacements were measured, etc. The effects <strong>of</strong> stopping<br />
and starting the engine at different flight states were also determined. Next it was the turn<br />
<strong>of</strong> the company pilot, Hein Schmidt Crans, who performed some aerobatics. He showed<br />
that the <strong>air</strong>craft could perform six consecutive spinning turns, which was a requirement for<br />
an approval certificate for unlimited aerobatics. Thereupon he flew two left rolls and one<br />
right roll and a half roll followed by inverted flight. During the inverted flight the engine<br />
was stopped and again started. This was followed by a half outward loop upwards, a half<br />
loop and a half roll. Dr. Ir. Van der Maas then made a third test flight during which also<br />
some aerobatics were undertaken. He performed a loop, spin, roll, snap roll and a vertical<br />
dive such that the end speed was obtained. Van der Maas performed no less than eight<br />
consecutive spin turns, after which he neatly noted in the flight test report “After exiting the<br />
spin, which probably took two turns, several seconds passed before the pilot had regained a<br />
focused view <strong>of</strong> the clouds”. In addition the test report noted that the engine caused some<br />
nuisance because occasionally it stalled briefly. Sometimes even a jolt was felt in the<br />
throttle, which indicated problems with the carburettor. Nevertheless, the overall conclusion<br />
was that the <strong>air</strong>craft conformed to the “requirements for flight characteristics in Order 471<br />
II” [Nijenhuis et al 1996].<br />
Figure 6: Lambach HL II.<br />
The fact that the certification test flight for this small <strong>air</strong>craft was conducted by dr. ir. Van<br />
der Maas 18 is exemplary <strong>of</strong> the importance that was (and still is) attached to the role <strong>of</strong> the<br />
certification test pilot, and the (scientific) skills and knowledge that were needed to perform<br />
this task. The test pilot combined the functions <strong>of</strong> pilot, observer and scientist.<br />
18<br />
Van der Maas had graduated as a maritime engineer from Delft University in 1923, after<br />
which he was employed at the R.S.L. He became the first pr<strong>of</strong>essor in Aeronautical<br />
Engineering in the Netherlands in 1940 and played a prominent role in setting up the<br />
Faculty <strong>of</strong> Aeronautical Engineering at Delft University <strong>of</strong> Technology. In 1950 he was<br />
appointed as ch<strong>air</strong>man <strong>of</strong> the Foundation N.L.L, which was renamed <strong>NLR</strong> in 1961. Van der<br />
Maas died in 1987.<br />
35
After World War II aviation became a means <strong>of</strong> mass <strong>transport</strong>ation. In the 1950s accidents<br />
during (test) flights were frequent [Wolfe 1979], but the knowledge gained during the<br />
flights and as a result <strong>of</strong> accident investigation contributed greatly to the development <strong>of</strong><br />
aviation as a reliable and safe means <strong>of</strong> <strong>transport</strong>. Safety improved tremendously from 1950<br />
to 2000, the worldwide fatal accident rate dropped from 3 accidents per million flights to<br />
less than 0.5 (see Figure 5). Most <strong>of</strong> the technological developments that contributed to<br />
improved safety were driven by a desire to increase the economical viability, with safety as<br />
a ‘byproduct’. Aircraft make money when they are in the <strong>air</strong>, not when they are grounded,<br />
and thus much effort was put into improving <strong>air</strong>craft reliability and the ability to fly in<br />
adverse weather conditions. Technological advances that contributed significantly to<br />
aviation safety include the following:<br />
• Jet engines, which have a lower failure rate than piston engines due to their<br />
inherently simpler design with less accelerating parts [Brown 1981].<br />
• Radio navigation systems have improved the flight crew’s ability to navigate and<br />
have virtually eliminated occurrences where <strong>air</strong>craft get lost and run out <strong>of</strong> fuel<br />
before finding a suitable landing place [Leary 1992, Abbink 1996].<br />
• Precision approach systems and automatic landing systems (precision approaches<br />
are five times more safe than non-precision approaches) because they help to keep<br />
the <strong>air</strong>craft on the correct approach path, even in conditions <strong>of</strong> reduced visibility,<br />
like fog [Enders et al 1996, Abbink 1996].<br />
• On-board weather radar has helped in avoiding hazardous weather.<br />
• Glass cockpits 19 provided an enormous increase in the possibility to directly<br />
interpret all aspects <strong>of</strong> navigation and the avoidance <strong>of</strong> bad weather and greatly<br />
increased the situational awareness <strong>of</strong> the pilots by integration <strong>of</strong> all information<br />
[Abbink 1996]. They also provide better support to the flight crew in the case <strong>of</strong><br />
technical failures, reducing the likelihood <strong>of</strong> flight crew errors in such abnormal or<br />
emergency conditions [Roelen & Wever 2005b]. Paradoxically, they have also<br />
contributed to accidents due to poor crew understanding <strong>of</strong> their s<strong>of</strong>tware logic<br />
[Sarter & Woods 1995].<br />
None <strong>of</strong> these technological advances were safety driven. The reason to develop the jet<br />
engine was the need for improved performance in terms <strong>of</strong> <strong>air</strong>craft speed and engine power.<br />
Radio navigation allowed the reduction <strong>of</strong> the flight crew to two pilots and a flight<br />
engineer, automatic landing systems increased productivity because <strong>air</strong>craft were far less<br />
dependent on local weather conditions. Precision navigation by means <strong>of</strong> GPS became<br />
available thanks to the United States Department <strong>of</strong> Defence that needed accurate targeting<br />
and guidance for their weapon systems. The step from electromechanical cockpit<br />
instruments to a glass cockpit was made to reduce maintenance costs and weight. It also<br />
allowed the elimination <strong>of</strong> the flight engineer from the flight deck, and thus provided a<br />
significant reduction in direct operating costs for the <strong>air</strong>lines. In addition to technological<br />
leaps, overall system reliability has gradually improved. Today an engine failure is such a<br />
rare event that most pilots will never experience it in their career 20 . Technological<br />
19<br />
In a glass cockpit the traditional electromechanical instruments are replaced by displays<br />
that are able to present integrated information.<br />
20<br />
The in-flight engine shutdown rate <strong>of</strong> a modern engine like the GE90-115B is 0.005 per<br />
1000 flight hours [Horibe et al 2004], i.e. one shutdown every 200,000 hours. For a twinengine<br />
<strong>air</strong>craft like the Boeing 777 this means one shutdown per 100,000 hours <strong>of</strong> flight.<br />
An <strong>air</strong>line pilot will have approximately 20,000 flying hours at the moment <strong>of</strong> his<br />
36
advancement in ATM on the other hand has been relatively slow because ATM has<br />
traditionally been the responsibility <strong>of</strong> national authorities and therefore has, until<br />
recently 21 , not experienced the effects <strong>of</strong> competition. A result is the use <strong>of</strong> technology that<br />
basically dates from WW II; VHF voice communication and radar.<br />
Regulatory requirements matured. Strength requirements for <strong>air</strong>craft structures were<br />
specified in terms <strong>of</strong> limit loads (the maximum loads to be expected in service) and<br />
ultimate loads (limit loads multiplied by prescribed factors <strong>of</strong> safety <strong>of</strong> 1.5). Aircraft<br />
manufacturers had to show compliance to these requirements by analysis supported by<br />
strength testing <strong>of</strong> sub-components, full scale components or full scale tests <strong>of</strong> assembled<br />
components (such as a nearly complete <strong>air</strong>frame) up to limit loads and ultimate loads. The<br />
structure must be able to support ultimate loads without failure for at least 3 seconds. When<br />
tests are used to show compliance, an additional safety factor <strong>of</strong> 1.15 is typically applied to<br />
account for variability in material properties [EASA 2003a].<br />
Regulatory requirements regarding <strong>air</strong>craft system safety also evolved. When automatic<br />
landing systems were designed in the 1950’s, <strong>air</strong>craft and equipment manufacturers asked<br />
the <strong>air</strong>worthiness authorities what requirements or special conditions would be applied to<br />
such systems. The authorities did not consider that they had the background and experience<br />
to write detailed requirements. Instead a target level <strong>of</strong> safety was agreed with the<br />
manufacturers as a base for certification. Applicants were required to make a case for their<br />
individual systems by assessing them against the declared objective. Subsequently detailed<br />
methods <strong>of</strong> establishing compliance were evolved. With the further development <strong>of</strong><br />
technology and complex systems, in particular related to supersonic <strong>transport</strong> <strong>air</strong>craft, the<br />
authorities from the USA, UK and France produced requirements that included the general<br />
principle that an inverse relationship should exist between the probability <strong>of</strong> occurrence<br />
and the degree <strong>of</strong> hazard inherent in its effect on the capability <strong>of</strong> the <strong>air</strong>craft. In addition,<br />
they specified a level <strong>of</strong> safety to be achieved, in qualitative and quantitative terms, and<br />
required that a safety assessment should be made. The concept <strong>of</strong> requiring an inverse<br />
relationship between probability <strong>of</strong> failure and the severity <strong>of</strong> the failure effect had in<br />
practice been established from the early days <strong>of</strong> aviation and resulted in, for instance, twin<br />
magnetos and twin spark plugs on engines, dual wing rigging wires and dual control cables.<br />
What was new in the requirements was the introduction <strong>of</strong> quantitative and numerical<br />
methods for addressing <strong>risk</strong> instead <strong>of</strong> the intuitive methods that had been used before<br />
[Lloyd 1980, Lloyd & Tye 1982]. In assessing the acceptability <strong>of</strong> a system design it was<br />
recognised that rational probability values would have to be established. Historical<br />
evidence indicated that the <strong>risk</strong> <strong>of</strong> a serious accident due to operational and <strong>air</strong>frame-related<br />
causes was approximately 1 per million hours <strong>of</strong> flight. Furthermore, about 10 percent <strong>of</strong><br />
the total could be (albeit arbitrarily) attributed to failure conditions caused by the <strong>air</strong>craft’s<br />
systems problems. It seemed reasonable that serious accidents caused by systems should<br />
not be allowed a higher probability than this in new <strong>air</strong>craft designs. It was thereby possible<br />
to require for new designs that the probability <strong>of</strong> a serious accident from all such system<br />
failure conditions be no greater than 1 per ten million flight hours, or 1 x 10 -7 per flight<br />
hour. As it is not possible to say whether the target has been met until all the systems on the<br />
<strong>air</strong>craft are collectively analysed numerically, it was assumed, arbitrarily, that there are<br />
retirement. The probability that at some point in his entire career he will have had to shutdown<br />
an engine in-flight is approximately 1 in 5.<br />
21<br />
ANSPs in Europe are becoming more independent from the national authorities; NATS<br />
in the UK for example is fully privatised and LVNL in the Netherlands is a ‘Zelfstandig<br />
bestuursorgaan’.<br />
37
about 100 potential system failure conditions in an <strong>air</strong>craft, which would prevent continued<br />
safe flight and landing. The target allowable <strong>risk</strong> <strong>of</strong> 1 x 10 -7 per flight hour was thus<br />
apportioned equally among these conditions, resulting in a <strong>risk</strong> allocation <strong>of</strong> not greater<br />
than 1 x 10 -9 to each. The upper-<strong>risk</strong> limit for failure conditions, which would prevent<br />
continued safe flight and landing would be 1 x 10 -9 for each hour <strong>of</strong> flight, which<br />
establishes an approximate probability value for the term ‘extremely improbable’. Failure<br />
conditions having less severe effects on the capability <strong>of</strong> the <strong>air</strong>craft could be allowed to be<br />
relatively more likely to occur.<br />
Accidents involving (many) fatalities have also been important drivers for safety<br />
improvements. Each accident is thoroughly investigated and measures are taken to prevent<br />
a similar occurrence. Simply stated this is the ‘fix and fly’ approach. In some instances<br />
accidents may reveal weaknesses that hitherto were unknown, such as in the case <strong>of</strong> the<br />
Comet disasters (see infobox Comet disaster), in other cases the sequence <strong>of</strong> events that<br />
leads up to the accident is not unique and has been seen in the past in either accidents or<br />
incidents (see infobox the DC-10 story). Usually it is the accident however, i.e. the<br />
realisation <strong>of</strong> a low probability event, that triggers remedial action, rather than the<br />
knowledge that such an event could happen. In the case <strong>of</strong> Concorde for example, although<br />
there had been five tyre bursts on Concorde that had caused structural damage to fuel tanks,<br />
it was not considered necessary to reinforce those fuel tanks. Only after the Concorde<br />
disaster was Kevlar lining fitted to the fuel tanks as an extra protection against damage by<br />
burst tyres (see info box Concorde accident). Remedial action may include short-term<br />
regulatory activities such as issuing Airworthiness Directives, but may also be more<br />
fundamental changes to processes or activities. The <strong>air</strong>craft maintenance program<br />
development process for instance was changed significantly following the Aloha Airlines<br />
Boeing 737 accident in 1988 22 and again after the TWA Boeing 747 accident in 1996 23 . In<br />
the Netherlands, the El Al Boeing 747 accident in 1992 resulted in fierce debate, a<br />
parliamentary enquiry and legislation on third party <strong>risk</strong> around <strong>air</strong>ports (see also Appendix<br />
A: The history <strong>of</strong> third party <strong>risk</strong> regulation at Schiphol <strong>air</strong>port). Sometimes accidents are a<br />
driver for technological improvements. Advanced warning systems such as TCAS, GPWS<br />
and windshear warning systems were developed as a direct response to (a series <strong>of</strong>)<br />
accidents.<br />
The Comet disasters<br />
The de Havilland DH.106 Comet was the world’s first operational passenger jet <strong>air</strong>craft.<br />
With a cruising speed <strong>of</strong> more than 800 km/h at an altitude <strong>of</strong> 40.000 ft it provided<br />
unprecedented levels <strong>of</strong> comfort to the passenger [Goold 2000]. But within two years <strong>of</strong><br />
entering service, a series <strong>of</strong> accidents initiated the end <strong>of</strong> the Comet and <strong>of</strong> British<br />
leadership in aeronautical engineering. First there were take-<strong>of</strong>f accidents in 1952 and 1953<br />
22<br />
On April 18, 1988, a Boeing 737-200 <strong>of</strong> Aloha Airlines experienced an explosive<br />
decompression and structural failure at 24,000 ft due to fatigue cracking. Approximately 18<br />
feet <strong>of</strong> fuselage skin and structure separated from the <strong>air</strong>craft [NTSB 1989].<br />
23<br />
On 17 July 1996, Trans World Airlines Flight 800 crashed minutes after take <strong>of</strong> from<br />
John F. Kennedy International Airport, New York. The cause <strong>of</strong> the accident was an<br />
explosion <strong>of</strong> the center wing fuel tank. The source <strong>of</strong> ignition energy for the explosion<br />
could not be determined with certainty, but, <strong>of</strong> the sources evaluated by the investigation,<br />
the most likely was a short circuit outside <strong>of</strong> the center wing tank that allowed excessive<br />
voltage to enter it through electrical wiring associated with the fuel quantity indication<br />
system [NTSB 2000]<br />
38
caused by overrotation and subsequent wing stall. These problems were solved by a<br />
modified wing leading edge. Regulation was also changed as a result <strong>of</strong> these accidents,<br />
requiring demonstration <strong>of</strong> a minimum unstick speed with maximum angle <strong>of</strong> attack.<br />
[EASA 2003a]. But then in 1954 a Comet disintegrated while climbing to its cruising<br />
altitude, and the British Overseas Airways Corporation BOAC grounded its fleet <strong>of</strong> jet<br />
<strong>air</strong>craft. However, no defects were found and the <strong>air</strong>craft were put back into service.<br />
Sixteen days later, another Comet broke-up in mid-<strong>air</strong>, and the <strong>air</strong>craft’s Certificate <strong>of</strong><br />
Airworthiness was suspended. After extensive testing, it was discovered that the accidents<br />
had been caused by fatigue cracking <strong>of</strong> the fuselage skin. This was a new phenomenon, first<br />
encountered by the Comet because its high cruise altitude resulted in relatively large stress<br />
cycles to the fuselage (pressure cabin) skin. Production <strong>of</strong> the Comet was halted. A<br />
modified version, the Comet 4, flew in 1958 but by that time competing <strong>air</strong>craft were on the<br />
market and the Comet 4 was not a commercial success.<br />
As a result <strong>of</strong> these developments, <strong>air</strong> travel today is astonishingly safe. For <strong>air</strong> carriers in<br />
Europe or the US, the fatal accident rate per million flights is approximately 0.2 [CAA-NL<br />
2007]. If a person were to take a flight each day, he would, on average, experience a fatal<br />
accident after 13,700 years. Even then, the likelihood <strong>of</strong> being killed in that accident is less<br />
than the probability <strong>of</strong> survival; an analysis <strong>of</strong> fatal accidents by US domestic <strong>air</strong>lines in<br />
1987-1996 showed that, on average, a fatal accident kills 44% <strong>of</strong> the occupants <strong>of</strong> the<br />
<strong>air</strong>craft [Barnett & Wang 2000]. A fatal accident is defined as an event in which at least one<br />
<strong>of</strong> the occupants is killed, so even in the case <strong>of</strong> a fatal accident the majority <strong>of</strong> the<br />
occupants may survive. Does this mean that a sufficient level <strong>of</strong> safety has been reached?<br />
Certainly not from the viewpoint <strong>of</strong> the regulator. Aircraft accidents cost lives and are a<br />
cause <strong>of</strong> emotional trauma to victims’ relatives and friends, to people working within the<br />
industry, to communities. Crashes consume the attention <strong>of</strong> the media in a unique way; any<br />
fatal <strong>air</strong>line crash will always be a headline story. As a result, it is feared, the general public<br />
may loose confidence in the <strong>air</strong> <strong>transport</strong> system. The extent to which ‘<strong>air</strong> crashes’ are<br />
reported in the media has always been <strong>of</strong> concern to the industry and has been seen as a<br />
possible limiting factor to growth for at least 60 years. In 1943, a confidential ‘report’<br />
produced by the Curtis Wright Corporation on behalf <strong>of</strong> the US Government stated that if<br />
<strong>air</strong> safety did not improve from the level achieved during the 1930s, the rapid expansion in<br />
<strong>air</strong> travel expected after the war would result in an unacceptable level <strong>of</strong> <strong>air</strong> crashes and<br />
would limit growth. These views have been repeated many times over the years, for<br />
instance by the US Secretary <strong>of</strong> Transport at the Aviation Safety Conference in Washington<br />
D.C. in 1995 [FAA 1995b] and are still regularly voiced today. Perceived public demand<br />
for safe <strong>air</strong> travel is counterbalanced by a demand from within the industry to remain<br />
pr<strong>of</strong>itable. As early as 1959, Walter Tye (UK ARB – Air Registration Board) suggested<br />
that an optimum balance may have been achieved between <strong>air</strong>line flight safety and costs.<br />
He argued that any further marked increase in safety by (then) existing methods would cost<br />
far more than passengers or the industry would be willing or able to pay (as quoted in<br />
[Bland 1962]). This view was repeated, at the 1961 FSF Seminar, by M.G. Beard,<br />
American Airlines, who said he believed that the major <strong>air</strong>lines had already reached a<br />
position <strong>of</strong> ‘diminishing returns’ in that they had (in 1961) reached a very high degree <strong>of</strong><br />
safety and further improvements would cost more and more. However, the costs associated<br />
with an accident can also be enormous, and while much <strong>of</strong> this is absorbed by insurance,<br />
the effect <strong>of</strong> an accident on the <strong>air</strong>line’s stock price and ticket sales is uninsured. Some<br />
<strong>air</strong>lines have actually gone bankrupt after an accident, examples are Birgen<strong>air</strong> 24 and Helios<br />
24<br />
On February 6, 1996 a Birgen<strong>air</strong> Boeing 757 crashed shortly after take-<strong>of</strong>f from Puerto<br />
Plata in the Dominican Republic, killing all 189 occupants. Birgen<strong>air</strong> was a Turkish holiday<br />
39
Airways 25 , although this is exceptional. Accident prevention and safety management<br />
therefore are as important as ever, despite the high level <strong>of</strong> safety that has been achieved.<br />
The very success <strong>of</strong> the aviation system in terms <strong>of</strong> safety performance makes it difficult to<br />
determine the linkage between actions and decisions and safety outcomes. Because<br />
accidents are so rare it is impossible to determine directly whether actions or decisions had<br />
any effect on safety. Hence there is no proper feedback loop from day-to-day operations to<br />
safety decision-making [Amalberti 2001]. In other words, the fix and fly approach is no<br />
longer effective. Yet new hazards are constantly lurking due to such factors as insertion <strong>of</strong><br />
new technologies, trends in the economy and change in the regulatory environment. To<br />
maintain and improve the current level <strong>of</strong> safety, there is a need for an aviation safety<br />
performance evaluation methodology that is not based on analysis <strong>of</strong> fatal accidents and<br />
hull losses alone. Such a methodology should include a safety evaluation construct, safety<br />
hazard identification and <strong>risk</strong> analysis, safety performance measures and <strong>risk</strong> indicators and<br />
safety diagnostic procedures [FAA 2004]. A causal <strong>risk</strong> model can play a central role in<br />
such methodology.<br />
In conclusion, the main drivers for aviation safety improvement have been technological<br />
development and the industry’s practice <strong>of</strong> thorough accident investigation and subsequent<br />
remedial actions. Because <strong>of</strong> the high level <strong>of</strong> safety, the latter approach is no longer<br />
effective and there is need for a new safety performance evaluation methodology, <strong>of</strong> which<br />
a causal <strong>risk</strong> model could be a central part. We have also seen how in the past the<br />
regulatory authorities shifted from prescribing detailed requirements to a quantitative target<br />
level <strong>of</strong> safety, and to requiring the industry to demonstrate numerically that the target is<br />
obtained. For parts <strong>of</strong> the aviation system this is already done, and existing methods for<br />
analysis may suffice, but there is a need now to also analyse the aviation system as a whole.<br />
This is another potential application <strong>of</strong> a causal <strong>risk</strong> model, which requires the model<br />
results to be quantitative and reproducible.<br />
The causal <strong>risk</strong> model should therefore:<br />
• Include <strong>risk</strong> indicators,<br />
• Provide reproducible results,<br />
• Represent the aviation system as a whole, and<br />
• Have quantitative model output.<br />
The Concorde disaster<br />
The BAC/Sud-Aviation Concorde <strong>air</strong>craft was the embodiment <strong>of</strong> aeronautical progress.<br />
With a cruising speed <strong>of</strong> more than twice the speed <strong>of</strong> sound it was twice as fast as all other<br />
commercial <strong>air</strong>craft. To attain these speeds, the shape <strong>of</strong> the <strong>air</strong>craft was special as well,<br />
with an elegantly pointed nose and beautifully curved ogival delta wing platform. The<br />
shape <strong>of</strong> the wing was in fact a compromise between the requirement to be able to fly at<br />
supersonic speeds and still provide satisfactory characteristics at low speed for take-<strong>of</strong>f and<br />
charter operator, most people on-board were German tourists. The accident was initiated by<br />
incorrect <strong>air</strong>speed indications due to a blocked pitot tube [JIAA 1996].<br />
25<br />
On 14 August 2005, Helios Airways flight 522, a Boeing 737-300 crashed near Athens in<br />
Greece on a flight from Larnaca, Cyprus. All 121 occupants were killed. The immediate<br />
cause <strong>of</strong> the accident was flight crew incapacitation due to hypoxia. Helios Airways was a<br />
low fares carrier, established in 1999. At the time <strong>of</strong> the accident, Helios was operating four<br />
<strong>air</strong>craft and conducted flights out <strong>of</strong> Larnaca and Paphos, Cyprus [AAIASB 2006].<br />
40
landing. Nevertheless, Concorde’s typical take-<strong>of</strong>f speed <strong>of</strong> 200 kts is approximately 35%<br />
higher than that <strong>of</strong> other commercial jet <strong>air</strong>craft. These high take-<strong>of</strong>f speeds are more<br />
demanding to the tyres, and the rate <strong>of</strong> tyre bursts for Concorde has always been relatively<br />
high at one occurrence per 1,500 cycles rather than the one occurrence in 100,000 cycles<br />
which is the rate for modern <strong>air</strong>liners such as the Airbus A340 [BEA 2001]. Modifications<br />
such as strengthened tyres led to a reduction in the tyre failure rate, but it still remained<br />
relatively high. This was not considered to be a major safety hazard until 25 July 2000,<br />
when during take-<strong>of</strong>f from runway 26R at Roissy Charles de Gaulle Airport, shortly before<br />
rotation, the front right tyre <strong>of</strong> the left landing gear <strong>of</strong> Air France Concorde F-BTSC ran<br />
over a strip <strong>of</strong> metal which had fallen from another <strong>air</strong>craft. The tyre exploded and debris<br />
was thrown against the underside <strong>of</strong> the wing, leading to a rupture <strong>of</strong> one <strong>of</strong> the wing’s<br />
integral fuel tanks. A major fire, fuelled by the leak, broke out immediately under the left<br />
wing. Ingestion <strong>of</strong> tyre debris and hot gases caused malfunctions to the engines on the left<br />
wing, and the fire destroyed control surfaces at the wing’s trailing edge. The flight crew had<br />
no possibility to recover from the catastrophic situation, and the <strong>air</strong>craft crashed less than<br />
two minutes after take-<strong>of</strong>f. All 109 passengers and crew members, as well as 4 people on<br />
the ground, were killed.<br />
Previous to this accident, there had been five tyre burst events on Concorde which had<br />
caused structural damage to fuel tanks. Reinforcement <strong>of</strong> the lower wing was considered<br />
after the first incident, but it was considered unnecessary [BEA 2001]. After the accident,<br />
Air France immediately grounded its Concorde fleet, and although British Airways (the<br />
sole other operator <strong>of</strong> Concorde) continued operating the <strong>air</strong>craft for a few weeks, the CAA<br />
ordered the British fleet to be grounded as well. An extensive modification program<br />
including the fitment <strong>of</strong> Kevlar lining to key fuel tanks and installation <strong>of</strong> strengthened<br />
tyres was executed, and the Certificate <strong>of</strong> Airworthiness was re-issued 14 months after the<br />
accident. For commercial reasons, Concorde was retired in October 2003.<br />
Figure 7: Concorde.<br />
41
Douglas DC-10; an <strong>air</strong>craft with a troubled start<br />
The DC-10 was the first widebody <strong>air</strong>craft <strong>of</strong> McDonnell-Douglas, built to meet an <strong>air</strong>line<br />
requirement for a three-engine jetliner for medium and long-range routes. Production<br />
started in January 1968, it first flew on August 29, 1970 and first deliveries were in 1971.<br />
On 3 March 1974, a Turkish Airlines DC-10 crashed minutes after take-<strong>of</strong>f from Paris’<br />
Orly Airport. All 346 people on-board were killed in what was then the worst accident in<br />
aviation history. The accident was caused by a cargo door that was not properly locked.<br />
During climb, the door blew out and the resulting damage rendered the <strong>air</strong>craft<br />
uncontrollable. A similar occurrence had happened almost 2 years earlier, but the crew <strong>of</strong><br />
that flight managed to land the <strong>air</strong>craft safely. The resulting accident investigation showed<br />
deficiencies on the cargo door design. Retr<strong>of</strong>its were mandated but the DC-10’s reputation<br />
had received a dent. Five years later, on 25 May 1979, the left-hand engine and wing pylon<br />
<strong>of</strong> a DC-10 that was taking <strong>of</strong>f from Chicago O’Hare separated during rotation. The left<br />
wing was damaged resulting in an asymmetric stall. The <strong>air</strong>craft rolled through 90 degrees<br />
and crashed just outside the <strong>air</strong>port perimeter. All 271 occupants were killed. When<br />
inspections <strong>of</strong> other DC-10s revealed more cases <strong>of</strong> cracks in engine pylons, the FAA<br />
suspended the DC-10 type certificate on June 6, 1979. This effectively grounded the DC-10<br />
fleet. Further investigation showed that the DC-10 did in fact meet FAA’s certification<br />
criteria 26 , and the order <strong>of</strong> suspension was terminated on July 13, 1979 [NTSB 1979]. The<br />
Italian national <strong>air</strong>line Alitalia cancelled six DC-10 orders on August 23 and Egypt<strong>air</strong><br />
cancelled 4 shortly afterwards. The total sales revenue from these orders would have been<br />
$400 million. Alitalia said that its decision was unrelated to safety, but this is predictable<br />
given that it already had a fleet <strong>of</strong> eight DC-10s. Still in 1979, a DC-10 crashed during a<br />
sightseeing trip over Antarctica, killing the 257 occupants. While this accident was not<br />
related to the <strong>air</strong>worthiness <strong>of</strong> the <strong>air</strong>craft (it was a controlled flight into terrain type <strong>of</strong><br />
accident) the DC-10’s reputation was now seriously damaged. McDonnell-Douglas’ share<br />
price fell significantly because <strong>of</strong> lower anticipated sales [Chalk 1986]. The accident did<br />
not however have an effect on the market shares <strong>of</strong> routes that were flown by the DC-10<br />
[Barnett & LoFaso 1983].<br />
The next highly publicised accident occurred on 19 July 1989. The centre engine <strong>of</strong> a DC-<br />
10 suffered an uncontained failure, damaging the hydraulic system and depriving the crew<br />
<strong>of</strong> the use <strong>of</strong> the <strong>air</strong>craft’s control surfaces. The flight crew, in a display <strong>of</strong> remarkable<br />
<strong>air</strong>manship, managed to nurse the <strong>air</strong>craft to an <strong>air</strong>port by clever manipulation <strong>of</strong> the<br />
throttles. The <strong>air</strong>craft made a crash landing in Sioux City, and while there were 112<br />
fatalities, 184 people survived [NTSB 1990]. After the crash at Sioux City new bookings on<br />
the DC-10 plummeted. The impact on consumer behaviour recovered very quickly however<br />
and passenger avoidance was down to about 10 % <strong>of</strong> the pre-crash behaviour 8 weeks after<br />
the accident [Barnett et al 1992], see Figure 8.<br />
The year 1989 also saw the end <strong>of</strong> the DC-10 production run. 386 commercial DC-10s were<br />
delivered, plus 60 KC-10 tanker/cargo <strong>models</strong> built for the U.S. Air Force. The <strong>air</strong>craft still<br />
flies today, and despite its initial reputation has an accident rate (overall) that is not<br />
different from other <strong>air</strong>craft <strong>of</strong> the same generation.<br />
26<br />
The cracks were caused by inappropriately executed maintenance procedures.<br />
42
ticket sales (relative to pre-accident)<br />
100<br />
90<br />
80<br />
70<br />
60<br />
50<br />
40<br />
30<br />
20<br />
10<br />
0<br />
-2 -1 0 1 2 3 4 5 6 7 8<br />
Weeks since accident<br />
Figure 8: Estimated changes in new DC-10 bookings on competitive routes after 1989<br />
Sioux City DC-10 crash (relative to pre-crash levels). Source: Barnett et al [1992].<br />
4.2. Who are the users?<br />
According to the Dutch Ministry <strong>of</strong> Transport, the potential users <strong>of</strong> a causal <strong>risk</strong> model are<br />
<strong>air</strong>lines, <strong>air</strong> navigation service providers, <strong>air</strong>port organisations, maintenance and rep<strong>air</strong><br />
organisations, <strong>air</strong>craft manufactures, the central government and the aviation inspectorate.<br />
The projected use is not limited to the Netherlands, so the ‘central government’ could also<br />
mean other national governments, the European Commission, or ICAO. However, when<br />
some <strong>of</strong> these organisations were asked directly, many doubted whether a causal <strong>risk</strong> model<br />
could be useful for them. Especially the industry had difficulty to imagine how a causal <strong>risk</strong><br />
model could support them in taking daily decisions. The model was nevertheless not<br />
rejected a priori as useless, the opinion was rather that ‘when the causal <strong>risk</strong> model is ready<br />
we will see what we can do with it’ [De Jong 2006]. In this thesis, we will thus consider<br />
each <strong>of</strong> the above mentioned organisations as a potential user <strong>of</strong> a causal <strong>risk</strong> model.<br />
4.3. Perspectives on aviation safety<br />
This section describes the different perspectives that the stakeholders in the aviation system<br />
may have with respect to aviation safety and how this influences their opinion on the need<br />
to manage and improve safety. A description <strong>of</strong> the possible role <strong>of</strong> a causal <strong>risk</strong> model is<br />
given for every stakeholder based on their needs.<br />
4.3.1. Airlines<br />
For <strong>air</strong>line management, meeting the minimum safety standards set by the aviation<br />
authorities is a necessary requirement for obtaining an Air Operator Certificate (AOC). In<br />
addition to that, <strong>air</strong>line management will be aware <strong>of</strong> the fact that suffering a major<br />
accident may result in significant costs due to decreased ticket sales and may even cause an<br />
<strong>air</strong>line to go bankrupt, even though most <strong>air</strong>lines have adequate insurance to meet virtually<br />
all the direct costs arising from an accident (see infobox on the role <strong>of</strong> insurance).<br />
Especially very small <strong>air</strong>lines in the holiday charter business are vulnerable in this respect,<br />
because they are <strong>of</strong>ten not able to survive the immediate loss <strong>of</strong> income that is the result <strong>of</strong><br />
one <strong>of</strong> their <strong>air</strong>craft being no longer available and <strong>of</strong> the effect <strong>of</strong> the crash on public<br />
perception. However, accidents can impact the business <strong>of</strong> larger <strong>air</strong>lines as well. Examples<br />
43
<strong>of</strong> small <strong>air</strong>lines that went bankrupt after an accident are Birgen<strong>air</strong> (Boeing 757 accident in<br />
1996 [JIAA 1996]), Valujet (DC-9 accident in 1996 [NTSB 1997], although Valujet<br />
continued operations under a different name; Airtran), Helios Airways (Boeing 737,<br />
crashed near Athens in 2005 following flight crew incapacitation due to hypoxia [AAIASB<br />
2006]). But for most <strong>air</strong>lines the probability <strong>of</strong> a catastrophic accident is so remote that fear<br />
<strong>of</strong> an accident is not directly a driver for safety improvements. The current catastrophic<br />
accident rate for Western operators is in the order <strong>of</strong> 0.2 accidents per million flights<br />
[CAA-NL 2007]. A large European carrier typically conducts 120.000 flights per year 27 ,<br />
which means that on average a large carrier will suffer 1 catastrophic accident in every 42<br />
years. Most managers will thus never be confronted with a serious accident in their entire<br />
career. Yet they still invest in safety and want to know about value for money. They also<br />
make changes for other reasons and want to know their effect on safety. They may, for<br />
example, want to cut costs by stopping certain activities, or reducing staff, without<br />
compromising safety.<br />
The role <strong>of</strong> insurance<br />
Probably because <strong>of</strong> the potentially catastrophic nature <strong>of</strong> <strong>air</strong> accidents, the large amounts<br />
<strong>of</strong> money at <strong>risk</strong>, and the need to ensure that victims or their relatives get adequately<br />
compensated, even if the <strong>air</strong>line cannot pay, insurance plays a large part in commercial<br />
aviation, removing most <strong>of</strong> the possible direct loss resulting from such accidents. It may be<br />
assumed that, as far as <strong>air</strong>lines are concerned, almost all will have adequate insurance to<br />
meet virtually all the direct costs arising from an <strong>air</strong>craft accident. Exceptions may arise<br />
occasionally with small, perhaps less well established operators in third world countries,<br />
although even there it is thought to be rare [Van Dijk et al 2001].<br />
The <strong>air</strong>line’s insurance will respond first to a loss, with other parties becoming involved<br />
through subrogation or contribution. Separately, personal insurance, e.g. life insurance, may<br />
also be expected to respond [Van Dijk et al 2001].<br />
Aviation accidents usually involve multiple defendants. The most commonly involved<br />
defendants are the <strong>air</strong>line and the <strong>air</strong>craft manufacturer but anyone else who may have been<br />
involved or contributed in some way to the accident, such as the manufacturer <strong>of</strong> the engine<br />
or any other component or system, the maintenance organisation, the <strong>air</strong> traffic service<br />
provider, etc., will also be included. Unlike some tort litigation with multiple defendants,<br />
the defence in <strong>air</strong> accident litigation is usually highly coordinated and unified in dealing<br />
with plaintiffs. The direct insurer <strong>of</strong> the <strong>air</strong>line takes the lead in negotiating with the<br />
plaintiffs on behalf <strong>of</strong> all defendants. Defendants usually agree amongst themselves, quite<br />
early, on how to share liability, although this may be adjusted later after settlement has<br />
been made. Where there is a dispute as to liability, the <strong>air</strong>line’s insurer will <strong>of</strong>ten make<br />
settlement to plaintiffs in the expectation <strong>of</strong> gaining partial reimbursement from the other<br />
defendants later or on the basis <strong>of</strong> an interim contract between defendants with the<br />
understanding that the amount <strong>of</strong> each defendant’s contribution would be adjusted once<br />
liability issues have been resolved.<br />
Insurance companies could perhaps use a causal <strong>risk</strong> model, e.g. to determine insurance<br />
premiums. A requirement is that the model is able to show how changes to the aviation<br />
system, either from ‘outside’, like global economical developments, or from ‘inside’, like<br />
<strong>air</strong>line policy decisions, influence <strong>air</strong>craft crash <strong>risk</strong>. However, pricing <strong>of</strong> the <strong>air</strong>line<br />
27 KLM data for 2004.<br />
44
insurance market is strongly influenced by ‘spillover’ from the general insurance market,<br />
the financial markets and overall economy [Swiss Re 1996]. This may have a much bigger<br />
impact than the (expected) crash <strong>risk</strong> and would thus limit the usebility <strong>of</strong> a causal <strong>risk</strong><br />
model.<br />
Airlines monitor safety performance <strong>of</strong> the fleet by routinely analysing in-flight recorded<br />
data and checking parameter values for crossings <strong>of</strong> pre-defined threshold values.<br />
Individual threshold crossings are analysed to determine exactly what happened (see also<br />
section 8.5.4). In addition to this flight data program, most <strong>air</strong>lines also have a system in<br />
place for the flight crew to report abnormal situations. This information is usually in a freetext<br />
format. The combination <strong>of</strong> flight data and crew reports provide the <strong>air</strong>line with a good<br />
picture <strong>of</strong> individual incidents, but as <strong>of</strong> yet a tool that allows analysis on a more generic<br />
level does not exist. At best <strong>air</strong>lines do some sort <strong>of</strong> trend analysis. A causal <strong>risk</strong> model<br />
would be very valuable to <strong>air</strong>lines if it could support providing an overall safety picture<br />
and, most importantly, show <strong>air</strong>line management the influence <strong>of</strong> their decisions on the<br />
level <strong>of</strong> safety. It is therefore required that a causal <strong>risk</strong> model links-up with the primary<br />
safety data information systems: flight data and safety reports.<br />
A challenge for <strong>air</strong>lines is to maintain current (safety) standards in a changing world. When<br />
such changes are local and threaten to influence the ‘level playing field’ (see section 4.3.6)<br />
or their competitiveness, <strong>air</strong>line management will be keen on taking proper<br />
countermeasures to ensure pr<strong>of</strong>itability <strong>of</strong> the company. When locally imposed safety<br />
measures threaten the level playing field, the reaction will be to resist them until and unless<br />
all others are required to implement them also. Competitiveness is the driving factor. A<br />
causal <strong>risk</strong> model could play a role in analysing future changes, estimating their effect on<br />
safety and providing information that allows selection <strong>of</strong> proper countermeasures. For<br />
<strong>air</strong>lines therefore the ability to perform cost benefit analysis <strong>of</strong> proposed future changes<br />
would be a desirable feature for a causal <strong>risk</strong> model. This implies also the need for a model<br />
in which the way that future changes in how functions are operationalised can be<br />
incorporated. Because <strong>of</strong> the low accident frequency, a causal <strong>risk</strong> model for <strong>air</strong>lines should<br />
be based on safety indicators other than the accident rate.<br />
4.3.2. Rep<strong>air</strong> stations<br />
Maintenance technicians consider <strong>air</strong>craft safety to be the result <strong>of</strong> their pr<strong>of</strong>essional skills.<br />
They feel responsible for safety. In the process <strong>of</strong> releasing an <strong>air</strong>craft back into service,<br />
some maintenance technicians even think that they sign <strong>of</strong>f for the safety <strong>of</strong> the <strong>air</strong>craft<br />
rather than (as required by regulation) for having followed prescribed procedures [Biemans<br />
et al 1998]. These procedures are specified in the operator’s maintenance program, which is<br />
normally based on instructions for continued <strong>air</strong>worthiness prepared by the manufacturer.<br />
The operator may rewrite the structure and format <strong>of</strong> these maintenance recommendations<br />
to better suit his operation. Once <strong>air</strong>craft enter service, the initial maintenance program is<br />
subject to continuous development and update as modifications, product improvements and<br />
operational feedback are incorporated. To evaluate the effectiveness <strong>of</strong> the maintenance<br />
program and to update it, operators develop a reliability program. The actions resulting<br />
from the reliability program may be to escalate, de-escalate, omit or add maintenance tasks.<br />
By proving to the authority for instance that increasing a servicing or inspection interval for<br />
a particular component does not adversely affect safety, the operator could save money in<br />
maintenance expenditures. The Alaska Airlines MD-83 accident in 2000 (see infobox) is an<br />
example <strong>of</strong> a case where inspection intervals were extended without the operator (Alaska<br />
Airlines) or the authority (FAA) being sufficiently aware <strong>of</strong> the safety implications.<br />
45
Throughout the service life <strong>of</strong> an <strong>air</strong>craft type, the authorities continue to monitor the safety<br />
<strong>of</strong> the design through a service difficulty reporting and analysis system. If at any time<br />
during the service life <strong>of</strong> an <strong>air</strong>craft, the <strong>air</strong>worthiness authorities determine that an unsafe<br />
condition exists in a product (<strong>air</strong>craft or system) and that the unsafe condition is likely to<br />
exist or develop in other products <strong>of</strong> the same type design, they may issue an Airworthiness<br />
Directive (AD). The purpose <strong>of</strong> an AD is to correct or prevent an unsafe condition. An AD<br />
gives a description <strong>of</strong> required corrective action or operating limitations for a particular<br />
<strong>air</strong>craft or system. Compliance to ADs is compulsory.<br />
Service Bulletins (SBs) are issued by the <strong>air</strong>craft, component, or engine manufacturers to<br />
update operators with information relevant to a particular <strong>air</strong>craft type. Maintenance service<br />
bulletins may advise to inspect, rep<strong>air</strong>, rework or modify the <strong>air</strong>craft (see infobox Boeing<br />
Service Bulletin 737-56-1019). While some service bulletins address safety or<br />
<strong>air</strong>worthiness related problems, other service bulletins relate solely to operational or<br />
economic matters. A service bulletin may be prompted by problems identified through inservice<br />
experience or production, and may introduce product improvements or changes to<br />
operational requirements. It is up to the operator to apply or ignore the SB. This requires a<br />
management process in the company to monitor these, to anticipate them and to respond<br />
with good decisions on them. A causal <strong>risk</strong> model would be useful if it could calculate the<br />
expected safety implications <strong>of</strong> each SB.<br />
Alaska Air accident<br />
Alaska Airlines began operating McDonnell-Douglas MD-80 <strong>air</strong>craft in 1984. The MD-80<br />
is a derivative <strong>of</strong> the DC-9 series <strong>air</strong>craft. The <strong>air</strong>craft is equipped with a ‘T-tail’; the<br />
horizontal stabilizer is mounted on top <strong>of</strong> the vertical stabilizer, they are connected by two<br />
hinges at the aft spar <strong>of</strong> the horizontal stabilizer and with a single jackscrew assembly at the<br />
front spar <strong>of</strong> the stabilizer. Initially, that jackscrew was lubricated every other B check<br />
(every 700 flights hours), but in the course <strong>of</strong> the years this interval had been increased by<br />
Alaska Airlines to 2,550 flight hours (see Figure 9).<br />
On January 31, 2000, Alaska Airlines Flight 261, a McDonnell Douglas MD-83 crashed<br />
into the Pacific Ocean. The 2 pilots, 3 cabin crewmembers and 83 passengers on board<br />
were killed and the <strong>air</strong>craft was destroyed by impact forces. The accident was caused by a<br />
loss <strong>of</strong> <strong>air</strong>craft pitch control resulting from a failure <strong>of</strong> the horizontal stabilizer jackscrew<br />
assembly. The failure was caused by Alaska Airline’s insufficient lubrication <strong>of</strong> the<br />
jackscrew assembly. Contributing to the Alaska Air MD-83 accident in 2000 was the<br />
FAA’s approval <strong>of</strong> Alaska Airlines’ extended interval for lubrication and check interval <strong>of</strong><br />
the horizontal stabiliser trim system jackscrew assembly [NTSB 2002a].<br />
46
lubrication interval (flight hours)<br />
3000<br />
2500<br />
2000<br />
1500<br />
1000<br />
500<br />
0<br />
1985 1990 1995 2000<br />
Figure 9: Alaska Airlines horizontal stabilizer jackscrew lubrication interval escalation.<br />
The maintenance organisation will be constantly looking for more cost-effectiveness in the<br />
reliability program. The reliability program requires approval from the authority and<br />
therefore one <strong>of</strong> the main drivers for safety is the need to demonstrate that the proposed<br />
changes will not adversely affect safety. The Alaska Air accident revealed that the process<br />
by which <strong>air</strong>lines make changes to the maintenance program and demonstrate to the<br />
authority that these changes will not present any potential hazards requires improvement<br />
[NTSB 2002a]. A causal <strong>risk</strong> model could help improve this process. This application<br />
would require a causal <strong>risk</strong> model that captures very specific (specific to <strong>air</strong>craft type or<br />
even tail number) and detailed (up to <strong>air</strong>craft component level) information.<br />
Boeing Service Bulletin 737-56-1019<br />
Boeing originally designed the Boeing 737 jet <strong>air</strong>craft with cockpit eyebrow windows in<br />
order for the flight crew to maintain a sufficient and unobstructed view during turns.<br />
According to Boeing, today’s advanced navigation and <strong>air</strong> traffic control systems have<br />
made these windows obsolete and from 2005 onwards the eyebrow windows were deleted<br />
on newly produced 737 <strong>air</strong>craft. This design change has reduced <strong>air</strong>craft weight by 20<br />
pounds and eliminates approximately 300 hours <strong>of</strong> periodic inspections per <strong>air</strong>craft. Service<br />
Bulletin 737-36-1019 allows replacing the eyebrow windows <strong>of</strong> the Boeing 737-300 and -<br />
400 <strong>air</strong>craft (manufactured before 2005) with an aluminium plug [KLM 2007].<br />
4.3.3. Aircraft manufacturer<br />
For <strong>air</strong>craft manufacturers, meeting the minimum safety requirements as specified in FAA<br />
FAR 25 and EASA CS 25 is necessary to obtain a type approval for the <strong>air</strong>craft. FAR<br />
25.571 and CS 25.571 for instance specify requirements for damage tolerance and fatigue<br />
evaluation <strong>of</strong> the structure, FAR 25.603 and CS 25.603 specify requirements for materials.<br />
In particular, FAR 25.1309 and CS 25.1309 specify requirements for <strong>air</strong>craft system design<br />
and analysis. These requirements for <strong>air</strong>craft systems are based on the principle stating that<br />
47<br />
Year
an inverse relation should exist between the probability <strong>of</strong> malfunctions and the degree <strong>of</strong><br />
hazard to the <strong>air</strong>craft and its occupants. Depending on the criticality <strong>of</strong> the system and the<br />
failure, the applicant must demonstrate a failure probability <strong>of</strong> less than 10 -5 , 10 -7 or 10 -9 per<br />
flight hour. A detailed Failure Modes and Effects Analysis (FMEA) and Fault Tree<br />
Analysis are <strong>of</strong>ten necessary to demonstrate compliance with these regulations.<br />
Fokker F-10; end <strong>of</strong> the wooden wing<br />
The F-10 was an <strong>air</strong>craft designed and built by de Fokker Aircraft Company in the US<br />
which entered service in 1928. The <strong>air</strong>craft was <strong>of</strong> typical Fokker construction, combining a<br />
wooden wing and fabric covered steel-tube fuselage. Initially the <strong>air</strong>craft was a commercial<br />
success, despite it being <strong>of</strong> rather outdated design; all-metal <strong>air</strong>craft like the Douglas DC-2<br />
were showing to be faster and more efficient, having 20% less operating costs. But on<br />
March 31, 1931 a Fokker F-10 crashed during a thunderstorm, killing all on-board<br />
including Knute Rockne who was the celebrated coach <strong>of</strong> the popular ‘Notre Dame’<br />
football team. The accident was headline news for a week. Initial investigation immediately<br />
revealed a broken wing and the emerging Bureau <strong>of</strong> Air Commerce issued a directive that<br />
called for frequent and expensive inspections <strong>of</strong> all Fokker wings, despite furious attempts<br />
by Anthony Fokker to prove that bad weather had caused the accident. Fokker <strong>air</strong>craft now<br />
had a reputation <strong>of</strong> being inherently dangerous. In combination with the Great Depression<br />
and Fokker stubbornly maintaining the wooden wing concept this was the end <strong>of</strong> Fokker in<br />
America. On July 10, 1931, Anthony Fokker was forced to resign from the company that<br />
bore his name, and he soon returned to the Netherlands [De Leeuw 1994, Dierikx 1997,<br />
Schatzberg 1994].<br />
The manufacturers are in a position to directly influence aviation safety by introducing new<br />
technology. As we have seen in the previous sections, technological improvements have<br />
been fundamental in improving aviation safety. Any new technology can only be<br />
introduced if the manufacturers can demonstrate to the certifying authority that it is<br />
sufficiently safe. Currently <strong>air</strong>craft manufacturers use analysis and physical testing for this.<br />
In the case <strong>of</strong> <strong>air</strong>craft systems, the analysis is conducted with the aid <strong>of</strong> fault tree analysis<br />
and comparable methods. Aircraft manufacturers could use a causal <strong>risk</strong> model during the<br />
type certification process in a similar way as they currently use fault tree analysis and<br />
comparable methods. The objective is to demonstrate in the system safety assessment that<br />
all <strong>air</strong>craft systems comply with relevant regulation. Increased integration <strong>of</strong> <strong>air</strong>craft<br />
systems and integration <strong>of</strong> <strong>air</strong>borne and ground-based systems lead to a need for methods<br />
that can properly represent these integrated systems, including human operators, in a safety<br />
assessment. Fault tree methods are no longer sufficient. For this application the causal <strong>risk</strong><br />
model must be able to properly represent the role <strong>of</strong> the human operator and be able to<br />
capture dependencies between different system components. Using the model as part <strong>of</strong> the<br />
certification process requires that the model be validated and accepted by the regulators.<br />
This also makes it necessary that the model produce similar results if applied by different<br />
users.<br />
History provides some examples <strong>of</strong> <strong>air</strong>craft that allegedly suffered from a bad safety<br />
reputation; see for instance the story <strong>of</strong> the Fokker F-10 and the Douglas DC-10. However,<br />
<strong>air</strong>craft purchase decisions are complex, political and confidential, and therefore do not<br />
easily allow a clear statement as to whether public mistrust had an impact on a company’s<br />
purchase decision. From that perspective, there is no direct driver for the <strong>air</strong>craft<br />
manufacturer to develop <strong>air</strong>craft that are safer than others.<br />
48
Aircraft manufacturers are also working on safety because <strong>of</strong> product liability. Liability<br />
claims, in some cases even extended to personal accusations <strong>of</strong> manslaughter (see infobox:<br />
Aircraft design and manslaughter), can be a reason for manufacturers to equip their <strong>air</strong>craft<br />
with the best available technology. Contrary to the situation at <strong>air</strong>lines, for which a crash is<br />
only a remote probability, <strong>air</strong>craft manufacturers are regularly confronted with accidents<br />
involving their products. From 1986 (the year <strong>of</strong> the first flight <strong>of</strong> the Fokker 100) to 2006<br />
for instance there have been at least 108 accidents involving Fokker <strong>air</strong>craft - 6 Fokker 100,<br />
1 Fokker 70, 5 Fokker 50, 23 F-28 and 72 Fokker F-27 - <strong>of</strong> which 51 accidents caused<br />
fatalities (Source: <strong>NLR</strong> Air Safety database). Because <strong>of</strong> this exposure the safety awareness<br />
<strong>of</strong> manufacturers is high.<br />
Aircraft design and manslaughter<br />
An Airbus executive went on trial in May 2006 for manslaughter over the 1992 crash <strong>of</strong> an<br />
Airbus A320 <strong>of</strong> France’s domestic <strong>air</strong>line Air Inter in eastern France that killed 87 people.<br />
Investigators considered the argument that the cockpit was ergonomically flawed, and that<br />
the pilots were confused between the controls for the <strong>air</strong>craft's descent. Airbus’ then<br />
engineering chief Bernard Ziegler was indicted over the ergonomic design <strong>of</strong> the A320<br />
cockpit, as well as the possibility that the <strong>air</strong>craft’s navigation system was faulty [Flight<br />
International 2006a, 2006b]. The French authorities also launched a manslaughter case<br />
against the former head <strong>of</strong> the Concorde programme in connection with the Air France<br />
Concorde accident in 2000 near Charles de Gaulle <strong>air</strong>port that killed 113 people. Henri<br />
Perrier, chief engineer on Concorde’s first test flight in 1969, was placed under<br />
investigation for manslaughter and involuntary injury as part <strong>of</strong> an investigation into the<br />
crash [Bentley 2005].<br />
An <strong>air</strong>craft manufacturer could use a causal <strong>risk</strong> model to anticipate and respond with<br />
suitable priority to potential accident scenarios. This would require a model that is able to<br />
represent current as well as possible future accident scenarios.<br />
4.3.4. Air navigation service provider<br />
The <strong>air</strong> navigation service provider (ANSP) is responsible for ensuring that <strong>air</strong> traffic<br />
proceeds safely and efficiently while minimising the burden to the environment [LVNL<br />
2001a]. Decisions taken by the ANSPs can have direct consequences for safety, efficiency<br />
and the environment, and accordingly affect many actors. Often, decisions that positively<br />
affect one area will have a negative effect on another; for example accepting higher<br />
crosswinds (and consequently higher <strong>risk</strong>s) during the landing approach so that a runway<br />
can be used that is preferred for reasons <strong>of</strong> noise abatement. Therefore all actors demand<br />
transparency <strong>of</strong> the decision making process at the ANSP. ANSPs are in need <strong>of</strong> a way to<br />
estimate the effects <strong>of</strong> proposed changes (human, procedural, hardware and s<strong>of</strong>tware<br />
elements <strong>of</strong> the ATM System as well as its environment <strong>of</strong> operations) in such a way that<br />
allows comparison <strong>of</strong> those effects. Currently, effects on capacity and the environment can<br />
be predicted reasonably well, but safety still is a problem. As a result, decisions are<br />
sometimes made which, with the benefit <strong>of</strong> hindsight, were unwise. See for instance the<br />
case <strong>of</strong> the Cross<strong>air</strong> BAE 146 accident at Zurich, where the <strong>air</strong>craft was forced to fly a<br />
more <strong>risk</strong>y non-precision approach instead <strong>of</strong> a precision approach because <strong>of</strong> noise<br />
abatement procedures.<br />
49
Safety versus the environment: the Cross<strong>air</strong> BAe 146 accident at Zurich [AAIB<br />
Switzerland 2004].<br />
On 24 November 2001, a Cross<strong>air</strong> BAe 146-RJ100 <strong>air</strong>craft took-<strong>of</strong>f from Berlin-Tegel<br />
<strong>air</strong>port for a scheduled flight to Zurich. After an uneventful flight, the <strong>air</strong>craft received the<br />
clearance for the approach to runway 28 at Zurich <strong>air</strong>port. The weather was close to the<br />
minimum for this runway. When the <strong>air</strong>craft reached the minimum descent altitude (MDA)<br />
<strong>of</strong> 2,390 ft, the captain mentioned to the first <strong>of</strong>ficer that he had visual ground contact and<br />
continued the descent. Shortly afterwards the <strong>air</strong>craft crashed into the ground. Twenty-one<br />
passengers and three crew members died from their injuries at the site <strong>of</strong> the accident;<br />
seven passengers and two crew members survived the accident.<br />
Zurich <strong>air</strong>port is characterised by a system <strong>of</strong> three runways. Runways 16 and 14 are<br />
equipped with a Category CAT III instrument landing system (ILS) and are therefore<br />
suitable for precision approaches. Runway 28 only allows non-precision VOR/DME<br />
approaches. The approach sectors <strong>of</strong> runways 14 and 16 are equipped with a minimum safe<br />
altitude warning system (MSAW). This system triggers a visual and acoustic alarm in <strong>air</strong><br />
traffic control if <strong>air</strong>craft infringe defined minimum altitudes. No MSAW is installed in the<br />
runway 28 approach sector. At the time <strong>of</strong> the accident the noise abatement procedures in<br />
force for Zurich <strong>air</strong>port played a decisive role in determining take-<strong>of</strong>f and landing runways.<br />
Approaches from 22:00 local time (LT) to 06:00 LT had to take place on Runway 28.<br />
16<br />
10<br />
14<br />
34<br />
Figure 10: Zurich <strong>air</strong>port runway layout.<br />
32<br />
Because <strong>of</strong> noise abatement procedures, the <strong>air</strong>craft had to carry out a non-precision<br />
approach, rather than the precision approach that is the norm when noise abatement is not<br />
in place. The accident <strong>risk</strong> during non-precision approaches is on average 5 times higher<br />
than the <strong>risk</strong> during precision approaches [Enders et al 1996]. The absence <strong>of</strong> the MSAW<br />
for this approach was another missing safety barrier. In this particular case, apparently it<br />
was accepted that, for the interest <strong>of</strong> noise abatement, <strong>air</strong>craft had to fly a non-precision<br />
approach in marginal weather conditions, even though a much safer precision approach was<br />
available. In this case, the non-precision approach and the lack <strong>of</strong> MSAW were not the<br />
causa causans <strong>of</strong> the accident, but rather the causa sine qua non.<br />
50<br />
28
Safety assessments for ANSPs are <strong>of</strong>ten driven by the need for capacity increase on one<br />
hand whereas it is not clear how to achieve this without jeopardizing safety criteria (such as<br />
for instance ICAO’s TLS for mid-<strong>air</strong> collision <strong>risk</strong>). A quantitative <strong>risk</strong> analysis when<br />
introducing changes to the ATM system is also required by Eurocontrol under ESARR 4. A<br />
causal <strong>risk</strong> model could fulfil Eurocontrol’s requirement for a quantitative <strong>risk</strong>-based<br />
approach in Air Traffic Management when introducing and/or planning changes to the<br />
ATM system. If the model were to properly represent the influence <strong>of</strong> factors like the<br />
contribution <strong>of</strong> human performance or safety management systems and their interactions,<br />
some <strong>of</strong> the current ambiguity in ESARR 4 would be resolved. A causal <strong>risk</strong> model<br />
representing the total aviation system, i.e. not limited to the ATM component, would also<br />
remove a weak point <strong>of</strong> Eurocontrol’s current approach by fully taking account <strong>of</strong><br />
integration <strong>of</strong> the different elements in the aviation system. This requires careful<br />
representation <strong>of</strong> dependencies in the model. Note that the requirement comes from the<br />
regulatory role <strong>of</strong> Eurocontrol and not from Eurocontrol as an <strong>air</strong> traffic service provider.<br />
Eurocontrol is very well aware <strong>of</strong> the potential benefits <strong>of</strong> a causal <strong>risk</strong> model, and when<br />
the High Level European Action Group for ATM Safety (AGAS) identified priority actions<br />
to improve safety in European Airspace, it included research to develop an ‘integrated <strong>risk</strong><br />
picture’ for ATM in Europe. The purpose <strong>of</strong> such an integrated <strong>risk</strong> picture is to show the<br />
contribution <strong>of</strong> ATM in both causing and preventing <strong>air</strong>craft accidents, and the safety<br />
impacts <strong>of</strong> changes in ATM as it develops in the future [Perrin et al 2006, Kirwan 2007].<br />
The integrated <strong>risk</strong> picture is the output <strong>of</strong> a <strong>risk</strong> model which uses separate ‘causal <strong>models</strong>’<br />
for each accident category, constructed as fault trees that represent subsequent barrier<br />
failures.<br />
From these considerations we can derive the following requirements from ANSPs for a<br />
causal <strong>risk</strong> model:<br />
• Able to represent safety effects <strong>of</strong> changes in human, procedural, hardware and<br />
s<strong>of</strong>tware elements <strong>of</strong> the ATM System as well as its environment <strong>of</strong> operations.<br />
• Able to represent the contribution <strong>of</strong> ATM in both causation and prevention <strong>of</strong><br />
accidents.<br />
• Representation <strong>of</strong> the total aviation system, including dependencies between<br />
system elements.<br />
• Provide quantitative output.<br />
• Able to show the safety impacts <strong>of</strong> ATM as it develops in the future.<br />
4.3.5. Airports<br />
The <strong>air</strong>port facilitates the primary aviation processes, and the direct influence <strong>of</strong> the <strong>air</strong>port<br />
on aviation safety is via the <strong>air</strong>side facilities that it provides: the runways, taxiways and<br />
aprons, including lighting and marking, de-icing facilities and emergency response. To be<br />
able to control <strong>risk</strong>, Amsterdam Airport Schiphol has expressed the need to obtain insight<br />
into safety <strong>risk</strong>s that are associated with the <strong>air</strong>side processes, in particular, the following is<br />
required [AAS 2001]:<br />
• Insight into cause and effect <strong>of</strong> safety <strong>risk</strong>s,<br />
• Insight into which <strong>risk</strong>s are already sufficiently covered by safety measures, and<br />
those <strong>risk</strong>s for which adequate safety measures are lacking,<br />
• Insight into the effectiveness <strong>of</strong> safety measures for the management <strong>of</strong> <strong>risk</strong>,<br />
• Insight into the probability and the effect <strong>of</strong> safety <strong>risk</strong>s.<br />
51
A causal <strong>risk</strong> model could support the <strong>air</strong>port and its safety management if the model is<br />
able to meet these requirements.<br />
4.3.6. Policy makers and regulatory bodies<br />
The Netherlands<br />
The starting point for policy with respect to aviation safety <strong>transport</strong> in the Netherlands is<br />
the notion that ease <strong>of</strong> access to the Netherlands by <strong>air</strong> is an important factor for the<br />
national economy [RLD 1996, DGTL 2005]. A safe aviation system is a prerequisite to<br />
good <strong>air</strong> connections. The national government supports the accessibility <strong>of</strong> the Netherlands<br />
by setting certain boundary conditions. Simultaneously, there is an objective from the<br />
government to be more efficient, with a less complex internal structure and mode <strong>of</strong><br />
operation. This means that industry and Dutch citizens themselves are expected to do more.<br />
They should also be provided with the means to do so. Government should only provide<br />
safeguards when other actors are insufficiently capable to take care <strong>of</strong> public interest. The<br />
Aviation Inspectorate (IVW) is tasked to (re)activate the industry’s responsibility by means<br />
<strong>of</strong> its safety oversight activities. The increased role <strong>of</strong> citizens requires from the<br />
government as well as from the industry an open attitude and a duty to inform the citizen on<br />
relevant aspects <strong>of</strong> aviation. It also means that the Ministry has decided to use safety<br />
perception 28 by Dutch citizens as a performance indicator <strong>of</strong> the aviation safety policy in<br />
the Netherlands [DGTL 2005].<br />
The vision <strong>of</strong> the Ministry <strong>of</strong> Transport and Water Management concerning aviation safety<br />
consists <strong>of</strong> four pillars [DGTL 2005]:<br />
1. Continuous improvement <strong>of</strong> safety<br />
2. Explicit and transparent decision making<br />
3. Preparedness for inevitable <strong>risk</strong>s<br />
4. Development and maintenance <strong>of</strong> safety management and safety culture within the<br />
Ministry.<br />
The Ministry understands that aviation and aviation safety is largely governed by<br />
international agreements and cooperation. An important starting point for the Netherlands is<br />
to be able to operate on a level playing field (see also under that heading in this section).<br />
The development <strong>of</strong> a causal model <strong>of</strong> aviation safety is one <strong>of</strong> the primary topics <strong>of</strong> the<br />
Ministry’s Safety Policy agenda. According to the policy implementation plan, a causal <strong>risk</strong><br />
model should be used to identify weak spots in the aviation processes and assess their effect<br />
on overall safety (see also Appendix C).<br />
The use <strong>of</strong> a causal <strong>risk</strong> model as an enforcement tool was also mentioned in the policy<br />
documents. This would be a similar use as the way in which the statistical <strong>models</strong> for third<br />
party <strong>risk</strong> around <strong>air</strong>ports and noise calculations are being used. This intended use has<br />
caused some panic amongst the industry, primarily because they see the model as<br />
potentially restrictive. There is quite some suspicion, or even paranoia, <strong>of</strong> the industry<br />
towards the authorities in this respect because they already feel severely restricted by all<br />
kinds <strong>of</strong> local regulations. The fact that the authorities initially failed to explain precisely<br />
what a causal <strong>risk</strong> model is and how it could be used contributed to this situation (see also<br />
Appendix A on the history <strong>of</strong> third party <strong>risk</strong> regulation for Schiphol <strong>air</strong>port). Regulation<br />
on third party <strong>risk</strong> at Schiphol is a complex and sometimes controversial issue. A seemingly<br />
28 Safety perception is considered to be outside the scope <strong>of</strong> the causal <strong>risk</strong> <strong>models</strong> <strong>of</strong> this<br />
thesis, see section 2.2.<br />
52
unavoidable gap between (legal) safety standards and safety perception by the public<br />
further complicates the issue. This is particularly true for third party aviation <strong>risk</strong>, where<br />
safety standards are based on a combination <strong>of</strong> tradition, pr<strong>of</strong>essional <strong>risk</strong> estimates,<br />
estimates <strong>of</strong> accident probabilities, expected accident locations and accident consequences.<br />
These are combined into a single artificial number that represents ‘<strong>risk</strong>’ for a single year.<br />
This artificial number (e.g. individual <strong>risk</strong> or group <strong>risk</strong>) does not allow straightforward<br />
comparison with other expressions for fatality <strong>risk</strong>. A causal <strong>risk</strong> model has been proposed<br />
as a panacea for those issues, but this initially created even more difficulties and<br />
misunderstandings. These have been resolved, and the Ministry <strong>of</strong> Transport and Water<br />
Management now argues that causal <strong>risk</strong> <strong>models</strong> can be used to quantify improvements <strong>of</strong><br />
safety on the accident probability [Tweede Kamer 2003b]. It is then possible to use this<br />
accident probability for the calculation <strong>of</strong> third party safety levels and compare those with<br />
the target. In doing so, the causal <strong>risk</strong> model provides directions to the sector for the<br />
improvement <strong>of</strong> safety; it becomes a tool for <strong>risk</strong> informed decision making and can help<br />
the industry to capitalize on measures they have already taken. A requirement for the causal<br />
<strong>risk</strong> model therefore is the ability to estimate the effect <strong>of</strong> local, <strong>air</strong>port specific (safety)<br />
measures and local <strong>air</strong>port characteristics (like e.g. weather and surrounding terrain, type <strong>of</strong><br />
operations, etc.) on <strong>air</strong>craft accident probability.<br />
What the Ministry should also be wanting is a model that helps to develop and implement a<br />
national safety policy and the associated safety oversight activities. Setting and<br />
implementing safety policies requires the ability to make a <strong>risk</strong> inventory based on<br />
projected trends and changes, and to monitor safety from safety performance indicators. It<br />
also requires a way to estimate the effect <strong>of</strong> proposed safety measures on the level <strong>of</strong> safety.<br />
In a ‘vision document’ on safety oversight [IVW 2007], the Dutch Transport and Water<br />
Management Inspectorate laid down the framework for future safety oversight <strong>of</strong> the<br />
‘system Schiphol’. The system Schiphol is described as ‘all actors who directly or<br />
indirectly influence safety, economy or the environment within the <strong>air</strong>port processes,<br />
including interactions between actors’. Key points <strong>of</strong> this framework are:<br />
• Safety oversight <strong>of</strong> the system Schiphol should be integrated,<br />
• Special attention should be given to interfaces between actors,<br />
• Priority will be given to those areas where the <strong>risk</strong>s are high and deficiencies in<br />
compliance are numerous.<br />
To facilitate safety oversight as described in the vision document, an analysis tool is<br />
required that identifies and prioritises <strong>risk</strong>s on the basis <strong>of</strong> accident and incident<br />
information, (future) threats and compliance information for the entire system Schiphol. A<br />
causal <strong>risk</strong> model could fulfil this need if it meets the following requirements:<br />
• System wide representation, including interactions.<br />
• Able to utilise compliance information. This requires a link to safety regulation.<br />
• Able to use accident/incident information, specifically ECCAIRS as this is the<br />
main incident database system used by the European aviation authorities.<br />
• Able to rank <strong>risk</strong>s (according to a combination <strong>of</strong> probability and severity <strong>of</strong> the<br />
occurrence).<br />
• Able to represent emerging threats.<br />
United States<br />
In the United States, the Federal Aviation Administration (FAA) is responsible for<br />
certifying <strong>air</strong> carriers, commercial operators, <strong>air</strong> agencies and <strong>air</strong>men in order to ensure<br />
53
adequate levels <strong>of</strong> safety in the civil aviation system. These activities are conducted by the<br />
Flight Standards Services (AFS) organization. Within AFS, the Certification and<br />
Surveillance Division (AFS-900) is responsible for safety oversight activities, including<br />
certification, surveillance, and investigation. The activities are collectively termed the<br />
oversight system. Like other regulatory agencies, FAA and AFS face significant challenges<br />
in fulfilling their safety oversight mission. They must contend with a disparity between the<br />
magnitude <strong>of</strong> activities they are mandated to oversee and the limited resources available for<br />
oversight. Additionally, the activities involved are highly specialized and the relationships<br />
between individual activities and system safety are very complex. The very success <strong>of</strong> the<br />
aviation system in terms <strong>of</strong> safety performance makes it difficult to determine the linkage<br />
between oversight activities and safety outcomes. The FAA recognized that a system safety<br />
approach is required to guide the use <strong>of</strong> limited resources in order to increase the efficiency<br />
and effectiveness <strong>of</strong> the oversight activities and therefore initiated the Systems Approach to<br />
Safety Oversight (SASO) initiative. Such a system safety approach requires a<br />
comprehensive aviation safety performance evaluation methodology including a safety<br />
evaluation construct, safety hazard identification and <strong>risk</strong> analysis, safety performance<br />
measures and <strong>risk</strong> indicators, safety diagnostic procedures, <strong>risk</strong> management decision<br />
support tools and oversight evaluation methodology [FAA 2004]. According to SASO’s<br />
research requirements, the safety hazard identification and <strong>risk</strong> analysis requires a<br />
methodology to provide a foundation for conducting <strong>risk</strong> analysis. That methodology<br />
should include basic definitions such as cause, hazard, failure, their relationships and types,<br />
and the causal pathway. At a minimum, the method must allow a probabilistic evaluation <strong>of</strong><br />
<strong>risk</strong> associated with hazards in the area <strong>of</strong> operational functions and procedures, but, if<br />
possible, hazards and <strong>risk</strong> in other areas <strong>of</strong> the aviation system such as <strong>air</strong>craft and<br />
equipment malfunctions, hazards due to organisational set-up, human errors, environmental<br />
hazards (wind, turbulence, terrain) and contributory hazards (regulatory, economy) should<br />
be included. A specific requirement is to have a top-level representation as the user<br />
interface for performing <strong>risk</strong> analysis [FAA 2004]. Validation <strong>of</strong> the methods is proposed<br />
by empirical testing using historical data and secondly by a panel <strong>of</strong> subject matter experts<br />
from the FAA and industry.<br />
When comparing these FAA requirements to those from the Dutch Ministry <strong>of</strong> Transport<br />
for a causal <strong>risk</strong> model it is apparent that FAA’s requirements are more detailed and the<br />
role a causal model in the regulatory process is better described. So for the Dutch Ministry<br />
<strong>of</strong> Transport the model developers will have to describe the requirements for them.<br />
Europe<br />
The European Commission’s vision on European aeronautics for 2020 asks for a five fold<br />
reduction in the average accident rate <strong>of</strong> global operators (relative to 2001). According to<br />
the same vision, safety research challenges to achieve that goal include the following<br />
[Group <strong>of</strong> Personalities 2001]:<br />
• Flight hazard protection<br />
• Advanced avionics<br />
• Probability and <strong>risk</strong> analysis<br />
• Computational methods<br />
• Human error checking systems<br />
The document, high level as it is, fails to provide useful details on what is exactly meant<br />
under the heading probability and <strong>risk</strong> analysis, but at least it shows that it is recognised by<br />
54
the European Commission as a key research area. This is further demonstrated by the fact<br />
that the EC has funded several research initiatives on causal aviation <strong>risk</strong> modelling, most<br />
notably the projects DESIRE, ASTER and ASICBA 29 in the fourth, fifth and sixth<br />
framework programme respectively [Piers et al 2006].<br />
The EC funded project ‘ASTER’ also attracted the attention <strong>of</strong> the JAA because they were<br />
at that time looking into ways to perform regulatory impact assessments. JAA required that<br />
“All safety impacts <strong>of</strong> the option(s) being evaluated should be identified and wherever<br />
possible and necessary be quantified e.g. in terms <strong>of</strong> incident/accident probability and<br />
severity. This should, if appropriate, include Human Factors and Operational aspects”<br />
[Morier 2002]. With the transition <strong>of</strong> tasks from JAA to EASA this has now become an<br />
EASA requirement. For a causal <strong>risk</strong> model to be able to assist in a regulatory impact<br />
assessment it needs to be able to assess the effect <strong>of</strong> regulatory changes on accident <strong>risk</strong>.<br />
Eurocontrol and the European Commission launched the Single European Sky (SES) ATM<br />
program in 2006. SESAR, the technological part <strong>of</strong> SES, aims to achieve a highperformance<br />
European <strong>air</strong> traffic control infrastructure by the year 2020 which will enable<br />
the safe, environmental friendly and sustainable development <strong>of</strong> <strong>air</strong> <strong>transport</strong>. Part <strong>of</strong> the<br />
safety approach in SESAR is a top-down approach to show compliance with a TLS by<br />
apportioning the overall safety targets for individual components. According to<br />
Eurocontrol, to apportion the TLS in a systematic way, a fundamental requirement is a<br />
quantitative model <strong>of</strong> the causes <strong>of</strong> accident <strong>risk</strong>s. This <strong>risk</strong> model must quantify the causal<br />
relationship between the safety measure used in the TLS and the system elements that<br />
require apportioned targets [Eurocontrol 2007].<br />
Level playing field<br />
In <strong>air</strong> <strong>transport</strong>, when locally new rules are announced or implemented, response from<br />
industry is <strong>of</strong>ten that those local rules distort the ‘level playing field’. The notion <strong>of</strong> a ‘level<br />
playing field’ is used to indicate that an organization (be it an <strong>air</strong>line, <strong>air</strong>port organization,<br />
or other) does not enjoy advantages or suffer disadvantages as a result <strong>of</strong> locally prevailing<br />
regulation compared to rivals under other local regulation. This seems to imply that the<br />
existence <strong>of</strong> a ‘level playing field’ is fully determined by aspects that are controlled by the<br />
authorities; rules and enforcement. However, the competitiveness <strong>of</strong> an organization is not<br />
only influenced by rules and regulations but also by factors such as the geographical and<br />
demographical location, environmental conditions such as prevailing weather etc. This<br />
raises some fundamental issues. One could imagine that in a country where the<br />
environmental conditions are unfavourable for a particular activity, the authorities provide<br />
compensation by subsidizing, which then can lead to a certain controversy. A neighbouring<br />
country could claim that the subsidies bring about a distortion <strong>of</strong> competition, while the<br />
home country could claim that the subsidies just do the opposite and result in a balanced<br />
competition.<br />
Assessing whether a level playing field exists in aviation is an extremely complex<br />
endeavour, not only because aviation itself is a complex and highly distributed activity, but<br />
29<br />
The objectives <strong>of</strong> these projects was to develop a method to set and optimise safety<br />
targets to achieve the optimum level <strong>of</strong> safety for the aviation system as a whole by<br />
distributing the safety burden more evenly among the different stakeholders, and the<br />
development <strong>of</strong> a method for cost benefit analysis to assess safety benefits <strong>of</strong> any change,<br />
including changes in legislation and rulemaking, in relation to the costs <strong>of</strong> implementing<br />
those changes.<br />
55
also because <strong>of</strong> the large amount <strong>of</strong>- and differences in rules and regulations and the way in<br />
which they are applied in different countries. A good example <strong>of</strong> the way in which different<br />
rules regarding norms for <strong>air</strong>port noise levels influence <strong>air</strong>port operations and associated<br />
costs is provided by the Netherlands Environmental Assessment Agency [MNP 2005].<br />
However this information is still insufficient to show whether there exists a level playing<br />
with respect to this subject. A causal <strong>risk</strong> model could possibly provide a substantiated<br />
answer to questions or alleged claims regarding the level playing field, but this would<br />
require the model to have some sort <strong>of</strong> representation <strong>of</strong> current national and international<br />
regulation and also allow for national differences in climate and geography.<br />
Quantitative safety requirements in aviation safety regulation<br />
The majority <strong>of</strong> aviation regulations are qualitative descriptions <strong>of</strong> the conditions that have<br />
to be satisfied to obtain a license or certificate to build, fly, operate and maintain <strong>air</strong>craft,<br />
provide <strong>air</strong> navigation services and design, operate and maintain infrastructures such as<br />
<strong>air</strong>ports. Aviation safety regulation contains sometimes also quantitative safety<br />
requirements. By considering these requirements, the targets that are set, the methods used<br />
and the way in which compliance can be demonstrated, we obtain some idea <strong>of</strong> the user<br />
requirements that one might expect for a causal <strong>risk</strong> model.<br />
The most influential are ICAO’s collision <strong>risk</strong> targets, FAA/JAA/EASA’s targets for<br />
<strong>air</strong>craft system failures, and Eurocontrol’s target for ‘ATM directly contributing to <strong>air</strong>craft<br />
accidents’. Targets for <strong>air</strong>craft system failures have already been described in section 4.3.3,<br />
the others will be discussed below. Compliance with mandatory targets is commonly shown<br />
by analysis, laboratory tests or flight testing. FAA/JAA/EASA and Eurocontrol publish<br />
advisory material on acceptable means <strong>of</strong> compliance. For <strong>air</strong>craft system safety<br />
assessments, the advisory materials on FAR 25.1309 and EASA CS 25.1309 list various<br />
methods for assessing the causes, severity, and probability <strong>of</strong> failure conditions. The list<br />
includes Functional Hazard Assessment, Failure Modes and Effects Analysis, Fault Tree<br />
Analysis, Markov Analysis, and Common Cause Analysis. Eurocontrol’s guidance material<br />
on <strong>risk</strong> assessment and mitigation in ATM [Eurocontrol 2004] is intended to present the<br />
acceptable means <strong>of</strong> compliance recognised by Eurocontrol’s Safety Regulation<br />
Commission as possible harmonised ways to meet ESARR 4 provisions. The document<br />
presents 3 different methods, but, interestingly enough, also states that none <strong>of</strong> those<br />
methods is considered to be fully compliant.<br />
ICAO collision <strong>risk</strong> requirement<br />
ICAO prescribes a TLS <strong>of</strong> 5 x 10 -9 fatal accidents due to collisions per flight hour per<br />
dimension i.e, lateral, longitudinal and vertical [ICAO 2002c]. The basis for assessing<br />
ICAO’s mid-<strong>air</strong> collision safety targets is a collision <strong>risk</strong> model developed by Reich in<br />
1966 [Reich 1966a, 1966b, 1966c]. It is partially based on real and simulated data <strong>of</strong><br />
observed error rates. According to Reich, the collected data shows that ‘flying errors’ 30 do<br />
not obey the Gaussian distribution and that no simple theoretical distribution adequately<br />
describes all the observed data. Four decades later, the need for real data rather than<br />
‘estimates’ when it comes to probabilities <strong>of</strong> events that are dominated by human<br />
performance continues to be relevant [Brooker 2004].<br />
30<br />
Imperfections in navigation and piloting.<br />
56
For ILS approaches 31 , the ICAO Obstacle Clearance Panel developed a collision <strong>risk</strong> model<br />
in the form <strong>of</strong> a computer programme that calculates the probability <strong>of</strong> collision with<br />
obstacles by an <strong>air</strong>craft on an ILS approach and possible subsequent missed approach. The<br />
collision <strong>risk</strong> model was developed as a result <strong>of</strong> an extensive data collection programme<br />
followed by detailed mathematical analysis [ICAO 1980]. The data collection was<br />
necessary to be able to predict probabilities <strong>of</strong> events that are dominated by human<br />
performance, such as the spread <strong>of</strong> <strong>air</strong>craft about the nominal path during an ILS approach.<br />
In conclusion, the ICAO collision <strong>risk</strong> requirements are expressed as a target <strong>of</strong> fatal<br />
accidents per flight hour. ICAO prescribes the way in which the calculation must be<br />
conducted to demonstrate that the target is met. ICAO is indeed an appropriate body to<br />
standardise and prescribe a <strong>risk</strong> model for a particular application. It would therefore be<br />
useful to inform and involve ICAO in the development <strong>of</strong> a causal <strong>risk</strong> model.<br />
Eurocontrol requirement for ATM <strong>risk</strong><br />
Eurocontrol Safety Regulatory Requirement (ESARR) 4 ‘Risk Assessment and Mitigation<br />
in ATM’ [Eurocontrol 2001b] concerns the use <strong>of</strong> a quantitative <strong>risk</strong>-based approach in Air<br />
Traffic Management when introducing and/or planning changes to the ATM system. This<br />
requirement covers the human, procedural and equipment (hardware, s<strong>of</strong>tware) elements <strong>of</strong><br />
the ATM system as well as its environment <strong>of</strong> operations. The requirement is consistent<br />
with amendment 40 to ICAO Annex 11, mandating the use <strong>of</strong> safety assessment <strong>of</strong><br />
significant changes in ATS. According to ESARR 4, the maximum tolerable probability <strong>of</strong><br />
ATM directly contributing to an accident is 1.55 x 10 -8 per flight hour, or 2.31 x 10 -8<br />
accidents per flight. Pr<strong>of</strong>essional judgement was used to determine the maximum<br />
acceptable ATM direct contribution to accidents; and 20 years <strong>of</strong> historic data were selected<br />
to confirm the credibility <strong>of</strong> this target. The explanatory material on ESARR 4 requirements<br />
states [Eurocontrol 2003]:<br />
“The feasibility <strong>of</strong> setting quantitative objectives / targets for specific parts <strong>of</strong> the<br />
ATM system was discussed, especially when it comes to their allocation to human<br />
contributions, procedures and s<strong>of</strong>tware. It is recognised that demonstration <strong>of</strong><br />
compliance won’t always be quantitatively – based, as it does not seem feasible to<br />
demonstrate a priori and in a quantified manner that a good working process, such as<br />
training, Safety Management System, or s<strong>of</strong>tware codes <strong>of</strong> practices, enable specific<br />
quantitative objectives to be met. This will only be based on pr<strong>of</strong>essional judgement<br />
and potentially verified over time.”<br />
This is an illustration <strong>of</strong> the dilemma between the objective, which implies the need <strong>of</strong><br />
some sort <strong>of</strong> causal <strong>risk</strong> model, and the belief in the possibility <strong>of</strong> constructing one to meet<br />
the objective.<br />
The increasing integration, automation and complexity <strong>of</strong> the ATM system requires a<br />
systematic and structured approach to <strong>risk</strong> assessment and mitigation, including hazard<br />
identification, as well as the use <strong>of</strong> predictive and monitoring techniques to assist in these<br />
processes [Eurocontrol 2003]. ESARR explanatory material recognises that a combination<br />
<strong>of</strong> quantitative (e.g. mathematical model, statistical analysis) and qualitative (e.g. good<br />
working processes, pr<strong>of</strong>essional judgement) arguments may be used to provide a good<br />
enough level <strong>of</strong> assurance that all identified safety objectives and requirements have been<br />
31<br />
An ILS approach is an approach to landing that is conducted with the aid <strong>of</strong> a ground<br />
navigation system ILS: the Instrument Landing System. ILS allows <strong>air</strong>craft to land under<br />
weather conditions where the pilots cannot see the runway, like low-hanging clouds or fog.<br />
57
met. The explanatory material emphasises the development <strong>of</strong> safety monitoring and data<br />
collection mechanisms. The rationale is that any model (e.g. Collision Risk Model) used in<br />
<strong>risk</strong> assessment must be validated, and real data could contribute significantly to this<br />
validation process.<br />
Eurocontrol provides the following rationale for a quantified <strong>risk</strong> based approach in Air<br />
Traffic Management when introducing and/or planning changes to the ATM system<br />
[Eurocontrol 2003]:<br />
• A <strong>risk</strong> based approach is considered as meeting the objectives <strong>of</strong> Eurocontrol’s Safety<br />
Regulation Committee (SRC) in assessing and controlling <strong>risk</strong> related to changes in<br />
ATM.<br />
• A <strong>risk</strong> based approach is the most commonly used in aviation as well as other safety<br />
critical industries such as chemical and nuclear.<br />
• There is an added value in using quantitative objectives, as it avoids diverging<br />
understanding by states on the range <strong>of</strong> frequencies <strong>of</strong> occurrences included in a <strong>risk</strong><br />
classification scheme,<br />
• Quantitative criteria provide a clear target and, when derived and applied to lower level<br />
events, allow manufacturers to design equipment without having to analyse the entire<br />
ATM system.<br />
• The safety performance measurement <strong>of</strong> actual safety occurrences (with ATM<br />
contribution) may enable the verification a posteriori <strong>of</strong> whether or not quantitative<br />
objectives allocated to specific failures in a ‘fault tree’ for example are being met.<br />
Indeed, quantitative objectives could be derived from ATM safety minima and<br />
allocated to specific failures in a ‘fault tree’, hence providing for a range <strong>of</strong><br />
probabilities which can be reasonably assessed over a short or medium period <strong>of</strong> time.<br />
• In addition to the measurement <strong>of</strong> accidents and serious incidents with associated ATM<br />
contributions, such a feed back from experience on events <strong>of</strong> a lower level would<br />
enable the measurement <strong>of</strong> the effectiveness <strong>of</strong> the qualitative processes selected for<br />
s<strong>of</strong>tware, human, or procedures and the identification <strong>of</strong> related appropriate “good<br />
working practices” to be used in ATM as acceptable measures to show compliance<br />
with quantified objectives.<br />
Eurocontrol has developed an ANS Safety Assessment Methodology (SAM) to support the<br />
demonstration that safety is being managed within safety levels which as a minimum meet<br />
those approved by the designated authority [Eurocontrol 2006a]. The SAM methodology is<br />
based upon the method used for certification <strong>of</strong> civil <strong>air</strong>craft systems and equipment and<br />
follows three main steps: Functional Hazard Assessment, Preliminary System Safety<br />
Assessment and System Safety Assessment. SAM suggests the use <strong>of</strong> event trees and fault<br />
trees to create a bow-tie with the hazards, as identified in the functional hazard assessment,<br />
in the centre. The SAM considers the three types <strong>of</strong> system elements; people, equipment<br />
and procedures and their interactions (within the system and with the environment) in a<br />
specific environment <strong>of</strong> operation, but does not address organisational and management<br />
aspects. The ability to represent managerial and organisational factors therefore is a<br />
requirement for a causal <strong>risk</strong> model in order to help resolving this omission in the<br />
Eurocontrol SAM.<br />
4.3.7. Passengers<br />
For passengers safety is a very personal thing; safety is their safety. From their perspective,<br />
the aviation system is the <strong>air</strong>line. People are in general only superficially aware <strong>of</strong> the role<br />
<strong>of</strong> the other actors in the system, and demand that the <strong>air</strong>line will take care <strong>of</strong> their safety.<br />
58
Passengers, in particular those that travel for leisure, have some, but limited, control over<br />
two variables that may influence their safety: the destination and the <strong>air</strong>line. Yet very few<br />
people will consider flight safety when they select their holiday destination. Some studies<br />
have tried to determine whether <strong>air</strong>craft accidents really influence people’s willingness to<br />
travel by <strong>air</strong>, but significant, long lasting effects have not been demonstrated, see also<br />
Figure 8 [Barnett & LoFaso 1983, Barnett et al 1992]. This is not to say that passengers are<br />
ignorant <strong>of</strong> aviation safety. The case <strong>of</strong> Onur Air (see infobox) illustrates that passengers<br />
indeed would like to see an ‘<strong>air</strong>line safety rating’ similar to for instance ‘safety stars’ that<br />
are awarded to cars in EuroNCAP crash tests. These safety ratings are even used by car<br />
manufacturers for sales promotion.<br />
Onur Air<br />
On 12 May 2005, the Turkish <strong>air</strong>line Onur <strong>air</strong> was banned from Dutch <strong>air</strong>space for a period<br />
<strong>of</strong> two weeks after it had failed on a number <strong>of</strong> SAFA inspections. Initially the ban was<br />
intended to last for a period <strong>of</strong> four weeks, but when Onur Air had shown improvements,<br />
and after considerable political pressure from the Turkish government, the ban was lifted<br />
after two weeks. In the meantime, the Dutch Inspectorate received numerous calls (up to<br />
800 per day) from worried passengers who had questions about the safety <strong>of</strong> <strong>air</strong> travel in<br />
general, and <strong>air</strong>lines from Turkey in particular [Tweede Kamer 2005].<br />
In reaction to the accident in Puerto Plata (Dominican Republic) in 1996 which mainly<br />
involved German tourists on board a Turkish charter <strong>air</strong>craft [JIAA 1996], and following a<br />
string <strong>of</strong> accidents in the summer <strong>of</strong> 2005, the European Commission drafted a regulation<br />
on <strong>air</strong> carrier identity. The regulation introduces two innovations: a blacklist <strong>of</strong> <strong>air</strong>lines<br />
which have been banned for safety reasons, and passenger information about the identity <strong>of</strong><br />
the <strong>air</strong> carrier which is operating their flight. Common safety criteria, which are listed in the<br />
annex to the regulation, were drawn up on the basis <strong>of</strong> work performed by a committee <strong>of</strong><br />
national experts in aviation safety and relate essentially to the findings <strong>of</strong> SAFA inspections<br />
carried out at European <strong>air</strong>ports [EC 2005]. A report on safety communication that was<br />
produced for the Safety Advisory Committee Schiphol (VACS) concludes that the<br />
publication <strong>of</strong> a blacklist should be accompanied by the publication <strong>of</strong> a ‘gray list’ <strong>of</strong><br />
<strong>air</strong>lines that are not banned but are considered more <strong>risk</strong>y than others. Safety<br />
communication via black lists alone could lead to a false picture <strong>of</strong> safety [Stallen &<br />
Hudson 2006]. The VACS report also recommends providing additional safety information<br />
to the general public, including a simple explanation <strong>of</strong> complex and counterintuitive facts.<br />
This would result in a better appreciation <strong>of</strong> the ability to control <strong>risk</strong>, and this is an<br />
important factor in <strong>risk</strong> perception. The FAA is also in favour <strong>of</strong> informing the public<br />
better: “Because a large component <strong>of</strong> the public perception <strong>of</strong> aviation <strong>risk</strong> may not be<br />
easily assuaged by quantifiable <strong>risk</strong> ratios and accident rates, any communication system<br />
intended to inform and reassure the public about safety probably has to address more than<br />
the likelihoods <strong>of</strong> various outcomes and events” [FAA 1997]. Informing the public on<br />
safety policy and safety efforts is one <strong>of</strong> the user objectives <strong>of</strong> a causal <strong>risk</strong> model for<br />
aviation, as listed in the final report <strong>of</strong> the project group 32 causal modelling [VACS 2003a].<br />
From a series <strong>of</strong> surveys in the Netherlands [De Gier 2005] it was concluded that the<br />
general public is greatly interested in what they themselves can do to improve aviation<br />
safety. In the chemical industry this had been recognised much earlier and obligations for<br />
government and industry with respect to public information on <strong>risk</strong> was laid down in<br />
32<br />
This group consisted <strong>of</strong> representatives from the Dutch Ministry <strong>of</strong> Transport, Schiphol<br />
Airport, KLM and Air Traffic Control the Netherlands.<br />
59
Article 8 <strong>of</strong> the Seveso Directive (EC Directive 82/501/EC) and a subsequent addendum,<br />
the so-called ‘post Seveso Directive’ (EC Directive 88/610/EC) which specifies the items<br />
the people should be informed about and requested the active provision <strong>of</strong> information to<br />
the public [Eijndhoven et al 1994]. A causal <strong>risk</strong> model would thus be useful for passengers<br />
if it can indeed be used for safety communication. The government could then use it to<br />
explain complex and counterintuitive matters, while the passengers could use it to assess<br />
what they themselves can do to improve safety and to assess the ‘safety quality’ <strong>of</strong> <strong>air</strong>lines.<br />
This requires a causal <strong>risk</strong> model that is not a black box, but provides insight into how<br />
various components interact and influence aviation safety. Requirements for a causal <strong>risk</strong><br />
model to be used by passengers or for safety communication are the following:<br />
• The model representation should be transparent.<br />
• The model should use laymen terminology in the parts accessible to the user.<br />
• The model should be able to represent the influence on safety <strong>of</strong> those parameters<br />
that can be directly influenced by passengers:<br />
• <strong>air</strong>line<br />
• <strong>air</strong>craft type<br />
• <strong>air</strong>port <strong>of</strong> departure<br />
• <strong>air</strong>port <strong>of</strong> destination.<br />
4.3.8. People living or working in the vicinity <strong>of</strong> <strong>air</strong>ports<br />
For people living or working in the vicinity <strong>of</strong> the <strong>air</strong>port, safety is a personal thing, safety<br />
is their safety. They do not have any direct control over safety ins<strong>of</strong>ar as aviation <strong>risk</strong> is<br />
concerned, other than the decision to live in the vicinity <strong>of</strong> an <strong>air</strong>port. As formulated by the<br />
ch<strong>air</strong>man <strong>of</strong> the Provincial Council <strong>of</strong> Limburg: ”If a civilian lives in the vicinity <strong>of</strong> for<br />
example an <strong>air</strong>field or another business that produces noise nuisance it is up to the civilian<br />
to accept the nuisance or not. In granting an environmental permit the business receives<br />
from the authority permission to cause a certain nuisance that is considered acceptable.<br />
The business is held to observe this permit. The authorities must oversee compliance by the<br />
business. How the authorities should oversee compliance <strong>of</strong> businesses to regulations and<br />
permits is prescribed in the provincial enforcement policy. If a civilian does not accept the<br />
‘permitted nuisance’ he should not, but could, move. This is a personal consideration and<br />
he has this freedom <strong>of</strong> choice [GS 2003]. People living or working in the vicinity <strong>of</strong> the<br />
<strong>air</strong>port expect the government to take care <strong>of</strong> <strong>air</strong> accident <strong>risk</strong>. They do not have an<br />
objective instrument to measure the level <strong>of</strong> <strong>risk</strong>, but they sometimes perceive low flying or<br />
noisy <strong>air</strong>craft as ‘<strong>risk</strong>y’. “Whenever an <strong>air</strong>craft flies low over the neighbourhood, I crawl<br />
under the st<strong>air</strong>case from sheer fright” [GVA 2005]. “On Saturday evening at approximately<br />
half past seven an <strong>air</strong>craft with deployed landing gear flew so extremely low and with such<br />
thunderous noise over the neighbourhood that we thought he was making an emergency<br />
landing” [SP 1999]. Indirectly, citizens can influence aviation safety or third party safety by<br />
reporting safety concerns to the authority and by taking part in resident’s lobby groups. In<br />
2005, there were at least 20 active groups <strong>of</strong> residents that were lobbying against Schiphol,<br />
see Table 2. The primary focus <strong>of</strong> most <strong>of</strong> these groups is on noise and the environment.<br />
Only the Werkgroep Vliegverkeer Bijlmermeer 33 also explicitly concentrates on safety.<br />
33<br />
This group was established immediately after the El-Al Boeing 747 disaster in ‘the<br />
Bijlmermeer’, an Amsterdam suburb, in October 1992 [Netherlands Aviation Safety Board<br />
1994].<br />
60
Table 2: List <strong>of</strong> resident’s lobby groups. Source: Milieudefensie<br />
1. Platform Vliegoverlast Amsterdam<br />
2. Werkgroep Vliegverkeer Bijlmermeer<br />
3. SWAB Amstelveen/Buitenveldert<br />
4. Platform Leefmilieuregio Schiphol<br />
5. GEUS-Aalsmeer<br />
6. De Baanbrekers<br />
7. Dorpsraad Vijfhuizen<br />
8. Dorpsraad Spaarnwoude-Halfweg<br />
9. Bewonersbelangen Isolatie Assendelft<br />
10. Platform Vliegoverlast Assendelft<br />
11. S.O.S. Spaarndam<br />
12. Milieudefensie Haarlem<br />
13. Platform Velsen Overlast Schiphol<br />
14. Werkgroep Luchtruim IJmond-Noord<br />
15. Milieudefensie Heemskerk<br />
16. Platform Vlieghinder Regio Castricum<br />
17. Zaans Natuur en Milieu Kontakt, Platform Vliegtuigoverlast Zaanstad<br />
18. Milieu Contact Heiloo<br />
19. Vliegtuig Overlast Sassenheim<br />
20. Platform Overlast Schiphol Uithoorn<br />
Research studies indicate that aviation <strong>risk</strong> is not a major concern for people living in the<br />
vicinity <strong>of</strong> <strong>air</strong>ports. Effects such as noise and environmental effects are considered to be<br />
more important than <strong>risk</strong>. People are aware <strong>of</strong> the fact that the <strong>air</strong>port creates additional<br />
<strong>risk</strong>, but feelings <strong>of</strong> unsafety in general are driven by car <strong>risk</strong> and crime <strong>risk</strong> and fear for<br />
toxic substances in food, but not by aviation <strong>risk</strong> [Van het Loo et al 1999]. In comparison to<br />
discussions about effects <strong>of</strong> <strong>air</strong> <strong>transport</strong> on pollution and noise, there is little societal<br />
pressure to improve the safety performance [K+V 2005].<br />
National and local governments are keenly aware <strong>of</strong> the importance <strong>of</strong> citizen’s opinions.<br />
Citizen participation and involvement is stimulated by local meetings where people can<br />
voice their opinion. Communication is an important section in the government’s plan for<br />
the evaluation <strong>of</strong> Schiphol policy [DGL 2004]. In their pursuit <strong>of</strong> citizen participation and<br />
involvement, it is understandable that the Dutch government is looking for instruments that<br />
can help them communicate about safety. Similar to the use <strong>of</strong> a causal <strong>risk</strong> model to<br />
inform passengers about the safety <strong>of</strong> various <strong>air</strong>lines, this would require a model that<br />
provides insight into how various components in the <strong>air</strong> <strong>transport</strong> system interact and<br />
influence flight safety.<br />
61
4.4. Summary <strong>of</strong> user requirements and discussion on consistency<br />
The user requirements derived in the previous section can be summarised as follows:<br />
Airlines<br />
1. Ability to perform cost benefit analysis <strong>of</strong> proposed future changes.<br />
2. Future changes in how functions are operationalised can be incorporated.<br />
3. Link with in-flight recorded data and crew safety reports.<br />
4. Based on safety indicators other than the accident rate.<br />
Rep<strong>air</strong> stations<br />
5. Calculate the expected safety implications <strong>of</strong> each Service Bulletin.<br />
6. Capture very specific (specific to <strong>air</strong>craft type or even tail number) and detailed<br />
(up to <strong>air</strong>craft component level) information.<br />
Manufacturers<br />
7. Properly represent the role <strong>of</strong> the human operator and be able to capture<br />
dependencies between different system components.<br />
8. Represent current as well as possible future accident scenarios.<br />
9. Model is validated and accepted by the regulators.<br />
10. Model should produce similar results if applied by different users.<br />
Air navigation service providers<br />
11. Ability to represent safety effects <strong>of</strong> changes in human, procedural, hardware and<br />
s<strong>of</strong>tware elements <strong>of</strong> the ATM System as well as its environment <strong>of</strong> operations.<br />
12. Ability to represent the contribution <strong>of</strong> ATM in both causation and prevention <strong>of</strong><br />
accidents.<br />
13. Representation <strong>of</strong> the total aviation system, including dependencies between<br />
system elements.<br />
14. Provide quantitative output.<br />
15. Ability to show the safety impacts <strong>of</strong> ATM as it develops in the future.<br />
Airports<br />
16. Provide insight into cause and effect <strong>of</strong> safety <strong>risk</strong>s.<br />
17. Provide insight into which <strong>risk</strong>s are already sufficiently covered by safety<br />
measures, and those <strong>risk</strong>s for which adequate safety measures are lacking.<br />
18. Provide insight into the effectiveness <strong>of</strong> safety measures for the management <strong>of</strong><br />
<strong>risk</strong>.<br />
19. Provide insight into the probability and the effect <strong>of</strong> safety <strong>risk</strong>s.<br />
62
Policy makers and regulators<br />
20. Ability to estimate the effect <strong>of</strong> local, <strong>air</strong>port specific (safety) measures and local<br />
<strong>air</strong>port characteristics (like e.g. weather and surrounding terrain, type <strong>of</strong><br />
operations, etc.) on <strong>air</strong>craft accident probability.<br />
21. Ability to make a <strong>risk</strong> inventory based on projected trends and changes, and to<br />
monitor safety from safety performance indicators.<br />
22. A way to estimate the effect <strong>of</strong> proposed safety measures on the level <strong>of</strong> safety.<br />
23. System wide representation, including interactions.<br />
24. Able to utilise compliance information. This requires a link to safety regulation.<br />
25. Able to use accident/incident information, specifically ECCAIRS as this is the<br />
main incident database system used by the European aviation authorities.<br />
26. Able to rank <strong>risk</strong>s (according to a combination <strong>of</strong> probability and severity <strong>of</strong> the<br />
occurrence).<br />
27. Able to represent emerging threats.<br />
28. Provide a foundation for conducting <strong>risk</strong> analysis.<br />
29. Include basic definitions such as cause, hazard, failure, their relationships and<br />
types, and the causal pathway.<br />
30. Allow a probabilistic evaluation <strong>of</strong> <strong>risk</strong> associated with hazards in the area <strong>of</strong><br />
operational functions and procedures.<br />
31. If possible, hazards and <strong>risk</strong> in other areas <strong>of</strong> the aviation system such as <strong>air</strong>craft<br />
and equipment malfunctions, hazards due to organisational set-up, human errors,<br />
environmental hazards (wind, turbulence, terrain) and contributory hazards<br />
(regulatory, economy) should be included.<br />
32. Have a top-level representation as the user interface.<br />
33. Ability to assess the effect <strong>of</strong> regulatory changes on accident <strong>risk</strong>.<br />
34. Representation <strong>of</strong> current national and international regulation.<br />
Passengers<br />
35. The model representation should be transparent.<br />
36. The model should use laymen terminology in the parts accessible to the user.<br />
37. The model should be able to represent the influence on safety <strong>of</strong> those parameters<br />
that can be directly influenced by passengers:<br />
• <strong>air</strong>line<br />
• <strong>air</strong>craft type<br />
• <strong>air</strong>port <strong>of</strong> departure<br />
• <strong>air</strong>port <strong>of</strong> destination.<br />
People living near <strong>air</strong>ports<br />
38. Provide insight into how various components in the <strong>air</strong> <strong>transport</strong> system interact<br />
and influence flight safety.<br />
The requirement (29) to include basic definitions such as cause, hazard, failure, their<br />
relationships and types, and the causal pathway is assumed to be inherently met in a causal<br />
<strong>risk</strong> model.<br />
63
Grouped by type <strong>of</strong> requirements, the remaining user requirements can be placed under the<br />
following high level headings:<br />
• Integrated, to represent the complexity <strong>of</strong> the complete aviation system and its<br />
many interdependencies, including the human operators and organisations (3, 4, 5,<br />
6, 7, 11, 12, 13, 17, 18, 20, 21, 22, 23, 24, 25, 28, 30, 31, 33, 34, 37)<br />
• Quantitative; to allow comparison with quantitative safety targets (1, 14, 19, 21,<br />
22, 26, 28, 30)<br />
• Transparent and clear, to provide insight and for communication purposes (16, 19,<br />
32, 35, 36, 38)<br />
• Model is validated and turns out reproducible results, required if the results are<br />
being used in a certification process (9, 10)<br />
• Able to represent current and future accident scenarios (2, 8, 15, 21, 22, 27, 28).<br />
The summary <strong>of</strong> user requirements also shows that some requirements are incompatible or<br />
cannot be achieved. The following requirements are problematic:<br />
• The requirement for transparency<br />
• The requirement to use laymen terminology.<br />
• The requirement to capture very specific (specific to <strong>air</strong>craft type or even tail<br />
number) and detailed (up to <strong>air</strong>craft component level) information.<br />
• Representation <strong>of</strong> current national and international regulation and the ability to<br />
utilise compliance information.<br />
• The requirement to properly represent the role <strong>of</strong> the human operator.<br />
As will be explained below, the requirement for transparency requires a choice to be made.<br />
The requirement to use laymen terminology can be met if the model representation and<br />
accessibility is adapted to the user. This will require a different user interface for each user<br />
group. The requirement to capture very specific information and the requirement to<br />
represent regulation cannot be met at present. The requirement to represent the human<br />
operator, while problematic, should be maintained.<br />
Transparency<br />
In this context, a model is considered transparent if a simple set <strong>of</strong> rules and symbols<br />
applies and if it is intuitive. Transparency and model completeness and correctness are in<br />
conflict. A model is an abstraction <strong>of</strong> reality which in itself is not transparent. If more<br />
aspects <strong>of</strong> reality are represented in the model it will become less transparent. Transparency<br />
also depends on the user. For a mathematician a set <strong>of</strong> mathematical equations will be more<br />
transparent than for an engineer or a safety manager, which means that transparency can<br />
also be increased by educating the users on the rules and symbols that are being used. In<br />
general there are three alternative ways to obtain a transparent model:<br />
• Keep the model simple<br />
• Educate the users<br />
• Present a simplified representation <strong>of</strong> the model via a user interface.<br />
Which way (or combination <strong>of</strong> ways) is selected is a choice to be made and will depend on<br />
things such as the number <strong>of</strong> different users that are expected, the type <strong>of</strong> users, whether the<br />
model will be used only once or repeatedly, the available resources, etc.<br />
Use <strong>of</strong> laymen terminology<br />
The requirement to use laymen terminology in the parts accessible to the user is<br />
incompatible with the general requirement to represent the total aviation system, including<br />
64
dependencies between system elements, and to allow a probabilistic evaluation <strong>of</strong> <strong>risk</strong><br />
associated with hazards in the area <strong>of</strong> operational functions and procedures. Because the<br />
level <strong>of</strong> safety in aviation is already very high, safety improvements must be obtained in the<br />
details. A causal <strong>risk</strong> model will therefore need to be able to represent these details and<br />
hence be a complex model. For communication with a general public on the other hand a<br />
simple model is required. The core <strong>of</strong> a causal <strong>risk</strong> model consists <strong>of</strong> mathematical<br />
equations, but these are counterproductive for communication with lay people. For<br />
communication it is <strong>of</strong>ten best to avoid mathematics but to use for instance metaphors to<br />
explain concepts. Reason’s ‘Swiss cheese model’ is a good example <strong>of</strong> a model that is fit<br />
for communication purposes but for calculations that ‘model’ is rather useless, unless the<br />
concept is translated into mathematical equations. On the other hand, graphic representation<br />
<strong>of</strong> the causal flows <strong>of</strong> accidents have proven to be very effective for communication <strong>of</strong><br />
assumptions and findings within a <strong>risk</strong> analysis team [Svedung & Rasmussen 2002]. A<br />
solution for this dilemma is to develop different model representations for different users.<br />
The model representation for the general public would then have to be simple, using<br />
laymen terminology and allowing only limited access to the model, the model<br />
representation for the safety specialist can be complex and allow access to a much larger<br />
part <strong>of</strong> the model.<br />
Capturing specific information<br />
The requirement to capture very specific (specific to <strong>air</strong>craft type or even tail number) and<br />
detailed (up to <strong>air</strong>craft component level) information is incompatible with the ability to<br />
show the safety impacts <strong>of</strong> the aviation system as it develops in the future and to represent<br />
current as well as possible future accident scenarios. From a practical point <strong>of</strong> view it is<br />
also incompatible with the requirement to represent the total aviation system. For instance,<br />
a causal <strong>risk</strong> model to estimate the safety implications <strong>of</strong> Service Bulletins 34 requires<br />
detailed technical representation <strong>of</strong> the <strong>air</strong>craft down to component level. This is no easy<br />
task; it is estimated that a Boeing 747 is made up out <strong>of</strong> six million individual parts [Sutter<br />
& Spencer 2006]. On the other hand, organisational and cultural influences need not be<br />
represented. In the case <strong>of</strong> assessing a new ATM safety concept for instance, the situation is<br />
different. The difficulty for a model in this case is to be sufficiently broad to represent<br />
technical, procedural and managerial changes in all relevant fields. Detail is <strong>of</strong> less<br />
importance because the input parameters, describing the new ATM safety concept, are high<br />
level.<br />
A balance must be found between broadness and detail. Users are not able to define<br />
precisely what they need or want, and there are some differences between the requirements<br />
from the various potential users. But the level <strong>of</strong> detail and broadness <strong>of</strong> the model are also<br />
determined by our knowledge <strong>of</strong> causal influences and the availability <strong>of</strong> data. Human<br />
performance and safety management are subject areas for which both our knowledge and<br />
the availability <strong>of</strong> data is lagging behind our understanding and data accessibility on<br />
performance <strong>of</strong> technical components for both hardware and (to a lesser extent) s<strong>of</strong>tware. A<br />
more elaborate consideration <strong>of</strong> these aspects follows in Chapter 9, but it is already clear<br />
that our knowledge and available data are insufficient to develop a causal <strong>risk</strong> model <strong>of</strong> the<br />
total aviation system that represents very specific (specific to <strong>air</strong>craft type or even tail<br />
number) and detailed (up to <strong>air</strong>craft component level) information.<br />
34<br />
A Service Bulletin is information from the manufacturer describing proposed technical<br />
alterations to the equipment. Implementation <strong>of</strong> these Service Bulletins is not mandatory; it<br />
is up to the <strong>air</strong>line to decide whether the updates are incorporated.<br />
65
Representation <strong>of</strong> regulation<br />
Regulation can be seen as making mandatory some <strong>risk</strong> control measure or some aspect <strong>of</strong><br />
their management. We propose to represent management <strong>of</strong> <strong>risk</strong> control measures explicitly<br />
in the model (see section 9.2), so representation <strong>of</strong> regulation would ‘only’ require adding a<br />
box or node to every measure to represent whether or not it is already mandatory and the<br />
related steps <strong>of</strong> inspection by the regulator for compliance with the regulation and issuing<br />
sanctions against its absence or inadequacy. Although this is a formidable task it is not<br />
undoable. This would then enable identification <strong>of</strong> the quantitative relation between<br />
regulation and aviation safety performance, a relation which is currently not known<br />
[Hansen et al 2005]. However, representation <strong>of</strong> managerial influences in itself is already<br />
one <strong>of</strong> the bottlenecks (see section 9.2) and although we propose solutions to those<br />
bottlenecks it is recommended to focus the efforts first on making these solutions work<br />
without running the <strong>risk</strong> <strong>of</strong> being bogged down in a simultaneous effort to attach the effects<br />
<strong>of</strong> regulation on those managerial influences.<br />
Representation <strong>of</strong> human operators<br />
The dilemma<br />
The requirement to represent the role <strong>of</strong> the human operator is problematic because <strong>of</strong><br />
different views on how to deal with human operators in quantitative safety assessments.<br />
Although certification regulation on <strong>air</strong>craft systems contain quantitative failure probability<br />
requirements and says that regardless <strong>of</strong> the type <strong>of</strong> assessments used, the analysis should<br />
always be accomplished with consideration <strong>of</strong> all relevant factors, including the flight crew,<br />
the current regulatory advisory material on <strong>air</strong>craft system design and analysis (FAA<br />
Advisory Circular AC 25.1309-1A) states that quantitative assessments <strong>of</strong> the probabilities<br />
<strong>of</strong> crew errors are not considered feasible [FAA 1988]. Demonstrating compliance with this<br />
part <strong>of</strong> the regulations is therefore to a large extent done on qualitative criteria. Ultimately<br />
the certification test pilot will then judge on the acceptability <strong>of</strong> a particular system design.<br />
So while quantitative safety assessments are well established in <strong>air</strong>craft system design and<br />
development, as soon as a human operator (such as a pilot) plays a role, the judgment <strong>of</strong><br />
acceptability <strong>of</strong> a design switches from quantitative to qualitative. Tasks are qualitatively<br />
evaluated to determine if the crew can realistically be anticipated to perform them. The<br />
advisory material allows full credit for correct pilot action in response to a system failure,<br />
based on the following guidance:<br />
“When assessing the ability <strong>of</strong> the flight crew to cope with a failure condition, the<br />
warning information and the complexity <strong>of</strong> the required action should be considered<br />
(Paragraph 8g(5) <strong>of</strong> FAA Advisory Circular AC 25.1309-1A). If the evaluation<br />
indicates that a potential failure condition can be alleviated or overcome during the<br />
time available without jeopardising other safety-related flight crew tasks and without<br />
requiring exceptional pilot skill or strength, credit may be taken for correct and<br />
appropriate corrective action, for both qualitative and quantitative assessments.”<br />
So while for <strong>air</strong>craft systems a quantitative safety assessment is required, this is not<br />
considered feasible for assessing the characteristics <strong>of</strong> the combination <strong>of</strong> man and<br />
machine. This relies to a large extent on a qualitative assessment by the certification test<br />
pilot to determine, during a series <strong>of</strong> prescribed test flights, whether the behaviour <strong>of</strong> the<br />
<strong>air</strong>craft and the man-machine interface are acceptable. Requirements for acceptability are<br />
described qualitatively in the certification requirements. Aircraft handling characteristics<br />
are rated on a qualitative scale such as the Cooper - Harper rating scale, see textbox<br />
[Cooper & Harper 1967]. The importance <strong>of</strong> the test pilot is essential, not only for<br />
performing the test flight but also in simulation, in the design or evaluation <strong>of</strong> the flight<br />
66
control system, and test-flight preparation [Thompson 2000]. It is significant that the field<br />
<strong>of</strong> industry that was one <strong>of</strong> the key drivers for the development <strong>of</strong> probabilistic <strong>risk</strong><br />
assessment and quantified safety targets (i.e. <strong>air</strong>craft certification) has always held the<br />
opinion that estimating human error probabilities is not possible even though the nuclear<br />
power industry, which was another key driver, accepts human error probability estimates as<br />
part <strong>of</strong> the certification <strong>of</strong> nuclear power plants. One <strong>of</strong> the reasons for the reluctance <strong>of</strong><br />
<strong>air</strong>craft developers and manufactures to accept quantitative human error techniques is that<br />
they have always had a good alternative in the qualitative assessments by the test pilot.<br />
The Cooper-Harper rating scale<br />
A well-known quantitative method for rating <strong>air</strong>craft handling characteristics is the Cooper<br />
Harper scale [Cooper & Harper 1967]. This utilizes a decision-tree process to guide the user<br />
through a series <strong>of</strong> questions. The answers lead the user to a set <strong>of</strong> three sub alternatives<br />
which ultimately result in a numerical rating from 1 – 10. Cooper and Harper used four<br />
broad categories within which to describe <strong>air</strong>craft handling qualities:<br />
• Uncontrollable: Unsuitable for any task.<br />
• Unacceptable: Not suitable for the task but <strong>air</strong>craft still controllable<br />
• Unsatisfactory but tolerable: adequate for the task but improvement desirable.<br />
• Satisfactory: No improvement required.<br />
The following three questions help the user placing the system into one <strong>of</strong> the four<br />
categories:<br />
• Is the vehicle controllable?<br />
• Is adequate performance attainable?<br />
• Is the system quality satisfactory without improvement?<br />
By separating the main categories into subcategories, a ten-point scale is achieved. The<br />
worst rating is a 10 “Major deficiencies -control will be lost during some portion <strong>of</strong><br />
required operation”, the best possible score is a 1 “Excellent, highly desirable - pilot<br />
compensation is not a factor for desired performance”. The Cooper-Harper rating scale has<br />
become the standard way <strong>of</strong> measuring flying qualities.<br />
Flight testing<br />
The certification test pilot provides an expert opinion on the acceptability <strong>of</strong> a particular<br />
design. He or she will have been given dedicated training, for instance at a test pilot school,<br />
to be able to provide this expert judgement. Rather than being gung-ho heroes who <strong>risk</strong><br />
their lives for the advancement <strong>of</strong> technology, as they are portrayed in Tom Wolfe’s ‘The<br />
right stuff’ and Chuck Yeager’s autobiography [Wolfe 1979, Yeager & Janos 1985], a test<br />
pilot is trained (among other things) to be able to make assessments <strong>of</strong> the implications on<br />
safety <strong>of</strong> particular characteristics or features <strong>of</strong> the <strong>air</strong>craft, based on a limited sample<br />
during a series <strong>of</strong> test flights [Duke 1953, Lithgow 1956, Johnston & Barton 1991]. This<br />
requires knowledge on the <strong>air</strong>craft’s design and systems, aerodynamics, flight mechanics,<br />
stability & control, and the ability to interpret the effect <strong>of</strong> certain characteristics and or<br />
features as displayed during the circumstances <strong>of</strong> the test flight and to assess their<br />
consequences for other potential circumstances. Many test pilots have a degree in<br />
(Aeronautical) Engineering 35 so that they are able to translate a deficiency encountered in<br />
the <strong>air</strong> into precise engineering terminology [Crossfield & Bl<strong>air</strong> 1960]. These<br />
35 A degree in Engineering is one <strong>of</strong> the requirements to get accepted at the USAF Test<br />
Pilot School.<br />
67
characteristics make test pilots very suitable for providing quantified judgements on causal<br />
<strong>risk</strong> model parameters for which other data is lacking, see also section 8.5.5.<br />
During flight testing the flight envelope <strong>of</strong> the <strong>air</strong>craft is explored. Inevitably, when<br />
operating close to the boundaries <strong>of</strong> the flight envelope while these boundaries have not yet<br />
been precisely defined, there is an increased <strong>risk</strong> <strong>of</strong> accidents. This is evident when<br />
examining statistics <strong>of</strong> flight test accidents. In Table 3, fatal flight test accidents <strong>of</strong><br />
commercial <strong>air</strong> <strong>transport</strong> <strong>air</strong>craft are listed. We assume that on average each <strong>air</strong>craft type<br />
will require approximately 1000 test flights for certification [Kingsley-Jones 1997, 2005,<br />
Norris 1988], and that there have been approximately 180 different types <strong>of</strong> large<br />
commercial <strong>air</strong>craft (100 jets, 80 turboprops) since 1960. These <strong>air</strong>craft will have<br />
accumulated a total <strong>of</strong> 180.000 test flights while according to the table there have been 22<br />
fatal flight test accidents. The corresponding accident rate is 1.2 x 10 -4 per flight, which is<br />
approximately 100 times higher compared to the accident rate for commercial flights in the<br />
same time period. Table 3 demonstrates one <strong>of</strong> the reasons why the approach <strong>of</strong>, say, the<br />
nuclear power industry towards certification <strong>of</strong> nuclear installations has to differ from the<br />
approach <strong>of</strong> the aviation industry towards certification <strong>of</strong> <strong>air</strong>craft. A crash <strong>of</strong> a prototype<br />
<strong>air</strong>craft during a test flight would seem to be acceptable to society, a serious accident with a<br />
nuclear powerplant during its certification process clearly is not. The crash <strong>of</strong> the <strong>air</strong>craft<br />
will almost certainly only affect those on-board 36 and for them the <strong>risk</strong> is voluntary, while a<br />
nuclear disaster may also affect a great number <strong>of</strong> people in the vicinity <strong>of</strong> the powerplant<br />
and for them the <strong>risk</strong> is not voluntary. The nuclear power industry has to rely - more than<br />
<strong>air</strong>craft certification- on safety and performance calculation rather than tests, and <strong>risk</strong><br />
assessment methodologies were developed for this purpose. Whereas <strong>air</strong>craft certification<br />
considers quantitative assessments <strong>of</strong> human error probabilities not feasible and partially<br />
relies on the test pilot’s judgement on assessing the ability <strong>of</strong> the flight crew to cope with<br />
certain conditions, the nuclear power industry started development <strong>of</strong> human reliability<br />
methods to be used within a probabilistic <strong>risk</strong> assessment to calculate human error<br />
probabilities. The nuclear power industry does not have the equivalent <strong>of</strong> a test pilot; in the<br />
nuclear power industry there are no ‘test-operators’, trained, qualified and experienced in<br />
taking the plant to the edge <strong>of</strong> the performance envelope to judge whether the plant’s<br />
behaviour is acceptably safe. They cannot do this ‘edge testing’ as the possible<br />
consequence (a core meltdown) is unacceptable. As a matter <strong>of</strong> fact, trained ‘test-operators’<br />
do not exist for any type <strong>of</strong> control room, including ATM control rooms. The requirements<br />
for certification <strong>of</strong> ATM systems indeed explicitly refer to human reliability methods. The<br />
current approach in <strong>risk</strong> assessment and mitigation for Air Traffic Control systems in<br />
Europe, as described in Eurocontrol’s ESARR 4, is based on a quantitative target level <strong>of</strong><br />
safety. This quantitative safety requirement is somewhat similar to the quantitative<br />
requirements for system safety in <strong>air</strong>craft certification. A difference is that the ATM<br />
requirement is not limited to systems, but should address ‘the three different types <strong>of</strong> ATM<br />
elements (human, procedures and equipment), the interactions between these elements and<br />
the interactions between the constituent part under consideration and the remainder <strong>of</strong> the<br />
ATM System’ [Eurocontrol 2001b]. Human error <strong>models</strong> are being proposed that are a<br />
further development <strong>of</strong> the basic concepts and <strong>models</strong> that have primarily been developed<br />
in the nuclear industry (e.g. HERA - predict) [Isaac et al 2004].<br />
36<br />
Predominantly, test flights are deliberately conducted over uninhabited regions.<br />
68
Test pilots<br />
The two decades following World War II (1939-1945) was a period <strong>of</strong> enormous<br />
technological advances. Aircraft were being designed to fly into realms that were<br />
unexplored and not yet well understood [Rotundo 1994]. Almost every <strong>air</strong>craft could fly<br />
faster, further and higher than its predecessor. There was hardly any knowledge to be able<br />
to predict the behaviour <strong>of</strong> the <strong>air</strong>craft, and again the role <strong>of</strong> the test pilot was invaluable.<br />
He was tasked to fly the <strong>air</strong>craft into the unknown flight regimes, observe the <strong>air</strong>craft’s<br />
behaviour, and communicate that information back to the <strong>air</strong>craft design engineers<br />
[Bridgeman & Hazard 1955, Crossfield & Bl<strong>air</strong> 1960, Beaumont 1994].<br />
Figure 11: Test pilot A. Scott Crossfield in the cockpit <strong>of</strong> the Douglas D-588-II after the<br />
first Mach 2 flight (twice the speed <strong>of</strong> sound) on 20 November 1953 (source: NASA Dryden<br />
Flight Research Center).<br />
Requirements for test pilots matured, test pilot schools were established in quick succession<br />
and began providing dedicated training. Typically a test pilot school provides a year-long<br />
curriculum <strong>of</strong> classroom academic, simulator training and flight exercises, with main topics<br />
<strong>of</strong> performance, flying qualities, systems, and test management. Test pilots became<br />
engineers.<br />
69
Table 3: List <strong>of</strong> fatal flight test accidents, 1960-2003, commercial <strong>air</strong> <strong>transport</strong> <strong>air</strong>craft (jets<br />
and turboprops) involving the <strong>air</strong>craft manufacturer. Source: <strong>NLR</strong> Air Safety Database.<br />
DATE AIRCRAFT TYPE LOCATION NUMBER OF<br />
FATALITIES<br />
ACCIDENT<br />
22/10/1963 BAC 1-11 United Kingdom 7 Entered deep stall during stall<br />
testing.<br />
25/02/1965 Ilyushin IL-62 Zhukovsky, 6 Overran runway after<br />
Russia<br />
abandoning the take-<strong>of</strong>f.<br />
12/05/1965 HFB HansaJet Torrejon, Spain 1 Deep stall followed by flat spin.<br />
03/06/1965 Hawker- Siddeley<br />
HS-121 Trident<br />
United Kingdom 4 Deep stall.<br />
14/01/1966 Tupolev Tu-134 Russia 8 Loss <strong>of</strong> control during high speed<br />
maximum rudder deflection.<br />
12/05/1970 Aero Spaceline Edwards AFB, 4 Lost control following simulated<br />
377 Mini Guppy USA<br />
engine failure during take-<strong>of</strong>f.<br />
19/11/1970 IAI Arava Jordan 3 Loss <strong>of</strong> control during flutter test.<br />
23/05/1971 Aérospatiale<br />
SN600 Corvette<br />
Istres, France 3 Failure <strong>of</strong> horizontal stabilizer.<br />
01/02/1972 VFW-614 Bremen,<br />
1 Tab flutter, <strong>air</strong>craft entered<br />
Germany<br />
vertical dive.<br />
31/10/1972 Dassault Falcon France 2 Aft fuselage separated during<br />
10<br />
rudder trim test.<br />
06/07/1977 Let 410 Czechoslovakia 4 Structural failure after rudder<br />
deployment at high speed.<br />
23/05/1978 Tupolev Tu-144 Russia 2 Crash landed after in-flight fire.<br />
03/04/1980 Canad<strong>air</strong> CL-600 Mojave,<br />
1 Stall and loss <strong>of</strong> control during<br />
Challenger California, USA<br />
stall testing.<br />
26/03/1982 Dornier Do-228 Germany 3 Entered steep dive during trim<br />
test.<br />
13/10/1992 Antonov 124 Ukraine 8 Loss <strong>of</strong>f control when nose cargo<br />
door opened at high speed test.<br />
03/02/1993 Lockheed L-100- Marietta,<br />
7 During Vmcg testing inadvertently<br />
20 Hercules Georgia, USA<br />
lifted <strong>of</strong>f below Vmca and spun in.<br />
05/07/1993 Ilyushin IL-114 Ramenskoye, 5 Rapid pitch-up and stall<br />
Russia<br />
immediately after take-<strong>of</strong>f.<br />
26/07/1993 Canad<strong>air</strong> RJ100 USA 3 Entered deep stall during low<br />
speed steady-heading sideslip.<br />
30/06/1994 Airbus A-330 Toulouse,<br />
7 Pitch up and stall during autopilot<br />
France<br />
certification test.<br />
10/02/1995 Antonov 70 Russia 7 Collided with chase <strong>air</strong>craft.<br />
10/10/ 2000 Canad<strong>air</strong> CL-604<br />
Challenger<br />
26/04/ 2003 Sino Swearingen<br />
SJ-30-2<br />
Wichita,<br />
2 Stalled immediately after take-<strong>of</strong>f<br />
Kansas, USA<br />
with aft centre <strong>of</strong> gravity.<br />
USA 1 Aircraft became unstable during<br />
flutter test.<br />
70
The need for a change <strong>of</strong> views<br />
The distinction between which element is part <strong>of</strong> the ATM system and which element is<br />
part <strong>of</strong> the <strong>air</strong>craft is becoming less clear than it was in the past, and this development can<br />
be expected to continue in the future. According to Eurocontrol [2001b], the ATM system<br />
includes both ground-based and <strong>air</strong>borne components. This is consistent with a growing<br />
awareness <strong>of</strong> the need to apply a total systems approach in safety assessments, considering<br />
the complete aviation system rather than its individual components. This will have<br />
implications for the methodologies that have been and are being used for the assessment <strong>of</strong><br />
the safety <strong>of</strong> the components <strong>of</strong> the aviation system. The principle <strong>of</strong> decomposition (which<br />
is one <strong>of</strong> the cornerstones <strong>of</strong> reliability theory) according to which the reliability <strong>of</strong> a<br />
system is the result <strong>of</strong> the reliability <strong>of</strong> its individual components does not necessarily hold<br />
for the integrated system. Accidents that were the results <strong>of</strong> failures in the interfaces <strong>of</strong> the<br />
individual elements <strong>of</strong> the system rather than failures <strong>of</strong> the system themselves, like the<br />
mid-<strong>air</strong> collision above Überlingen, illustrate the importance <strong>of</strong> interfaces [FAA 2002,<br />
Roelen et al 2003, Roelen 2004]. It can therefore be expected that regulatory requirements<br />
will be developed for the integrated aviation system rather than the individual components.<br />
The complexity <strong>of</strong> the matter will discourage the authorities from specifying detailed<br />
requirements. Instead, a target level <strong>of</strong> safety will probably be specified. Quantitative safety<br />
assessment methods such as causal <strong>risk</strong> <strong>models</strong> will have to be applied to demonstrate to<br />
the authorities that these targets have been met. Because the human operator (pilot, <strong>air</strong><br />
traffic controller, etc) still plays a decisive role in the aviation system these quantitative <strong>risk</strong><br />
assessments methods must be able to represent the role <strong>of</strong> the human operator in a way that<br />
is satisfactory for all parties involved.<br />
Inappropriate interface: the Überlingen mid-<strong>air</strong> collision<br />
On July 1, 2002, a Tupolev TU-154M, en-route from Moscow to Barcelona, collided in<br />
mid-<strong>air</strong> with a Boeing 757-200 which was en-route from Bergamo to Brussels. The<br />
collision took place at an altitude <strong>of</strong> 10,800 m above the German city <strong>of</strong> Überlingen. Both<br />
<strong>air</strong>craft crashed after the collision and all people on board (2 in the Boeing and 69 in the<br />
Tupolev) were killed. At the moment <strong>of</strong> the collision ACC Zurich was providing <strong>air</strong> traffic<br />
control to both <strong>air</strong>craft. Due to maintenance activities to the ATC system, the Short Term<br />
Conflict Alert System (STCA) <strong>of</strong> ACC Zurich was not operational. The Air Traffic<br />
Controller initially failed to observe that the <strong>air</strong>craft were on collision course. The Traffic<br />
Alert and Collision Avoidance System (TCAS) in both <strong>air</strong>craft operated as designed; the<br />
TCAS in the Boeing alerted the crew to ‘descend’ and the TCAS in the Tupolev alerted the<br />
crew to ‘climb’. At the same time, the <strong>air</strong> traffic controller noticed the conflict and<br />
instructed the Tupolev to descend. Subsequently the Boeing’s TCAS provided an ‘increase<br />
descent’ alert while the Tupolev’s TCAS provided an ‘increase climb’ alert. The crew <strong>of</strong><br />
the Boeing followed their TCAS alerts and started to descend. The crew <strong>of</strong> the Tupolev,<br />
confronted with conflicting instructions, decided to comply with the Air Traffic<br />
Controller’s instruction to descend rather than following the TCAS instruction to climb.<br />
The collision occurred 50 seconds after the first TCAS advisory. In the subsequent accident<br />
investigation, the German <strong>air</strong> accident investigation board BFU concluded that one <strong>of</strong> the<br />
‘systemic’ causes <strong>of</strong> the accident was the insufficient integration <strong>of</strong> TCAS in the aviation<br />
system [BFU 2004]. This allowed a situation where a flight crew was confronted with<br />
contradictory instructions.<br />
71
4.5. User expectations: lessons from CATS<br />
This section addresses some issues specifically arising from CATS (Appendix C). These<br />
are used here to illustrate the problems <strong>of</strong> defining user needs and <strong>of</strong> trying to reconcile<br />
incompatible needs.<br />
On a general level, three expectations regarding the function <strong>of</strong> the causal <strong>risk</strong> model being<br />
developed for the CATS project have been indicated [De Jong 2006]:<br />
• The model should provide understanding how safety depends on different<br />
elements <strong>of</strong> the current operation. With this understanding, it should be able to<br />
indicate the big <strong>risk</strong>s, strong and weak areas and provide strategic directions for<br />
safety improvements and safety research.<br />
• The model should be used as a monitoring/ evaluation tool.<br />
• The model should be able to determine the safety effects <strong>of</strong> future changes in the<br />
aviation system or subsystem, thereby supporting decision making and policy<br />
development.<br />
During a series <strong>of</strong> interviews with potential users <strong>of</strong> a causal <strong>risk</strong> model [De Jong 2006], it<br />
was recognised that changes in one part <strong>of</strong> the aviation system may have effects at a very<br />
different place in the system. A causal <strong>risk</strong> model should be able to find such effects. The<br />
model should not only tell what happens with safety when changes are made to the<br />
operation itself, but also to its development, management and environment. The <strong>risk</strong> results<br />
<strong>of</strong> a causal <strong>risk</strong> model should to some extent be quantified, for instance by means <strong>of</strong><br />
expected accident probabilities, although it is recognised that quantification may not always<br />
be feasible, and qualitative answers may be sufficient. Such results can be used to verify<br />
conformance to target levels <strong>of</strong> safety, for the overall system or parts <strong>of</strong> it. Reliability <strong>of</strong> the<br />
results <strong>of</strong> the model is crucial; indications <strong>of</strong> the reliability should be given. The results<br />
need to be understandable to the users – the model should not be a black box. This is not<br />
the same as merely confirming what people thought they knew already. Reliable and<br />
understandable results are necessary for confidence in the model. A causal <strong>risk</strong> model<br />
should identify where the big <strong>risk</strong>s are and what are causes and contributes to the <strong>risk</strong>. It<br />
should indicate possible solution areas to help the right organisations (the <strong>risk</strong> owners, also<br />
to be identified by the model) to solve the problem. A causal <strong>risk</strong> model was perceived by<br />
the interviewees as a tool for strategic changes for which time is usually not critical; there<br />
are usually at least months available. In summary, the users were <strong>of</strong> the opinion that the<br />
model should (also) be able to study the effects <strong>of</strong> changes behind the direct operation, such<br />
as development, management and environment. Risk results should be quantified (to some<br />
extent), reliable (or have well-defined reliability) and understandable (the model should not<br />
be a black box) in order to have confidence in the model. The results <strong>of</strong> the model should<br />
help to identify possible solutions areas.<br />
A second series <strong>of</strong> interviews with potential users <strong>of</strong> a causal <strong>risk</strong> model [De Jong 2007]<br />
was felt to be necessary because the results <strong>of</strong> the first round did not yet provide a clear and<br />
sufficiently detailed set <strong>of</strong> requirements. However, the second round revealed even more<br />
how difficult it was for many users to define how and when a causal <strong>risk</strong> model should be<br />
used, other than in the most general terms. The expression ‘causal <strong>risk</strong> model’ is too<br />
generic and open to interpretation, depending on a person’s own terminology and<br />
understanding <strong>of</strong> the subject. Furthermore, because a comprehensive causal <strong>risk</strong> model for<br />
aviation had not been developed at the time <strong>of</strong> the interviews, it was difficult for users to<br />
envision how such a model should actually be used to help them in making decisions<br />
related to safety, particularly since ‘safety’ itself is such an intangible concept. Under these<br />
conditions, it are the model developers who should provide guidance on possible model<br />
72
performance. Several alternative uses should be presented, including the consequences <strong>of</strong><br />
selecting a particular choice. Model developers should not shy away from a conclusion that<br />
some requirements may be incompatible, but should be explicit about this.<br />
The required level <strong>of</strong> detail <strong>of</strong> a causal <strong>risk</strong> model depends on the type <strong>of</strong> user. Local users,<br />
such as individual <strong>air</strong>lines (e.g. KLM) or <strong>air</strong>port authorities (e.g. Heathrow <strong>air</strong>port), need<br />
<strong>models</strong> that accurately describe their specific local situation, both in the causal structure as<br />
well as in the quantification. General users, such as international authorities (e.g. EASA)<br />
and trade organisations (e.g. IATA) need <strong>models</strong> that accurate describe the general<br />
situation. The <strong>models</strong> for local users should be relatively narrow in scope and deep in<br />
detail, while <strong>models</strong> for general users should be relatively broad in scope and shallow in<br />
detail. There is a difference in dynamics and consequently in required accuracy as well.<br />
Local users have operational and tactical questions, their decisions have immediate effect,<br />
and long term for an <strong>air</strong>line means 2-5 years. General users have tactical and strategic<br />
questions, the effect <strong>of</strong> decisions may take decades to materialise. Developing a model<br />
which can help answer local operational questions as well as general strategic questions is<br />
practically unfeasible. It would require a ‘broad and deep’ model and consequently a very<br />
substantial development effort. If the purpose <strong>of</strong> the model is not clear at the beginning <strong>of</strong><br />
the development effort, progress will continue to be frustrated by the ambition to represent<br />
detail as well as broadness. Eurocontrol’s Integrated Risk Picture (IRP) [Perrin et al 2006,<br />
Kirwan 2007] is an example <strong>of</strong> a model which was from the outset aimed at providing<br />
higher level strategic insights. For the CATS model <strong>of</strong> the Dutch Ministry <strong>of</strong> Transport and<br />
Water Management (see Appendix C) the objective was not so clearly defined but was<br />
considered to be part <strong>of</strong> the research question. It was decided that the model should give a<br />
global picture <strong>of</strong> the <strong>risk</strong>s involved in commercial fixed wing aviation from gate to gate,<br />
including aerodrome operations, ATS operations, <strong>air</strong>craft operations in all flight phases for<br />
all <strong>air</strong>craft involved. The model should also reflect the <strong>risk</strong>s deriving from <strong>air</strong>craft design<br />
and maintenance. Simultaneously, the model should be ‘as detailed as possible’ [Ale 2007].<br />
Interviews with projected users resulted in the requirement to support the authority and the<br />
sector parties and to be sufficiently simple to be understood by the general public [De Jong<br />
2007]. It was even suggested at the CATS website (www.verkeerenwaterstaat.nl/causaal<br />
model) to use the model to determine the causes <strong>of</strong> individual incidents. The CATS model<br />
was developed top-down (i.e. from the generic to the specific), and because users were not<br />
really aware <strong>of</strong> what to expect they were sometimes frustrated that their urgent operational<br />
problems (like an increase in overspeed warnings on the Boeing 777 fleet <strong>of</strong> a particular<br />
<strong>air</strong>line, fluctuations in bird strike incidents at Schiphol <strong>air</strong>port) were not immediately<br />
recognisable in the model while this was being developed. Such frustrations are potentially<br />
harmful as they can cause members <strong>of</strong> the aviation industry to suspend their support for<br />
model development. Support from the industry is essential for the provision <strong>of</strong> data and to<br />
provide insight, to the model developers, into operational aviation processes.<br />
The user <strong>of</strong> the model should be able to relate daily operational practice and decision<br />
making to the elements in the model or the model representation. The model developers<br />
should therefore have sufficient knowledge <strong>of</strong>- or insight into those operational practises<br />
and decisions. For a successful and workable model, the developers <strong>of</strong> the model<br />
themselves should have sufficient knowledge <strong>of</strong> the aviation system and its processes and<br />
at the same time ascertain the scientific and mathematical correctness.<br />
Feedback from the modellers to the potential users is required to get a better grip on user<br />
requirements. The modellers should indicate possibilities and limitations <strong>of</strong> the model, and<br />
should come-up with real-life examples <strong>of</strong> cases in which a causal <strong>risk</strong> model would be a<br />
73
helpful tool. This will have to be an iterative process. The following possibilities and<br />
limitations are apparent from experience in CATS and during the development <strong>of</strong> a causal<br />
<strong>risk</strong> model for the FAA:<br />
• One single model cannot be used to answer each question <strong>of</strong> every possible user.<br />
Depending <strong>of</strong> the problem at hand, some parts <strong>of</strong> the model may have to be<br />
developed further in order to answer the question.<br />
• Modelling involves numerous assumptions. In case the assumptions do not hold,<br />
the model cannot be used without taking the assumptions into account.<br />
• A causal <strong>risk</strong> model should not be used as the sole input for assessing compliance<br />
with regulation unless the model and its use are agreed upon by the relevant<br />
stakeholders 37 .<br />
• A causal <strong>risk</strong> model is intended for use by pr<strong>of</strong>essionals within the aviation<br />
industry. It is not suitable as an instrument for safety communication from the<br />
government to the general public.<br />
• A system-wide causal <strong>risk</strong> model is suitable to support decision making at the<br />
strategic level. It is not useful at the level <strong>of</strong> day-to-day operations because this<br />
almost invariably involves very specific situations which cannot be represented<br />
correctly in a causal <strong>risk</strong> model. This is not a fundamental limitation <strong>of</strong> a causal<br />
<strong>risk</strong> model but a practical limitation, depending on time and money available for<br />
model development.<br />
• A strength <strong>of</strong> a causal <strong>risk</strong> model is that it assembles information from different<br />
disciplines. It is therefore specifically suitable to support decision making for<br />
situations involving multiple actors or disciplines.<br />
• A strength <strong>of</strong> a causal <strong>risk</strong> model is that it assembles current knowledge.<br />
• The case for which a causal <strong>risk</strong> model is used should be defined at the proper<br />
level <strong>of</strong> detail. The model cannot be estimated to assess for example the safety<br />
impact <strong>of</strong> the introduction <strong>of</strong> uninhabited areal vehicles (UAVs) in commercial<br />
<strong>air</strong>space unless we define where and when this introduction will take place, and<br />
the operating procedures, performance characteristics, on-board equipment and<br />
other relevant information <strong>of</strong> those UAVs.<br />
Obtaining valuable user requirements demands that the users are not distrustful towards the<br />
model. Due to the fierce competition in aviation, industry parties are paranoid about<br />
everything that even has a remote chance <strong>of</strong> disturbing the ‘level playing field’.<br />
Historically, many <strong>risk</strong> analysis have been performed to demonstrate that an installation,<br />
<strong>air</strong>craft or spacecraft conforms to requirements [Bedford & Cooke 2001]. The industry’s<br />
natural reaction to proposals that may potentially be restricting is to resist. For that reason<br />
they tend to resist changes <strong>of</strong> the instruments <strong>of</strong> the authorities for regulatory compliance<br />
assessment. Modellers should therefore emphasise the possibility <strong>of</strong> using a causal <strong>risk</strong><br />
model as input to the decision making process instead <strong>of</strong> using the model for strictly<br />
assessing compliance with regulation 38 .<br />
4.6. Conclusions for this section<br />
User requirements for a causal <strong>risk</strong> model have been derived in various ways, starting from<br />
a description how aviation has realised tremendous safety improvements since the first<br />
commercial <strong>air</strong>lines started operations, improvements that were the result <strong>of</strong> technological<br />
37<br />
This is a policy choice, not an inherent limitation <strong>of</strong> a causal <strong>risk</strong> model.<br />
38<br />
The use <strong>of</strong> the model is not a decision that the modellers must make, but what they can<br />
do is warn against possible consequences.<br />
74
advances and the systematic analysis <strong>of</strong> accidents. Because <strong>of</strong> the very success <strong>of</strong> aviation<br />
safety, the fix and fly approach is no longer effective on its own. To maintain and improve<br />
the current level <strong>of</strong> safety, there is need for an aviation safety performance evaluation<br />
methodology that is not based on fatal accidents and hull losses alone. While accidents are<br />
rare events, the consequences <strong>of</strong> an accident can be enormous for the <strong>air</strong>line, the <strong>air</strong>craft<br />
manufacturer, the <strong>air</strong> navigation service provider and society. Accident prevention and<br />
safety management is therefore as important as ever, but due to the rarity <strong>of</strong> accidents it<br />
becomes more and more difficult to understand the ‘current state <strong>of</strong> aff<strong>air</strong>s’ and to<br />
determine what the effects <strong>of</strong> changes are on the level <strong>of</strong> safety. There are simply too few<br />
‘data points’. Aviation is a competitive environment, and the investments are <strong>of</strong>ten huge.<br />
Any proposed safety improvement measure must be well-reasoned. Therefore an integrated<br />
safety assessment methodology is needed. For the industry, an important characteristic <strong>of</strong><br />
such method will be the ability to compare projected costs to estimated benefits, in terms <strong>of</strong><br />
increased safety, <strong>of</strong> particular decisions. For the regulator, reproducibility <strong>of</strong> the results is<br />
crucial if the method is destined to be part <strong>of</strong> regulation, and transparency is an important<br />
feature for communication regarding the model and model results. For both the regulator<br />
and the industry it is important to be able to feed the model with data that is currently being<br />
gathered in various occurrence reporting systems.<br />
The increased integration, automation and complexity <strong>of</strong> the aviation system, including<br />
integration <strong>of</strong> ground-based and <strong>air</strong>borne systems, will lead to new regulatory requirements.<br />
The complexity <strong>of</strong> the matter will discourage authorities from specifying detailed<br />
requirements. Instead, quantitative targets will be specified. There is a growing awareness<br />
<strong>of</strong> the need to apply a total systems approach in safety assessments, considering the<br />
complete aviation system rather than the individual components. Quantitative safety<br />
assessment methods such as causal <strong>risk</strong> <strong>models</strong> will have to be applied to demonstrate to<br />
the authorities that the requirements have been met. Because the human operator (pilot, <strong>air</strong><br />
traffic controller) plays a decisive role in the aviation system, these quantitative safety<br />
assessment methods must be able to satisfactory represent the human operator. Up to now,<br />
the opinion in regulatory requirements for <strong>air</strong>craft system safety assessments has always<br />
been that assessing the probability <strong>of</strong> human error is not feasible. This opinion is<br />
contradicted by the use <strong>of</strong> 2 nd and 3 rd generation human reliability methods in the nuclear<br />
power industry (see also section 9.1). Historically, there has never been a real necessity for<br />
such estimation because <strong>air</strong>craft system safety assessments relied on the opinion <strong>of</strong> the<br />
certification test pilot, who is specifically trained to provide such judgements. This opinion<br />
could be a major obstacle in the development and implementation <strong>of</strong> causal <strong>risk</strong> <strong>models</strong>. As<br />
long as this view is maintained it is rather unlikely that a truly integrated quantitative<br />
aviation safety assessment can be conducted. Given the experience with human reliability<br />
methods in the nuclear power industry and the need for integrated assessments it becomes<br />
unlikely that <strong>air</strong>craft certification can afford to maintain its view on the lack <strong>of</strong> feasibility <strong>of</strong><br />
estimating human error probabilities. Representation <strong>of</strong> human operators in quantitative<br />
<strong>models</strong> is further discussed in section 9.1.<br />
This need for quantitative safety assessment methods is explicitly voiced by safety<br />
regulators. FAA, EASA, Eurocontrol and the Dutch Ministry <strong>of</strong> Transport have all<br />
expressed the need for a causal <strong>risk</strong> model. There are differences though. The FAA calls for<br />
the development <strong>of</strong> a method for a probabilistic evaluation <strong>of</strong> <strong>risk</strong> associated with hazards<br />
in the area <strong>of</strong> operational functions and procedures, if possible extended with hazards and<br />
<strong>risk</strong> in other areas <strong>of</strong> the aviation system such as <strong>air</strong>craft and equipment malfunctions,<br />
hazards due to organisational set-up, human errors, environmental hazards (wind,<br />
turbulence, terrain) and contributory hazards (regulatory, economy). A specific requirement<br />
75
is to have a top-level representation as the user interface for performing <strong>risk</strong> analysis. The<br />
European regulator EASA is specifically looking for a methodology to quantify the safety<br />
effects <strong>of</strong> proposed regulatory changes in terms <strong>of</strong> accident probability and severity. The<br />
Dutch Ministry <strong>of</strong> Transport and Water Management also sees a role for causal <strong>risk</strong> <strong>models</strong><br />
in the regulation <strong>of</strong> third party <strong>risk</strong>. Additionally, the Ministry believes that a causal <strong>risk</strong><br />
model can be used for communication with citizens, to provide insight in how various<br />
components interact and influence aviation safety. Eurocontrol has mandated the use <strong>of</strong><br />
quantitative safety assessments <strong>of</strong> significant changes in the ATM system to demonstrate<br />
that the probability <strong>of</strong> ATM directly contributing to accidents is less than 1.55 x 10 -8 per<br />
flight hour. Eurocontrol also emphasises the development <strong>of</strong> safety monitoring and data<br />
collection mechanisms. The rationale is that any model used in <strong>risk</strong> assessment must be<br />
validated, and real data could contribute significantly to this validation process. With the<br />
exception <strong>of</strong> the requirement to use the model for communication with citizens, the<br />
different viewpoints <strong>of</strong> the regulators are not necessarily incompatible, but the modellers<br />
should be aware <strong>of</strong> them and should make choices, because it will be difficult to develop a<br />
model that meets all needs simultaneously.<br />
The industry (<strong>air</strong>craft manufacturers, <strong>air</strong>lines, ANSPs, <strong>air</strong>ports) has not explicitly expressed<br />
a need for a causal <strong>risk</strong> model. Perhaps there is a link with a fear that such a model might<br />
upset the level playing field. That does not mean that such a model could not be useful for<br />
them. Modellers should emphasise the possibility <strong>of</strong> using a causal <strong>risk</strong> model as input to<br />
the decision making process instead <strong>of</strong> strictly using it for assessing compliance with<br />
regulations. A feature that would make such <strong>models</strong> attractive for them is the ability to<br />
perform cost benefit analysis. Some <strong>of</strong> potential industry applications may require very<br />
detailed <strong>models</strong> however, that describe the <strong>air</strong>craft down to component level.<br />
A detailed set <strong>of</strong> requirements for a causal <strong>risk</strong> model was defined (see section 4.4). Some<br />
<strong>of</strong> these requirements proved to be problematic because they are incompatible with other<br />
requirements and could not be maintained. The remaining requirements can be grouped<br />
under the following high level headings:<br />
• Integrated, to represent the complexity <strong>of</strong> the aviation system and its many<br />
interdependencies, including the human operators and organisations.<br />
• Quantitative; to demonstrate to authorities that quantitative requirements have<br />
been met.<br />
• Transparent and clear, to provide insight and for communication purposes. What is<br />
transparent depends on the user.<br />
• Model is validated and turns out reproducible results, required if the results are<br />
being used in a certification process.<br />
• Able to represent current and future accident scenarios.<br />
The requirement for transparency requires a choice to be made between educating the user<br />
and keeping the model or model representation simple. The detailed requirement to use<br />
laymen terminology can be met if the model representation and accessibility is adapted to<br />
the user. This will require a different user interface for each user group. The requirement to<br />
capture very specific information and the requirement to represent regulation cannot be met<br />
at present. The requirement to represent the human operator, while problematic, should be<br />
maintained.<br />
User requirements demand a quantitative and transparent causal <strong>risk</strong> model that should be<br />
able to represent environmental and managerial influences. The results <strong>of</strong> the model should<br />
76
e reliable, and the model should be useable to indicate possible solution areas for further<br />
safety improvement. The variety <strong>of</strong> users and diversity in the users’ questions make it<br />
impossible to develop a causal <strong>risk</strong> model that is capable <strong>of</strong> answering all needs<br />
simultaneously. The requirements call for a system-wide representation <strong>of</strong> <strong>air</strong> <strong>transport</strong>.<br />
Such a model is not suitable to answer very specific questions. This limitation should be<br />
explained to the aviation community to avoid the creation <strong>of</strong> false expectations. This is<br />
particularly relevant in view <strong>of</strong> the fact that most <strong>of</strong> the expected users only have a vague<br />
picture <strong>of</strong> what a causal <strong>risk</strong> model is and how it could or should be used. It should also be<br />
verified, for each kind <strong>of</strong> user, that the causal <strong>risk</strong> model definition as adopted in this thesis,<br />
is suitable for them.<br />
Due to the diversity <strong>of</strong> possible users and the limited view they currently have on the use <strong>of</strong><br />
causal <strong>risk</strong>s <strong>models</strong>, significant works remains to be done on the systematic identification<br />
<strong>of</strong> user needs. Feedback from the modellers to the potential users is required to get a better<br />
grip on user requirements. The modellers should indicate possibilities and limitations <strong>of</strong> the<br />
model, and should come-up with real-life examples <strong>of</strong> cases in which a causal <strong>risk</strong> model<br />
would be a helpful tool. This will have to be an iterative process.<br />
Support from the industry is essential for the provision <strong>of</strong> data and to provide insight, to the<br />
model developers, into operational aviation processes.<br />
77
Chapter 5. Examples <strong>of</strong> aviation safety analyses<br />
There is no binding reason why safety assessment or safety analyses should involve<br />
quantitative causal <strong>risk</strong> <strong>models</strong>. There are other constructs that can be used for assessing or<br />
analysing safety as well and these methods can be seen as alternatives to causal <strong>risk</strong><br />
<strong>models</strong>. This section will discuss some examples <strong>of</strong> methods that are currently used for<br />
aviation safety assessment and management, and compare those to the requirements and<br />
needs identified in the previous chapter to determine whether the use <strong>of</strong> such alternative<br />
methods is sufficient to bring about the required safety improvements or fulfil future needs.<br />
The examples were selected on the basis that they represent questions pertaining to actual<br />
safety issues for which a stakeholder needed an answer. They are considered typical for the<br />
type <strong>of</strong> approaches being used. The aim here is to provide a representative, albeit not<br />
exhaustive, overview <strong>of</strong> methods to determine if current approaches to safety assessment<br />
and analysis meet the criteria (transparency, reproducibility, etc) and answer the practical<br />
questions <strong>of</strong> the stakeholders. Because the methods described in this chapter can be seen as<br />
alternatives to a causal <strong>risk</strong> model, the examples described here will then help to further<br />
specify the requirements for a causal <strong>risk</strong> model by indicating what they do not have which<br />
such a causal model should have.<br />
5.1. Safety <strong>of</strong> mixed VFR/IFR <strong>air</strong> traffic at Geneva Airport<br />
Background<br />
Geneva International Airport operates two parallel runways, one long concrete runway and<br />
a shorter grass strip. The concrete runway is used predominantly by heavy <strong>air</strong>craft flying<br />
under Instrument Flight Rules (IFR), and the grass strip is restricted to small single-engine<br />
<strong>air</strong>craft operating under Visual Flight Rules (VFR). The lateral spacing between the two<br />
runways is 250 metres, qualifying them, according to ICAO [2004a], as closely spaced<br />
parallel runways with regards to wake turbulence separation minima. Mixed streams <strong>of</strong><br />
heavy and light <strong>air</strong>craft during simultaneous closely spaced arrivals and departures, in<br />
particular at a busy international <strong>air</strong>port such as Geneva, require specific attention to assure<br />
the safety <strong>of</strong> such operations.<br />
The research question<br />
Because <strong>of</strong> growing traffic volumes, the question arose whether the existing mix <strong>of</strong> light<br />
<strong>air</strong>craft and commercial traffic could still be regarded as compatible and safe, now and in<br />
the future. It was beyond the scope to aspire to reach the completeness <strong>of</strong> a full safety<br />
assessment.<br />
The research approach<br />
To answer the research question three lines <strong>of</strong> activity were carried out. The first was an<br />
assessment <strong>of</strong> whether the existing mixed VFR/IFR operations were in compliance with the<br />
applicable rules and regulations. The second concerned an evaluation <strong>of</strong> safety management<br />
practices and organisation at the <strong>air</strong>port. The third line <strong>of</strong> approach comprised a hazard<br />
assessment <strong>of</strong> the mixed VFR/IFR operation at Geneva <strong>air</strong>port. These activities included<br />
structured interviews with representatives <strong>of</strong> the <strong>air</strong>port, local Air Traffic Control unit and<br />
representatives <strong>of</strong> people living near the <strong>air</strong>port. A structured brainstorm was also held,<br />
involving a panel <strong>of</strong> eight operational experts and three <strong>risk</strong> management specialists. This<br />
78
information was completed by supporting data and analysis, including an analysis <strong>of</strong><br />
<strong>air</strong>craft trajectories and meteorological conditions at Geneva <strong>air</strong>port [Van der Geest et al<br />
2005].<br />
Discussion<br />
In this study, the question as to whether the system was sufficiently safe was not answered<br />
by deriving the level <strong>of</strong> safety and comparing it to pre-defined criteria. Instead, the system<br />
was analysed by comparing the existing situation to best practice and common sense. Such<br />
an approach is only realistically feasible when conducted by individuals who themselves<br />
are subject matter experts and cover the full scope that is relevant. The study looked at<br />
separate system elements and their interconnections. Although the nature <strong>of</strong> the issue itself<br />
(mix <strong>of</strong> VFR and IFR traffic) is an integration issue, there was no systematic way <strong>of</strong><br />
addressing dependencies between system elements. All results <strong>of</strong> the study were<br />
qualitative. This was sufficient to answer the research question and not necessarily a<br />
characteristic <strong>of</strong> the research approach. No specific data gathering was required for the<br />
study, although some radar track data were analysed to obtain a detailed picture <strong>of</strong> the<br />
situation at the <strong>air</strong>port. This data had been collected by the <strong>air</strong>port to answer a question not<br />
directly related to this study, but came in handy. All conclusions and recommendations<br />
were based on argumentation. As a result the report may appear transparent, but the results<br />
were partially based on the outcome <strong>of</strong> a brainstorm session and because <strong>of</strong> that the<br />
reproducibility is questionable and the method is not fully transparent.<br />
5.2. Safety assessment <strong>of</strong> parallel approaches at Helsinki-Vantaa Airport<br />
Background<br />
To increase <strong>air</strong>port capacity, Helsinki Vantaa <strong>air</strong>port considered a switch from dependent<br />
parallel approaches to using independent parallel approaches on the two parallel runways<br />
04L/22R and 04R/22L. The new parallel approach procedures would enable <strong>air</strong>craft to land<br />
simultaneously on both runways.<br />
The research question<br />
According to Eurocontrol requirements, particularly ESARR 4, a safety assessment <strong>of</strong> the<br />
proposed procedures had to be carried out before implementation <strong>of</strong> the procedures could<br />
be approved.<br />
The research approach<br />
The safety assessment was executed according to the Eurocontrol Safety Assessment<br />
Methodology or SAM [Eurocontrol 2006a], which prescribes the following three steps:<br />
Functional Hazard Assessment (FHA), Preliminary System Safety Assessment (PSSA) and<br />
System Safety Assessment. The results <strong>of</strong> the first two steps for the independent parallel<br />
approaches at Helsinki <strong>air</strong>port are described in Eurocontrol’s safety assessment report on<br />
independent approaches to parallel instrument runways at Helsinki-Vantaa <strong>air</strong>port<br />
[Eurocontrol 2006b].<br />
Discussion<br />
Hazards were identified in this study by means <strong>of</strong> brainstorming and a functional analysis.<br />
The objective <strong>of</strong> the PSSA was then to derive a set <strong>of</strong> requirements that would mitigate the<br />
effects <strong>of</strong> the hazards identified in the FHA. The likelihood <strong>of</strong> the hazards was not<br />
estimated, but there was a qualitative estimate <strong>of</strong> the possible effect <strong>of</strong> the hazard in terms<br />
<strong>of</strong> a severity class. Because the analysis results were partially based on the outcome <strong>of</strong> a<br />
brainstorming session, the reproducibility <strong>of</strong> the results is questionable and the method is<br />
not fully transparent. There was no explicit attention to possible interdependencies and<br />
79
therefore the approach cannot be considered integrated. As a matter <strong>of</strong> fact, because the<br />
results were largely based on a functional analysis, there is a significant <strong>risk</strong> that ‘non<br />
functional’ hazards, like violations, were overlooked [De Jong 2004]. To develop<br />
mitigation measures, fault trees were created to identify causes <strong>of</strong> hazards, and event trees<br />
were developed to identify possible consequences <strong>of</strong> the hazards. These fault trees and<br />
event trees were developed specifically for this study and were not based on existing<br />
<strong>models</strong>.<br />
5.3. Safety assessment <strong>of</strong> <strong>of</strong>fset steep approaches at Lugano Airport<br />
Background<br />
The <strong>air</strong>port <strong>of</strong> Lugano, Switzerland, is situated in mountainous terrain. In 2006 one <strong>of</strong> the<br />
instrument approach possibilities used a glide path angle <strong>of</strong> 6.65 degrees. It was expected<br />
that future use <strong>of</strong> this approach would not be accepted by the Swiss regulatory authority<br />
unless <strong>air</strong>craft were to be certified for such a steep approach. This would severely limit the<br />
number <strong>of</strong> <strong>air</strong>craft types that can use Lugano Airport commercially. To counter the effect <strong>of</strong><br />
this measure the <strong>air</strong>port developed an alternative approach with a glide angle <strong>of</strong> 5.5<br />
degrees. This approach procedure was submitted to the regulatory authority (the Federal<br />
Office for Civil Aviation - FOCA).<br />
The research question<br />
FOCA responded by indicating a number <strong>of</strong> concerns regarding the procedure and<br />
requested Lugano Airport to conduct an Aeronautical Study to analyse and evaluate the<br />
<strong>risk</strong>s <strong>of</strong> the new procedure and to propose, if necessary, possible mitigating measures or<br />
alternative solutions. The National Aerospace Laboratory <strong>NLR</strong> was contracted by the<br />
<strong>air</strong>port to perform such an Aeronautical Study.<br />
Research approach<br />
The study included an assessment <strong>of</strong> the flight operational and flight safety <strong>risk</strong>s related to<br />
the introduction <strong>of</strong> the draft procedure. This was a qualitative safety assessment based on<br />
inputs from operational experts, databases and other sources for estimates <strong>of</strong> severities and<br />
frequencies rather than mathematical modelling and simulation. Operational safety experts<br />
were <strong>NLR</strong> safety experts and operational experts from Lugano <strong>air</strong>port, ATC and pilots with<br />
flying experience at Lugano. The safety assessment method was scenario-based; safety<br />
issues were analysed in the context <strong>of</strong> accident scenarios rather than in the context <strong>of</strong><br />
individual hazards. These scenarios are bundles <strong>of</strong> event sequences, each centred on a<br />
central hazardous situation, including the possible causes and the possible consequences <strong>of</strong><br />
that situation. Severity and likelihood <strong>of</strong> event sequences were estimated by experts, using<br />
qualitative rating scales: hazardous, major, minor and no significant safety effect for<br />
severity; probable, remote, extremely remote and extremely improbable for likelihood<br />
[Wever et al 2006].<br />
Discussion<br />
The study addressed several different accident scenarios and as such was not focussed on a<br />
single system element. The approach was not fully integrated because interdependencies<br />
between system elements were not explicitly addressed. Some interdependencies will have<br />
been implicitly accounted for by the experts during the analysis. The results <strong>of</strong> the study<br />
were qualitative. Probabilities <strong>of</strong> occurrence <strong>of</strong> events were subjectively estimated by<br />
experts and expressed semi-quantitatively, using terms like ‘remote’. No other data analysis<br />
was conducted and hence there was no need to collect data as part <strong>of</strong> the study. A classic<br />
<strong>risk</strong> matrix, combining likelihood and severity <strong>of</strong> the event, was used to illustrate<br />
acceptability <strong>of</strong> the <strong>risk</strong>. Because the results <strong>of</strong> the study were primarily a product <strong>of</strong><br />
80
ainstorm sessions, the overall result <strong>of</strong> the study depended on the subjective opinion <strong>of</strong><br />
the experts involved. The process was not fully transparent, because it was not completely<br />
traceable what the expert’s opinions were based on. Reproducibility <strong>of</strong> the results is<br />
questionable, as different experts may have had different opinions and arrived at different<br />
conclusions.<br />
5.4. Reduced vertical separation minimum in Europe<br />
Background<br />
On 24 January 2002 the introduction <strong>of</strong> a Reduced Vertical Separation Minimum (RVSM)<br />
in European <strong>air</strong>space created six additional flight levels between 29,000 ft and 41,000 ft.<br />
This was achieved by reducing the vertical separation minimum between <strong>air</strong>craft from<br />
2,000 ft to 1,000 ft. RVSM was implemented simultaneously in the <strong>air</strong>space <strong>of</strong> 42<br />
European and North African countries and was the biggest change in Europe’s <strong>air</strong>space in<br />
50 years [Tiemeyer 2003].<br />
Research question<br />
It had to be demonstrated to the international aviation community that the Target Level <strong>of</strong><br />
Safety set out by ICAO for the vertical collision <strong>risk</strong> would not be exceeded in the<br />
European RVSM <strong>air</strong>space. During the initiation <strong>of</strong> the RVSM program, it was felt by<br />
Eurocontrol that to demonstrate the achievement <strong>of</strong> ICAO’s collision <strong>risk</strong> criterion would<br />
be viewed as necessary but not sufficient. For instance, there was the question whether the<br />
‘switch over’ to RVSM would cause additional hazards to the ongoing <strong>air</strong> traffic 39<br />
[Tiemeyer 2003]. Therefore a RVSM safety policy was developed, and a preimplementation<br />
safety case was conducted to assure that (i) all identified hazards and <strong>risk</strong>s<br />
were managed and mitigated, (ii) the collision <strong>risk</strong> met the ICAO Target Level <strong>of</strong> Safety<br />
and (iii) States showed that they would safely implement RVSM through the development<br />
<strong>of</strong> national safety documentation [Eurocontrol 2001a]. Consequently, the three main<br />
deliverables <strong>of</strong> the RVSM Safety activities were a functional hazard assessment, a collision<br />
<strong>risk</strong> assessment and national safety plans.<br />
Research approach<br />
Only the functional hazard assessment and the collision <strong>risk</strong> assessment will be discussed<br />
here. The functional hazard assessment was conducted as a series <strong>of</strong> brainstorming sessions<br />
to identify and classify all potential hazards. Operational experts participating in the<br />
sessions were pilots and <strong>air</strong> traffic controllers. In addition to the operational experts,<br />
representatives from the RVSM Program were present at the sessions. Each listed hazard<br />
was then classified according to severity and probability. Both severity and probability<br />
were subjectively estimated by the experts.<br />
For collision <strong>risk</strong>, two specific safety targets have been defined by ICAO, a Target Level <strong>of</strong><br />
Safety (TLS) for technical vertical <strong>risk</strong>, i.e. <strong>risk</strong> due to height keeping performance <strong>of</strong> the<br />
autopilot and the flight crew, <strong>of</strong> 2.5 x 10 -9 fatal accidents per flight hour, and a TLS for total<br />
vertical <strong>risk</strong>, i.e. including the <strong>risk</strong> resulting from blunders like mishearing the assigned<br />
altitude, <strong>of</strong> 5 x 10 -9 fatal accidents per flight hour. ICAO prescribes the use <strong>of</strong> the Reich<br />
collision <strong>risk</strong> model [Reich 1966a, 1966b, 1966c] for assessing vertical <strong>risk</strong>:<br />
39<br />
For instance, if the introduction <strong>of</strong> RVSM would result in a significantly larger number<br />
<strong>of</strong> flight level changes for each flight, fuel consumption would be higher which could result<br />
in an increased likelihood that an <strong>air</strong>craft runs out <strong>of</strong> fuel. Another hazard could be any<br />
interference <strong>of</strong> the RVSM equipment with on-board instrumentation.<br />
81
N<br />
az<br />
⎡<br />
⎪⎧<br />
2λ<br />
y&<br />
z ⎪⎫<br />
⎤<br />
x 2λ<br />
& x<br />
⎢nz<br />
( same)<br />
⎨1<br />
+ + ⎬ + ⎥<br />
⎢ ⎪⎩<br />
2λy<br />
ΔV<br />
2λz<br />
ΔV<br />
⎪⎭ ⎥<br />
= 2Pz<br />
( Sz<br />
) Py<br />
( 0)<br />
⎢<br />
⎥<br />
⎢ ⎪⎧<br />
2λ<br />
y&<br />
z ⎪⎫<br />
⎥<br />
x 2λ<br />
& x<br />
⎢nz<br />
( opp)<br />
⎨1<br />
+ + ⎬ ⎥<br />
⎢⎣<br />
⎪⎩<br />
2λy<br />
2V<br />
2λz<br />
2V<br />
⎪⎭ ⎥⎦<br />
Parameter Definition<br />
N az<br />
The expected number <strong>of</strong> fatal <strong>air</strong>craft accidents per flight hour due to the<br />
loss <strong>of</strong> vertical separation<br />
The vertical separation minimum<br />
S z<br />
P z ( S z ) The probability <strong>of</strong> vertical overlap for <strong>air</strong>craft nominally flying on adjacent<br />
flight levels<br />
P y ( 0)<br />
The probability <strong>of</strong> lateral overlap for <strong>air</strong>craft nominally flying the same<br />
route<br />
The frequency with which same direction <strong>air</strong>craft on adjacent flight levels <strong>of</strong><br />
the same route are in longitudinal overlap<br />
nz (same)<br />
nz (opp)<br />
The frequency with which opposite direction <strong>air</strong>craft on adjacent flight<br />
Δ V<br />
V<br />
y&<br />
z&<br />
λ x<br />
λ<br />
y<br />
λ z<br />
levels <strong>of</strong> the same route are in longitudinal overlap<br />
The average <strong>of</strong> the absolute value <strong>of</strong> the relative along-track speed between<br />
two same direction <strong>air</strong>craft flying at adjacent flight levels <strong>of</strong> the same route<br />
The average ground speed <strong>of</strong> a typical <strong>air</strong>craft<br />
The average <strong>of</strong> the absolute value <strong>of</strong> the relative cross-track speed between<br />
two typical <strong>air</strong>craft flying at adjacent flight levels <strong>of</strong> the same route<br />
The average <strong>of</strong> the absolute value <strong>of</strong> the relative vertical speed between two<br />
typical <strong>air</strong>craft which have lost S z feet <strong>of</strong> vertical separation<br />
The average length <strong>of</strong> a typical <strong>air</strong>craft<br />
The average width <strong>of</strong> a typical <strong>air</strong>craft<br />
The average height <strong>of</strong> a typical <strong>air</strong>craft<br />
The equation expresses accident probability as a function <strong>of</strong> the probability <strong>of</strong> vertical and<br />
lateral overlap for <strong>air</strong>craft flying at adjacent flight levels and on the same route respectively,<br />
together with kinematic factors (relative speeds and <strong>air</strong>craft dimensions). The probability <strong>of</strong><br />
overlap is calculated from observed probability distributions. Data was collected by<br />
dedicated data collection infrastructure comprising ground based and portable <strong>air</strong>borne<br />
units. In total more than 350,000 measurements were made [Eurocontrol 2001a].<br />
Discussion<br />
It is interesting to note that for this problem the available standard approach (the ICAO<br />
collision <strong>risk</strong> model) was not considered sufficient because <strong>of</strong> the possible existence <strong>of</strong><br />
new, previously not existing hazards. The ability to handle ‘new’ hazards has been defined<br />
as a desirable characteristic <strong>of</strong> a causal <strong>risk</strong> model. Both the functional hazards assessment<br />
and the collision <strong>risk</strong> assessment were strictly focussing on collision <strong>risk</strong>. Even within this<br />
limited scope there was no explicit attention for system interdependencies and the approach<br />
therefore cannot be considered ‘integrated’. It was for instance assumed that the <strong>risk</strong> <strong>of</strong><br />
82
collision in an RVSM environment with TCAS 40 would be lower than the <strong>risk</strong> <strong>of</strong> collision<br />
without TCAS, thereby ignoring the possibility that interactions <strong>of</strong> TCAS with other system<br />
elements can introduce additional <strong>risk</strong> 41 . Some system interdependencies will have been<br />
implicitly considered by the experts in the functional hazard assessment. The results <strong>of</strong> the<br />
functional hazard assessment were qualitative. Probabilities <strong>of</strong> occurrence <strong>of</strong> events were<br />
subjectively estimated by experts and were expressed semi-quantitatively, using terms like<br />
‘remote’, but the results <strong>of</strong> the collision <strong>risk</strong> assessment were qualitative. This part <strong>of</strong> the<br />
study required an extensive data gathering campaign. The collision <strong>risk</strong> assessment is not<br />
transparent to non mathematicians because the outcome is the result <strong>of</strong> a mathematical<br />
equation that requires probability distributions as input parameters. For operational<br />
managers and safety experts in the <strong>air</strong> <strong>transport</strong> system this may be difficult to comprehend.<br />
The functional hazard assessment is not fully transparent, because it is not completely<br />
traceable what the expert’s opinions were based on. Reproducibility <strong>of</strong> the results is<br />
questionable, as different experts may have had different opinions and arrived at different<br />
conclusions.<br />
5.5. VEMER ATM System increment 2002<br />
Background<br />
The method <strong>of</strong> VEM 42 Effect Reports (VEMERs) has been developed by ATC the<br />
Netherlands in order to support developments with respect to the ATM system with<br />
appropriate management information. Every proposed change in the ATM system is<br />
evaluated for its consequences on safety, efficiency <strong>of</strong> the operations, and environmental<br />
aspects. The results are published in a VEMER. A distinction is made between increment<br />
VEMERs, which focus on the entire operation, and in-depth VEMERs, which focus on<br />
envisaged partial operations in detail. Increment VEMERS are conducted at a higher level<br />
<strong>of</strong> abstraction than in-depth VEMERS.<br />
The research question<br />
The objective <strong>of</strong> the VEMER ‘ATM system increment 2002’ [LVNL 2002] was to provide<br />
information on the envisaged introduction <strong>of</strong> the 5 th runway at Schiphol in November 2002.<br />
The purpose <strong>of</strong> the study was to support decision making within ATC the Netherlands and<br />
to support external arrangements with the stakeholders (like KLM, the Dutch government<br />
and the <strong>air</strong>port authority). The VEMER ATM system increment 2002 was not aimed at<br />
providing a full safety assessment. This was done later on when VEMERs <strong>of</strong> specific<br />
operations were made.<br />
Research approach<br />
Each VEMER starts by defining the objective <strong>of</strong> the project in terms <strong>of</strong> safety, efficiency<br />
and environment -the VEM targets- followed by describing specific sets <strong>of</strong> options for<br />
changing the ATM system with which it is envisaged that the VEM targets will be met.<br />
VEM effects are determined for each set <strong>of</strong> options. Designing options and deriving VEM<br />
effects is an iterative process; more detail is added when it becomes available in the course<br />
<strong>of</strong> the project. The process stops as soon as the results <strong>of</strong> the VEMER are considered<br />
40<br />
TCAS stands for Traffic Collision Avoidance System. It is an <strong>air</strong>borne system that warns<br />
the flight crew <strong>of</strong> imminent collision <strong>risk</strong> and provides instructions to avoid collisions.<br />
41<br />
That such interactions can occur with catastrophic results was demonstrated with the<br />
Überlingen accident. Two <strong>air</strong>craft collided when the instructions provided by TCAS were<br />
conflicting with instructions provided by the <strong>air</strong> traffic controller [BFU 2004]. See also<br />
infobox ‘Inappropriate interface: the Überlingen mid-<strong>air</strong> collision’.<br />
42<br />
VEM stands for Veiligheid, Efficiency, Milieu (Safety, Efficiency and Environment).<br />
83
acceptable. The question, scope and level <strong>of</strong> detail are determined before each iteration<br />
cycle. Evaluation <strong>of</strong> the VEM effects focuses on those elements <strong>of</strong> the ATM concept that<br />
have substantial influence. For increment VEMERs the effects are classified by operational<br />
experts as Large, Medium and Small. For in-depth VEMERS the corresponding categories<br />
are Unacceptable, Tolerable and Small. The VEM effects are then quantified on the basis <strong>of</strong><br />
expert judgement or studies. The ‘ATM system increment 2002’ VEMER was quantified<br />
on the basis <strong>of</strong> expert judgement. Information was derived from structured interviews with<br />
experts representing different operational functions (tower/approach controller, ground<br />
controller, clearance delivery, <strong>air</strong> traffic control assistant). For other VEMERs interviews<br />
have also been conducted with <strong>air</strong>line pilots.<br />
Discussion<br />
The VEMER approach has the potential to address the total aviation system including<br />
interdependencies between different system elements. However, these interdependencies<br />
are not actively pursued. The focus <strong>of</strong> the analysis (in terms <strong>of</strong> both the changes and the<br />
effects <strong>of</strong> those changes) is on <strong>risk</strong> that can be influenced by the ATM part <strong>of</strong> the aviation<br />
system. The results <strong>of</strong> the analysis are quantitative, where quantification is done by expert<br />
opinion. The process <strong>of</strong> expert judgement is well developed. Strong points include the<br />
traceability <strong>of</strong> the process, confidentiality and the existing infrastructure; both analysts and<br />
experts are conveniently familiar with the process <strong>of</strong> expert judgement elicitation because it<br />
is used quite frequently. Weak points are the traceability <strong>of</strong> the combination <strong>of</strong> experts’<br />
opinions and the reproducibility <strong>of</strong> the process [Roelen et al 2004a, Van der Plas & Van<br />
Luijk 2005]. Because <strong>of</strong> these weak points there is a lack <strong>of</strong> transparency <strong>of</strong> the overall<br />
project result, which is unfortunate as one <strong>of</strong> the objectives <strong>of</strong> the method is to support<br />
external arrangements with the stakeholders. Other than the need to perform structured<br />
interviews with experts there is no additional need to collect data.<br />
5.6. Conclusions for this section<br />
In this section we examined different methods that are currently being used to assess or<br />
analyse the safety <strong>of</strong> (parts <strong>of</strong>) the aviation system. Specific attention was paid to whether<br />
the method looks at the integrated system or only an element <strong>of</strong> the system in isolation, to<br />
data requirements, reproducibility <strong>of</strong> the results, and transparency.<br />
There is no standardized or prescribed procedure for conducting safety analyses for <strong>air</strong><br />
<strong>transport</strong>. Selection <strong>of</strong> the safety analysis methodology for a specific problem depends on<br />
the scope <strong>of</strong> the safety question, the type <strong>of</strong> operation, the level <strong>of</strong> involvement <strong>of</strong> the<br />
customer, the domain knowledge <strong>of</strong> the customer and the usage <strong>of</strong> the results. This was also<br />
concluded by Van Doorn [2006] in an analysis <strong>of</strong> several ATM safety studies. Although the<br />
different methods <strong>of</strong>ten follow similar steps, they differ in the details. One <strong>of</strong> the<br />
consequences is that quite <strong>of</strong>ten safety analysis starts with an activity that has already been<br />
performed earlier, although slightly differently. Activities such as hazard identification and<br />
accident scenario development are repeatedly done, <strong>of</strong>ten without taking full advantage <strong>of</strong><br />
the results and lessons learned from previous studies. Data collection is also an activity that<br />
sometimes requires a significant effort. Often data are not available or there are not<br />
sufficient resources to collect data. Most safety analyses described here therefore relied<br />
heavily on the experts, or more precisely, on the black boxes inside the expert’s heads, for<br />
hazard identification, accident scenario development and quantification. Each expert has his<br />
own ‘model <strong>of</strong> the world’ which he uses to come to certain conclusions. These <strong>models</strong> were<br />
not made explicit in the studies reviewed here. When consensus was achieved among a<br />
group <strong>of</strong> experts, this consensus was only concerning the outcome, and not concerning the<br />
way these outcomes had been derived. The background for reaching a certain conclusion<br />
84
can vary among experts. Consensus can also be influenced by group dynamics.<br />
Extrapolating on the basis <strong>of</strong> the consensus decisions is <strong>risk</strong>y, because nothing is known<br />
about how each expert has given thought to possible scenarios or consequences. Criteria for<br />
experts did not exist in the studies mentioned. In aviation safety analyses, selected experts<br />
are <strong>of</strong>ten people with (ample) operational experience, such as pilots and <strong>air</strong> traffic<br />
controllers. Analytical ability and ability to provide judgement on future operations are<br />
only rarely taken into consideration. Experts are not ‘calibrated’. These aspects have a<br />
negative effect on the transparency and reproducibility <strong>of</strong> analysis results.<br />
It is no coincidence that all the examples presented here address issues <strong>of</strong> <strong>air</strong> traffic<br />
management or <strong>air</strong>ports. These two subjects are, in comparison with <strong>air</strong>craft design,<br />
operation and maintenance, far less regulated. Air navigation service providers and <strong>air</strong>port<br />
authorities are relatively free in developing infrastructure, procedures etc., that fulfil their<br />
specific needs. However, they still need to demonstrate that all applicable target levels <strong>of</strong><br />
safety are met. As a result, there is a growing need for support in conducting <strong>risk</strong><br />
assessments in the field <strong>of</strong> ATM and <strong>air</strong>ports. In <strong>air</strong>craft design, operation and maintenance,<br />
there is less freedom. It is assumed that compliance with existing regulation will ensure that<br />
(minimum) safety targets are met. This difference between ATM and <strong>air</strong>ports on the one<br />
side and <strong>air</strong>craft design, operation and maintenance on the other has developed historically<br />
(see also section 4.4). As explained in section 4.4, it can be expected that regulatory<br />
requirements will in the future be developed for the integrated system rather than the<br />
individual components, but the complexity <strong>of</strong> the matter will discourage the authorities<br />
from specifying detailed requirements. It can therefore be expected that also for <strong>air</strong>craft<br />
design, operation and maintenance, a need for support in conducting <strong>risk</strong> assessments will<br />
emerge.<br />
None <strong>of</strong> the methods described in this chapter fulfils all requirements that have been<br />
derived in the previous chapter: ability to analyse the integrated system including<br />
dependencies, reproducibility <strong>of</strong> results, transparency, ability to provide quantitative results<br />
and the ability to represent current as well as future accident scenarios. The customers for<br />
these studies would have had better (and cheaper) answers to their questions if there had<br />
been an existing causal <strong>risk</strong> model. This chapter also showed that the ability to handle<br />
‘new’ hazards would be a desirable characteristic <strong>of</strong> a causal <strong>risk</strong> model. An effort to<br />
develop a method that meets these criteria therefore seems fully justified.<br />
85
Chapter 6. Risk <strong>models</strong> in other industries<br />
There are various ways in which <strong>risk</strong> modelling approaches can be compared. For instance<br />
one can look across various scientific disciplines, or across different countries, or across<br />
different industries, etc. In this thesis the comparison is restricted to a comparison across<br />
industries. This chapter investigates the role <strong>of</strong> causal <strong>risk</strong> <strong>models</strong> in the nuclear power<br />
industry, manned spaceflight, the <strong>of</strong>fshore industry, the process industry, rail <strong>transport</strong> and<br />
health care. Characteristics that seem to be vital for the success or failure <strong>of</strong> causal <strong>risk</strong><br />
<strong>models</strong> are identified. The final section <strong>of</strong> the chapter concludes on the relevancy <strong>of</strong> it all<br />
for the <strong>air</strong> <strong>transport</strong> industry.<br />
6.1. Nuclear power<br />
Initially, the nuclear power industry relied on the use <strong>of</strong> multiple barriers and large design<br />
margins to assure the safety <strong>of</strong> nuclear reactors. During the 1960s the general public<br />
became more worried about the hazards <strong>of</strong> radiation as a result <strong>of</strong> expert concern and<br />
accidents such as Windscale 43 , and there was a desire from the public to know whether<br />
nuclear power plants were sufficiently safe. In roughly the same time frame, the theoretical<br />
basis was provided for applications <strong>of</strong> reliability methods in the <strong>risk</strong> assessment <strong>of</strong> complex<br />
systems. The desire to meet <strong>risk</strong> targets and to quantify and to evaluate the effects <strong>of</strong> design<br />
improvements <strong>of</strong> nuclear power plants led to the introduction <strong>of</strong> probabilistic <strong>risk</strong> <strong>models</strong> in<br />
the nuclear industry. The methods for probabilistic <strong>risk</strong> analysis that were used originated<br />
from the aerospace industry (fault trees) and decision theory (event trees). These techniques<br />
are very suitable for the representation <strong>of</strong> hardware failures [Ericson 1999]. The first fullscale<br />
application <strong>of</strong> these methods to a commercial power plant was undertaken in the<br />
Reactor Safety Study WASH-1400 published by the American Nuclear Regulatory<br />
Commission NRC in 1975 [NRC 1975]. This landmark study was controversial and an<br />
independent evaluation <strong>of</strong> the study [Lewis et al 1979] was requested. The evaluation report<br />
concluded that the WASH-1400 study had important shortcomings but provided the most<br />
complete single picture <strong>of</strong> accident probabilities associated with nuclear reactors. The use<br />
<strong>of</strong> fault trees and event trees coupled with an adequate database was considered to be the<br />
best available tool to quantify these probabilities. The lack <strong>of</strong> scrutability <strong>of</strong> the calculation<br />
process and lack <strong>of</strong> data on which to base the component reliability estimates were<br />
mentioned as shortcomings <strong>of</strong> the study. The evaluation also revealed shortcomings in<br />
relation to the representation <strong>of</strong> human factors and the role <strong>of</strong> the organisation. The Three<br />
Mile Island accident in 1979 44 and the subsequent investigation <strong>of</strong> it underlined the value <strong>of</strong><br />
probabilistic <strong>risk</strong> <strong>models</strong>, because some <strong>of</strong> the characteristics <strong>of</strong> the accident had been<br />
highlighted by the WASH 1400 study [Kemeny 1979]. When the PRA procedures guide<br />
43<br />
On October 10, 1957, the core <strong>of</strong> a British nuclear reactor at Windscale caught fire. As a<br />
result, substantial amounts <strong>of</strong> radioactive contamination were released into the surrounding<br />
area.<br />
44<br />
The accident at the Three Mile Island nuclear power plant near Middletown,<br />
Pennsylvania, on March 28, 1979, was the most serious in U.S. commercial nuclear power<br />
plant operating history, even though it led to no deaths or injuries to plant workers or<br />
members <strong>of</strong> the nearby community. The accident led to a partial meltdown <strong>of</strong> the reactor<br />
core but only very small <strong>of</strong>f-site releases <strong>of</strong> radioactivity [NRC 2007a].<br />
86
[NRC 1983] was published by the NRC in 1983 it became a main reference. Probabilistic<br />
<strong>risk</strong> <strong>models</strong> became even more accepted when in 1995 the NRC issued a revised policy<br />
statement on the use <strong>of</strong> probabilistic <strong>risk</strong> assessment which stated that “The use <strong>of</strong> PRA<br />
technology should be increased in all regulatory matters” [NRC 1995]. The results <strong>of</strong><br />
probabilistic <strong>risk</strong> assessments are now used together with traditional deterministic analysis<br />
for regulatory decision making, the so-called <strong>risk</strong>-informed regulation [Keller & Modarres<br />
2005]. Traditionally, PRAs <strong>of</strong> nuclear powerplants take account <strong>of</strong> technical systems and<br />
human operators but do not include an explicit representation <strong>of</strong> the possible impact <strong>of</strong><br />
plant organisation and management on the safety performance <strong>of</strong> equipment and plant<br />
personnel. As a result it is acknowledged that these PRAs may not have accounted for the<br />
contributions <strong>of</strong> organisational facts to total <strong>risk</strong> [Mosleh & Goldfeiz 1994]. A first attempt<br />
to resolve this issue is the work process analysis model (WPAM) which represents the<br />
dependencies among the parameters that are introduced by organisational factors by<br />
calculating new (organizationally dependent) minimum cut-sets for major accident<br />
sequences [Davoudian et al 1994]. There is general recognition that organisational factors<br />
need to be evaluated further for their contribution to plant safety performance [NEA/CSNI<br />
1999] and much <strong>of</strong> the current research work is still focussing on this topic.<br />
6.2. Manned spaceflight<br />
When US President Kennedy in 1961 set his ambitious goal 45 <strong>of</strong> going to the moon, the<br />
total US experience in manned space flight consisted only <strong>of</strong> Alan Shepard’s 15 minute<br />
suborbital flight in a Mercury capsule [Chaikin 1994]. The lunar program was<br />
tremendously bold and ambitious and NASA management was aware that identification <strong>of</strong><br />
potential failures and their <strong>risk</strong>s was essential to a successful design and thus to a successful<br />
mission. Quantitative numerical goals were set for the Apollo missions: a <strong>risk</strong> <strong>of</strong> 1 out <strong>of</strong><br />
100 per launch was considered acceptable for mission non-completion and 1 out <strong>of</strong> 1000<br />
per launch was set for loss <strong>of</strong> the crew. Quantitative <strong>risk</strong> <strong>models</strong> were developed for the<br />
different components <strong>of</strong> Apollo (the command module, the moon lander and the Saturn V<br />
rocket) to determine if these goals could be met [Kelly 2001]. As described in the previous<br />
section, the theoretical basis for applications <strong>of</strong> reliability methods in <strong>risk</strong> assessment <strong>of</strong><br />
complex systems had by then (the 1960’s) just been developed. However, data to populate<br />
quantitative <strong>models</strong> was simply non-existent. Because Apollo was still very much in the<br />
design stage, and due to the time pressure to meet Kennedy’s goal (and also to beat the<br />
Russians in the race to the moon) NASA fell back on familiar qualitative <strong>risk</strong> methods, in<br />
particular FMEA. Individual components were analysed bottom-up, and those that could<br />
put the mission at <strong>risk</strong> were put on a Critical Item List (CIL). Abundant personnel and test<br />
facility resources were available to ensure that each critical item was properly addressed.<br />
The success <strong>of</strong> Apollo and the subsequent (initial) success <strong>of</strong> the Space Shuttle made<br />
NASA fully comfortable with the FMEA/CIL approach. It was only after the accident with<br />
the Space Shuttle Challenger in 1986 [Shayler 2000] and the subsequent accident<br />
investigation report [Rogers 1986] that probabilistic <strong>risk</strong> assessment methods were (re)introduced<br />
at NASA. The methods used were similar to those in the nuclear industry, i.e.<br />
combinations <strong>of</strong> fault trees and event trees. Yet there was still much resistance. It was stated<br />
that the money spent in quantitative safety analysis could be better invested in improving<br />
the system directly. Because <strong>of</strong> the many assumptions that had to be made in the <strong>models</strong>,<br />
the results <strong>of</strong> the analyses were considered to be too subjective to be used for decision<br />
45<br />
“I believe that this nation should commit itself to achieving the goal, before this decade is<br />
out, <strong>of</strong> landing a man on the Moon and returning him safely to the Earth.", John F.<br />
Kennedy, 25 May 1961, “Urgent National Needs” speech to a Joint Session <strong>of</strong> Congress in<br />
Washington DC.<br />
87
support [Paté-Cornell & Dillon 2001]. Endorsement grew when probabilistic <strong>risk</strong> <strong>models</strong><br />
had been used for safety assessments <strong>of</strong> Shuttle payloads (such as the Galileo and Ulysses<br />
spacecraft 46 ) and had produced results that were favourable to the program (the<br />
consequence <strong>of</strong> the results was that the launches could proceed on schedule). Following the<br />
accident with the Space Shuttle Columbia in 2003, the accident investigation board<br />
concluded that the Space Shuttle program hazard analysis was performed on components<br />
and elements, but was not required on the Shuttle as a whole. Since it was designed for<br />
bottom-up analysis, it could not effectively support the kind <strong>of</strong> top-down hazard analysis<br />
that was needed to inform managers on <strong>risk</strong> trends and to identify potentially harmful<br />
interactions between systems. The Board therefore recommended to conduct integrated<br />
hazard analysis, i.e. not only anticipating failure modes <strong>of</strong> individual components but also<br />
considering the components integrated into a total system and working in concert<br />
[Columbia Accident Investigation Board 2003]. Probabilistic safety analysis has now been<br />
adopted as one <strong>of</strong> the decision support instruments for the management <strong>of</strong> the Space<br />
Shuttle, the International Space Station and some unmanned missions. The most important<br />
issues that require further attention are the need for an overarching model, consistency in<br />
the choice <strong>of</strong> methods, analytical depth and the treatment <strong>of</strong> data [Paté-Cornell & Dillon<br />
2001, Fragola 1996].<br />
6.3. Offshore industry<br />
The world’s first formal requirement for probabilistic safety analysis in the <strong>of</strong>fshore<br />
industry was by the Norwegian Petroleum Directorate in their ‘Guidelines for a safety<br />
evaluation <strong>of</strong> the platform concept’ <strong>of</strong> 1981. The analyses initially focused on the<br />
availability <strong>of</strong> safety functions such as escape routes and shelter areas, but were later<br />
extended into total <strong>risk</strong> analysis. From 1990 onwards the Norwegian Petroleum Directorate<br />
required operators to manage safety systematically, using probabilistic <strong>risk</strong> assessment<br />
methods as a tool and defining their own safety targets and <strong>risk</strong> criteria [Brandsaeter 2002].<br />
Developments in the UK were roughly similar. Probabilistic <strong>risk</strong> assessments methods were<br />
applied from the 1980s onward, but only to specific aspects <strong>of</strong> the design <strong>of</strong> <strong>of</strong>fshore<br />
installations. Like in the nuclear power industry and in manned spaceflight, it was a major<br />
accident that led to a more prominent role for quantitative <strong>risk</strong> analysis: the Piper Alpha<br />
disaster 47 . Lord Cullen’s Report on the Public Inquiry into the Piper Alpha disaster, issued<br />
in 1990, recommended that the operator or owner <strong>of</strong> every <strong>of</strong>fshore installation should be<br />
required to prepare a Safety Case, which should include identification and assessment <strong>of</strong><br />
the <strong>risk</strong>s <strong>of</strong> major accidents, and submit it for acceptance by the HSE [DNV 2002a]. The<br />
use <strong>of</strong> <strong>risk</strong> assessment in the <strong>of</strong>fshore industry was firmly established in the 1990s,<br />
particularly in the UK where many aspects became subject to full <strong>risk</strong> assessment, notably<br />
46<br />
The objective <strong>of</strong> Galileo was to explore the planet Jupiter. It was launched on October<br />
18, 1989, from the Space Shuttle Atlantis [Meltzer 2007]. Primary mission <strong>of</strong> the<br />
unmanned Ulysses spacecraft is to investigate properties <strong>of</strong> the heliosphere as a function <strong>of</strong><br />
solar latitude. The craft was launched on October 6, 1990, from the Space Shuttle<br />
Discovery [Forsyth et al 2002]. Both spacecraft used a small amount <strong>of</strong> plutonium-238 as<br />
fuel, and the possibility <strong>of</strong> accidental release <strong>of</strong> plutonium into the atmosphere following a<br />
launch mishap was a cause <strong>of</strong> great concern.<br />
47<br />
On July 6, 1988, a fire and subsequent explosions completely destroyed the Piper Alpha<br />
oil production platform. The fire, resulting from an oil condensate leak, affected and melted<br />
the gas pipes, which then caused the explosions. A total <strong>of</strong> 167 people died making it the<br />
world's worst <strong>of</strong>fshore oil disaster.<br />
88
the Temporary Refuge 48 assessment which was mandated to be analysed using Quantitative<br />
Risk Assessment. The specific tool <strong>of</strong> QRA was the subject <strong>of</strong> criticism in a HSE<br />
commissioned survey as to the effectiveness <strong>of</strong> current <strong>of</strong>fshore regulations. The technique<br />
was considered too mathematical and there was insufficient agreement within the industry<br />
and the HSE on how to use the results <strong>of</strong> QRA. Nevertheless, HSE’s Guide to the Offshore<br />
Installations (Safety Case) Regulations 1992 49 states [HSE 1998]: “The evaluation <strong>of</strong> <strong>risk</strong><br />
should involve both a qualitative and quantitative approach. Where relevant good or best<br />
practice is clear, the balance should be in favour <strong>of</strong> qualitative arguments to show that the<br />
<strong>risk</strong>s have been properly controlled. Where relevant good or best practice is less clear,<br />
appropriate support from quantitative arguments will be necessary”. Similarly, the UK oil<br />
and gas industry has developed a framework to assist <strong>risk</strong>-related decision making (Figure<br />
12), which helps decision makers choose an appropriate basis for their decisions. The<br />
framework takes the form <strong>of</strong> a spectrum <strong>of</strong> decision bases, ranging from those decisions<br />
dominated by pure engineering concerns to those where company and societal values are<br />
the most relevant factors. The concept is not unlike the <strong>risk</strong> informed regulation in the<br />
nuclear power industry. This approach shows that quantitative <strong>risk</strong> assessment has a major<br />
input to the types <strong>of</strong> decisions that involve some uncertainty, deviation from standard<br />
practice, <strong>risk</strong> trade-<strong>of</strong>fs, etc.<br />
Increased significance to the decision making process<br />
Codes &<br />
Standards<br />
Company<br />
Values<br />
Good<br />
Practice<br />
Engineering<br />
Judgement<br />
Risk-based<br />
analysis, e.g.<br />
QRA<br />
Societal<br />
Values<br />
A<br />
B<br />
C<br />
Decision context type<br />
• Nothing new or unusual<br />
• Well understood <strong>risk</strong>s<br />
• Established practice<br />
• No major stakeholder<br />
implications<br />
• Lifecycle implications<br />
• Some <strong>risk</strong> trade-<strong>of</strong>fs<br />
• Some uncertainty or<br />
deviation from standard<br />
or best practice<br />
• Significant economic<br />
implications<br />
• Very novel or challenging<br />
• Strong stakeholder views<br />
and perceptions<br />
• Significant <strong>risk</strong> trade-<strong>of</strong>fs<br />
• Large uncertainties<br />
• Perceived lowering <strong>of</strong><br />
standards<br />
Figure 12: Risk-related decision support framework. Source: [UKOOA 1999].<br />
48<br />
A Temporary Refuge is a specially designated area on board every <strong>of</strong>fshore oil and gas<br />
production platform which is designed to ensure that personnel can muster in safety for a<br />
period <strong>of</strong> protection while an incident is being assessed and a decision taken on whether or<br />
not to abandon the installation.<br />
49<br />
The Regulations implement the central recommendation <strong>of</strong> Lord Cullen’s Report that the<br />
operator <strong>of</strong> every <strong>of</strong>fshore installation should prepare a Safety Case.<br />
89
Techniques that have been used in the <strong>of</strong>fshore industry for estimating the frequency <strong>of</strong><br />
occurrence <strong>of</strong> failure causes include historical accident frequency data, fault tree analysis,<br />
event tree analysis, simulation, human reliability analysis, expert judgement and Bayesian<br />
analysis [DNV 2002a]. Historical accident frequency data is the basis for most quantitative<br />
safety analysis in the <strong>of</strong>fshore industry.<br />
6.4. Process industry<br />
On June 1, 1974, in a chemical plant in Flixborough, UK, a crack in a temporary bypass<br />
pipe caused the accidental release <strong>of</strong> a vapour cloud <strong>of</strong> cyclohexane. The vapour cloud<br />
exploded, as a result <strong>of</strong> which 28 people were killed. After this disaster it was<br />
recommended that some method should be developed and used to estimate realistic<br />
accident consequences and to associate these estimates with a probability [Ale 2005]. On<br />
November 17, 1975, an explosion occurred at the DSM works in Beek, the Netherlands,<br />
due to the accidental release <strong>of</strong> propane gas. There were 14 fatalities and many injuries [Ale<br />
2005]. Then in 1976 a vapour cloud containing dioxin was accidentally released from a<br />
chemical plant near the town <strong>of</strong> Seveso in Italy. More than 600 people had to be evacuated<br />
and as many as 2000 were treated for dioxin poisoning. These accidents motivated the<br />
development <strong>of</strong> Council Directive 82/501/EEC [EC 1982] on the major-accident hazards <strong>of</strong><br />
certain industrial activities, better known as the Seveso Directive. For the prevention <strong>of</strong><br />
major accident hazards involving dangerous substances, the European Commission issued<br />
the so-called Seveso I and later Seveso II Directive. The Directive prescribes that plant<br />
operators need to establish a Safety Management System that must address identification<br />
and evaluation <strong>of</strong> major hazards, adaptation and implementation <strong>of</strong> procedures for<br />
systematically identifying major hazards arising from normal and abnormal operation and<br />
the assessment <strong>of</strong> their likelihood and severity [EC 1996].<br />
Because it was known that the results <strong>of</strong> <strong>risk</strong> analysis may vary considerably depending on<br />
the methodology used and the assumptions underlying the analysis, national and<br />
international guidelines to standardise the approaches have been developed, like for<br />
instance the Guidelines for Chemical Process Quantitative Risk Analysis [CCPS 1989]. The<br />
Dutch government made an attempt to standardise the methodology for <strong>risk</strong> analysis <strong>of</strong><br />
sites involving flammable or toxic substances. Methods to calculate probabilities were<br />
published in the ‘coloured books’; methods for calculating probabilities in the Red book,<br />
methods for calculating consequences in the Yellow book, methods to calculate damage in<br />
the Green book and guidelines for performing <strong>risk</strong> analysis in the Purple book. But results<br />
<strong>of</strong> a benchmark study [Ale et al 2001] showed that, depending on the interpretation and the<br />
method used, differences <strong>of</strong> up to one order <strong>of</strong> magnitude were still being obtained. The<br />
Dutch government therefore decided on a prescribed and unified calculation method.<br />
Safeti-NL, developed by DNV in London, was selected as the package for determining<br />
whether the operator complies with criteria for third party <strong>risk</strong>.<br />
6.5. Rail <strong>transport</strong><br />
Historically, safety in railway companies was managed from a technical and rule-based<br />
point <strong>of</strong> view. The main focus was on reliability <strong>of</strong> infrastructure and rolling stock and<br />
technological solutions for the prevention <strong>of</strong> ‘human error’ and a system <strong>of</strong> rules and<br />
procedures that eliminated (in theory) the need for independent decision making by<br />
operators in the field [Hale 2000]. The privatisation <strong>of</strong> railway companies that occurred in<br />
several countries in Europe in the mid-nineties and the European Commission’s policy to<br />
encourage liberalisation <strong>of</strong> the railway industry across all EU member states resulted in<br />
significant changes. Railway infrastructure, traffic control, maintenance, etc., were<br />
separated and became the responsibility <strong>of</strong> individual companies. Competition, which<br />
90
previously did not exist, started to play a role. Performance requirements, including<br />
requirements for safety performance, were introduced in European and national<br />
regulation 50 . Unlike the nuclear power or <strong>of</strong>fshore industry or manned spaceflight there was<br />
no single major accident that forced regulatory requirements, but accidents are also in the<br />
railway industry a driver for change, for instance the recommendations for changes to the<br />
regulatory requirements for railway safety set out by Lord Cullen [2001] in the inquiry on<br />
the accident at Ladbroke Grove 51 . These changes also led to a different approach towards<br />
safety management. Prorail, a provider <strong>of</strong> rail infrastructure in the Netherlands, has<br />
developed a safety management system [Heimplaetzer & Busch 2006] that is based on the<br />
quality control cycle [Deming 1990]. Safety performance is measured with the use <strong>of</strong> a<br />
monthly updated database <strong>of</strong> accidents, incidents and other safety related parameters such<br />
as audit results [Wright 2006]. Safety critical processes were also defined. (<strong>Causal</strong>)<br />
modelling is used to identify likely system factors or elements which could be considered<br />
as precursors to future accidents. According to the Dutch policy for rail safety (Tweede<br />
Kadernota voor de veiligheid van het railvervoer in Nederland), all design plans and<br />
resolutions on rail <strong>transport</strong> should explicitly involve safety. Preferably, this should be done<br />
by means <strong>of</strong> an Integral Safety Plan or a Safety Case. On a European level, the European<br />
Railway Safety Directive [EC 2004] is aimed at ensuring the development and<br />
improvement <strong>of</strong> safety on the European Community’s railways and improved access to the<br />
market for rail <strong>transport</strong> services. According to the Directive, common safety methods<br />
should be gradually introduced to ensure that a high level <strong>of</strong> safety is maintained and, when<br />
and where necessary and reasonably practicable, improved. ‘Common safety methods’ are<br />
the methods to describe how safety levels and achievement <strong>of</strong> safety targets and compliance<br />
with other safety requirements are assessed by elaborating and defining the following:<br />
• Risk evaluation and assessment methods,<br />
• Methods for assessing conformity with requirements in safety certificates and<br />
safety authorisation,<br />
• Methods to check that the structural subsystems <strong>of</strong> the rail systems are operated<br />
and maintained in accordance with the relevant essential requirements.<br />
In line with the tradition in the rail industry, the EU directive still puts much emphasis on<br />
compliance with regulations, but the gradual introduction <strong>of</strong> <strong>risk</strong> assessment methods is<br />
otherwise similar to what is happening in other industries as described previously.<br />
6.6. Health care<br />
The health care industry is interesting to compare with aviation and rail because these<br />
industries are all responsible for managing the safety <strong>of</strong> their ‘customers’, i.e. patients and<br />
passengers respectively. This is a marked difference with e.g. the <strong>of</strong>f-shore industry where<br />
safety is to a large extent synonymous to occupational safety and third party <strong>risk</strong>. As in <strong>air</strong><br />
<strong>transport</strong>, customer safety is the main driver for safety improvement in the health care<br />
industry, rather than occupational safety. But there is also a different <strong>risk</strong> dynamic. The<br />
choice for a patient is <strong>of</strong>ten certain death now or possible life later, which is the reverse that<br />
50<br />
For example, the ‘Tweede Kadernota voor de veiligheid van het railvervoer in<br />
Nederland’ <strong>of</strong> November 2004 states a goal <strong>of</strong> less than 1.5 passenger fatalities per 10<br />
billion passenger kilometres.<br />
51<br />
On 5 October 1999 at Ladbroke Grove junction, about two miles west <strong>of</strong> Paddington<br />
Station, London, there was a head on crash at high speed between trains operated by<br />
Thames Trains and First Great Western. This caused the death <strong>of</strong> 31 persons including both<br />
train drivers, and inflicted injuries, some <strong>of</strong> them critical, on over 400 other persons.<br />
91
<strong>air</strong>line passengers face. A complicating factor in considerations on health care safety is the<br />
fact that it is even less tangible than <strong>air</strong> <strong>transport</strong> safety or nuclear safety. We use the words<br />
‘health care <strong>risk</strong>s’ for injuries resulting from a medical intervention, but not for those due to<br />
the underlying condition <strong>of</strong> the patient. In <strong>transport</strong>ation and other industries, safety is<br />
usually ‘measured’ by the numbers <strong>of</strong> dead and injured, but measuring the safety <strong>of</strong> the<br />
health care industry is not so straightforward. Patients in hospitals are already ‘severely<br />
injured’ and some patients will die even when they receive ‘safe’ health care. Whether or<br />
not such deaths are preventable is <strong>of</strong>ten difficult to determine. If a patient has surgery and<br />
dies from pneumonia he or she got postoperatively it could be the result <strong>of</strong> poor hand<br />
washing by the surgeon (preventable). But the patient could also have carried the infection<br />
already before the operation where the surgery and resulting weakening <strong>of</strong> the immune<br />
system allowed full development <strong>of</strong> the pneumonia (not or at least less preventable). This is<br />
one <strong>of</strong> the reasons why data on health care safety are difficult to obtain, and are at best<br />
estimates. This may also be one <strong>of</strong> the reasons why probabilistic <strong>risk</strong> assessment is not<br />
commonly performed in the health care industry. Yet causal <strong>models</strong> are routinely and<br />
successfully used, not for safety assessment but for diagnostic analysis. Bayesian Belief<br />
Nets (see section 7.2.2) are very suitable for diagnostic analysis, as the <strong>models</strong> take<br />
advantage <strong>of</strong> the ability to update the model when observations have been made. The<br />
representation <strong>of</strong> the <strong>models</strong> as influence diagrams is considered to be helpful when<br />
communication among experts <strong>of</strong> probabilistic relationships is important [Burnside et al<br />
2006, Owens et al 1997, Onisko et al 1999]. The latter observation is a relevant lesson for<br />
causal modelling <strong>of</strong> <strong>air</strong> <strong>transport</strong> safety. A causal model can indeed be a tool for<br />
communication, not from the government to the general public, as the Dutch Ministry <strong>of</strong><br />
Transport initially envisioned (see Chapter 4), but for communication amongst experts.<br />
Health care safety: Going to a hospital is as <strong>risk</strong>y as going to the Moon.<br />
The estimates that we have paint a sombre picture <strong>of</strong> the safety level <strong>of</strong> health care.<br />
According to Corrigan et al [2000], the probability <strong>of</strong> death due to preventable injuries<br />
resulting from medical intervention in U.S. hospitals in 1997 was approximately 1 in 1,000<br />
hospitalisations. This death rate per exposure is equivalent to the safety objective set by<br />
NASA in the 1960’s for crew loss in spaceflights to the moon and three orders <strong>of</strong><br />
magnitude worse than that in commercial aviation or the nuclear power industry. According<br />
to Amalberti et al [2005] the failure <strong>of</strong> the health care industry to achieve a level <strong>of</strong> safety<br />
that is comparable with commercial aviation and the nuclear power industry is caused by<br />
the culture <strong>of</strong> safety. The health care industry is characterised by chronic shortage <strong>of</strong> staff,<br />
systematic overtime working, overloaded work schedules and excessive fatigue on the job<br />
[Van der Heijden 2006]. Surgeons have the status and self-image <strong>of</strong> a craftsman rather than<br />
adopting a position that values equivalence among their ranks. In the early days <strong>of</strong> aviation,<br />
pilots also had such a ‘craftsman’ aura. This image was maintained by ‘heroes’ such as the<br />
crew <strong>of</strong> the KLM Douglas DC-2 ‘Uiver’ that won the London-Melbourne race in 1934<br />
[Nater 1983], but disappeared when <strong>air</strong> <strong>transport</strong> became a mass product and passengers are<br />
now accustomed to the notion that all pilots are equivalent to one another in their skills. In<br />
modern surgery, such ‘craftmanship’ still exist. Historical and cultural precedents and<br />
beliefs on performance and autonomy have resulted in an attitude to obtain a specified high<br />
level <strong>of</strong> production, no matter what it takes. The low level <strong>of</strong> safety does not arise from<br />
incompetence but from the experts who challenge the boundaries <strong>of</strong> their own maximum<br />
performance [Amalberti et al 2005]. The failure to accept that there are limits to maximum<br />
performance is one <strong>of</strong> the barriers that prevents the health care industry from achieving<br />
‘ultrasafety’.<br />
92
6.7. Conclusions for this section<br />
The purpose <strong>of</strong> most <strong>risk</strong> <strong>models</strong> in other industries is primarily to be able to conduct<br />
probabilistic <strong>risk</strong> analysis <strong>of</strong> the system including technical elements as well as human<br />
operators and management systems. Inclusion <strong>of</strong> human and organisational factors in the<br />
<strong>models</strong> is considered essential because they have a strong effect on safety and are, to some<br />
extent, easily influenced by managerial decisions.<br />
The way in which probabilistic <strong>risk</strong> <strong>models</strong> were introduced in the nuclear power industry,<br />
manned spaceflight, and the oil and gas industry followed a similar pattern. Traditionally,<br />
<strong>risk</strong> assessment methods were deterministic and qualitative. Probabilistic <strong>risk</strong> analysis<br />
methods were occasionally applied but were not seen by everyone as an improvement over<br />
the traditional methods. Lack <strong>of</strong> data to populate the <strong>models</strong>, lack <strong>of</strong> transparency and<br />
failure to adequately represent human and organisational performance were mentioned as<br />
weak points. However, almost within a single decade several major accidents 52 resulted in<br />
regulatory changes that forced the introduction <strong>of</strong> probabilistic <strong>risk</strong> <strong>models</strong> for system-wide<br />
analysis. Even then it was a slow process, and it took a long time to develop methods and<br />
<strong>models</strong> that are considered acceptable. It is recognised that these methods should not be<br />
used as a substitute for the traditional approaches, but as a complement. Traditional<br />
approaches are fail safe design and ‘defence in depth’, detailed regulatory requirements to<br />
assure safety and applying competent judgement to determine that a <strong>risk</strong> is acceptably low.<br />
A probabilistic, model based approach allows representation and analysis on dependencies<br />
and interactions among system components, including human operators. A probabilistic<br />
model based approach can identify possible flaws in the fail safe design or defence in depth<br />
concept, (e.g. generated by common cause failures), it can be used in cases where detailed<br />
regulatory requirements are absent but instead a target safety level is posed, and it is<br />
informative when the complexity practically prevents the application <strong>of</strong> ‘competent<br />
judgement’ for safety analysis. The combination <strong>of</strong> qualitative, deterministic and<br />
quantitative probabilistic methods allows <strong>risk</strong> informed regulation and decision-making.<br />
Yet there is still sometimes resistance, when people believe that the money spent in<br />
quantitative safety analysis could be better invested in improving the system directly.<br />
Because <strong>of</strong> the many assumptions that have to be made in the <strong>models</strong>, the results <strong>of</strong> the<br />
analyses are at times considered to be too subjective to be used for decision support. It is<br />
only when people realise that there are no alternatives, that current decision making is even<br />
more subjective, and that complex integrated systems require systematic and consistent<br />
analysis, that people come to appreciate the value <strong>of</strong> causal <strong>risk</strong> <strong>models</strong>. Traditionally,<br />
probabilistic <strong>risk</strong> <strong>models</strong> take account <strong>of</strong> technical systems and human operators but do not<br />
include an explicit representation <strong>of</strong> the possible impact <strong>of</strong> organisation and management<br />
on safety performance. It is generally recognised that organisational factors should be<br />
included, but analysing and modelling the complexities <strong>of</strong> a human organisation has proven<br />
to be a difficult task (see section 9.2 for a more elaborate discussion on this topic). To get<br />
rid <strong>of</strong> the variation in results <strong>of</strong> <strong>risk</strong> analysis, the method to be applied is sometimes<br />
prescribed in regulation.<br />
Based on these experiences it could be expected that introduction <strong>of</strong> causal <strong>risk</strong> <strong>models</strong> in<br />
<strong>air</strong> <strong>transport</strong> will be similarly jerkily and it can take decades before the industry has fully<br />
accepted the use <strong>of</strong> quantitative <strong>risk</strong> <strong>models</strong>, even though <strong>risk</strong> <strong>models</strong> are, for some specific<br />
52 In the process industry is was the Seveso calamity (1976), in the nuclear power industry<br />
it was the Three Mile Island accident (1979), in manned spaceflight the Challenger<br />
explosion (1986), and in the oil and gas industry the Piper Alpha disaster (1988).<br />
93
problems, already well accepted in <strong>air</strong> <strong>transport</strong> (for instance the ICAO collision <strong>risk</strong><br />
model, see section 4.3.6). Data to populate the model, transparency <strong>of</strong> the <strong>models</strong> and the<br />
representation <strong>of</strong> human and organisational influences are important to promote and<br />
support the development. It is also essential to state from the outset that the <strong>models</strong> should<br />
be used as a complement rather than as a replacement <strong>of</strong> current practice. The use <strong>of</strong><br />
diagnostic <strong>models</strong> in the health care industry demonstrates that such <strong>models</strong> are indeed<br />
suitable instruments for communication among experts on probabilistic relationships and to<br />
provide a coherent representation <strong>of</strong> domain knowledge under uncertainty.<br />
94
Chapter 7. Modelling<br />
A causal <strong>risk</strong> model is a mathematical object. It can be regarded as being composed <strong>of</strong> a<br />
representation scheme or conceptual model and a computational engine. Several methods<br />
exist that can be used for model representation, and these all have different mathematical<br />
properties and limitations. This chapter addresses the characteristics <strong>of</strong> the most important<br />
and most frequently used modelling techniques. It starts with a definition <strong>of</strong> a causal model<br />
as adopted in chapter 3. The relevancy <strong>of</strong> the model representation is discussed. The<br />
relevant modelling methods are described, including a brief overview <strong>of</strong> strengths and<br />
weaknesses. The information is then used to draw a conclusion on which modelling<br />
technique or set <strong>of</strong> techniques is most suitable for aviation causal <strong>risk</strong> <strong>models</strong> by comparing<br />
their (mathematical) properties with the causal model requirements.<br />
7.1. Model representation<br />
According to the definition adopted in section 3.7, a causal model is a mathematical object<br />
that provides an interpretation and computation <strong>of</strong> causal queries about the domain [Galles<br />
& Pearl 1998]. What does this mean? First, a causal model is a mathematical object. This<br />
means that building causal <strong>models</strong> will inevitably require some mathematics. But it does<br />
not necessarily imply that the output <strong>of</strong> the model is quantitative. Second, the domain must<br />
be specified. In our case the domain is aviation safety, but obviously this domain, or the<br />
scope, must be defined more strictly 53 . Third, the model provides an interpretation. It is just<br />
one way <strong>of</strong> looking at reality; there may be others that are different without being<br />
necessarily wrong.<br />
The causal model definition <strong>of</strong> section 3.7 also implies that a causal <strong>risk</strong> model can be<br />
regarded as being composed <strong>of</strong> a representation scheme or conceptual model and a<br />
computational engine [Van Waveren et al 1999, Labeau et al 2000]. The representation<br />
scheme is the interface between the computational engine and the user <strong>of</strong> the model. The<br />
representation scheme is the primary means <strong>of</strong> communicating the model to the outside<br />
world [Van Waveren et al 1999]. Many users will regard the representation scheme as ‘the<br />
model’. The representation scheme must therefore be comprehensive and, most<br />
importantly, transparent without being an oversimplification. Representation schemes can<br />
be useful for verification <strong>of</strong> the model’s internal consistency, its applicability to the actual<br />
system being modelled and as an aid to the modelling process itself [Labeau et al 2000]. In<br />
a classical probabilistic <strong>risk</strong> assessment the representation scheme consists <strong>of</strong> accident<br />
scenarios in the form <strong>of</strong> <strong>of</strong> Event Sequence Diagrams and fault trees. This representation<br />
was selected in the WASH 1400 study (see the section on nuclear power, 6.1) and also in<br />
NASA’s s<strong>of</strong>tware tool for quantitative <strong>risk</strong> assessment [Groen et al 2006]. The<br />
accompanying computational engine is mathematically simple, combining only Boolean<br />
algebra and basic probability theory. The price that has to be paid for this are the<br />
simplifications and compromises which need to be made to represent reality as a static<br />
series <strong>of</strong> Boolean expressions. To overcome this limitation other methods have been<br />
developed that are more complex than fault trees and event sequences and are<br />
53 E.g. military or civil aviation, commercial or non-commercial, primary and/or subsidiary<br />
processes (see also Appendix B).<br />
95
computationally more intensive. A drawback <strong>of</strong> these advanced methods is that the<br />
corresponding representation schemes do not always provide an intuitive understanding <strong>of</strong><br />
the scenarios (see for instance the sections on Bayesian belief nets and Petri nets in this<br />
chapter). The classical fault tree / event sequence diagram approach on the other hand is<br />
self-explanatory 54 .<br />
The representation schemes <strong>of</strong> <strong>models</strong> used for safety assessments <strong>of</strong> nuclear powerplants<br />
are, at the highest level <strong>of</strong> abstraction, relatively simple. This is achieved by the<br />
methodology (event sequence diagrams) and by a functional or physical decomposition.<br />
The top level <strong>of</strong> the model represents only top level functions or physical components.<br />
Compared to the aviation system, a nuclear powerplant is a simpler system. It has only a<br />
few inherent classes <strong>of</strong> design features that will keep it working, and a few that will cause<br />
problems. The fundamentals involved (in accident scenarios) do not exhibit many feedback<br />
loops or multiple paths for recovery. In comparison with a nuclear powerplant, the aviation<br />
system has more design features that keep it working and that can cause problems, and<br />
there are more feedback loops. The greater role <strong>of</strong> the human operator (pilots, ATC<br />
controllers, maintenance technicians) and their interactions is one <strong>of</strong> the main causes <strong>of</strong> the<br />
greater complexity. Because <strong>of</strong> this greater complexity, there may be a need for a second<br />
high-level decomposition <strong>of</strong> the aviation system. In the probabilistic <strong>risk</strong> assessment for the<br />
Space Shuttle, a second decomposition is made by considering the mission time-line and<br />
distinguishing the various operational phases <strong>of</strong> the shuttle (ascent, orbit, descent) [Groen et<br />
al 2006]. A similar approach in <strong>air</strong> <strong>transport</strong> would be a break down into flight phases: taxi<br />
out, take-<strong>of</strong>f, climb, cruise, descent, approach, landing, taxi in and standing. But the<br />
operational phases <strong>of</strong> the shuttle and the phases <strong>of</strong> flight <strong>of</strong> an <strong>air</strong>craft are not independent.<br />
Hazards that originate in one phase may create a <strong>risk</strong> in a later phase. An example is the<br />
accident with the Space Shuttle Columbia; a failure during launch resulted in a catastrophe<br />
during re-entry 17 days later (see infobox Space Shuttle Columbia accident). Whenever a<br />
decomposition is made, a mechanism must be in place that keeps track <strong>of</strong> all possible<br />
dependencies between components. A modelling method that allows easy handling <strong>of</strong> such<br />
interdependencies between decomposition elements is desirable.<br />
Space Shuttle Columbia accident<br />
The Space Shuttle<br />
The Space Shuttle consists <strong>of</strong> an Orbiter, an External Tank and two Solid Rocket Boosters.<br />
The External Tank and Solid Rocket Boosters are only used during launch <strong>of</strong> the vehicle.<br />
The External Tank accommodates 543 m 3 <strong>of</strong> liquid oxygen and 1458 m 3 <strong>of</strong> liquid<br />
hydrogen. In order to keep the super-cold propellants from boiling and to prevent ice from<br />
forming on the outside <strong>of</strong> the tank while it is sitting on the launch pad, the External Tank is<br />
covered with a one-inch-thick coating <strong>of</strong> insulating foam.<br />
The accident<br />
Mission STS-107 was the 113th in the Space Shuttle program and the 28th trip into space<br />
<strong>of</strong> the orbiter Columbia. Launch occurred at the Kennedy Space Center, launch pad 39A, on<br />
January 16, 2003. Approximately 82 seconds after launch, pieces <strong>of</strong> foam came <strong>of</strong>f the<br />
External Tank and damaged the left wing <strong>of</strong> Columbia. The orbiter was at an altitude <strong>of</strong><br />
65,860 feet, travelling at Mach 2.46 at the time <strong>of</strong> impact. The impact had no immediate<br />
consequences, the launch was otherwise uneventful and Columbia reached its planned orbit.<br />
54<br />
While a fault tree is self explanatory, this does not necessarily mean that it is also correct.<br />
Correctness should be tested as part <strong>of</strong> validation (Chapter 10).<br />
96
While Columbia was on-orbit, there was no indication <strong>of</strong> damage from the ascent foam<br />
impact. After a successful 17 day scientific mission, the crew <strong>of</strong> Columbia prepared the<br />
spaceship for deorbit, reentry and landing. Columbia successfully completed the deorbit<br />
burn over the Indian Ocean but during reentry the damage in the wing leading edge allowed<br />
hot gas intrusion onto the wing structure leading to extreme heating and eventual<br />
deformation <strong>of</strong> the left wing. While travelling at 200,700 feet and Mach 18, complete<br />
vehicle break-up occurred and all 7 crewmembers were killed [Columbia Accident<br />
Investigation Board 2003].<br />
The representation scheme is basically only a picture. The computational engine is the<br />
translation <strong>of</strong> this picture into mathematical equations and operations, allowing the user <strong>of</strong><br />
the model to perform analyses like sensitivity analysis or cut set identification. Because the<br />
computational engine is a (large) set <strong>of</strong> mathematical expressions it is not transparent to<br />
most engineers and safety managers. A s<strong>of</strong>tware tool that combines the function <strong>of</strong> the<br />
representation scheme and the computational engine is therefore essential. Such a tool will<br />
also make configuration control 55 , very important for complex <strong>models</strong>, a little less difficult.<br />
7.2. Modelling techniques<br />
This section provides a brief overview <strong>of</strong> techniques that can be used for causal <strong>risk</strong><br />
modelling. The basic characteristics <strong>of</strong> the methods are described and compared with<br />
requirements for use <strong>of</strong> a causal <strong>risk</strong> model as derived in previous sections. The intention <strong>of</strong><br />
this section is not to provide an exhaustive overview <strong>of</strong> available methodologies, but rather<br />
to describe the relevant and valuable ones that are currently being applied in aviation <strong>risk</strong><br />
modelling. These methods are used or proposed in the CATS model [Ale et al 2006, 2007,<br />
2008], Eurocontrol’s IRP [Perrin et al 2006], the FAA causal model [Mosleh et al 2004,<br />
Roelen et al 2008], TOPAZ [Blom et al 2001, 2006, 2008] and NASA’s Aviation System<br />
Risk Model (ASRM) [Luxhøj 2004]. A more exhaustive description <strong>of</strong> techniques is found<br />
in Labeau et al [2000], Bedford & Cooke [2001], Rouvroye & Van den Bliek [2002] and<br />
Everdij [2004].<br />
7.2.1 Boolean Trees<br />
Fault trees<br />
A fault tree is a graphic model <strong>of</strong> the various parallel and sequential combinations <strong>of</strong> faults<br />
that will result in the undesired event. The undesired event constitutes the top event in the<br />
fault tree diagram. In fault tree analysis an undesired state <strong>of</strong> the system is specified and the<br />
system is then analysed in the context <strong>of</strong> its environment and operation to find all credible<br />
ways in which the undesired event can occur [Vesely et al 1981]. A fault tree is composed<br />
<strong>of</strong> a number <strong>of</strong> symbols, see Figure 13.<br />
Fault trees are used to identify combinations <strong>of</strong> component failures or human errors that can<br />
lead to an undesired event (top event), which can be a system failure, a component failure<br />
(if regarded as a subsystem), a loss (degradation) <strong>of</strong> function, a human error, etc. The<br />
technique is preferred when combinations <strong>of</strong> failures are expected. The logic in fault trees is<br />
binary. Events (faults) either occur or not and the mathematical operations are in essence<br />
very simple.<br />
55<br />
Configuration control is the process for the proposal, review, acceptance, implementation<br />
and documentation <strong>of</strong> changes to the model.<br />
97
BASIC EVENT - A basic initiating fault requiring no further<br />
development<br />
INTERMEDIATE EVENT - A fault event that occurs because <strong>of</strong> one or<br />
more antecedent causes acting through logic gates<br />
UNDEVELOPED EVENT – An event which is not further developed<br />
either because it is <strong>of</strong> insufficient consequence or because<br />
information is unavailable<br />
AND gate - Output fault occurs if all <strong>of</strong> the input faults occur<br />
OR gate - Output fault occurs if at least one <strong>of</strong> the input faults occur<br />
Figure 13: Basic Fault Tree symbols. Source: Vesely et al [1981].<br />
A fault tree is quantified by establishing the probability <strong>of</strong> occurrence <strong>of</strong> the base events.<br />
Once those are defined the probability <strong>of</strong> the top event can be calculated. The great<br />
advantage <strong>of</strong> the method is that a very simple set <strong>of</strong> rules and symbols provides the<br />
mechanism for analyzing very complex systems [Ericson 1999]. One <strong>of</strong> the characteristics<br />
<strong>of</strong> a fault tree is that safety influencing factors that occur much before the occurrence <strong>of</strong> the<br />
top event (sometimes referred to as latent factors and <strong>of</strong>ten management/organisational in<br />
nature) are located deep in the tree structure. In practice, this means that in order to capture<br />
these factors in the fault tree, the tree must be expanded enormously. Beyond about 5 or 6<br />
levels <strong>of</strong> a fault tree however the events are influenced very strongly by many to many<br />
influences <strong>of</strong> common mode factors such as competence, procedures, maintenance, etc.<br />
This leads to a combinatorial explosion <strong>of</strong> the trees. Computer power can also not solve this<br />
problem, since the assumption in fault tree logic is that branches are independent events<br />
(i.e. not linked by common cause). Currently there is no definitive solution for the handling<br />
<strong>of</strong> common modes in a fault tree. Hence the breaking down <strong>of</strong> the fault tree must stop at the<br />
level where common mode influences start. The elements at that level must be linked to the<br />
most important common modes through an interface with another sort <strong>of</strong> model. Another<br />
drawback <strong>of</strong> Fault Trees is that they are particularly limited for portraying dynamic aspects<br />
and iterative loops.<br />
Event trees and Event Sequence Diagrams<br />
An event tree (Figure 14) represents the possible consequence sequences <strong>of</strong> a hazardous<br />
situation or event, called an initiating event. The construction <strong>of</strong> an event tree begins with<br />
the specification <strong>of</strong> an initiating event. The following levels <strong>of</strong> the tree describe the working<br />
<strong>of</strong> safety systems that are able to counteract, recover or mitigate the effects <strong>of</strong> the initiating<br />
event. For each safety system, there are two branches in the tree corresponding to success<br />
or failure <strong>of</strong> the safety system. An event tree can be particularly helpful for developing<br />
counter measures to reduce the consequences <strong>of</strong> the initiating event.<br />
98
Initiating<br />
event<br />
Safety<br />
system 1<br />
Figure 14: Event tree<br />
failure<br />
Safety<br />
system 2<br />
To quantify event trees, the likelihood <strong>of</strong> occurrence <strong>of</strong> the <strong>risk</strong> initiating event as well as<br />
the failure and success probabilities <strong>of</strong> the safety systems are needed. Because fault trees<br />
are <strong>of</strong>ten used to provide the failure probabilities <strong>of</strong> systems, and because they both use<br />
Boolean logic, fault trees and event trees are regularly combined.<br />
An Event Sequence Diagram (ESD) (Figure 15) is a representation <strong>of</strong> an event tree which<br />
distinguishes different types <strong>of</strong> events. The event sequence starts with an initiating event<br />
such as a perturbation that requires some kind <strong>of</strong> response from operators or one or more<br />
systems [Stamatelatos 2002]. Along each path, pivotal events are identified as either<br />
occurring or not occurring with paths leading to different end states. Each path through the<br />
flowchart is a scenario.<br />
Initiating<br />
event<br />
Pivotal<br />
event<br />
Figure 15: Event Sequence Diagram<br />
failure<br />
Safety<br />
system 3<br />
success<br />
success<br />
success<br />
failure<br />
yes Pivotal<br />
event<br />
yes<br />
no no<br />
Consequence 1<br />
Consequence 2<br />
Consequence 3<br />
Consequence 4<br />
End state<br />
End state<br />
End state<br />
Conditional operators can be included to represent different outcomes depending on<br />
whether the condition is met or not. Figure 16 shows types <strong>of</strong> events and condition in an<br />
ESD and their iconic representation. Intentionally, the building blocks <strong>of</strong> the scenarios are<br />
kept broad and generic to cover many ‘similar’ situations. The detailed specific or possible<br />
causes or contributing factors <strong>of</strong> these events are not directly <strong>of</strong> interest at the scenario<br />
level. Event Sequence Diagrams are <strong>of</strong>ten combined with fault trees. In practice, Event<br />
Sequence Diagrams are typically used to portray the progression <strong>of</strong> events over time, while<br />
99
fault trees best represent the logic corresponding to the failure <strong>of</strong> complex systems<br />
[Stamatelatos 2002]. Fault trees are then used to model initiating and pivotal events in<br />
Event Sequence Diagrams in sufficient detail. The initiating and pivotal events in the Event<br />
Sequence Diagram are the top events in the fault trees. Initiating events can then be<br />
regarded as the centre <strong>of</strong> a bow-tie diagram that is sometimes used to represent accident<br />
sequences, see for instance Roelen et al [2000a] and Figure 17. The left hand side <strong>of</strong> the<br />
bowtie represents the causes <strong>of</strong> the initiating event, the right hand side the effects <strong>of</strong> the<br />
initiating event. This makes the bowtie representation valuable for analysis <strong>of</strong> <strong>risk</strong><br />
prevention measures, which will be represented in the left hand side, and <strong>risk</strong> alleviation or<br />
mitigation measures, which will be represented in the right-hand side <strong>of</strong> the bowtie.<br />
no<br />
yes<br />
Initiating event: The first event in an<br />
ESD which initiates a sequence <strong>of</strong> events<br />
terminating in an end state.<br />
Pivotal event: An event which has two<br />
outcomes, typically ‘yes’ and ‘no’,<br />
corresponding to event occurrence and<br />
non-occurrence.<br />
End state: It is the terminating point <strong>of</strong><br />
an ESD scenario. An ESD can have<br />
multiple end states.<br />
Comment box: Used for providing<br />
information regarding the development <strong>of</strong><br />
the accident sequence.<br />
Figure 16: Types <strong>of</strong> events in an ESD and their iconic representation.<br />
100
Fault Tree<br />
Proximate causes<br />
Initiating<br />
event<br />
Figure 17: Bow-tie schematic<br />
7.2.2 Bayesian Belief Nets<br />
A Bayesian Belief Net (BBN) (Figure 18) is an acyclic directed graph in which nodes<br />
represent variables and connecting arcs represent conditional dependence. Acyclic means<br />
that it contains no path from a variable back to itself. Conditional dependence is the<br />
mathematical equivalent <strong>of</strong> ‘causality (see also section 3.2). It is expressed as conditional<br />
probabilities, which thus quantify the strength <strong>of</strong> the causality in the model. A high<br />
conditional probability refers to strong causality, a low conditional probability indicates<br />
weak causality. ‘Bayesian’ refers to Bayesian 56 probability theory which is used to explore<br />
causal relations.<br />
A B<br />
C<br />
Figure 18: Bayesian Belief Net schematic<br />
Event Tree<br />
Accident scenarios<br />
End states<br />
56<br />
Thomas Bayes (1702-1761) was a British mathematician who developed a solution to the<br />
problem <strong>of</strong> ‘inverse probability’. It was published posthumously and is now known as<br />
Bayes’ Theorem.<br />
101
Bayesian Belief Nets are convenient tools for making inferences about uncertain states<br />
when limited information is available, and are therefore frequently used for diagnosis, with<br />
for instance applications in medical science [Jensen 1995]. But the use <strong>of</strong> BBNs is not<br />
necessarily restricted to diagnostic <strong>models</strong>; they can also be used instead <strong>of</strong> fault trees and<br />
event trees in a quantitative <strong>risk</strong> assessment. The advantages <strong>of</strong> a BBN over a fault tree is<br />
that it allows multi valued variables instead <strong>of</strong> binary events as in a fault tree, local<br />
dependencies among components instead <strong>of</strong> the classical assumption on fault trees that<br />
events are statistically independent and s<strong>of</strong>t interactions among component behaviour<br />
instead <strong>of</strong> deterministic AND/OR interactions as in a fault tree. Experience has also shown<br />
that BBNs are an attractive modelling tool in which the user readily recognizes his problem<br />
[Roelen et al 2004b]. The graphical problem representation is also the user interface with<br />
which the user can do ‘what if’ analysis. BBNs come in various colours and shapes. For the<br />
purpose <strong>of</strong> this research, discrete BBNs and distribution free continuous BBNs are<br />
described in more detail because both have been proposed for use in causal <strong>risk</strong> <strong>models</strong> for<br />
<strong>air</strong> <strong>transport</strong>.<br />
Discrete BBN<br />
In discrete BBNs, the nodes represent discrete variables, e.g., ‘true’ and ‘false’ or ‘bad’,<br />
‘medium’, ‘good’, or ‘1’, ‘2’, ‘3’, ‘4’, and ‘5’. Conditional probability tables specify the<br />
dependencies between nodes. The main drawback <strong>of</strong> discrete BBNs is the excessive<br />
assessment and maintenance burden. The number <strong>of</strong> probabilities that must be assessed and<br />
maintained for a child node is exponential to the number <strong>of</strong> parents. If a given node X has<br />
K parent ‘influences’ where each influence originates from a chance node with M possible<br />
outcomes, then the conditional distribution <strong>of</strong> X must be assessed for each <strong>of</strong> the M K input<br />
influences. This exorbitant burden can only be reduced by grossly coarse-graining the<br />
outputs from nodes and /or introducing simplifying assumptions for the compounding <strong>of</strong><br />
influences. In practice, chance nodes are <strong>of</strong>ten restricted to two possible values, just like in<br />
fault trees [Kurowicka et al 2005]. Discrete BBNs are not very flexible with respect to<br />
changes in modelling. If we add one parent node, then we must do again all previous<br />
quantification for the children <strong>of</strong> this node. In a fluid modelling environment this is a<br />
serious drawback. We would much prefer to be able to add a new node by adding one<br />
number for each child node, indicating influence, without re-doing the previous<br />
quantification, particularly in cases where data are sparse and expert judgement is needed to<br />
quantify the influences. This stresses some <strong>of</strong> the weakest features <strong>of</strong> discrete BBN<br />
methodologies. To overcome these difficulties, distribution free continuous BBNs have<br />
been developed.<br />
Distribution free continuous BBN<br />
Kurowicka & Cooke [2004] introduced an approach to continuous BBNs using vines 57<br />
together with copulas 58 that have the zero independence property. In this approach, nodes<br />
are associated with arbitrary continuous distributions and arcs with conditional rank<br />
correlations. For non-mathematicians this whole concept is difficult to comprehend, but it<br />
comes with a significant advantage; the assessment burden for this type <strong>of</strong> BBN is limited<br />
to a one dimensional distribution for each node and for each arc a conditional rank<br />
correlation. Complexity is linear with the number <strong>of</strong> parents, rather than exponential.<br />
Elicitation procedures for conditional rank correlations are described in Morales et al<br />
57<br />
A vine is a graphical model for dependent random variables [Bedford & Cooke 2002].<br />
58<br />
The copula <strong>of</strong> two continuous random variables X and Y is the joint distribution <strong>of</strong><br />
(FX(X), FY(Y)) [Bedford & Cooke 2002].<br />
102
[2008]. While distribution free continuous BBNs as described in Kurowicka & Cooke<br />
[2004] and Morales et al [2008] have significant advantages, these come at a price. One<br />
disadvantage <strong>of</strong> this method is that it fails to capture non-monotonic dependencies.<br />
Dependencies that show large jumps for specific threshold parameter values may also not<br />
be properly captured. Perhaps the biggest disadvantage is the lack <strong>of</strong> transparency.<br />
Probability distributions are more complicated than simple failure/success probabilities and<br />
a rank correlation is not intuitive for non-mathematicians. Unlike fault trees, calculations <strong>of</strong><br />
even simple <strong>models</strong> are difficult to reproduce with pencil and paper. The advantage <strong>of</strong><br />
course is the added functionality <strong>of</strong> these types <strong>of</strong> <strong>models</strong>, but we should be very careful<br />
only to apply them to those problems in which such functionality is indeed necessary. This<br />
technique was applied in the CATS model [Ale et al 2007] for the Dutch Ministry <strong>of</strong><br />
Transport and Water Management.<br />
Using BBNs; lessons learned from CATS<br />
The CATS model is unique in the sense that the aviation <strong>risk</strong> model is (mathematically)<br />
represented as a single (large) BBN. The network representation is very suitable for<br />
describing the interdependencies between system elements. This combination <strong>of</strong> systemwide<br />
representation and representing the system as a network makes the CATS model a<br />
unique and potentially powerful instrument. But in the CATS model, the computational<br />
engine is mathematically complex relative to the model structure and the data. This is the<br />
result <strong>of</strong> the request by the Dutch Ministry <strong>of</strong> Transport to take proper account <strong>of</strong><br />
interdependencies and uncertainties. This led to using a single BBN for the model,<br />
introducing variables with continuous distributions to avoid a computational explosion.<br />
Dependencies between model elements are represented by conditional and unconditional<br />
rank correlations and many <strong>of</strong> these correlations are retrieved by expert judgement using a<br />
conditional quantile approach.<br />
X 2<br />
X 3<br />
X 1<br />
... ...<br />
Figure 20: Dependence between variables represented in an influence diagram.<br />
To elicit the unconditional rank correlation r1,2, the expert is asked the following:<br />
Suppose that the variable X2 was observed above its q th quantile. What is the probability<br />
that also X1 will be observed above its q th quantile?<br />
103<br />
...<br />
X n
The approach for CATS was with q = 0.5 (the median) and assuming the minimum<br />
information copula realizing the rank correlations in the joint distribution. To assess the<br />
conditional rank correlation r1,3│2 the expert is asked the following question:<br />
Suppose that not only variable X2 but also X3 were observed above their median. What is<br />
the probability that also X1 will be observed above its median value?<br />
The possible answers to this question are constrained by the answer to the first question.<br />
For instance if the expert believes that X2 and X1 are fully correlated this means that X1<br />
would be completely explained by X2. In this situation X3 cannot have additional influence<br />
on X1 and the answer to the second question cannot be anything else but 0. In general the<br />
upper and lower band <strong>of</strong> possible answers are not self-evident or easy to calculate. They<br />
have to be calculated on-line during the elicitation to help experts avoiding inconsistencies<br />
in their answers [Morales et al 2008]. All additional required conditional rank correlations<br />
are obtained by asking increasingly ‘nested’ questions, the final question becoming<br />
Suppose that X2 and X3 ....and Xn were observed above their medians. What is the<br />
probability that also X1 will be observed above its median value?<br />
The nested constraints on successive conditional probabilities make it even more complex<br />
and requires the experts to imagine combinations <strong>of</strong> events which are very difficult to<br />
grapple with, like for instance the following example from Roelen et al [2007]:<br />
Suppose that you select 1,600,000 flights at random. Suppose that out <strong>of</strong> the 1,600,000 you<br />
select 800,000 for which crew suitability is at least equal to its median value and out <strong>of</strong><br />
those 800,000 you select 400,000 for which <strong>air</strong>craft generation is also at least equal to its<br />
median value. Additionally suppose that out <strong>of</strong> these 400,000 you select 200,000 for which<br />
weather is also at least equal to its median value and out <strong>of</strong> the last 200,000 you select<br />
100,000 for which abnormal situation is also at least equal to its median value. What is<br />
your probability that in this (not randomly chosen) pool, the median value <strong>of</strong> flight crew<br />
errors will be more than your median estimate?<br />
Answering this question requires mental skills which are, most probably, unrelated to what<br />
it takes to be an operational expert. The apparent necessity to help the expert in answering<br />
the questions also justifies some real concern regarding this method. If the expert is not able<br />
to provide consistent answers without help, how can we be confident that the answers are<br />
reliable estimates <strong>of</strong> the probabilities we want to obtain? Another considerable problem is<br />
the fact that, as the upper and lower bounds <strong>of</strong> possible values are not self-evident, there is<br />
hardly any possibility for peer review. The values themselves are difficult to interpret as<br />
they do not provide a direct overview <strong>of</strong> the relative strength <strong>of</strong> the dependencies.<br />
Mathematically it is all correct, but practically this approach introduces a lot <strong>of</strong> uncertainty,<br />
the exact size <strong>of</strong> which is unknown because there are insufficient ways to determine if the<br />
expert’s answer makes sense or not.<br />
A different approach is to assume that the dependence <strong>of</strong>, say, X1 and X2, is independent <strong>of</strong><br />
the value <strong>of</strong>, say, X3. Under this assumption we ask the experts to estimate the<br />
unconditional rank correlation r1,2 (similar to the way described above) but the other<br />
dependences are obtained by asking the expert to estimate them as a portion <strong>of</strong> the<br />
dependence <strong>of</strong> X1 and X2. In this case, a single simplifying assumption leads to less<br />
complicated questions. The simplifying assumption in itself creates additional uncertainty 59 ,<br />
but because the questions for the experts become less complicated, the approach is much<br />
59<br />
Cases in which the dependence between X1 and X2 depends on the value <strong>of</strong> X3 cannot be<br />
accurately represented. An example would be X1 alertness, X2 drug use (e.g.<br />
dexchlorpheniramine, an antihistamine) and X3 the use <strong>of</strong> alcohol [Starmer et al 1994].<br />
104
more credible to the experts and their answers will allow peer review. This simpler<br />
approach was adopted at a later stage in the development <strong>of</strong> the CATS model.<br />
This example shows how modelling solutions for one problem may create difficulties<br />
somewhere else. This should be closely guarded by the development team and requires<br />
good coordination among the different team members.<br />
7.2.3 Petri nets<br />
A Petri 60 net is a graphical and mathematical modelling tool for describing and analysing<br />
distributed systems. A directed graph structure is used to represent a Petri Net (Figure 19).<br />
It is composed <strong>of</strong> a set <strong>of</strong> places and transitions, connected by arcs, and an initial marking<br />
representing the number <strong>of</strong> tokens in each place at time t = 0. Arcs are either from a place<br />
to a transition or from a transition to a place. In modelling, using the concept <strong>of</strong> conditions<br />
and events, places represent conditions and transitions represent events. In graphical<br />
representation, places are drawn as circles, transitions as bars or boxes. The execution <strong>of</strong><br />
the Petri net is by means <strong>of</strong> movements <strong>of</strong> tokens among places. The presence <strong>of</strong> a token in<br />
a place is interpreted as indicating the truth <strong>of</strong> the condition associated with that place.<br />
Events in one box trigger state changes in the boxes to which it is connected by directional<br />
arrows. The possibility <strong>of</strong> changing the systems characteristics over time gives a Petri net<br />
its dynamic character. When more complicated systems are to be modelled with Petri nets,<br />
extensions to the original concept have to be made, thus creating high level Petri nets. The<br />
three most important extensions are the possibility to model multiple in- and outputs, the<br />
addition <strong>of</strong> types <strong>of</strong> influence (illustrated by means <strong>of</strong> colour), and the addition <strong>of</strong> time by<br />
means <strong>of</strong> time stamps.<br />
Dynamically Coloured Petri Nets can be used to represent Piecewise Deterministic Markov<br />
Processes (PDPs) [Everdij & Blom 2005]. PDPs are useful to describe complex continuous<br />
time stochastic processes. A PDP consists <strong>of</strong> a discrete valued component and a continuous<br />
valued component. The discrete valued component <strong>models</strong> the mode process. At discrete<br />
times, the discrete state may switch to another mode value which is selected according to<br />
some probabilistic relation. The continuous valued component <strong>models</strong> the drift process as a<br />
solution <strong>of</strong> a differential equation that depends on the discrete state. At discrete moments in<br />
time, the continuous state may jump according to some relation, which makes it only<br />
piecewise continuous [Everdij & Blom 2005].<br />
p1<br />
t1<br />
p2<br />
Figure 19: Petri Net<br />
t2<br />
t3<br />
t4<br />
p3<br />
60<br />
Named after the German mathematician Carl Adam Petri.<br />
105
PDPs can be used to construct <strong>models</strong> in which both discrete and continuous variables<br />
evolve over continuous time, possibly affected by probabilistic disturbances [Blom et al<br />
2001]. Quantitative analysis <strong>of</strong> the Petri net can be performed by Monte Carlo simulation.<br />
An advantage <strong>of</strong> Petri nets is that the influence <strong>of</strong> time and process dynamics on scenarios<br />
is captured. This is an added value when describing systems with many interactions or<br />
feedback loops. Air <strong>transport</strong> is typically a system with many interactions, e.g.<br />
communication between flight crews and <strong>air</strong> traffic controllers. Examples <strong>of</strong> application <strong>of</strong><br />
Petri nets for aviation <strong>risk</strong> assessment have demonstrated the power <strong>of</strong> Petri nets in<br />
combination with Monte Carlo simulations for handling interactions [Blom et al 2008].<br />
Petri Nets in general do not provide an easy understanding <strong>of</strong> scenarios, because the<br />
representation is less intuitive than for instance an event tree [Murata 1989].<br />
7.3. Size, depth, complexity and uncertainty<br />
For practice, but not necessarily scientific reasons, a limit must be set on the size <strong>of</strong> the<br />
causal model and the depth <strong>of</strong> causes in the model and the attachment <strong>of</strong> common mode<br />
influences and adaptive mechanisms. The degree <strong>of</strong> detail and sophistication <strong>of</strong> any given<br />
part <strong>of</strong> the model should be decided upon based on some sort <strong>of</strong> sensitivity analysis <strong>of</strong> how<br />
much that aspect could contribute to the overall <strong>risk</strong> figure. Only for major influences is<br />
further detailed modelling worthwhile. Another criterion is that a user has to see how a<br />
particular influence feeds to the ‘top event’. The required level <strong>of</strong> detail also depends on the<br />
purpose <strong>of</strong> the model, ranging from global <strong>risk</strong> assessment to detailed <strong>risk</strong> management.<br />
During development, a situation may easily arise in which every possible refinement <strong>of</strong> the<br />
model is considered necessary by the modellers, thereby losing track <strong>of</strong> the model’s<br />
intended use [LVNL 2001b]. In a peer review <strong>of</strong> a causal <strong>risk</strong> model feasibility study, a<br />
weakness <strong>of</strong> the causal <strong>risk</strong> model was described as “The quickly escalating complexities as<br />
one attempts to improve the fidelity <strong>of</strong> the model(s). This attribute can potentially soon<br />
overwhelm the output <strong>of</strong> the model or the value <strong>of</strong> the output. As a research tool, this may<br />
not be so critical, inasmuch as skilled analytical researchers are working with it; as it<br />
moves toward the potential end user (i.e. the Director <strong>of</strong> Flight Operations, the Safety<br />
Manager, etc.) the output must be sure and simple” [EAI 2002]. Developers should be<br />
keenly aware <strong>of</strong> this and should ensure that the complexity <strong>of</strong> the model is in balance with<br />
its intended use. A practical solution is to model first at a more aggregate level and add<br />
further detail in a next step, taking account <strong>of</strong> those elements to which the model appears to<br />
be sensitive or areas <strong>of</strong> specific interest (e.g. because one wants to analyse the effect <strong>of</strong><br />
certain proposed safety measures or other measures which might compromise safety).<br />
Essentially, stop rules for causal factor analysis are anchored to the applicable span-<strong>of</strong>control<br />
<strong>of</strong> the problem owner and the incident severity [Koornneef 2000]. Another natural<br />
point to stop detailing is at the point where our knowledge <strong>of</strong> the system becomes<br />
inadequate to properly describe the cause effect relations involved, or where the available<br />
data (through measurements, observations, or expert judgement) are insufficient for<br />
quantification. The size and depth <strong>of</strong> a causal <strong>risk</strong> model for <strong>air</strong> <strong>transport</strong> is not significantly<br />
limited by mathematical restrictions. Experience in the CATS model demonstrates that<br />
even if a causal <strong>risk</strong> model is represented as a single BBN with hundreds <strong>of</strong> nodes with<br />
continuous variables, this presents no insurmountable mathematical difficulties [Ale et al<br />
2007] and requires no more computational power than an <strong>of</strong>f the shelf personal computer<br />
[Ale et al 2008]. Even though the development <strong>of</strong> a causal <strong>risk</strong> model involves<br />
mathematical challenges such as the correct representation <strong>of</strong> dependencies and dynamic<br />
interactions, developing a causal <strong>risk</strong> model is not primarily a mathematical problem.<br />
Developing a causal <strong>risk</strong> model is much more a problem <strong>of</strong> assembling all available<br />
knowledge and data on a very large and complex system and unravelling this complexity<br />
106
into cause-effect relations that can be assembled in a model and presenting this information<br />
in a useful way.<br />
A distinct feature <strong>of</strong> the CATS model is its truly system-wide representation <strong>of</strong> aviation.<br />
Other <strong>models</strong>, such as Eurocontrol’s IRP and FAA’s model for SASO (see sections 4.3.4<br />
and 4.3.6), only represent a portion <strong>of</strong> the system (ATM and <strong>air</strong>line operations,<br />
respectively). Although these <strong>models</strong> are useful in their own right, a system-wide<br />
representation in a single model is an excellent way to capture possible interactions and<br />
most importantly to represent safety hazards that are created by interface problems between<br />
different aviation system elements.<br />
Any model inherently contains uncertainty and noise. An estimate <strong>of</strong> the degree <strong>of</strong><br />
uncertainty for intermediate model results is required to correctly interpret overall model<br />
results and also to identify those parts <strong>of</strong> the model for which further development is<br />
justified. It makes no sense to put a lot <strong>of</strong> effort into improving the accuracy <strong>of</strong> one part <strong>of</strong><br />
the model if this does not contribute to improvement <strong>of</strong> the overall result. The accuracy <strong>of</strong><br />
the model results are determined by the model structure, the mathematical operations being<br />
performed ‘inside’ the model and the data used to populate and feed the model. A correct<br />
balance between those three ingredients is desirable; it makes no sense to build, for<br />
example, a complex and detailed model structure when there is no data to populate the<br />
model. User requirements are important for determining what constitutes a ‘correct<br />
balance’.<br />
The functionality <strong>of</strong> techniques for causal modelling is inversely proportional to their<br />
transparency; greater functionality is p<strong>air</strong>ed with less transparency. Because <strong>of</strong> the<br />
importance <strong>of</strong> transparency, the model developers should choose a technique (or<br />
combination <strong>of</strong> techniques) that fits the functional requirements, instead <strong>of</strong> selecting a<br />
technique with more functionality than is actually required.<br />
7.4. Time dependency<br />
The ability to represent time as an independent variable does not follow directly from the<br />
user requirements. Yet the question whether or not time should be represented as an<br />
independent variable is important because <strong>of</strong> the consequences for the selection <strong>of</strong> the<br />
modelling method. The main question is whether dynamic behaviour is a significant factor.<br />
A system can be termed static with respect to <strong>risk</strong> when the behaviour <strong>of</strong> the system does<br />
not change rapidly with time. Strictly speaking, the aviation system, and in particular an<br />
<strong>air</strong>craft in flight, cannot be considered static for the purpose <strong>of</strong> <strong>risk</strong> analysis. The<br />
probability <strong>of</strong> some events changes over time. For example engine failure is more probable<br />
when high engine power is selected (such as during take-<strong>of</strong>f). The available time for<br />
recovery may also depend strongly on the flight phase. Interactions between human<br />
operators such as <strong>air</strong> traffic controllers and pilots are also time dependent. Think <strong>of</strong> for<br />
example the interactions between a controller and a pilot when an <strong>air</strong>craft is crossing an<br />
active runway. Another example <strong>of</strong> a time dependency is a wear related component failure.<br />
There are also slower changes over time, such as influences from management,<br />
maintenance and regulation.<br />
There are two possible approaches in a <strong>risk</strong> analysis for a system whose behaviour can<br />
change with time. The first is a discretisation <strong>of</strong> the dynamic character <strong>of</strong> the system, for<br />
example by considering short sections <strong>of</strong> an <strong>air</strong>craft's flight. Failure probabilities may differ<br />
for each section but can be considered static within a period. In this manner the <strong>risk</strong><br />
107
analysis is repeated for each section <strong>of</strong> the flight. A second and more elegant approach is<br />
the application <strong>of</strong> dynamic modelling techniques.<br />
Fault trees and BBNs are particularly limited for portraying dynamic aspects and feedback<br />
loops. ESDs can capture some dynamic characteristics <strong>of</strong> accident scenarios implicitly and<br />
heuristically by the model developer’s knowledge <strong>of</strong> the accident evolution [Labeau et al<br />
2000, Swaminathan & Smidts 1999]. Two <strong>of</strong> the most feasible computational approaches<br />
for dynamic modelling <strong>of</strong> large scale problems are discrete dynamic event trees and Monte<br />
Carlo simulation [Labeau et al 2000]. Monte Carlo simulation using Petri Nets is also<br />
proposed by Blom et al [2006] for accident <strong>risk</strong> assessments in <strong>air</strong> <strong>transport</strong>. Comparison<br />
with a static fault/event tree approach indeed showed differences in the result.<br />
Dynamic methods are more abstract and mathematically more complex. Many engineering<br />
disciplines are content with applying static techniques because they are easy to understand,<br />
representation schemes are simple and computation is simple. However, explicit<br />
incorporation <strong>of</strong> dynamic aspects into scenarios will lead to more correctness <strong>of</strong> modelling<br />
[Swaminathan & Smidts 1999].<br />
Representing all rapid and slow changes over time within the total <strong>air</strong> <strong>transport</strong> system in a<br />
model would be a gigantic task. Existing examples <strong>of</strong> aviation accident <strong>risk</strong> assessment<br />
with support <strong>of</strong> Monte Carlo simulation, such as the example described in Blom et al<br />
[2006], were limited to a sub part <strong>of</strong> the <strong>air</strong> <strong>transport</strong> system. The degree to which dynamic<br />
modelling is necessary will therefore require careful consideration and will depend on the<br />
type <strong>of</strong> user and type <strong>of</strong> application <strong>of</strong> the model. For a system-wide causal <strong>risk</strong> model,<br />
which is used for decision making at a strategic level, a static model is for practical reasons<br />
more appropriate. For local users who have operational and tactical questions, a dynamic<br />
model may be required and dynamic modelling techniques such as Monte Carlo simulation<br />
should be considered. The possibility <strong>of</strong> linking local dynamic <strong>models</strong> with an overarching<br />
static model could be a topic for future research.<br />
7.5. Conclusions for this section<br />
A causal <strong>risk</strong> model can be regarded as being composed <strong>of</strong> a representation scheme and a<br />
computational engine. The representation scheme is the interface between the<br />
computational engine and the user <strong>of</strong> the model. The representation scheme is the primary<br />
means <strong>of</strong> communicating the model to the outside world. Many people will regard the<br />
representation scheme as ‘the model’. The representation scheme must therefore be<br />
comprehensive, and most importantly, transparent. A scheme is transparent when a simple<br />
set <strong>of</strong> rules and symbols applies and when it is intuitive. Simplicity <strong>of</strong> the representation<br />
scheme can also be achieved by a (physical, functional, or other) decomposition. Whenever<br />
a decomposition is made a mechanism must be in place to keep track <strong>of</strong> possible<br />
dependencies between components.<br />
Modelling methods with a very simple set <strong>of</strong> rules and symbols are tree-like structures such<br />
as fault trees and event sequence diagrams. They are therefore suited to provide the top<br />
layer <strong>of</strong> the representation scheme, the level that is used most directly by the user.<br />
However, beyond a few levels <strong>of</strong> the trees the events are strongly influenced by many to<br />
many influences <strong>of</strong> common mode factors. Since the assumption in fault tree logic is that<br />
all events are independent events, the model must be linked at this level with another type<br />
<strong>of</strong> model. Bayesian Belief Nets are a suitable candidate as they can capture dependencies<br />
and s<strong>of</strong>t interactions among component behaviour. The graphical representation <strong>of</strong> a<br />
108
Bayesian Belief Net is still intuitive, although the rules are more complex than those <strong>of</strong> a<br />
fault tree. A BBN is therefore less transparent. When dynamic interactions between<br />
components are important it becomes necessary to shift to another type <strong>of</strong> modelling<br />
technique such as Petri Nets in combination with Monte Carlo simulation. The draw back<br />
then is that the model representation is not intuitive.<br />
The degree <strong>of</strong> detail and sophistication <strong>of</strong> the model representation must be decided upon<br />
based on the purpose <strong>of</strong> the model and the performance that is required by the<br />
computational engine. If the computational engine must be able to handle<br />
interdependencies and dynamic behaviour, a simplified representation <strong>of</strong> the model via a<br />
user interface is required to obtain transparency.<br />
Even though a causal <strong>risk</strong> model is a mathematical object, developing a causal <strong>risk</strong> model is<br />
not primarily a mathematical problem. Examples show that proper mathematical techniques<br />
are available and the required computer power is not excessive. Developing a causal <strong>risk</strong><br />
model is much more a problem <strong>of</strong> assembling all available knowledge and data on a very<br />
large and complex system and unravelling this complexity into cause-effect relations that<br />
can be assembled in a model and representing this information in a useful way.<br />
The development <strong>of</strong> a causal <strong>risk</strong> model for aviation should be guided by questions and<br />
functional requirements from the users <strong>of</strong> the model. The model developers should use<br />
techniques, develop (mathematical) solutions, and go to the level <strong>of</strong> detail that fits the user<br />
requirements. The degree to which dynamic modelling is necessary will require careful<br />
consideration and will depend on the type <strong>of</strong> user and type <strong>of</strong> application <strong>of</strong> the model.<br />
109
Chapter 8. Quantification<br />
The causal <strong>risk</strong> model describes the output parameter, <strong>air</strong>craft accident <strong>risk</strong>, as a function <strong>of</strong><br />
the input parameters. Because <strong>risk</strong> is a combination <strong>of</strong> severity and probability, which both<br />
imply rank ordering, it must be expressed as a unit that can at least be rank ordered. This<br />
has far reaching consequences for both the development and use <strong>of</strong> the model. To<br />
understand these consequences it is necessary to look more closely at quantification, and<br />
particularly units and values. Especially when trying to quantify ‘s<strong>of</strong>t’ causal influences,<br />
finding appropriate units is not an easy task. A discussion on quantification is not complete<br />
without addressing the topic <strong>of</strong> numerical accuracy and uncertainty. The credibility <strong>of</strong> the<br />
causal model depends on the quality <strong>of</strong> the model structure and on the sources <strong>of</strong> the<br />
numerical data to be used and the confidence that one can have in the figures. This section<br />
describes the most relevant sources <strong>of</strong> data for quantification <strong>of</strong> an aviation causal <strong>risk</strong><br />
model.<br />
8.1. Measurements, quantities, units and values.<br />
The causal <strong>risk</strong> model is primarily 61 a quantitative model which expresses the level <strong>of</strong><br />
safety as the value <strong>of</strong> one or more physical quantities. The model consists <strong>of</strong> variables and<br />
conditional probabilities or rank correlations where the variables describe causes and<br />
effects and the conditional probabilities describe the strength <strong>of</strong> the causal relationship. A<br />
conditional probability describes the probability <strong>of</strong> occurrence <strong>of</strong> a certain value <strong>of</strong> a<br />
variable given a particular condition, e.g. the occurrence <strong>of</strong> a breaching <strong>of</strong> the dykes in<br />
Zeeland given a high sea level. The condition can be described qualitatively (‘high sea<br />
level’) or quantitatively (e.g. sea level at Flushing (Vlissingen) <strong>of</strong> +4.55 meter NAP 62 ).<br />
Quantification <strong>of</strong> the probability <strong>of</strong> occurrence <strong>of</strong> variables and the conditional probabilities<br />
is done by using existing data or by expert opinion. Often different sources <strong>of</strong> data will<br />
need to be combined, for instance recorded sea level measurements are used to determine<br />
the probability <strong>of</strong> occurrence <strong>of</strong> a high sea level, and expert judgement is used to determine<br />
the probability <strong>of</strong> breaching <strong>of</strong> the dykes given the high sea level. In these cases it is<br />
important that the description <strong>of</strong> ‘high sea level’ in the database is the same as what the<br />
experts consider to be ‘high sea level’. When different sources <strong>of</strong> data are combined it is<br />
always extremely important to ascertain that the same variable descriptions and units <strong>of</strong><br />
measurement are used. The following definitions are relevant [Taylor. 1995]:<br />
A quantity is a property ascribed to phenomena, bodies, or substances that can be<br />
quantified for, or assigned to, a particular phenomenon, body, or substance.<br />
Examples are mass and electric charge. A physical quantity is a quantity that can<br />
be used in the mathematical equations <strong>of</strong> science and technology.<br />
A unit is a particular physical quantity, defined and adopted by convention, with<br />
which other particular quantities <strong>of</strong> the same kind are compared to express their<br />
value.<br />
61<br />
The heart is quantitative, but semi quantitative or qualitative could be considered.<br />
62<br />
This was the sea level at Flushing (Vlissingen) on 1 February 1953 when the<br />
Netherlands’ flood disaster occurred.<br />
110
The value <strong>of</strong> a quantity is its magnitude expressed as the product <strong>of</strong> a number and<br />
a unit, and the number multiplying the unit is the numerical value <strong>of</strong> the quantity<br />
expressed in that unit.<br />
An example <strong>of</strong> a physical quantity is ‘sea level’ which has the unit ‘meter’, where a meter<br />
is defined as ‘The meter is the length <strong>of</strong> the path travelled by light in vacuum during a time<br />
interval <strong>of</strong> 1/299,792,458 <strong>of</strong> a second’ [Taylor 2002]. In the Netherlands, the (arbitrary)<br />
zero-point <strong>of</strong> the scale is NAP.<br />
Measurement has been defined as ‘the assignment <strong>of</strong> numerals to things so as to represent<br />
facts and conventions about them’ [Stevens 1946]. Often we measure because we want to<br />
apply some statistical manipulation, and which manipulations can be applied then depends<br />
on the type <strong>of</strong> scale against which the measurements are ordered. In a nominal scale the<br />
numerical values just name the attribute uniquely. No ordering <strong>of</strong> the cases is implied, and<br />
words or letters would serve equally well. With an ordinal scale the attributes are rankordered<br />
but distances between attributes do not have any meaning. Strictly speaking,<br />
statistics involving means and standard deviations cannot be used with ordinal scales,<br />
because these statistics imply knowledge <strong>of</strong> something more than the relative rank order.<br />
With an interval scale the distance between attributes has a meaning. Almost all statistical<br />
measures are meaningful, except those that require the existence <strong>of</strong> a true zero point. The<br />
zero point in an interval scale is a matter <strong>of</strong> convention, and as a result ratios are<br />
meaningless. A ratio scale consists not only <strong>of</strong> equidistant points but also there is a true<br />
zero that is meaningful (not arbitrary) and a fraction (or ratio) can be constructed. All types<br />
<strong>of</strong> statistical manipulations are applicable to ratio scales, including logarithmic<br />
transformations, such as are involved in the use <strong>of</strong> decibels [Stevens 1946]. Using the same<br />
units <strong>of</strong> measurement is vital when information from different sources is combined, see the<br />
example <strong>of</strong> the Mars Climate Orbiter and Figure 21.<br />
Mars Climate Orbiter<br />
On September 23, 1993, the Mars Climate Orbiter was scheduled to enter into an orbit<br />
around the planet Mars. The vehicle had been launched 9 months earlier by a Delta rocket<br />
from Cape Canaveral Air Station, Florida, but the Mars orbit insertion manoeuvre failed,<br />
resulting in a lower than planned spacecraft trajectory. As a consequence the obiter was<br />
lost. The exact fate <strong>of</strong> the spacecraft is unknown; it was either destroyed in the atmosphere<br />
or re-entered heliocentric space after leaving Mars’ atmosphere. The Mars Climate Orbiter<br />
accident investigation report concluded that the cause <strong>of</strong> the accident was the failure to use<br />
metric units in a segment <strong>of</strong> ground-based navigation related s<strong>of</strong>tware. That s<strong>of</strong>tware<br />
required input in metric units <strong>of</strong> Newton seconds, but instead the data was delivered in<br />
English units <strong>of</strong> pound seconds [Stephenson 1999].<br />
In everyday language, we <strong>of</strong>ten ignore the difference between quantities, units and values.<br />
Human beings are able to interpret descriptions <strong>of</strong> the values <strong>of</strong> quantities and rank<br />
different descriptions <strong>of</strong> the value <strong>of</strong> the same variable. If the quantity is for instance ‘sea<br />
level’, we are able to interpret what ‘high sea level’ means and rank it against ‘low sea<br />
level’. In doing so, we are able to communicate complex issues in a rather effective way. A<br />
prerequisite is that sender and receiver share a common context or frame <strong>of</strong> reference,<br />
otherwise miscommunication will occur. Two pieces <strong>of</strong> information can only be combined<br />
when they share a common frame <strong>of</strong> reference. Whether a ‘small bolt’ will fit into a ‘small<br />
111
hole’ is impossible to tell unless the diameter <strong>of</strong> bolt and hole are expressed in a similar<br />
unit <strong>of</strong> length. This is precisely the reason why units have been defined.<br />
Figure 21: Without units things do not make much sense.<br />
The use <strong>of</strong> standard units <strong>of</strong>fers the greatest flexibility to express the condition <strong>of</strong> variables<br />
and is therefore preferred. But sometimes it is impossible or impractical to apply a standard<br />
quantitative unit <strong>of</strong> measurement. For example if we want to know the distribution <strong>of</strong><br />
‘sleepiness’ among flight crews during different stages <strong>of</strong> the flight we could resort to<br />
measurement <strong>of</strong> brain activity, but this is quite impractical. It is much easier to ask pilots<br />
whether they feel sleepy. We then use a descriptive rating scale. When developing a<br />
descriptive rating scale it is important to provide sufficient anchor points; qualitative<br />
descriptions that allow little room for interpretation. Key words and phrases must be easily<br />
understood and yet sufficiently definitive so that each rating will be clearly separated from<br />
every other rating. Particularly when expert judgement is used it is important to remove as<br />
much ambiguity as possible. Simply providing a scale that runs from ‘none’ via ‘a little’<br />
and ‘much’ to ‘very much’ will not do. An example <strong>of</strong> a scale for sleepiness with proper<br />
anchor points is the Stanford Sleepiness Scale [Hoddes et al 1973]:<br />
Stanford Sleepiness Scale<br />
1. Feeling active and vital; alert; wide awake.<br />
2. Functioning at a high level, but not at peak; able to concentrate.<br />
3. Relaxed; awake; not at full alertness; responsive.<br />
4. A little foggy; not at peak; let down.<br />
5. Foggy; beginning to lose interest in remaining awake; slowed down.<br />
6 Sleepy; prefer to be lying down; fighting sleep; woozy<br />
7. Almost in reverie; sleep onset soon; losing struggle to remain awake.<br />
A potential problem with such a scale is the suggestion that the difference between 1 and 2<br />
is <strong>of</strong> the same size as the difference between 2 and 3. In reality this may not be the case;<br />
because it is an ordinal scale the values only represent a rank order.<br />
112
A different approach for quantifying variable descriptions is to select a proxy variable that<br />
is strongly associated with the variable <strong>of</strong> interest and which can be quantified. An example<br />
is the variable ‘weather’. This actually combines a whole set <strong>of</strong> atmospheric conditions<br />
including wind speed, precipitation, cloud coverage, temperature, etc. For a pilot it is<br />
important to be aware <strong>of</strong> the actual weather conditions on his planned route because ‘bad<br />
weather’ is not only uncomfortable for passengers but can also be dangerous. An exact unit<br />
for the variable ‘weather’ does not exist but in practice the intensity <strong>of</strong> rainfall comes pretty<br />
close. Often intense rainfall is associated with strong and variable winds and possibly<br />
lightning, which all can be aviation hazards. Therefore rainfall can be used as a proxy<br />
variable for weather. Rainfall intensity can be objectively measured in mm/day using<br />
standardised gauge. This example also shows that a proxy has boundary conditions for its<br />
appropriateness; if we are interested in clear <strong>air</strong> turbulence 63 as part <strong>of</strong> the variable weather,<br />
rainfall rate is definitely not a good proxy. Therefore, whenever proxies are introduced, the<br />
boundary conditions within which they work need to be defined.<br />
From the potential users <strong>of</strong> a causal <strong>risk</strong> model comes a requirement to represent the<br />
influence <strong>of</strong> composite factors such as safety management and safety culture [De Jong<br />
2006], see section 4.4. One <strong>of</strong> the main difficulties lies in the need to express such<br />
composite factors in objectively quantifiable units. What are proper units for complex<br />
issues such as the quality <strong>of</strong> procedures, commitment <strong>of</strong> personnel, non-technical skills <strong>of</strong><br />
pilots or safety culture? Can they be constructed so that experts can consistently use them?<br />
Proxy variables are also difficult to find as these <strong>of</strong>ten reflect only one <strong>of</strong> the ‘dimensions’<br />
<strong>of</strong> the variable <strong>of</strong> interest. The difficulty <strong>of</strong> developing clear anchor points for a qualitative<br />
scale or finding relevant proxy variables is one <strong>of</strong> the main obstacles associated with<br />
quantifying the influences <strong>of</strong> management on accident <strong>risk</strong> [Bellamy et al 1999].<br />
We could strictly apply the requirements for quantification and only allow elements in a<br />
causal <strong>risk</strong> model that can be described using well defined physical quantities and units <strong>of</strong><br />
measurement or for which decent proxy variables can be found. However, many (allegedly)<br />
influencing factors would almost certainly disappear from the model, and some <strong>of</strong> the user<br />
requirements would not be met. Alternatively we could incorporate such factors using less<br />
well defined quantities and units <strong>of</strong> measurement or rating scales at the <strong>risk</strong> <strong>of</strong> introducing<br />
additional variability in the model and increased uncertainty in the model results. The<br />
question is whether the advantages <strong>of</strong> having the factors in the model outweigh the<br />
disadvantage <strong>of</strong> additional variability. To answer this question it is necessary to estimate<br />
the degree <strong>of</strong> variability that can be expected. The variability is introduced because, due to<br />
the lack <strong>of</strong> properly defined units, different people will use different yardsticks for<br />
measurement and ranking. These yardsticks are partly based on individual experiences and<br />
beliefs. When a particular groups shares beliefs and experiences, the variability within that<br />
group is much less than the variability between members <strong>of</strong> different groups. This can be<br />
observed in different cultures. Within a cultural group, even ideas on complex properties<br />
such as, say, beauty and taste are quite consistently shared. It is very difficult, if not<br />
impossible, to describe the beauty <strong>of</strong> the human face or the overall quality <strong>of</strong> a restaurant in<br />
objectively quantifiable units. Yet there is much consistency among people on what is<br />
considered to be an attractive face [Zaidel & Cohen 2005, Braun et al 2001], or what is an<br />
excellent restaurant.<br />
63 Clear <strong>air</strong> turbulence is characterised by the absence <strong>of</strong> clouds. It typically occurs at cruise<br />
altitudes.<br />
113
An example <strong>of</strong> a complex issue for which a broadly accepted rating scale has been devised<br />
concerns the quality <strong>of</strong> restaurants. The Guide Michelin contains the most influential<br />
gastronomic rating in the world, based on rather loose definitions:<br />
• Three stars: Exceptional cuisine, worth a special journey.<br />
• Two stars: Excellent cooking, worth a detour.<br />
• One star: A very good restaurant in its category 64 .<br />
The quantity considered is the quality <strong>of</strong> the restaurant, the unit is the Michelin Star, and<br />
the value is 0, 1, 2 or 3. Among the elements taken into account are the quality <strong>of</strong> the<br />
ingredients, the technical ability shown in their preparation, the combination <strong>of</strong> flavours,<br />
the creativity and the consistency <strong>of</strong> the cooking and the value for money it <strong>of</strong>fers. Despite<br />
its apparent weak definition and lack <strong>of</strong> transparency, the system <strong>of</strong> Michelin Stars is well<br />
established and broadly accepted. It has created a yardstick for a complex multidimensional<br />
issue. The yardstick can be used and applied with consistency even without detailing all the<br />
dimensions associated with it.<br />
A similar rating system for, say, safety culture or flight crew non-technical skills, would<br />
allow an acceptable representation <strong>of</strong> it in a quantitative causal <strong>risk</strong> model. Several attempts<br />
have been made for developing rating scales for safety culture and non-technical skills, see<br />
for instance Hudson [2003], Von Thaden et al [2003], Kho et al [2005], Van Avermaete<br />
[1998] and Davoudian et al [1994]. But a ‘Guide Michelin’ in which stars are awarded to<br />
companies that have an excellent safety culture does not yet exist , although the <strong>air</strong>line<br />
‘blacklist’ that has been published by the EU [EC 2005] is an attempt, albeit very crude.<br />
And in spite <strong>of</strong> all this research the current regulation on flight crew licensing does not<br />
contain an evaluation scheme <strong>of</strong> non-technical skills. One <strong>of</strong> the difficulties is that there are<br />
hardly any data on the relation between non-technical skills assessment and the actual flight<br />
crew performance on non-technical skills [Van Avermaete 1998]. This is because these<br />
skills are insufficiently specified to be clearly measurable. They need to be tied to tasks in<br />
order to operationalise them. In the short term, a broadly accepted and applied rating<br />
system for non technical skills or safety culture cannot be expected. But if we do not make<br />
a start, we will never get anywhere, not even to know if we have consensus now or not and<br />
if so, built in what group(s). The only way to find out if proper units for these complex<br />
issues can be constructed is to try (harder) to develop and validate them.<br />
8.2. The need for ratio scales<br />
For some applications <strong>of</strong> a causal <strong>risk</strong> model an outcome using an ordinal scale may be<br />
sufficient, for instance when comparing two possible alternatives it may be sufficient if we<br />
know which <strong>of</strong> those is the ‘better’. This does not mean however that it is therefore<br />
sufficient to express the model parameters with ordinal scales. Consider the following<br />
example from Hesslow [1976]: The use <strong>of</strong> birth control pills is a <strong>risk</strong> factor for thrombosis.<br />
At the same time, birth control pills are an effective preventer <strong>of</strong> pregnancy, which is in<br />
turn a <strong>risk</strong> factor for thrombosis. The use <strong>of</strong> birth control pills may thus affect one’s<br />
chances <strong>of</strong> suffering from thrombosis directly and indirectly via the effect <strong>of</strong> the pills on the<br />
probability <strong>of</strong> becoming pregnant (Figure 22). Whether birth control pills raise or lower the<br />
overall probability <strong>of</strong> thrombosis will depend on the relative strengths <strong>of</strong> these two causal<br />
routes. The example illustrates that if the outcome <strong>of</strong> the model is required to be ordinal,<br />
this does not mean that it is sufficient to express each individual element <strong>of</strong> the model as an<br />
64 This is the customer rating, the judges from Michelin have a more detailed rating scale<br />
set and definitions.<br />
114
ordinal value. The direct and indirect effects <strong>of</strong> birth control pills must be expressed in<br />
meaningful numbers (using an interval scale or ratio scale) in order to determine the overall<br />
effect. Similarly, it is a misconception to think that the required numerical accuracy <strong>of</strong> the<br />
model is the same as the required numerical accuracy <strong>of</strong> the model elements. This<br />
misconception is clearly present in a recommendation made in 2003 by the Safety Advisory<br />
Committee Schiphol [VACS 2003b]. According to the recommendation, “a causal model<br />
can be a proper tool to make well-justified weightings in decisions with safety<br />
consequences or when choices between different safety measures need to be taken”.<br />
According to the same recommendation, “this does not necessarily require a high numerical<br />
accuracy, but rather a high degree <strong>of</strong> consistency”. While it is true that a high numerical<br />
accuracy may not necessarily be needed for the final model outcome, the numerical<br />
accuracy <strong>of</strong> the underlying causal relations is important. Errors in the input and errors due<br />
to model uncertainty propagate throughout the model and eventually accumulate in the endresult.<br />
Exactly how the individual error terms propagate depends on the model structure and<br />
the type <strong>of</strong> dependencies, but generally speaking this means that the error in the model<br />
input en the elements <strong>of</strong> the model should be smaller than the acceptable error in the model<br />
output. Requirements for individual model elements are thus more strict than the overall<br />
model requirement.<br />
Birth control<br />
pills<br />
-<br />
Pregnancy<br />
+<br />
+<br />
Thrombosis<br />
Figure 22: Dependence between birth control pills, pregnancy and thrombosis.<br />
8.3. Uncertainty<br />
A result <strong>of</strong> a quantitative <strong>risk</strong> assessment that only gives point estimates <strong>of</strong> accident<br />
probabilities provides a very loose basis for decision making. Levels <strong>of</strong> uncertainty <strong>of</strong> the<br />
model results are as equally important as point estimates. In many fields <strong>of</strong> science and<br />
technology, the parameters necessary for modelling physical, chemical or biological<br />
behaviour are not known with certainty. Different values may be reported in literature, and<br />
scientists sometimes disagree as to which values should be used in practical applications.<br />
The amount <strong>of</strong> uncertainty is <strong>of</strong>ten represented as a confidence interval. A confidence<br />
interval gives an estimated range <strong>of</strong> values which is likely to include the true parameter<br />
value. The width <strong>of</strong> the confidence interval gives information on the uncertainty<br />
surrounding the estimate; a larger interval indicates more uncertainty.<br />
Sometimes a distinction is made between aleatory uncertainty and epistemic uncertainty.<br />
Aleatory uncertainty is the result <strong>of</strong> randomness in the input parameters, epistemic<br />
uncertainty is the result <strong>of</strong> lack <strong>of</strong> knowledge. Aleatory uncertainty is ‘objective’, epistemic<br />
uncertainty is ‘subjective’. For the final end result there is no need to distinguish between<br />
different types <strong>of</strong> uncertainty, as there is ultimately one aggregated uncertainty measure.<br />
From a practical point <strong>of</strong> view the difference is relevant. In experiments that involve the<br />
drawing <strong>of</strong> coloured marbles from a jar a 95% confidence interval can be uniquely<br />
115
determined, given the results <strong>of</strong> the experiment. The 95% confidence interval will converge<br />
if the experiment involves more sampling. Uncertainty is strictly ‘objective’ and methods<br />
for estimating aleatory uncertainty are well-established, see for instance Everdij et al<br />
[2006]. Estimating uncertainty <strong>of</strong> results <strong>of</strong> a causal <strong>risk</strong> model is less straightforward.<br />
Consider for instance input parameter values which are quantified by expert judgement.<br />
Experts can estimate 95% confidence intervals, but these are not unique and undisputable<br />
as in the case <strong>of</strong> uncertainty intervals for ‘objective’ uncertainty. The underlying probability<br />
distribution is not known, but is assumed. In a strict sense it is incorrect to refer to such<br />
intervals as 95% confidence intervals, because the 95% has no real meaning other than as<br />
some indication <strong>of</strong> the degree <strong>of</strong> uncertainty (<strong>of</strong> the expert). When the judgements <strong>of</strong> more<br />
experts are elicited the 95% confidence interval does not necessarily converge. The 95%<br />
does not refer to numerical probabilities but to a qualitative ‘scale <strong>of</strong> likelihood’. While<br />
calculations can be made with confidence intervals provided by experts, it is incorrect to<br />
treat them in the same way as confidence intervals that are the result <strong>of</strong> controlled<br />
experiments. Lack <strong>of</strong> information cannot be compensated by mathematics. On the other<br />
hand, sometimes very elegant mathematical solutions to estimate epistemic uncertainty can<br />
be found, like Wechseler’s Range Ration.<br />
Wechseler’s Range Ratio<br />
The human component in a system is much more variable than the equipment component.<br />
For this reason estimates <strong>of</strong> uncertainty <strong>of</strong> failure <strong>of</strong> people in a system will usually be<br />
larger than the estimates <strong>of</strong> uncertainty assigned to equipment in that system. It is therefore<br />
particularly important that human error probabilities are not expressed as a point estimate<br />
but that they are accompanied by appropriate uncertainty estimates. Because <strong>of</strong> lack <strong>of</strong> real<br />
data on human error probability distributions, <strong>of</strong>ten some kind <strong>of</strong> probability distribution is<br />
assumed with the single point estimate as the median <strong>of</strong> the distribution. On the<br />
presumption that for skilled operators most errors will fall near the low end <strong>of</strong> the<br />
distribution a lognormal distribution was proposed in [Swain & Guttmann 1983]. It was<br />
further observed that despite variability among people, selection and other managerial<br />
influences tend to restrict variability. If a person consistently performs far below average<br />
for his group, he will usually be retrained or reassigned. This phenomenon is expressed as<br />
Wechseler’s Range Ratio: “Given a population that is homogeneous with respect to some<br />
ability that can be measured with a ratio scale, the highest score in the distribution will<br />
rarely be more than five times the smallest score and usually not more than three times the<br />
smallest score”. By assuming a 4:1 range ratio between the 95 th and 5 th percentiles <strong>of</strong> error<br />
probabilities for tasks performed under routine conditions it was hypothesized that a<br />
lognormal probability density function with a standard deviation <strong>of</strong> 0.42 provides a<br />
reasonable fit [Swain & Guttmann 1983].<br />
8.4. Model assumptions<br />
Epistemic uncertainty arises from abstracting the endless complexity <strong>of</strong> reality into the<br />
limited complexity <strong>of</strong> the model. Abstraction is obtained by making a (large) number <strong>of</strong><br />
assumptions. By making these assumptions explicit, and by determining the effect <strong>of</strong> those<br />
assumptions on the model results, we are able to get a feeling for the epistemic uncertainty.<br />
A weakness <strong>of</strong> a diagrammatic format <strong>of</strong> a model representation scheme, like a fault tree or<br />
an influence diagram, is that it discourages model developers from explicitly stating the<br />
assumptions and conditional probabilities for the model elements and their<br />
interconnections. An arrow between two model nodes is easily drawn but it is equally easy<br />
116
to ‘forget’ that by drawing the arrow a number <strong>of</strong> assumptions are adopted 65 . To get a<br />
proper picture on the uncertainty <strong>of</strong> the results <strong>of</strong> a causal <strong>risk</strong> model it is necessary to<br />
conduct a thorough identification and analysis <strong>of</strong> all assumptions adopted, including<br />
assumptions on parameter values used, and to assess the individual and combined effect <strong>of</strong><br />
these assumptions on the model results. The analysis should also include sensitivity<br />
analysis, which analyses how modifications in the values <strong>of</strong> the input parameters affect the<br />
value <strong>of</strong> the output parameters. If the value <strong>of</strong> an output parameter is sensitive to the value<br />
<strong>of</strong> an input parameter, it is also sensitive to aleatory and epistemic uncertainties in the input<br />
parameter. Therefore the sensitivity analysis helps to identify those input parameters for<br />
which it is most important to determine the level <strong>of</strong> uncertainty and to estimate the effect <strong>of</strong><br />
underlying assumptions [Everdij et al 2006].<br />
8.5. Data sources<br />
The credibility <strong>of</strong> the whole causal <strong>risk</strong> model depends, apart from the quality <strong>of</strong> the model<br />
structure, on the sources <strong>of</strong> the numerical data (to be) used and the confidence that one can<br />
have in the figures. The core <strong>of</strong> the model needs to be populated with accident data. The<br />
accident investigation report is without doubt the single most complete and accurate source<br />
<strong>of</strong> information regarding a particular accident. In addition to accident and incident data,<br />
data on normal operations are required to determine the frequency <strong>of</strong> occurrence <strong>of</strong> factors<br />
that can contribute to accidents. This exposure data is <strong>of</strong>ten harder to find than accident<br />
data because ‘normal events’ are simply not recorded. Ideally, parameters <strong>of</strong> the model<br />
should be estimated based on operational data <strong>of</strong> the (sub) system under consideration.<br />
Often however the analysis has to rely on a number <strong>of</strong> sources and types <strong>of</strong> information.<br />
This section describes the most relevant sources <strong>of</strong> data for quantification <strong>of</strong> an aviation<br />
causal <strong>risk</strong> model and their qualities and limitations and looks at what could potentially be<br />
used.<br />
8.5.1 Accident or incident data?<br />
Aircraft accidents are rare events. In 2005, worldwide commercial operated <strong>air</strong>craft with a<br />
take <strong>of</strong>f weight <strong>of</strong> 5,700 kg or heavier suffered only 30 fatal accidents while performing 35<br />
million flights [CAA-NL 2007]. The number <strong>of</strong> possible accidental pathways is orders <strong>of</strong><br />
magnitude higher, which means that accident data alone is insufficient to populate an<br />
aviation causal <strong>risk</strong> model, even if data over many years are aggregated. Aggregation over<br />
(too) many years also runs the <strong>risk</strong> that the type <strong>of</strong> <strong>air</strong>craft, rules and regulations,<br />
instrumentation, <strong>air</strong>fields, etc., have changed in the meantime. Obvious alternative sources<br />
<strong>of</strong> data are incidents.<br />
Accident causation theories such as Heinrich’s domino model [Heinrich et al 1980] and<br />
Reasons ‘Swiss cheese’ model [Reason 1990] suggest that accidents and incidents within<br />
one scenario follow similar causal pathways, at least partially. Indeed Heinrich’s accident<br />
pyramid, or better, the way in which the pyramid concept is used by subsequent<br />
researchers, suggests a fixed ratio between the number <strong>of</strong> accidents and the number <strong>of</strong><br />
incidents. Some authors challenge this. O’Hare [2006] for instance claims that errors<br />
observed in accidents and incidents are not the same, stating that ‘failures at higher<br />
cognitive levels (e.g. goal or planning failures) are more lethal than failures at lower<br />
cognitive level (e.g. in detection or action)’ and he suggests that the difference between<br />
accidents and incident is ‘more than just the outcome’. But O’Hare fails to provide the<br />
definitions used for accidents and incidents, which makes it difficult to interpret the results.<br />
65<br />
These assumptions depend on the type <strong>of</strong> model representation.<br />
117
Indeed it can be misleading to think that actions to control minor incidents will also control<br />
major hazards. Some large chemical companies have used lost time injuries as a general<br />
performance indicator <strong>of</strong> their safety management, despite the fact that analysis <strong>of</strong> their<br />
accidents shows that these occur mainly on peripheral tasks such as falls from st<strong>air</strong>s or<br />
scaffolding, or tripping injuries moving around the plant. A classical example is that <strong>of</strong> BP<br />
which before 2005 was considered one <strong>of</strong> the leading companies as regards safety<br />
management. However, the organisation failed to notice that safety management efforts<br />
were too heavily focussed on reducing personal injuries and achieving significant<br />
improvements in personal safety performance rather than focussing on preventing major<br />
accidents. BP mistakenly interpreted improving personal injury rates as acceptable process<br />
safety performance at its refineries [Baker 2007]. This only became apparent after the BP<br />
Texas City refinery blew up on March 23, 2005, resulting in 15 deaths and more than 170<br />
injuries. Minor incidents like tripping injuries only indicate the quality <strong>of</strong> the <strong>risk</strong> control<br />
performance on peripheral tasks, not on the operations and maintenance tasks in which the<br />
scenarios occur which can lead to major accidents.<br />
Hale [2001] explains that in answering the question about the relation between major and<br />
minor accidents, we should ask specifically whether we can distinguish from early on in the<br />
sequences those that will lead ultimately to serious accidents from those that will only lead<br />
to minor ones and those which will be detected and recovered before they reach the damage<br />
step. In other words, was the sequence leading to a minor incident also a sequence that<br />
could lead to a much more serious event? This requires clearly articulated and understood<br />
accident scenarios. The advantage <strong>of</strong> using (complex) <strong>risk</strong> <strong>models</strong> involving major accident<br />
scenarios is that their careful application will allow performance indicators to be clearly<br />
defined, linked with the important hazards scenarios. In the BP case, the causal pathways<br />
resulting in personal injuries were different from the causal pathways resulting in<br />
catastrophic accidents and therefore the incident data could not be used to predict major<br />
accidents.<br />
The conclusion is that, once we have developed accident scenarios and represented them in<br />
a causal model, it becomes a helpful tool for focussing on actions that might control major<br />
hazards. But the question remains whether incident data can be used to construct accident<br />
scenarios. The definition <strong>of</strong> accidents and incidents is important here. By properly defining<br />
what we classify as accidents and incidents, confusion such as in the BP example can be<br />
avoided. ICAO’s definitions [ICAO 2001] <strong>of</strong> accidents and incidents, which are widely<br />
used throughout the aviation industry, clearly link incidents to major accidents:<br />
An incident is an occurrence, other than an accident, associated with the operation<br />
<strong>of</strong> an <strong>air</strong>craft which affects or could affect the safety <strong>of</strong> the operation.<br />
A serious incident is an incident involving circumstances indicating than an<br />
accident nearly occurred.<br />
By this definition accidents and incidents share similar occurrence pathways and only differ<br />
in the outcome. This means that, if this definition is consistently applied, incident data can<br />
be used to gain insight in causal accident pathways and can be used for quantification <strong>of</strong><br />
accident <strong>models</strong>.<br />
8.5.2 Accident investigation<br />
International standards for accident investigation are defined by ICAO in Annex 13<br />
according to which each accident and serious incident must be investigated and the results<br />
118
<strong>of</strong> the investigation must be assembled in an investigation report which has to be provided<br />
to ICAO. The objective <strong>of</strong> accident investigation is to establish the causes <strong>of</strong> the accident<br />
sufficiently to be able to devise and implement remedial and preventive action.<br />
Responsibility for an investigation belongs to the state in which the accident or incident<br />
occurred, but representatives <strong>of</strong> the state <strong>of</strong> registry <strong>of</strong> the <strong>air</strong>craft involved, the operator<br />
and the manufacturer usually also take part in the investigation. The investigation process<br />
includes the gathering, recording and analysis <strong>of</strong> all relevant information, the determination<br />
<strong>of</strong> the causes, formulating appropriate safety recommendations and the completion <strong>of</strong> the<br />
accident investigation [ICAO 2001]. Most countries have set up an independent accident<br />
investigation board to conduct the investigation without conflict <strong>of</strong> interest; examples are<br />
the National Transportation Safety Board (NTSB) in the USA, the Air Accidents<br />
Investigation Branch (AAIB) in the UK and the Bureau d’Enquêtes et d’Analyses (BEA) in<br />
France. Although the quality <strong>of</strong> the investigation may differ between countries, the standard<br />
is usually very high in Europe, North America, Australia and some parts <strong>of</strong> Asia. The<br />
investigation report will <strong>of</strong>ten also include information about underlying causes such as<br />
organisational factors that contributed to the accident. Because accident investigation<br />
reports are usually rather extensive and very detailed, retrieving information from those<br />
reports requires quite some knowledge and understanding <strong>of</strong> basically all aviation<br />
disciplines. Because there is no consistent, recognisable causal model behind the<br />
investigations, there is a translation step necessary to be able to populate the causal <strong>risk</strong><br />
model with accident information. Due to the low frequency <strong>of</strong> major accidents and<br />
incidents, the investigation reports are not sufficient to populate all parts <strong>of</strong> the causal <strong>risk</strong><br />
model. Other sources <strong>of</strong> information are required to complete quantification <strong>of</strong> the model.<br />
8.5.3 Incident reporting<br />
Investigating an aviation accident is usually a lengthy and costly process. The actual level<br />
<strong>of</strong> effort will normally reflect the severity or significance <strong>of</strong> the accident. A ‘disaster’ or<br />
some other significant accident will generate very considerable investigative effort,<br />
typically in the order <strong>of</strong> €2.5 million. [Deazle et al 1999]. Relatively minor accidents and<br />
incidents are <strong>of</strong>ten investigated less extensively and the reports are scantier. To facilitate<br />
collection <strong>of</strong> information on actual or potential safety deficiencies, ICAO requires that<br />
states establish a mandatory incident reporting system. All EU countries for instance submit<br />
mandatory occurrence reports to the European Co-ordination Centre for Aviation Incident<br />
Reporting Systems (ECCAIRS). A reportable occurrence is any incident which endangers<br />
or which, if not corrected, would endanger the <strong>air</strong>craft, its occupants or any other person.<br />
The requirement applies to pilots, but also to individuals involved in <strong>air</strong>craft manufacturing,<br />
<strong>air</strong>craft maintenance, <strong>air</strong> traffic control and ground handling <strong>of</strong> <strong>air</strong>craft. This includes<br />
managerial functions as well. The regulation on occurrence reporting expects employers to<br />
refrain from disciplinary or punitive action which might inhibit their staff from duly<br />
reporting incidents <strong>of</strong> which they may have knowledge [CAA 2005].<br />
ICAO ADREP and ECCAIRS<br />
ICAO operates a computerized database known as the Accident/Incident Data Reporting<br />
(ADREP) system. In the ADREP system, the occurrence (accident or incident) is described<br />
by listing the ‘events’. Examples <strong>of</strong> events are ‘runway incursion’, ‘electrical system<br />
failure’, ‘hard landing’, ‘fuel starvation’, etc. The expression ‘phase’ is used to indicate in<br />
which phase <strong>of</strong> flight a certain event occurred and is always p<strong>air</strong>ed with an event. To<br />
describe the events, up to five ‘descriptive factors’ can be entered for each event. To<br />
explain the events, up to three ‘explanatory factors’ can be entered for each descriptive<br />
factor. Descriptive factors describe in detail what happened during an event by listing all<br />
phenomena present. Explanatory factors explain why the event happened. They are used to<br />
119
determine what preventive action may be required. If possible, the descriptive and<br />
explanatory factors are coded in chronological order. If not possible, background<br />
information on terrain and weather is coded first and descriptions <strong>of</strong> what people did are<br />
coded last, and the factors must be coded such that subsequent factors explain the preceding<br />
ones. If more than three explanatory factors are required, the three most important ones<br />
must be coded and the remainder has to be mentioned in the narrative.<br />
Since 2004, ICAO ADREP is using the European ECCAIRS system to store and analyse its<br />
data. Development <strong>of</strong> this system originated from a 1989 study in the field <strong>of</strong> accident<br />
investigation and incident reporting systems on behalf <strong>of</strong> the Commission <strong>of</strong> the European<br />
Community. One <strong>of</strong> the conclusions <strong>of</strong> the study suggested to bring together the knowledge<br />
derived from the collection <strong>of</strong> incident reports existing in the aviation authorities <strong>of</strong> various<br />
member states. As the existing systems were not compatible, the study recommended the<br />
setting up <strong>of</strong> a European co-ordination centre for mandatory incident reporting systems. In<br />
1993 the Joint Research Centre at the request <strong>of</strong> Directorate General VII (Transport) <strong>of</strong> the<br />
European Commission started a feasibility study. The main objective <strong>of</strong> the study was the<br />
pilot implementation <strong>of</strong> an automated incident reporting system able to collect information<br />
from various existing, incompatible sources. The project was called ECCAIRS. In 1995 the<br />
feasibility <strong>of</strong> the ECCAIRS approach was demonstrated by integrating on an experimental<br />
basis more than 40,000 occurrences originating from Scandinavia, the United Kingdom and<br />
Germany. From 1995 until 1999 the first production release <strong>of</strong> ECCAIRS was set up.<br />
Current efforts focus on the actual implementation <strong>of</strong> the ECCAIRS network and the usage<br />
(analysis) <strong>of</strong> the collected data. According to EU Directive 2003/42/EC [EC 2003], EU<br />
member states must require that occurrences which endanger or which, if not corrected,<br />
would endanger an <strong>air</strong>craft, its occupants or any other person, are reported to the competent<br />
authorities. The authorities then classify the occurrence and store the information according<br />
to the ECCARS system.<br />
The information content for each individual incident in these systems is rather low, but the<br />
importance comes from the fact that these occurrences are much more numerous than the<br />
accidents and incidents that are fully investigated. Therefore these reporting systems are<br />
suitable for statistical analysis and to populate a larger part <strong>of</strong> a causal <strong>risk</strong> model, provided<br />
that the information is collected and stored consistently and unambiguously and provided<br />
that the incident-accident relationship is well established and known. Coding systems have<br />
been developed to facilitate the process <strong>of</strong> information storage and retrieval, (see text box<br />
ICAO ADREP and ECCAIRS); ICAO’s ADREP was the first in 1976, and others have<br />
followed, using more or less the same format. ECCAIRS for instance uses exactly the same<br />
format as ADREP. The strength <strong>of</strong> these systems is their ability to capture vast amounts <strong>of</strong><br />
data with relatively little effort. The weakness lies in the coding process during which<br />
information may get lost or is incorrectly classified. Since its first conception in 1976,<br />
ADREP has evolved into a rather elaborate system. The coding is generally performed by<br />
individuals who have not had any formal training in accident investigation and the<br />
likelihood <strong>of</strong> misinterpretation or misclassification <strong>of</strong> the information during the coding<br />
process is considerable. When first developed, the system was only intended for accidents<br />
and serious incidents, but with the introduction <strong>of</strong> EU Directive 2003/42/EC [EC 2003] the<br />
system is also used for classification <strong>of</strong> ‘occurrences’. An occurrence is defined as an<br />
operational interruption, defect fault or other irregular circumstance that has or may have<br />
influenced flight safety and has not resulted in an accident or serious incident’. This means<br />
that the number <strong>of</strong> data entries has increased by a significant amount; for instance, in 2007<br />
there were 7,881 reported occurrences in the Netherlands [IVW 2008]. Only 11 <strong>of</strong> those<br />
were possible severe incidents that required reporting before the introduction <strong>of</strong> the<br />
120
Directive. After a year <strong>of</strong> experience, the Dutch Transport and Water Management<br />
Inspectorate concluded in 2008 that ECCAIRS at some points does not meet the<br />
requirements [IVW 2008]. Another problem is that <strong>of</strong> underreporting. Although the<br />
reporting <strong>of</strong> incidents may be mandatory, ‘minor’ incidents tend to be underreported even<br />
when reporting is mandatory. Figure 23 for instance shows a comparison <strong>of</strong> the frequency<br />
<strong>of</strong> occurrence <strong>of</strong> aborted take-<strong>of</strong>fs 66 for different speed regimes according to data from<br />
mandatory occurrence reports and automatically recorded data from the <strong>air</strong>craft’s quick<br />
access recorder. This chart shows the underreporting <strong>of</strong> low speed aborted take-<strong>of</strong>fs, but it<br />
also shows that for serious incidents (like high speed rejected take-<strong>of</strong>fs) the mandatory<br />
reporting systems are a reliable source <strong>of</strong> quantitative information.<br />
occurrence rate<br />
5.00E-05<br />
4.00E-05<br />
3.00E-05<br />
2.00E-05<br />
1.00E-05<br />
0.00E+00<br />
Mandatory Occurrence Reports Airline data<br />
80
to provide quantitative data to the causal <strong>risk</strong> model. They are more useful in helping to<br />
gain insight into potential accident scenarios and the causal pathways.<br />
8.5.4 In-flight recorded data<br />
For the purpose <strong>of</strong> accident investigation, <strong>air</strong>craft have been equipped with ‘black boxes’<br />
since the 1960s. The ‘black box’ is actually orange to facilitate quick location in the<br />
aftermath <strong>of</strong> a crash and consists <strong>of</strong> two separate units: the Flight Data Recorder (FDR) and<br />
the Cockpit Voice Recorder (CVR). Regulatory requirements such as FAR § 121.344<br />
prescribe the parameters to be recorded and the sample rates. These include <strong>air</strong>speed,<br />
altitude, attitude, control inputs, control surface positions, ILS deviations, FMS selections<br />
and warnings [FAA 2003], see Figure 24.<br />
Figure 24: Still picture from a three-dimensional animated accident reconstruction<br />
<strong>of</strong> the flight for American Airlines flight 587, which crashed shortly after take-<strong>of</strong>f<br />
from JFK International <strong>air</strong>port on November 12, 2001. The lower portion <strong>of</strong> the<br />
picture depicts a set <strong>of</strong> instruments and indicators, which display selected<br />
parameters from the flight data recorder. The investigation was performed by the<br />
National Transportation Safety Board NTSB.<br />
It has always been common practice in the aviation industry to keep records <strong>of</strong> failures <strong>of</strong><br />
components in service operation with a view to optimising availability <strong>of</strong> the <strong>air</strong>craft. When<br />
flight data recorder systems developed from analogue tape recorders into digital data<br />
storage devices, many <strong>air</strong>lines quickly realised that flight data analysis could also be used<br />
to improve the overall efficiency <strong>of</strong> the operation by providing a better overview <strong>of</strong> the<br />
reliability <strong>of</strong> <strong>air</strong>craft systems and thus allowing the <strong>air</strong>line to anticipate on <strong>air</strong>craft<br />
maintenance actions. By closely monitoring engine vibration levels for instance it can be<br />
observed that an engine failure is imminent and the engine can be replaced and rep<strong>air</strong>ed<br />
before the very costly failure actually occurs. Quick Access Recorders (QARs) were<br />
introduced for this purpose. QARs register similar data as the Flight Data Recorder but are<br />
not as crash resistant. They allow routine flight data analysis because extracting the data<br />
from the <strong>air</strong>craft is much less cumbersome than in the case <strong>of</strong> the Flight Data Recorder.<br />
Almost immediately <strong>air</strong>lines expanded the use <strong>of</strong> in-flight recorded data from reliability<br />
analysis to safety management. Regulatory authorities have also understood the safety<br />
potential <strong>of</strong> routinely analyzing in-flight recorded data and have required that all operators<br />
<strong>of</strong> <strong>air</strong>craft <strong>of</strong> a maximum take-<strong>of</strong>f mass in excess <strong>of</strong> 27,000 kg must have implemented a<br />
122
flight data analysis programme as part <strong>of</strong> its accident prevention and flight safety<br />
programme, in accordance with ICAO Annex 6 part 1 [ICAO 2002a]. Hundreds <strong>of</strong><br />
parameters can be recorded with a typical sample rate <strong>of</strong> 1 Hz. For each <strong>of</strong> the parameters<br />
recorded with the QAR, upper and lower threshold limits can be defined, after which stored<br />
data can be screened for threshold exceedances. Even when no thresholds are exceeded, the<br />
data provides valuable information that can be used to quantify some <strong>of</strong> the <strong>risk</strong> model<br />
elements. Van Es & Van der Geest [2006] provide an example <strong>of</strong> the use <strong>of</strong> data from quick<br />
access recorders to analyse the operational landing field performance <strong>of</strong> two <strong>air</strong>craft types,<br />
see Figure 25.<br />
[ ft]<br />
[fp m ]<br />
Pressure Altitude,Radio Altitude<br />
1000<br />
500<br />
0<br />
PA<br />
RA<br />
-500<br />
0 20 40 60<br />
Inertial Vertical Speed<br />
500<br />
-1000<br />
0 20 40 60<br />
Velocities<br />
[ k t]<br />
[de g ]<br />
0<br />
-500<br />
200<br />
150<br />
100<br />
50<br />
0<br />
0<br />
10<br />
20 40<br />
Angle <strong>of</strong> Attack<br />
60<br />
5<br />
0<br />
CAS<br />
TAS<br />
Vgnd<br />
Vtarget<br />
-5<br />
0 20 40 60<br />
time (sec)<br />
Magnetic Heading,Track Angle Magnetic<br />
80<br />
1.6<br />
[d eg ]<br />
[d e g]<br />
[d eg ]<br />
[d ot]<br />
60<br />
40<br />
20<br />
0<br />
6<br />
20 40<br />
Pitch<br />
60<br />
4<br />
2<br />
0<br />
-2<br />
0<br />
5<br />
20 40<br />
Roll<br />
60<br />
0<br />
-5<br />
0 20 40 60<br />
Glideslope, Localizer<br />
10<br />
GS<br />
Loc<br />
5<br />
0<br />
-5<br />
0 20 40 60<br />
time (sec)<br />
0.8<br />
0 20 40 60<br />
Longitudinal Acceleration<br />
0.4<br />
Figure 25: Example QAR time series Boeing 737-400. Source Van Es & Van der Geest<br />
[2006].<br />
For <strong>air</strong>lines, reliability and accuracy <strong>of</strong> such data is essential. Keeping track <strong>of</strong> all abnormal<br />
occurrences is not only important for flight safety, but first and foremost for their<br />
operational management. Abnormal occurrences are usually associated with additional<br />
costs, e.g. because <strong>of</strong> delays or because <strong>of</strong> extra unscheduled maintenance, and to record<br />
these occurrences is therefore vital for the <strong>air</strong>lines’ pr<strong>of</strong>itability. This, together with the<br />
impressive data capturing capabilities <strong>of</strong> modern Quick Access Recorders, makes <strong>air</strong>line<br />
123<br />
[ g]<br />
[g ]<br />
[g]<br />
[de g ]<br />
1.4<br />
1.2<br />
1<br />
0.2<br />
0<br />
-0.2<br />
Normal Acceleration<br />
-0.4<br />
0 20 40 60<br />
Lateral Acceleration<br />
0.3<br />
0.2<br />
0.1<br />
0<br />
-0.1<br />
0 20 40 60<br />
Elevator Left,Elevator Right<br />
10<br />
5<br />
0<br />
-5<br />
-10<br />
0 20 40 60<br />
time (sec)
data the most accurate and detailed data, suited to quantify the causal <strong>risk</strong> model.<br />
Unfortunately for model developers this data is <strong>of</strong>ten company confidential because <strong>of</strong> the<br />
competition and liability issues. Nevertheless, experience has shown that <strong>air</strong>lines are<br />
sometimes quite willing to share data, provided that certain conditions are met. For<br />
quantification <strong>of</strong> the CATS model for instance, KLM has provided in-flight recorded data.<br />
However, a prerequisite for using this data is that the descriptions and definitions used in<br />
the flight data program are sufficiently similar to the model elements. In the CATS model,<br />
fault tree events were defined without considering the definitions used in flight data<br />
recording programs. A result was that very few (less than 10%) fault tree events could be<br />
quantified directly from in-flight recorded data [Roelen 2008].<br />
8.5.5 Expert judgement<br />
Experts may have valuable knowledge about parameters for problems in their field <strong>of</strong><br />
expertise. Quantification and aggregation <strong>of</strong> experts’ knowledge is frequently used for<br />
assessing variables for which other adequate data are lacking, either because values for<br />
quantified variables are not registered or because objective units <strong>of</strong> measure simple do not<br />
exist, like in the case <strong>of</strong> safety culture. The experts’ knowledge is not certain, but comes<br />
with an implicit level <strong>of</strong> subjective confidence, or degree <strong>of</strong> belief. Often information from<br />
experts is obtained and combined in an informal and ad hoc way, but formal procedures for<br />
eliciting and processing expert judgement are increasingly applied, particularly when the<br />
quality and transparency <strong>of</strong> the results are important. The overall goal <strong>of</strong> these formal<br />
methods is to achieve rational consensus in resulting assessments. This requires that the<br />
process itself optimises performance, as measured by valid expert judgement performance<br />
criteria. Performance criteria are based on ‘calibration’, that is, assessments <strong>of</strong> uncertain<br />
quantities, closely resembling the variables <strong>of</strong> interest, for which true values (e.g., from<br />
experiments) are known beforehand. Criteria for analysing ‘calibration’ assessments are<br />
closely related to standard statistical methods, and are applied both to expert assessments,<br />
and to the combinations <strong>of</strong> expert assessments. The underlying assumption is that experts’<br />
performance on calibration variables predicts their performance on the variables <strong>of</strong> interest.<br />
If systematically obtained from experts who are both knowledgeable and well-calibrated for<br />
the relevant area <strong>of</strong> expertise, expert judgement can <strong>of</strong>fer quite acceptable accuracy <strong>of</strong><br />
quantification [Cooke & Goossens 2000]. The methods have proven to be mature and<br />
provide a scientific tool for achieving additional data that would otherwise remain<br />
unavailable [Goossens et al 2008]. The experts should preferably combine analytical skills<br />
and the ability to provide judgement on unknown (e.g. future) operations. As was explained<br />
in section 4.4, test pilots are specifically trained to provide quantitative estimates on<br />
variables for which other data is lacking and therefore test pilots are particularly suitable to<br />
provide expert judgements on flight operational topics and should be preferred above line<br />
pilots in this respect. In the CATS project, expert judgement was extensively used to<br />
quantify sub-<strong>models</strong> <strong>of</strong> flight crew and <strong>air</strong> traffic controller performance [Roelen et al<br />
2007]. The drawbacks <strong>of</strong> the use <strong>of</strong> expert judgement are primarily practical issues: finding<br />
proper experts is not always easy and expert elicitation can be a time consuming activity.<br />
8.5.6 Empirical studies<br />
Empirical studies can sometimes also provide valuable information for quantification <strong>of</strong><br />
causal model elements. Human factors have been an area <strong>of</strong> quite extensive study and some<br />
<strong>of</strong> the research results are available and usable to quantify causal model parameters. A good<br />
example is flight crew fatigue. Commissioned by the Netherlands Civil Aviation Authority,<br />
the Aviation Medicine Group <strong>of</strong> TNO Human Factors has conducted a number <strong>of</strong> field and<br />
laboratory studies on the different determinants <strong>of</strong> <strong>air</strong>crew fatigue and their effects on<br />
alertness and performance <strong>of</strong> <strong>air</strong>crew. The studies, employing subjective and objective<br />
124
measures <strong>of</strong> in-flight performance and alertness, concerned quality and duration <strong>of</strong> sleep,<br />
effects <strong>of</strong> early reporting times, effects <strong>of</strong> night flying, effects <strong>of</strong> alcohol and medication,<br />
and the effects <strong>of</strong> countermeasures, such as onboard sleep (augmented crew) and preplanned<br />
napping in the cockpit seat [Simons & Valk 1993, 1997, 1998, Simons et al 1994,<br />
Valk & Simons 1996, 1998].<br />
The results <strong>of</strong> these studies provide an extensive database on factors causing <strong>air</strong>crew fatigue<br />
and imp<strong>air</strong>ed performance and alertness in flight. This database is further complemented<br />
with data collected by fellow participants in the European Committee on Aircrew<br />
Scheduling and Safety. Based on the results <strong>of</strong> the <strong>air</strong>crew fatigue studies, a causal model<br />
for flight crew fatigue/alertness has been developed [Roelen et al 2002], see Figure 26.<br />
Flight crew fatigue is determined by the fitness <strong>of</strong> the crew before the flight (pre-flight<br />
fitness), whether it is a day or a night flight, and in-flight operational factors (operational<br />
loads). Factors that influence pre-flight fitness are recent workload and the quality <strong>of</strong><br />
preflight sleep. Operational factors are the flight duty period, and the quality <strong>of</strong> in-flight<br />
rest facilities. In-flight rest facilities are only used on long haul flights. This means that<br />
there is a conditional dependence between flight duty period and rest facility, hence the<br />
arrow linking the two nodes.<br />
Pre-flight<br />
crew fitness<br />
Pre-flight sleep Recent workload<br />
Reporting time<br />
In-flight<br />
crew alertness<br />
Day / night flight<br />
Figure 26: <strong>Causal</strong> <strong>risk</strong> model <strong>of</strong> in-flight crew alertness. Source: [Roelen et al<br />
2002].<br />
The effects <strong>of</strong> psychosocial factors and the use <strong>of</strong> alcohol and drugs are not included in the<br />
model, although it is known that these factors do influence flight crew fatigue/alertness<br />
[Valk et al 1999, Valk & Simons 1994, Valk et al 1997]. Psychosocial factors have not<br />
been explicitly modelled because <strong>of</strong> the difficulty <strong>of</strong> defining them and the variability <strong>of</strong> the<br />
effects they have on different persons. Alcohol and drug use have not been included<br />
because <strong>of</strong> a lack <strong>of</strong> good quality data and the difficulty in separating out the effects <strong>of</strong><br />
alcohol on pre-flight sleep. However, these effects are implicitly included in the model<br />
because they will have influenced the performance <strong>of</strong> the flight crew that have contributed<br />
to the dataset that has been used for quantification. This is an important point to keep in<br />
mind generally and underlines the need to be explicit about data sources and what they<br />
include.<br />
125<br />
Operational load<br />
Flight duty period Rest facility
It takes years to set up and conduct experiments such as those described above for flight<br />
crew fatigue, and it seems unlikely that such experiments will be conducted for the sole<br />
purpose <strong>of</strong> quantifying causal <strong>risk</strong> model parameters. But many experiments are already<br />
being conducted for other purposes, and many <strong>of</strong> those are in the field <strong>of</strong> human<br />
performance. This is exactly an area where incident reporting systems and especially inflight<br />
recorded data are usually rather weak, so the empirical studies can provide very<br />
valuable complementary data which are usable for model development and quantification.<br />
Particularly relevant for pilot performance and <strong>air</strong> traffic controller performance are studies<br />
involving flight simulators and <strong>air</strong> traffic control simulators. The simulators provide a<br />
controlled environment for analysing influences on human performance. An example is the<br />
use <strong>of</strong> the Boeing 747-400 level D 67 qualified full fight simulator at NASA Ames in an<br />
experimental study <strong>of</strong> the balked landing and missed approach manoeuvres to provide data<br />
for pilot control behaviour for different <strong>air</strong>craft configurations and weather conditions<br />
[Hörmann et al 2005, Hosman et al 2005, De Leege et al 2006]. Another simulator at<br />
NASA Ames, the Advanced Concepts Flight Simulator, was used to conduct human in the<br />
loop simulations to understand the factors that contribute to taxiway navigation errors<br />
[Hooey et al 2000]. Another study at NASA Ames involved human in the loop simulations<br />
with <strong>air</strong> traffic controllers and included measurements <strong>of</strong> controller workload [Smith et al<br />
2004], similar experiments have been conducted at <strong>NLR</strong> [Hilburn et al 1998]. Applying<br />
such data may require some flexibility and creativity from the causal model developers<br />
because the empirical studies may provide data on parameters that are defined slightly<br />
differently than those in the model. Unfortunately, simulation facilities to study<br />
organisational influences do not exist.<br />
8.5.7 Safety audits<br />
Audits are becoming an interesting source <strong>of</strong> data as safety audits are beginning to be<br />
widely used and, most importantly, standardised. A great advantage <strong>of</strong> safety audits is their<br />
ability to capture information on the quality <strong>of</strong> safety management and safety culture. Two<br />
audit programs are especially important in this respect; the Line Operations Safety Audit<br />
(LOSA) and the IATA Operational Safety Audit (IOSA).<br />
In a Line Operations Safety Audit (LOSA), trained observers take in-flight notes from the<br />
cockpit jump seat to evaluate several aspects <strong>of</strong> crew performance. LOSA originated at the<br />
request <strong>of</strong> Continental Airlines as an instrument to check whether crew resource<br />
management (CRM) concepts taught in training actually transferred to the line [Helmreich<br />
et al 1994]. Later, threat and error management performance were added to the analysis. At<br />
the core <strong>of</strong> the LOSA process is a model <strong>of</strong> threat and error management, which provides a<br />
framework for data collection. In-flight observers record the various threats encountered by<br />
<strong>air</strong>crew, the types <strong>of</strong> errors committed, and they record how flight crews operationally deal<br />
with these situations to maintain safety. A large LOSA dataset, <strong>air</strong>line de-identified, is<br />
maintained by the University <strong>of</strong> Texas [Klinect et al 2003, Klinect 2005]. ICAO acts as an<br />
enabling partner and promoter in the LOSA program [ICAO 2002b] and the FAA<br />
encourages <strong>air</strong>lines to voluntarily conduct LOSA programs [FAA 2006]. De-identified<br />
LOSA results (all references to the operator are removed) are available from the University<br />
<strong>of</strong> Texas, although experience in the CATS project has shown that it is difficult to access<br />
the data and use it [Lin et al 2008]. A potential weakness <strong>of</strong> the data is that the (causal) link<br />
between threats and errors is subjectively made by the in-flight observers. For example,<br />
during a flight the following observation was made:<br />
67<br />
Flight simulator fidelity is indicated by levels A-D, with D the highest level <strong>of</strong> fidelity.<br />
126
“While in descent the crew was advised by ATC that their runway was to be 26R. After<br />
entering downwind at 6000 ft, the runway was changed to 27. The Captain overshot the<br />
runway 27 centerline slightly while trying to brief the new approach”.<br />
The observer classified this event as follows:<br />
threat code ATC runway change<br />
threat outcome linked to flight crew error.<br />
The observer in this case subjectively assumes the centreline overshoot is caused by the late<br />
runway change and not by for instance poor training or strong crosswinds. The data are<br />
therefore only valuable when observers are very familiar with an operational flight deck<br />
environment and very familiar with the LOSA threat and error management framework.<br />
Typically retired pilots are used who have had 5 days <strong>of</strong> training on the LOSA<br />
methodology [Klinect et al 2003], which makes it plausible that indeed the data is<br />
sufficiently valid. Unfortunately, this type <strong>of</strong> operational observations is only good for<br />
capturing active failures, latent failures are likely to remain hidden. LOSA data could be<br />
used to populate those parts <strong>of</strong> the model that represent flight crew performance, including<br />
the most direct managerial influences on this performance.<br />
The name ‘audit’ given to this data source is an unfortunate one, since in general safety<br />
management literature, the term is confined to check on the safety management system and<br />
its functioning. LOSA, in contrast, is a behavioural observation technique which confines<br />
itself to the actions and reactions <strong>of</strong> flight crew and has no direct data about organisational<br />
factors influencing those.<br />
The IATA 68 Operational Safety Audit (IOSA) conforms much more to the traditional safety<br />
management audit and is more suitable for identifying latent failures. IOSA is designed to<br />
assess the operational management and control systems <strong>of</strong> an <strong>air</strong>line. Table 4 gives an<br />
overview <strong>of</strong> the areas that are covered during the audit [IATA 2008a]. During an audit, an<br />
operator is assessed against the IOSA Standards and Recommended Practices contained in<br />
the IOSA Standards Manual [IATA 2008b]. The standards and recommended practices<br />
cover issues such as training and qualification, provision <strong>of</strong> resources, emergency response,<br />
procedures, communication and coordination. To determine conformity with any standard<br />
or recommended practice, the IOSA Auditor will assess the degree to which specifications<br />
are documented and implemented by the operator. Registration is the final objective <strong>of</strong> the<br />
IOSA audit process. An <strong>air</strong>line that has been audited under the IOSA program and<br />
demonstrated full conformity with the IOSA standards will be entered in the IATA registry<br />
as an IOSA Operator. The audits are conducted by organisations that are accredited by<br />
IATA [Bisignani 2006]. The main disadvantage <strong>of</strong> this program is that the data, common to<br />
virtually all data that is collected by IATA, is difficult to get hold <strong>of</strong>. The audited <strong>air</strong>line is<br />
the sole owner <strong>of</strong> its audit report. An interested party desiring access to an audit report must<br />
submit an application to IATA, which retains electronic versions <strong>of</strong> audit reports in a<br />
custodial capacity. Any and all requests for access to an audit report must be expressly<br />
authorised by the audited <strong>air</strong>line before IATA will grant access.<br />
68<br />
International Air Transport Association (IATA) is the <strong>air</strong> <strong>transport</strong> industry global trade<br />
organisation. Its members comprise some 250 <strong>air</strong>lines.<br />
127
Another problem with the use <strong>of</strong> audit results is the danger <strong>of</strong> lack <strong>of</strong> focus. If the goal <strong>of</strong><br />
the audit is to assess an organisation’s effectiveness for a focussed objective such as major<br />
hazard control, the auditors (and those that use the results <strong>of</strong> the audit) must check that the<br />
links to the major accident scenarios are in place, not just the links to other parts <strong>of</strong> the<br />
company processes [Hale 2001]. The only auditors who can penetrate the heart <strong>of</strong> the<br />
matter are ones with sufficient knowledge <strong>of</strong> the technology or activity to know what the<br />
crucial aspects <strong>of</strong> control are. For both the LOSA and the IOSA audits this seems to be the<br />
case, so indeed results from these audits are useful and relevant.<br />
Data from LOSA and IOSA will provide exposure data for the model, as they will show<br />
how <strong>of</strong>ten particular deviations (flight crew errors in the case <strong>of</strong> LOSA, managerial and<br />
control system failures in the case <strong>of</strong> IOSA) occur. This can then be compared to the<br />
occurrence <strong>of</strong> the same deviations in accidents to estimate the relative contribution <strong>of</strong> the<br />
errors to the accident.<br />
Table 4: IOSA standards<br />
Discipline Activities and Processes<br />
Organisation and Management System<br />
Flight Operations Line flight – flight deck operations<br />
Simulator session<br />
Training flight<br />
Operational Control and Flight Dispatch Flight planning<br />
Flight monitoring<br />
Aircraft Engineering and Maintenance AD/ASB process<br />
Maintenance activities<br />
Maintenance processes<br />
Cabin and Cargo Compartment Operations Line flight – passenger cabin operations only<br />
Ground Handling Weight and balance calculation<br />
Ground handling activities<br />
Cargo Operations Aircraft loading or unloading<br />
Operational Security Baggage reconciliation<br />
Pre-Board/hold room screening<br />
Aircraft access control<br />
Preflight crew security briefing<br />
8.6. Denominator data<br />
Quantification <strong>of</strong> the occurrence rate <strong>of</strong> certain events requires not only a counting <strong>of</strong> the<br />
number <strong>of</strong> occurrences <strong>of</strong> the events, but also requires counting the associated number <strong>of</strong><br />
attempts.<br />
Occurrence rate = number <strong>of</strong> occurrences <strong>of</strong> event / number <strong>of</strong> attempts<br />
The ‘number <strong>of</strong> attempts’ is what we call denominator data. Event occurrences are<br />
routinely reported and registered, but the non-events, the number <strong>of</strong> attempts, quite <strong>of</strong>ten<br />
remain ‘unnoticed’. Efforts focus on event data capture, but quantification <strong>of</strong> rates is<br />
impossible without denominator data. When the objective is quantification, non-event data<br />
is just as important as event data. Due to the large number <strong>of</strong> variables and combinations <strong>of</strong><br />
variables, collection and analysis <strong>of</strong> denominator data is no easy task. Consider for example<br />
the issue <strong>of</strong> landing overrun accidents. A landing overrun accident occurs if during landing<br />
the <strong>air</strong>craft is not able to stop before the end <strong>of</strong> the runway. The hypothesis is that one <strong>of</strong><br />
128
the causal factors <strong>of</strong> such accidents is a wet runway due to rain. To test this causal claim we<br />
must know the number <strong>of</strong> overrun accidents, the number <strong>of</strong> overrun accidents that involved<br />
wet runways, the total number <strong>of</strong> landings regardless <strong>of</strong> the runway condition and the<br />
number <strong>of</strong> landings on wet runways. The accident data is easy to find in accident and<br />
incident databases, the total number <strong>of</strong> landings can be found in <strong>air</strong> traffic statistics such as<br />
<strong>air</strong>line timetables [Vos 1996], but nobody records the number <strong>of</strong> landings on wet runways.<br />
To circumvent this difficulty we must combine weather information with traffic data. This<br />
approach was followed by Van Es et al [1998] to show a five-fold increase in <strong>risk</strong> for<br />
passenger jet <strong>air</strong>craft landing on a wet runway. In general, denominator data can be<br />
obtained by combining different databases. Databases that are typically required as a<br />
minimum for a causal <strong>risk</strong> model are those that capture data on <strong>air</strong>craft movements (origindestination),<br />
<strong>air</strong>craft utilisation (cycles for each <strong>air</strong>craft), <strong>air</strong>ports (runways and navigation<br />
aids), weather, <strong>air</strong>craft (physical characteristics, equipment and performance), <strong>air</strong>lines (state<br />
<strong>of</strong> registration, fleet size, <strong>air</strong>craft types, destinations, financial situation), etc.<br />
In-flight recorded data is potentially a significant source for denominator data, but currently<br />
the focus there is primarily on parameter threshold crossings. Data on parameters that stay<br />
within their normal operational boundaries is usually discarded, although there are some<br />
initiatives to conduct flight data analysis <strong>of</strong> full datasets including normal parameter values<br />
as well as parameter threshold crossings [Roelen et al 1998].<br />
Denominator data for human (flight crew) performance can potentially be obtained from<br />
LOSA (see also previous section). Although LOSA was developed for individual <strong>air</strong>lines to<br />
improve their safety performance, we are able to get a much broader picture <strong>of</strong> flight crew<br />
behaviour in normal operations by combining the results <strong>of</strong> several <strong>air</strong>lines [Klinect 2005].<br />
The potential <strong>of</strong> using LOSA data for this purpose is also recognised by Castano & Graeber<br />
[2002], but it can only be fulfilled if agreements can be made with the <strong>air</strong>lines and pilot’s<br />
associations on collection and distribution <strong>of</strong> this information, a difficult but certainly not<br />
impossible task.<br />
8.7. Using the data<br />
Existing databases can only be used for quantification <strong>of</strong> a causal <strong>risk</strong> model if it is possible<br />
to match the data set to model elements. In the case <strong>of</strong> databases that store occurrences in a<br />
free text format, the mapping <strong>of</strong> occurrences to model elements requires analysis and<br />
interpretation by the model developer and hence introduces subjectivity. It will also involve<br />
a significant manpower. Automated keyword searches can be used for pre selection, but<br />
after that each individual incident description will have to be read to determine if it really<br />
meets all criteria.<br />
If data is stored according to a classification system it all depends on the way in which the<br />
definitions and criteria <strong>of</strong> the classification system match with the definitions and criteria<br />
used for the model elements. Ideally, there is a one to one match from the database to the<br />
model elements. Reality is <strong>of</strong>ten different. An <strong>air</strong>line’s flight safety reporting system can<br />
for instance contain the event descriptor ‘ATM confusing instructions’. Mapping this event<br />
descriptor to model elements requires information on the content <strong>of</strong> the confusion (is it not<br />
clear to which <strong>air</strong>craft the instruction is intended or is the phraseology non-standard, etc.)<br />
and the context (e.g. is it in the <strong>air</strong> or on the ground). Additional information must be<br />
obtained, for instance from the free-text description <strong>of</strong> the occurrence, to get a one to one<br />
match. This is time-consuming and the process cannot be automated.<br />
129
Ambiguity in the classification system is also problematic. The classification system <strong>of</strong><br />
ECCAIRS is an example <strong>of</strong> a system that contains ambiguity. The same occurrence can be<br />
coded in different ways and criteria and definitions are not sufficiently clear. For instance<br />
the event type with code 2060200 ‘<strong>air</strong>craft damage caused by foreign object’ is defined as<br />
‘an event involving foreign object damage to the <strong>air</strong>craft’. The event type with code<br />
2060800 ‘damage caused by object’ is defined as ‘an event involving damage to the <strong>air</strong>craft<br />
when the <strong>air</strong>craft was struck by an object’. The difference between an ‘object’ and a<br />
‘foreign object’ is not clear. Similarly ambiguous are events 2061000 ‘damage caused by<br />
turbulence’ and event 2061200 ‘damage caused by wind’; the difference between<br />
‘turbulence’ and ‘wind’ is unclear.<br />
The problem is amplified when different databases need to be combined to quantify a<br />
model element. Take for instance the event ‘unstabilized runway approach 69 ’. Airlines<br />
record unstable approaches automatically with their flight data monitoring program, so<br />
most <strong>air</strong>lines have accurate data on where and when unstable approaches have occurred.<br />
But if <strong>air</strong>line A defines ‘correct speed’ as between Vref and Vref +15 kts, and <strong>air</strong>line B<br />
considers an approach speed between Vref and Vref+20 as ‘correct’, the data from <strong>air</strong>line A<br />
and B cannot be straightforwardly combined to estimate the unstabilized approach<br />
probability to be used in the model. Even for seemingly unambiguous parameters such as,<br />
say, crosswind, there are differences in how speed measurements are averaged over time, if<br />
and how gusts are included, at what height and location the wind is measured, etc. For<br />
parameters which cannot be measured directly and are interpreted and classified before they<br />
get stored in the data system it is even more complex. When complex data systems are<br />
used, like ICAO’s ADREP, there is the possibility <strong>of</strong> differences in interpretation. Consider<br />
for instance the two following ‘events’ in ADREP:<br />
2010101 Altitude bust<br />
An event related to the <strong>air</strong>craft not obtaining/maintaining the assigned altitude<br />
2020517 Deviation from clearance – assigned flight level<br />
An event related to a deviation from an <strong>air</strong> traffic control assigned flight level<br />
Considering that a flight level indicates an altitude, and that altitudes can only be assigned<br />
by Air Traffic Control, it is difficult, if not impossible, to discern the difference between<br />
these two events.<br />
A way to minimise these difficulties is by using definitions and criteria from existing data<br />
classification systems in defining the model elements. Despite the inherent problems <strong>of</strong><br />
ECCAIRS it is prudent to use this as the main reference. ECCAIRS’ classification system<br />
is a European and world standard (as it is similar to ADREP) and feeds the largest<br />
European database on aviation accidents and incidents. A significant amount <strong>of</strong> resources<br />
was spent to develop ECCAIRS and associated legislation and it took a lot <strong>of</strong> effort to have<br />
it accepted by most <strong>of</strong> the European aviation authorities 70 . Access to the ECCAIRS<br />
database is not restricted and the associated s<strong>of</strong>tware is freely available. Development <strong>of</strong> a<br />
causal <strong>risk</strong> model that uses the same definitions as the database is beneficial to both the<br />
model and the data base. For the database the advantage is the possibility to use the data for<br />
69<br />
An approach is considered stabilized when the <strong>air</strong>craft is in the correct landing<br />
configuration and with the correct speed on the correct glide path, and only small changes<br />
in heading and pitch are required to maintain the correct glide path.<br />
70<br />
Some authorities, like the British CAA, refuse to accept ECCAIRS.<br />
130
analysis instead <strong>of</strong> just storing it, and for the model the advantage is the continuous and<br />
direct feeding <strong>of</strong> the model with the most recent information from an accepted system,<br />
increasing the likelihood that the model will be accepted as well.<br />
In the CATS model the breakdown <strong>of</strong> events and causal factors into individual model<br />
elements was guided by the principle to consider the potential causes <strong>of</strong> accidents as barrier<br />
failures. This has the advantage <strong>of</strong> being very structured, but also results in base events<br />
which cannot always be mapped onto existing data classification systems. An event such as<br />
a ‘disorientating manoeuvre’, which is part <strong>of</strong> CATS’ fault tree related to the spatial<br />
disorientating type accident cannot be found directly in ECCAIRS. Ideally, the causal <strong>risk</strong><br />
model is fed directly and continuously with data from an occurrence reporting system. This<br />
will strengthen the credibility <strong>of</strong> the <strong>risk</strong> model and simultaneously enhance the usability <strong>of</strong><br />
the data system. ECCAIRS is a potential candidate, but it is currently not yet entirely<br />
suitable due to the ambiguity in the classification system and the errors that are being made<br />
during data entry.<br />
Whatever data source is used, verification <strong>of</strong> the data analysis process must be possible,<br />
even after model development has been completed. Therefore accurate bookkeeping is<br />
essential if data is used to generate numbers for the causal <strong>risk</strong> model. The process for<br />
obtaining and processing data must be transparent and results must be traceable for third<br />
parties. A complicating factor is the confidentiality <strong>of</strong> some <strong>of</strong> the data. Good quality data<br />
starts with a good quality database. Database control procedures must ensure that each<br />
database is uniquely identified by a name and a version number. A procedure must be in<br />
place to record, for each data base, the following characteristics:<br />
• Source organisation (e.g. ICAO, Airclaims, etc);<br />
• Description <strong>of</strong> the type <strong>of</strong> data (e.g. accident, incident, etc.);<br />
• Applicable time period;<br />
• Scope. This should be defined as specifically as possible. Think <strong>of</strong> e.g. type <strong>of</strong><br />
operation, geographical region, etc;<br />
• Data base change log.<br />
Procedures for data selection and analysis must ensure that for each result (probability<br />
estimate) the following information is registered:<br />
• The data source (uniquely identified by the database name and version number)<br />
that was used;<br />
• Data query;<br />
• Description <strong>of</strong> criteria used for ‘manual’ selection <strong>of</strong> data;<br />
• A copy <strong>of</strong> the resulting dataset.<br />
A positive feature <strong>of</strong> the CATS model is that it uses ‘real’ and existing data for<br />
quantification <strong>of</strong> occurrence frequencies and exposure, and the procedures for data<br />
selection and analysis as described above were strictly followed. The <strong>NLR</strong> Air Safety<br />
Database and ECCAIRS were used as main sources <strong>of</strong> data. Because the <strong>NLR</strong> Air Safety<br />
Database combines information from many different sources the sample size is in general<br />
larger than when using a single source <strong>of</strong> data. As a result, generic as well as specific<br />
situations can be represented, like for instance a (generic) accident rate for jet <strong>air</strong>craft and a<br />
(specific) landing accident rate for Boeing 737 <strong>air</strong>craft. If existing data were not available<br />
for model quantification, expert judgement was used, applying the techniques developed by<br />
Cooke & Goossens [2000]. The values <strong>of</strong> the variables used in the CATS model are all<br />
expressed in objectively quantifiable units. The model and its results are therefore less<br />
131
vulnerable to differences in interpretation. This all contributes to minimising the potential<br />
ambiguity in the model and uncertainty in the model results.<br />
8.8. Conclusions for this section<br />
Quantification <strong>of</strong> the probability <strong>of</strong> occurrence <strong>of</strong> variables and the conditional probabilities<br />
in the causal <strong>risk</strong> model is done by using existing data or by expert opinion. Often different<br />
sources <strong>of</strong> data will need to be combined. It is therefore extremely important to ascertain<br />
that the same variable descriptions and units <strong>of</strong> measurement are used. The use <strong>of</strong> standard<br />
units <strong>of</strong>fers the greatest flexibility to express the condition <strong>of</strong> variables and is therefore<br />
preferred. But sometimes it is impossible or impractical to apply a standard quantitative<br />
unit <strong>of</strong> measurement. We can then use a qualitative rating scale, or select a proxy variable<br />
that is closely related to the variable <strong>of</strong> interest and which can be quantified. One <strong>of</strong> the<br />
main difficulties in developing a causal <strong>risk</strong> model for aviation lies in the need to express<br />
‘s<strong>of</strong>t’ factors in objectively quantifiable units. Proper units for the quality <strong>of</strong> procedures,<br />
commitment <strong>of</strong> personnel, safety culture or non-technical skills <strong>of</strong> pilots do not yet exist.<br />
Proxy variables are also difficult to find, as many <strong>of</strong> these s<strong>of</strong>t factors are multidimensional.<br />
We will have to use less well defined quantities and units <strong>of</strong> measurement at the <strong>risk</strong> <strong>of</strong><br />
adding variability to the model and increased uncertainty <strong>of</strong> the model results.<br />
Simultaneously we must continue trying to find proper units for these complex issues.<br />
For some applications <strong>of</strong> a causal <strong>risk</strong> model an outcome using an ordinal scale may be<br />
sufficient, but this does not mean that it is sufficient to express each individual element <strong>of</strong><br />
the model as an ordinal value. A high numerical accuracy may not necessarily be needed<br />
for the final model outcome but the numerical accuracy <strong>of</strong> the underlying causal relations is<br />
important. Levels <strong>of</strong> uncertainty <strong>of</strong> the <strong>models</strong> are equally important as point estimates.<br />
Confidence intervals for expert judgement data require special attention. It is incorrect to<br />
treat confidence intervals provided by experts in the same way as confidence intervals that<br />
are the result <strong>of</strong> controlled experiments. To get a proper picture on the uncertainty <strong>of</strong> the<br />
results <strong>of</strong> a causal <strong>risk</strong> model it is necessary to conduct a thorough identification and<br />
analysis <strong>of</strong> all assumptions adopted, including assumptions on parameter values used, and<br />
assess the individual and combined effect <strong>of</strong> these assumptions on the model results.<br />
The credibility <strong>of</strong> the whole causal <strong>risk</strong> model depends on the quality <strong>of</strong> the model structure<br />
and on the sources <strong>of</strong> the numerical data to be used and the confidence that one can have in<br />
the figures. The accident investigation report is without doubt the single most complete and<br />
accurate source <strong>of</strong> information regarding an accident. Due to the low frequency <strong>of</strong> major<br />
accidents the investigation reports are not sufficient to populate all parts <strong>of</strong> the causal <strong>risk</strong><br />
model. Other sources <strong>of</strong> information are required to complete quantification <strong>of</strong> the model.<br />
Incident reporting systems capture vast amounts <strong>of</strong> data with relatively little effort, but<br />
during the coding process information may get lost or is incorrectly classified. Voluntary<br />
incident reporting systems are not very well suited to conduct a statistical analysis or to<br />
provide quantitative data to the causal <strong>risk</strong> model. In-flight recorded data are the most<br />
accurate and detailed data, suited to quantify the causal <strong>risk</strong> model. Unfortunately for model<br />
developers these data are <strong>of</strong>ten company confidential because <strong>of</strong> the competition and<br />
liability issues. Nevertheless, experience has shown that <strong>air</strong>lines are sometimes quite<br />
willing to share data, provided that certain conditions are met.<br />
Incident reporting systems and in-flight recorded data are usually rather weak in capturing<br />
data on human performance. Empirical data can sometimes be used to fill this gap.<br />
Applying the data may require some flexibility and creativity from the causal model<br />
developers because the empirical studies may provide data on parameters that are defined<br />
132
slightly differently than those in the model. Studies involving flight simulators and <strong>air</strong><br />
traffic control simulators are useful for data on performance <strong>of</strong> the pilot and <strong>air</strong> traffic<br />
controller performance. Unfortunately there are no simulators to obtain data on<br />
organisational performance. The only alternative then is expert judgement. The experts<br />
should preferably combine analytical skills and the ability to provide judgement on<br />
unknown (e.g. future) operations. If systematically elicited from experts who are both<br />
knowledgeable and well-calibrated for the relevant area <strong>of</strong> expertise, expert judgement can<br />
<strong>of</strong>fer quite acceptable accuracy <strong>of</strong> quantification. The drawbacks <strong>of</strong> the use <strong>of</strong> expert<br />
judgement are primarily practical issues: finding proper experts is not always easy and<br />
expert elicitation can be a time consuming activity.<br />
Quantification <strong>of</strong> the occurrence rate <strong>of</strong> events requires denominator data. Due to the large<br />
number <strong>of</strong> variables and combinations <strong>of</strong> variables, collecting and analysis <strong>of</strong> denominator<br />
data is more than simply counting the number <strong>of</strong> flights but requires combining the<br />
information from several different databases. In-flight recorded data is potentially a<br />
significant source for denominator data, but currently the focus there is primarily on<br />
parameter threshold crossings. Non-event data is usually discarded, although there are some<br />
initiatives to conduct flight data analysis <strong>of</strong> full datasets including normal as well as<br />
threshold crossing data. LOSA results are a potentially valuable source <strong>of</strong> denominator data<br />
for flight crew performance, IOSA results are a source <strong>of</strong> denominator data for managerial<br />
<strong>risk</strong> control failures within an <strong>air</strong>line. FDR data and LOSA and IOSA results are considered<br />
confidential information by the <strong>air</strong>lines, so proper agreements with the <strong>air</strong>lines and pilot<br />
associations are required in order to use this kind <strong>of</strong> data to quantify causal <strong>risk</strong> <strong>models</strong>.<br />
To avoid problems due to differences in definitions between model elements and data<br />
classifications, a causal <strong>risk</strong> model should conform to definitions used in an existing<br />
database, preferably ECCAIRS because it is widely used and is freely accessible. This will<br />
also strengthen the credibility <strong>of</strong> the <strong>risk</strong> model and simultaneously enhance the usability <strong>of</strong><br />
ECCAIRS. But simultaneously ECCAIRS should also be improved. The ambiguity in the<br />
classification system should be resolved and the system should be able to provide the data<br />
and data quality that is required by the model.<br />
Verification <strong>of</strong> the data analysis process must be possible, even after model development<br />
has been completed. Therefore accurate bookkeeping is essential if data are used to<br />
generate numbers for the causal <strong>risk</strong> model.<br />
133
Chapter 9. Modelling challenges<br />
In the previous sections we identified three user requirements (section 4) that are difficult<br />
from a modelling point <strong>of</strong> view:<br />
• Representing the role <strong>of</strong> the human operator (problematic because <strong>of</strong> different<br />
views on how to deal with human operators in quantitative safety assessments, see<br />
section 4.4).<br />
• Including an explicit representation <strong>of</strong> the possible impact <strong>of</strong> organisation and<br />
management on safety performance (Section 6.1 shows that this is still a weakness<br />
in the nuclear power industry and other industries).<br />
• Representation <strong>of</strong> dependencies between model elements. Assembling all available<br />
knowledge and data on a very large and complex system and unravelling this<br />
complexity into individual cause-effect relations that each can be represented<br />
separately (Section 7).<br />
This chapter describes those aspects. It is explained why they are so difficult and what are<br />
possible solutions to the problems encountered. The concept <strong>of</strong> accident archetypes is<br />
introduced as part <strong>of</strong> the proposed solution for getting to grips with the complexity <strong>of</strong><br />
accident scenarios and the role <strong>of</strong> human performance in those accidents.<br />
9.1. Modelling human operators<br />
Safety in the aviation system is influenced by human actions and decisions at every level <strong>of</strong><br />
management and throughout all disciplines. The strongest influence is at the operations<br />
level, where the actions <strong>of</strong> pilots and <strong>air</strong> traffic controllers play a much greater role in <strong>risk</strong><br />
control than in such systems as nuclear power and chemical industries, which have been the<br />
subject <strong>of</strong> the majority <strong>of</strong> human performance modelling in the past. <strong>Causal</strong> aviation <strong>risk</strong><br />
<strong>models</strong> necessarily require causal sequences and probabilities to be estimated for (failure)<br />
events involving human actions and decisions. They need to describe the cause <strong>of</strong> the<br />
human actions as well as the consequences <strong>of</strong> those actions, particularly when they are<br />
‘erroneous’. The human is extremely interactive and adaptive and does not function in the<br />
same way as hardware components. There is greater variability and interdependence in<br />
human performance and people rely much more on error detection and correction as<br />
strategies for error reduction and <strong>risk</strong> control, compared to hardware that is designed to<br />
function correctly the first time. To provide the necessary representation <strong>of</strong> human actions,<br />
specific human performance <strong>models</strong> must be developed. In particular, these <strong>models</strong> must be<br />
able to quantify human error probabilities. These <strong>models</strong>, in essence, fill in the gap between<br />
a defined task in a <strong>risk</strong> control measure and the delivery systems for competence,<br />
commitment, etc. (see also the section on the modelling <strong>of</strong> safety management). Ideally, the<br />
<strong>models</strong> should include feedback loops to represent the adaptive nature <strong>of</strong> human ‘systems’<br />
[Wewerinke 1989].<br />
Techniques for human error prediction analysis can be either qualitative, like task analysis<br />
to identify opportunity for error, or quantitative, like identifying probabilities associated<br />
with particular error types. There are vast amounts written on human error (types <strong>of</strong> error<br />
and why the errors occur), and on human reliability assessment techniques [Swain &<br />
Guttmann 1983, Wiegman & Shappell 2001, Kirwan 1994, Hollnagel 1998, Rasmussen<br />
134
1983]. Much <strong>of</strong> this work has been stimulated by the nuclear industry. Human reliability<br />
assessment involves the identification <strong>of</strong> opportunities for error, generally in an operating<br />
system, and then calculation <strong>of</strong> the probability <strong>of</strong> error. This calculation can be either<br />
through structured expert judgement techniques or selection <strong>of</strong> data from a database<br />
[Roelen et al 2000b]. Human error modelling started in earnest in the 1970s. The vast<br />
majority <strong>of</strong> the early development <strong>of</strong> techniques for hazard identification and hazard<br />
representation was based on modelling hardware failures. Since human behaviour and<br />
failure is different from hardware performance and failure, new techniques had to be<br />
developed to incorporate it. In particular, human behaviour is strongly influenced by<br />
recovery actions as well as initial failures and by use <strong>of</strong> mental ‘<strong>models</strong>’ to anticipate things<br />
to come.<br />
The classical approach in human error quantification is applied to errors <strong>of</strong> omission and is<br />
to use basic error probabilities that are modified to account for specific circumstances or<br />
contexts. Human error probabilities for general types <strong>of</strong> tasks are adjusted for the influence<br />
<strong>of</strong> possible circumstances or contexts by the application <strong>of</strong> performance shaping factors<br />
[Swain & Guttmann 1983]:<br />
N<br />
∑<br />
i=<br />
1<br />
P ( error)<br />
HEP*<br />
PSF *<br />
= (1)<br />
i Wi<br />
HEP is the human error probability for a certain generic task, PSFi is the ith performance<br />
shaping factor and Wi is the weight <strong>of</strong> PSFi. Examples <strong>of</strong> generic tasks are selecting a<br />
control, operating a control, etc. These are very small steps in tasks and therefore lose the<br />
context <strong>of</strong> the whole task, its objectives and variability, which all has to be catered for in<br />
PSFs. Examples <strong>of</strong> performance shaping factors are workload or time since last recurrent<br />
training. Performance shaping factors are not normally seen to be causal in a strict sense,<br />
but are generally thought <strong>of</strong> as factors that contribute to how erroneous actions manifest<br />
themselves [Hollnagel 1998]. A strict methodology for deriving performance shaping<br />
factors does not exist. They are known, through experience, to have consequences for how<br />
the task is carried out and how frequently errors occur. Two <strong>of</strong> the most <strong>of</strong>ten used<br />
techniques that follow this approach are HEART (Human Error Assessment and Reduction<br />
Technique) [Kirwan 1994] and THERP (Technique for Human Error Rate Prediction)<br />
[Swain & Guttmann 1983]. Application <strong>of</strong> these and similar first generation methods<br />
usually require a task analysis in combination with engineering techniques such as fault and<br />
event tree logic to identify where errors are important. These latter methods are better at<br />
dealing with omissions/procedures and are not good at supporting the identification <strong>of</strong><br />
errors <strong>of</strong> commission 71 . Errors <strong>of</strong> commission are particularly difficult to identify with<br />
techniques that only look at the logical operation and failures <strong>of</strong> the system according to<br />
design and planned procedures. Identifying such errors requires special support that is not<br />
readily available in the traditional way that fault trees and event trees were built to include<br />
human error [Hale et al 1999]. In particular the construction <strong>of</strong> fault trees from<br />
planned/intended system performance, by systematically incorporating the omission or<br />
failure <strong>of</strong> each intended step, will incorporate many slips and lapses, but miss many<br />
mistakes and some violations. Accident and incident analysis has shown that human<br />
failures that contribute to severe consequences, and that involve highly trained staff using<br />
71<br />
An error <strong>of</strong> omission is a human failure event resulting from a failure to take a required<br />
action. An error <strong>of</strong> commission is a human failure event resulting from an overt unsafe<br />
action [NRC 2007b].<br />
135
considerable procedure guidance, do not usually occur randomly or as a result <strong>of</strong> simple<br />
inadvertent behaviour such as missing a procedure step or failing to notice certain<br />
indications. Instead, such failures occur when the operators are placed in an unfamiliar<br />
situation where their training and procedures are inadequate or do not apply, or when some<br />
other unusual set <strong>of</strong> circumstances exists [NRC 2007b].<br />
A second drawback <strong>of</strong> the way in which first generation techniques combine human error<br />
probabilities and performance shaping factors is the assumption that the performance<br />
shaping factors are mutually independent. This is not a very reasonable assumption. As an<br />
example, stress cannot be considered independent <strong>of</strong> workload. Second generation methods<br />
have been developed that try to cope with these issues. Examples <strong>of</strong> second generation<br />
methods are ATHEANA (A Technique for Human Event Analysis) [NRC 2007b] and<br />
CREAM (Cognitive Reliability and Analysis Method). A key-issue in ATHEANA is the<br />
identification <strong>of</strong> plausible error-likely situations and potential error forcing contexts.<br />
ATHEANA estimates the probability <strong>of</strong> making an error in such situations. According to<br />
this approach, equation 1 is only valid for situations in which a strong error forcing context<br />
is not likely. The CREAM method starts with identifying the context and common<br />
performance conditions [Hollnagel 1998]. It is assumed that the most important factor to<br />
estimating human performance is the degree <strong>of</strong> control that human operators have over the<br />
situation or context. CREAM suggests a division <strong>of</strong> the degree <strong>of</strong> control into four<br />
categories: scrambled, opportunistic, tactical and strategic. CREAM provides a method for<br />
determining the control mode (and associated error probability) from factors (called<br />
Common Performance Conditions) that describe the context.<br />
In a causal model representation, some <strong>of</strong> the limitations <strong>of</strong> human reliability methods like<br />
equation 1 can be overcome by using influence diagrams such as Bayesian Belief Nets to<br />
represent the influence <strong>of</strong> the context or performance shaping factors on error probability.<br />
In such a BBN the overall error probability is calculated as a conditional probability <strong>of</strong> a<br />
particular set <strong>of</strong> performance shaping factors rather than a sum <strong>of</strong> separate and independent<br />
performance shaping factors. Dependencies between performance shaping factors are<br />
represented in the influence diagram by an arc, in Figure 27 for example the likelihood <strong>of</strong><br />
PSF 1 depends on the value <strong>of</strong> PSF 2.<br />
PSF 1<br />
PSF 2<br />
Error<br />
probability<br />
Figure 27: Influence <strong>of</strong> performance shaping factors on error probability represented in an<br />
influence diagram<br />
136<br />
PSF N
Such an approach is adopted in the CATS model [Ale et al 2007] where the actual flight<br />
crew error follows from the part <strong>of</strong> the model which the human error model ties into.<br />
Mapping <strong>of</strong> accident and incident data on those fault trees will ensure that both errors <strong>of</strong><br />
omission as well as errors <strong>of</strong> commission will be captured in the model. The context is thus<br />
defined by the model structure and the associated event in the fault tree is used to estimate<br />
the basic human error probability from accident and incident data instead <strong>of</strong> deriving this<br />
from a task analysis as is the case in first generation human performance methods, see<br />
Figure 28. The human performance model attached to the fault tree base event that defines<br />
the error (<strong>of</strong> commission or omission) describes the influence <strong>of</strong> human performance<br />
factors on the error probability. Whether this approach is indeed suitable for analysis <strong>of</strong><br />
errors <strong>of</strong> commission is still open and needs solving, but is considered to be beyond the<br />
scope <strong>of</strong> this thesis.<br />
CONTEXT<br />
Figure 28: Schematic <strong>of</strong> the way in which a human performance influence diagram is<br />
linked to an accident scenario in CATS.<br />
But the problem still exists <strong>of</strong> how to select and assess the performance shaping factors or<br />
common performance conditions. It is also important to keep in mind how this could be<br />
linked to management <strong>of</strong> the human error probability. The ‘levers’ for management to<br />
influence the human error probabilities are primarily the performance shaping factors since<br />
the nature <strong>of</strong> the tasks are <strong>of</strong>ten not subject to change 72 . Safety management can be<br />
considered as the process <strong>of</strong> delivering the necessary resources and criteria for the front-line<br />
workforce at the task execution level to operate safely (see next section). Generic Delivery<br />
Systems were defined to describe the process <strong>of</strong> providing the resources and criteria<br />
[Bellamy et al 1999]. This means that how ‘levers’ for management (the performance<br />
shaping factors) can be changed can be described as delivery systems, see Figure 29.<br />
72<br />
Changing the nature <strong>of</strong> the task is <strong>of</strong>ten more drastic and long term (requires redesign,<br />
automation, etc) than changing the performance shaping factors.<br />
137
Procedures<br />
Availability<br />
Error<br />
probability<br />
Competence Communication<br />
Figure 29: Representation <strong>of</strong> delivery systems as influences on human error.<br />
They then provide a convenient framework for selecting performance shaping factors and<br />
providing the link between management and human error probability. This approach was<br />
followed in the CATS model, see Appendix C. It is <strong>of</strong> course necessary to keep in mind the<br />
requirement from the previous chapter to express the performance shaping factors in<br />
objectively quantifiable units. Performance shaping factors and delivery systems are also<br />
not fully compatible without some work to fit them together, but this can be done as<br />
proposed in Table 5 which links error-producing conditions from HEART with the delivery<br />
systems. This table is not intended as a definitive comparison, but merely as an illustration<br />
<strong>of</strong> how performance shaping factors could be linked to delivery systems.<br />
Irrespective <strong>of</strong> whether first generation human reliability methods with performance<br />
shaping factors or more advanced methods with control modes and common performance<br />
conditions are preferred, a remaining difficulty is the great variability <strong>of</strong> contexts for a<br />
flight crew. Traffic density, <strong>air</strong>craft type, weather conditions, route structures, <strong>air</strong>craft<br />
system status, flight phase, flight delay status, fatigue, crew composition, etc., are all part <strong>of</strong><br />
the context. The possible combinations <strong>of</strong> factors are almost unlimited, and establishing the<br />
most appropriate performance shaping factors for each combination will be very difficult<br />
indeed. A solution to this problem is presented in section 9.3, where the concept <strong>of</strong> accident<br />
archetypes is presented.<br />
138<br />
Motivation<br />
Equipment<br />
interface
Table 5: Proposed linkage <strong>of</strong> HEART error producing conditions and delivery systems.<br />
EPCs from Kirwan [1994].<br />
HEART error producing condition Delivery system<br />
Unfamiliarity with a situation which is potentially important but Competence;<br />
which only occurs infrequently, or which is novel.<br />
Procedures<br />
A shortage <strong>of</strong> time available for error detection and correction. Availability<br />
A low signal-to-noise ratio.<br />
Interface;<br />
Communication.<br />
A means <strong>of</strong> suppressing or overriding information or features<br />
which is too easily accessible.<br />
Interface.<br />
No means <strong>of</strong> conveying spatial and functional information to<br />
operators in a form which they can readily assimilate.<br />
Interface.<br />
A mismatch between an operator’s model <strong>of</strong> the world and Interface;<br />
that imagined by a designer.<br />
Competence.<br />
No obvious means <strong>of</strong> reversing an unintended action. Interface.<br />
A channel capacity overload, particularly one caused by Interface;<br />
simultaneous presentation <strong>of</strong> non-redundant information. Communication.<br />
A need to unlearn a technique and apply one which requires<br />
the application <strong>of</strong> an opposing philosophy.<br />
Competence.<br />
The need to transfer specific knowledge from task to task<br />
without loss.<br />
Communication.<br />
Ambiguity in the required performance standards. Procedures.<br />
A mismatch between perceived and real <strong>risk</strong>.<br />
Commitment;<br />
Competence.<br />
Poor, ambiguous or ill-matched system feedback. Interface.<br />
No clear, direct and timely confirmation <strong>of</strong> an intended action Interface;<br />
from the portion <strong>of</strong> the system over which control is exerted. Communication.<br />
Operator inexperience. Competence.<br />
An impoverished quality <strong>of</strong> information conveyed by<br />
Procedures;<br />
procedures and person-person interaction.<br />
Communication.<br />
Little or no independent checking or testing <strong>of</strong> output. Procedures.<br />
A conflict between immediate and long-term objectives. Commitment.<br />
No diversity <strong>of</strong> information input for veracity checks.<br />
Procedures;<br />
Interface.<br />
A mismatch between the educational-achievement level <strong>of</strong> an<br />
individual and the requirement <strong>of</strong> the task.<br />
Competence.<br />
An incentive to use other more dangerous procedures. Commitment.<br />
Little opportunity to exercise mind and body outside the<br />
immediate confines <strong>of</strong> a job.<br />
Commitment.<br />
Unreliable instrumentation. Interface.<br />
A need for absolute judgements which are beyond the<br />
capabilities <strong>of</strong> an operator.<br />
Competence.<br />
Unclear allocation <strong>of</strong> function and responsibility.<br />
Procedures;<br />
Communication.<br />
No obvious way to keep track <strong>of</strong> progress during an activity. Procedures;<br />
Interface.<br />
139
9.2. Modelling safety management<br />
ICAO Standards provided in Annexes 6, 11 and 14 oblige States to establish Safety<br />
Management Programmes requiring <strong>air</strong> traffic service providers, aerodrome and <strong>air</strong>craft<br />
operators as well as maintenance organizations to implement Safety Management Systems<br />
(SMS). ICAO defines an SMS as an organized approach to managing safety, including the<br />
necessary organizational structures, accountabilities, policies and procedures [ICAO 2006].<br />
The formal introduction <strong>of</strong> Safety Management Systems in <strong>air</strong> <strong>transport</strong> emphasises the<br />
fundamental need to be able to predict the effect on safety <strong>of</strong> changes which are made by<br />
decisions <strong>of</strong> (safety) managers. Regulatory authorities are attempting to implement system<br />
safety approaches in regulatory oversight <strong>of</strong> <strong>air</strong>line operations [FAA 2001]. Traditional<br />
oversight programs have focussed upon observations <strong>of</strong> operations, facilities, equipment<br />
and resources, and individual activities <strong>of</strong> employees in <strong>air</strong>lines. Most data that are<br />
collected are reflective <strong>of</strong> assessments <strong>of</strong> these individual operations. Most measurements<br />
<strong>of</strong> performance currently in use by the regulators are, therefore, tallies, ratios, or other<br />
manipulations <strong>of</strong> the number <strong>of</strong> times that unsatisfactory observations were recorded, or<br />
broad generalisations based upon a small number <strong>of</strong> observations. The aviation system is,<br />
however, composed <strong>of</strong> organisations <strong>of</strong> humans who use physical resources as tools to<br />
accomplish organisational goals. The performance <strong>of</strong> the aviation system should be<br />
measured more in terms <strong>of</strong> how the system’s processes achieve these organisational goals,<br />
as well as individual instances <strong>of</strong> failure [FAA 2004]. Technical and human performance<br />
are interwoven with managerial decisions and this leads to a desire for the causal <strong>risk</strong> model<br />
to be able to properly represent the effect <strong>of</strong> managerial influences on the safety level, but<br />
this is not a straightforward task; organisational factors are enigmatic [Luxhøj et al 2001] in<br />
the sense that their effects may be hard to predict and subject to much interaction and<br />
managerial decisions are <strong>of</strong>ten common mode influences on technical and human<br />
performance. The purpose <strong>of</strong> modelling management is to understand the influence <strong>of</strong> the<br />
factors which can be manipulated. To describe the effect <strong>of</strong> management on safety we must<br />
therefore find a way to link the description <strong>of</strong> the factors that can be influenced in the<br />
managerial system (the ‘management model’) to the description <strong>of</strong> the failure events and<br />
probabilities on the operational level. The interface between a safety management model<br />
and quantitative <strong>risk</strong> analysis <strong>models</strong> requires a meeting point <strong>of</strong> two <strong>models</strong> which are<br />
philosophically different. An important difference is one <strong>of</strong> mechanism versus holism. A<br />
quantified <strong>risk</strong> analysis looks for causal chains, failure pathways and failure combinations.<br />
This mechanistic philosophy would be pure determinism if it was not for the necessary<br />
probabilistic and stochastic nature <strong>of</strong> failures and hence <strong>of</strong> <strong>risk</strong> analysis itself. Safety<br />
management however is considered a control function aimed at maintaining a particular<br />
operational process within the boundaries <strong>of</strong> safe operation [Rasmussen 1997].<br />
Management is about maintaining functions, technical <strong>models</strong> deal with failures, but not the<br />
process <strong>of</strong> failure..<br />
A literature review in 1997 concluded that there had been few attempts to produce coherent<br />
and comprehensive <strong>models</strong> <strong>of</strong> a Safety Management System [Hale et al 1997]. That study<br />
also identified the need for an explicit model <strong>of</strong> safety management as a starting point to<br />
assess the completeness <strong>of</strong> audits to determine whether a safety management system is<br />
adequate and how it can be improved. In Hale et al [1997] the Structured Analysis and<br />
Design Technique (SADT) is proposed as a modelling approach because <strong>of</strong> its ability to<br />
represent information flows which make up the processes <strong>of</strong> the management system and<br />
the controls which prevent failure. Again, like in Rasmussen [1997], safety management is<br />
represented as a control problem. SADT also allows packing and unpacking at different<br />
levels <strong>of</strong> aggregation and thus easily represents different levels <strong>of</strong> decision making like the<br />
classical split between policy, planning and control, and execution. But the SADT model by<br />
140
Hale et al [1997] merely describes how a safety management system should be structured, it<br />
does not allow analysis <strong>of</strong> what its influence is on failure probability nor how the system<br />
behaves following a disturbance (at least not without adding more complication). The<br />
desire to analyse system behaviour as a function <strong>of</strong> disturbances, combined with the view to<br />
regard safety management as a control problem, logically results in attempts to apply<br />
control theory as a modelling approach. Indeed Rasmussen [1997] concludes that a closed<br />
loop feedback point <strong>of</strong> view is required for modelling safety management.<br />
INPUT<br />
Figure 30: Simple closed loop feedback system<br />
H<br />
FEEDBACK<br />
The behaviour <strong>of</strong> the closed loop feedback system in Figure 30 as a function <strong>of</strong> the input is<br />
completely described by the transfer function H. It is used to describe the characteristics <strong>of</strong><br />
a physical system e.g. consisting <strong>of</strong> a mass, a spring and a damper, or an electrical system<br />
e.g. consisting <strong>of</strong> a resistance and a capacity, but also a human or a system in a control task,<br />
like a safety management system. If needed, the model can be made more complex by<br />
adding feedback loops or even feedforward loops (e.g. to represent proactive elements <strong>of</strong><br />
safety management, like anticipating on the results <strong>of</strong> a <strong>risk</strong> analysis) but this does not<br />
really make the analysis more difficult. Simply speaking, if we were able to determine the<br />
safety management system’s ‘transfer function’, modelling safety management would be an<br />
easy task. But unfortunately things are not that simple. First <strong>of</strong> all, Figure 30 suggests a<br />
distinct ‘input’ and ‘output’ signal, but what should be considered the input <strong>of</strong> safety<br />
management, and what is the output? Risk is generated (or prevented) at the operational<br />
level, and managerial decisions sometimes influence the hazards (like deciding where to<br />
fly) but more <strong>of</strong>ten they influence the <strong>risk</strong> control measures. If input and output could be<br />
clearly defined, <strong>risk</strong> control could be seen as a process <strong>of</strong> detecting and recovering from<br />
deviations from some ‘ideal state’. This is essentially a control engineer’s view, strongly<br />
influenced by the ideas <strong>of</strong> quality control. It works well for known <strong>risk</strong>s in stable and<br />
mature technologies, where one right, safe way <strong>of</strong> working can be defined, based on long<br />
experience, for a single organisation. However, in other situations where <strong>risk</strong>s are<br />
incompletely known and technology and work methods are rapidly or constantly changing,<br />
or where processes are managed by a complex arrangement <strong>of</strong> organisations, there is no one<br />
“ideal state” which can be usefully defined. Unexpected combinations <strong>of</strong> essentially normal<br />
system factors can produce effects which propagate through complex organisations and find<br />
loopholes in the <strong>risk</strong> defences. Rasmussen [1997] has characterised safety management in<br />
such cases as keeping the organisation within a more broadly defined “safe” region, away<br />
from the boundaries <strong>of</strong> uncontrollability. The company is constantly being pushed towards<br />
these boundaries by competitive pressures and financial restrictions, or may drift towards<br />
them through complacency. Hollnagel’s description <strong>of</strong> accidents as occurrences <strong>of</strong><br />
‘resonance’ [Hollnagel 2004] also seems to fit well within the control theory approach<br />
because resonance as a physical phenomenon is typically a control problem, but Hollnagel<br />
uses the term resonance merely as a metaphor which is far removed from the physical<br />
141<br />
OUTPUT
phenomenon 73 . As a matter <strong>of</strong> fact he proposes a modified SADT model to represent his<br />
Functional Resonance Accident Model. For the purpose <strong>of</strong> causal <strong>risk</strong> modelling, this<br />
approach suffers the same limitation as the SADT model proposed in Hale et al [1997]; it<br />
might be sufficient as a descriptive model, but it is inadequate for performing calculations.<br />
Rasmussen’s safe envelope also resembles the approach <strong>of</strong> Leveson [2004] in which<br />
accidents are viewed as resulting from interactions between components that violate system<br />
safety constrains. Dekker [2005] echoes Leveson’s and Hollnagel’s call for control <strong>models</strong><br />
(see section 2.5) but also fails to describe just how such a model should be constructed<br />
other than in the vaguest <strong>of</strong> terms. So the conclusion is that despite an apparent need for<br />
<strong>models</strong> based on control theory to describe safety management, no such approach has yet<br />
been developed that enables quantification <strong>of</strong> managerial influences on accident <strong>risk</strong>. The<br />
main difficulty seems to be the formal description <strong>of</strong> the input and output <strong>of</strong> safety<br />
management, the description <strong>of</strong> the ‘ideal state’, and identification <strong>of</strong> the transfer function,<br />
including the level at which this should be done; the whole SMS or individual <strong>risk</strong> control<br />
functions?<br />
However there have been efforts in the past to quantitatively link management to <strong>risk</strong><br />
<strong>models</strong>. The simplest way to incorporate the effect <strong>of</strong> management in a causal <strong>risk</strong> model is<br />
by multiplying the probability <strong>of</strong> occurrence <strong>of</strong> the top event <strong>of</strong> the <strong>risk</strong> model by a factor<br />
which expresses the overall quality <strong>of</strong> management. Initial research efforts therefore<br />
attempted to address safety management within a quantitative <strong>risk</strong> analysis by linking<br />
directly from the top event <strong>of</strong> a number <strong>of</strong> accident scenarios to the influences in the<br />
management system [Bellamy et al 1993]. The work process analysis model (WPAM),<br />
developed for the nuclear power industry, represents the dependencies among the<br />
parameters that are introduced by organisational factors by calculating new<br />
(organizationally dependent) minimum cut-sets for major accident sequences [Davoudian et<br />
al 1994]. A simple parameterization <strong>of</strong> the impact <strong>of</strong> organisational factors on component<br />
performance, as proposed by Mosleh & Goldfeiz [1994] divides the component failure rates<br />
into two contributors, the rate <strong>of</strong> inherent failures and the rate <strong>of</strong> failures due to adverse<br />
organisational influences:<br />
λT = λI + λo<br />
Here λI is the inherent failure rate and λo is the rate <strong>of</strong> failure due to organisational factors.<br />
The inherent portion <strong>of</strong> the failure rate represents failure mechanisms which are ‘beyond<br />
the control <strong>of</strong> the organisation’ like hardware failures linked to design 74 . By introducing the<br />
parameter ω defined as:<br />
ω = λo / λI<br />
component reliability can be expressed as a function <strong>of</strong> this ω-factor:<br />
λT = (ω + 1) λI<br />
The ω-factor represents the quantitative influence <strong>of</strong> organisational factors on component<br />
reliability. Such a simplified approach gives little insight into the way in which the<br />
73 In physics, resonance is used to describe a situation in which the natural frequency <strong>of</strong> an<br />
object coincides with the excitation frequency.<br />
74 Organisations can influence this during selection <strong>of</strong> the hardware, but once that choice is<br />
made it is beyond their control.<br />
142
management factors influence the <strong>risk</strong> numbers, and determining the value <strong>of</strong> ω is a<br />
problem by itself. It is a reasonable approach when ‘management’ has a single common<br />
mode effect, whose management quality and its effects can be assessed (e.g. from audits)<br />
and which is f<strong>air</strong>ly stable over time. The aviation system, however, is very different to this;<br />
it has up to a hundred independent organisations managing the different causal factors and<br />
events. An easy solution is the simple split into different organisations, each with its own ω<br />
factor. But again it will be difficult to determine the value <strong>of</strong> ω if the mechanisms <strong>of</strong> how<br />
safety management influences <strong>risk</strong> events are not made explicit. A more sophisticated and<br />
for the aviation system a more appropriate approach breaks down the quality <strong>of</strong><br />
management into different common mode factors, where these factors can individually<br />
influence <strong>risk</strong> control measures that are represented as (the probability <strong>of</strong> occurrence <strong>of</strong>) the<br />
base events <strong>of</strong> the causal <strong>risk</strong> model. In Bellamy et al [1999] these common mode factors<br />
are derived by considering safety management as providing the necessary resources and<br />
criteria for safety critical tasks to be correctly executed. Generic delivery systems are<br />
defined to describe those resources and criteria, each <strong>of</strong> these delivery systems consists <strong>of</strong> a<br />
number <strong>of</strong> tasks which indicate the process <strong>of</strong> delivery meeting the needs at the front lines<br />
<strong>of</strong> performance and incorporates a learning loop [Bellamy et al 1999]. The following<br />
delivery systems related to human performance were defined:<br />
Competence: The knowledge, skills and abilities in the form <strong>of</strong> first-line and/or back-up<br />
personnel who have been selected and trained for the safe execution <strong>of</strong> the critical tasks and<br />
activities in the organisation. This system covers the selection and training function <strong>of</strong> the<br />
company, which delivers sufficient competent staff for overall manpower planning.<br />
Competence should be seen as not only cognitive, but also physiological, i.e. it includes<br />
factors such as health and physiology (e.g. vision for pilots).<br />
Availability: Allocating the necessary time (or numbers) <strong>of</strong> competent people to the tasks<br />
which have to be carried out. This factor emphasises time-criticality, i.e. people available at<br />
the moment (or within the time frame) when the tasks must be carried out. This delivery<br />
system is the responsibility <strong>of</strong> manpower planning. A critical aspect is planning for peak<br />
demands, particularly in emergency situations or other times when deviations from normal<br />
or planned operations occur.<br />
Commitment: The incentives and motivation which personnel have, in order to carry out<br />
their tasks and activities with suitable care and alertness, and according to the appropriate<br />
safety criteria and procedures specified by the organisation or by the workforce themselves<br />
for unexpected situations. This delivery system deals with the incentives <strong>of</strong> individuals<br />
carrying out the primary business activities not to choose other criteria above safety, such<br />
as ease <strong>of</strong> working, time saving, social approval, etc. The delivery system for this is <strong>of</strong>ten<br />
diffuse within companies, but includes many <strong>of</strong> the activities <strong>of</strong> supervision, social control,<br />
staff appraisal and incentive schemes.<br />
Interface: This covers the ergonomics <strong>of</strong> the interfaces which are used/operated by<br />
operations, inspection or maintenance. Included are both the appropriateness <strong>of</strong> the<br />
interface for the activity and the user-friendliness needed to carry out the activities.<br />
Communication: Communication refers to on-line communication necessary for <strong>risk</strong><br />
control. It occurs implicitly or explicitly within any task activity when it involves more than<br />
one person. Proper communication ensures that the tasks are co-ordinated and everyone<br />
knows who is doing what. Communication and co-ordination is particularly critical within<br />
the cockpit (captain and first <strong>of</strong>ficer), between the <strong>air</strong>craft and ATC and at maintenance<br />
143
shift changeovers or when an <strong>air</strong>craft is handed over from operations to maintenance and<br />
back again.<br />
Procedures: Rules and procedures are specific performance criteria which specify in detail,<br />
<strong>of</strong>ten in written form, a formalised ‘normative’ behaviour or method for carrying out an<br />
activity. They may also cover informal ‘good practice’. They represent the ‘design’ <strong>of</strong> the<br />
human tasks.<br />
In addition to these human delivery systems, there are also technology delivery systems:<br />
Design<br />
This delivery system deals with the process for ensuring that the hardware/ s<strong>of</strong>tware <strong>risk</strong><br />
control measures and <strong>risk</strong> control measure elements which have been specified are acquired<br />
or designed, either by purchase from outside, or by construction on site, are put in place and<br />
adjusted and that the spare parts or replacements purchased and stored for the maintenance<br />
phase <strong>of</strong> their life cycle are the correct ones and are in good condition when used.<br />
Maintain<br />
This factor deals with the management processes for ensuring that the hardware/s<strong>of</strong>tware<br />
<strong>risk</strong> control measures and <strong>risk</strong> control measure elements are kept in an effective state as<br />
specified by design or as modified to take account <strong>of</strong> improvements.<br />
These delivery systems are subordinate to a higher level cycle <strong>of</strong> <strong>risk</strong> analysis, selection <strong>of</strong><br />
<strong>risk</strong> control measures and monitoring and implementation <strong>of</strong> these at an integrated level<br />
above the more specific learning loops incorporated in each delivery system.<br />
This list <strong>of</strong> delivery systems corresponds well with a list <strong>of</strong> ‘organisational factors’<br />
regarded as important to safety as listed by NEA/CSNI [1999]. Table 6 lists those factors,<br />
in arbitrary order, as well as a proposed mapping onto the delivery systems.<br />
In I-<strong>risk</strong> the ‘delivery systems’ approach made the link between management factors and<br />
<strong>risk</strong> at a more detailed level <strong>of</strong> the base events in the <strong>risk</strong> model [Papazoglou & Aneziris<br />
1999]. The output <strong>of</strong> the management model was therefore a set <strong>of</strong> weighting factors, one<br />
for each <strong>of</strong> the specified influences on each <strong>of</strong> the technical parameters determining each <strong>of</strong><br />
the types <strong>of</strong> failure events. A richer insight into the causal links between management<br />
factors and technical failures was provided, but <strong>of</strong> course this method required much more<br />
effort to develop. Even more insight is provided by linking safety management to<br />
operational <strong>risk</strong> controls instead <strong>of</strong> plain technical failures. Later research efforts therefore<br />
made an attempt to represent the influence <strong>of</strong> safety management on the life cycle <strong>of</strong> safety<br />
barriers. A safety barrier is a component or procedure that is installed to prevent or<br />
mitigate hazards. Their life cycle includes design, installation, use, maintenance and<br />
improvement activities. The basic concept <strong>of</strong> this approach is that various events in an<br />
accident sequence can be prevented or mitigated if the safety barriers corresponding to each<br />
function are put into place and if the performance <strong>of</strong> the safety barriers is assured. Design<br />
and maintenance <strong>of</strong> technology is ultimately a human task, and the interface with which<br />
humans have to work needs to be designed and maintained. The <strong>risk</strong> control steps can<br />
therefore be repeated at a different level. This process can be repeated again and again. The<br />
iteration <strong>of</strong> organisational influences, which influences other organisational influences, has<br />
been referred to as the Russian doll problem. This is a reality <strong>of</strong> organisational and societal<br />
factors, and not an artefact <strong>of</strong> the representation method.<br />
144
Table 6: Comparison <strong>of</strong> ‘organisational factors’ with delivery systems<br />
NEA/CSNI organisation factor Corresponding delivery system(s)<br />
External influences (from outside the<br />
boundary <strong>of</strong> an organisation)<br />
Depends on what the influence is 75 .<br />
Goals and strategies Procedures<br />
Management functions and overview This factor maps on all delivery<br />
systems<br />
Resource allocation Availability and Design<br />
Human resources management Availability and Competence<br />
Training Competence<br />
Co-ordination <strong>of</strong> work Communication<br />
Organisational knowledge Competence<br />
Proceduralization Procedures<br />
Organisational culture Commitment<br />
Organisational learning This factor maps on the learning loops<br />
within the delivery systems and at the<br />
higher, strategic level<br />
Communication Communication<br />
Such iterations <strong>of</strong> the analysis lead inevitably, at some point, outside the initial<br />
organisation’s responsibility for the <strong>risk</strong> control measure and its functioning, and into other<br />
organisations or parts <strong>of</strong> the broader society. From a practical point <strong>of</strong> view, these iterations<br />
have to be cut <strong>of</strong>f in the model. In the ARAMIS project [Hourtolou & Salvi 2003, Hale &<br />
Guldenmund 2004] the delivery systems were directly linked to barriers. This produces a<br />
simpler formulation and explanation <strong>of</strong> the <strong>risk</strong> control measures. But the concept <strong>of</strong> safety<br />
barriers introduces additional difficulties as well. In the case <strong>of</strong> multiple hazards the <strong>risk</strong><br />
control measure for one hazard can become a factor in increasing the <strong>risk</strong> <strong>of</strong> another<br />
hazards (see infobox Liberty Bell). In the model proposed for the CATS project [Ale et al<br />
2006] the link to the technical model is represented as <strong>risk</strong> control measures to stay within a<br />
safe envelope. This step was taken to cope with the much greater use <strong>of</strong> behavioural<br />
controls in aviation as opposed to physical ones in chemical processes for which the model<br />
was originally developed and to represent the view mentioned in the beginning <strong>of</strong> this<br />
section that safety management is actually a control function, with a monitoring and<br />
improvement cycle as its basis [Hale et al 2007]. So the safe envelope should not only be<br />
described at an abstract level <strong>of</strong> the organisation, as proposed by Rasmussen [1997], but<br />
also at the operational level as proposed in Hale et al [2007].<br />
A safe envelope is defined as a multi-dimensional space in which activities take place<br />
without accident. If the boundary <strong>of</strong> the safe envelope is breached, damage is unavoidable,<br />
although the extent <strong>of</strong> the damage may still be subject to influence. Inside the safe envelope<br />
there will exist a ‘defined operational boundary’ within which the organization or system<br />
wishes to keep the activity so that there is a margin <strong>of</strong> safety. Risk control measures ensure<br />
that the organisation or system stays within the safe envelope and preferably within the<br />
defined operational boundary. In order to do so, there must be ways for detecting, diagnosis<br />
/ decision making and acting on information that the boundaries are being approached and<br />
75<br />
Some influences, like regulation or market influences, impinge on individual delivery<br />
systems, e.g. by making procedures mandatory or influencing commitment. Others affect<br />
the strategic <strong>risk</strong> analysis and learning loop by making new <strong>risk</strong> controls available, making<br />
them mandatory, etc.<br />
145
will be crossed if no action is taken. The detection-decision-action sequence acts as a <strong>risk</strong><br />
control measure. Additionally <strong>risk</strong> control measures serve to locate the ‘position’ <strong>of</strong> the<br />
system within the boundary and to keep the functions operating which define the boundary<br />
and keep it where we expect it to be.<br />
The combination <strong>of</strong> delivery systems and the safe envelope solves some <strong>of</strong> the problems<br />
identified earlier in representing safety management as a closed loop control system, i.e.<br />
that <strong>of</strong> identification <strong>of</strong> input/output and description <strong>of</strong> the ideal state: the input and output<br />
signals are defined by the delivery systems, and the ideal state is defined by the safe<br />
envelope. All the ingredients are thus available to develop an appropriate control model <strong>of</strong><br />
safety management. But, in the context <strong>of</strong> the research question, developing a management<br />
model is not an objective by itself. The aim is to develop a causal <strong>risk</strong> model which<br />
combines the description <strong>of</strong> failure events at the operational level with a description <strong>of</strong> the<br />
managerial system. A suitable approach for representing the failure events at the<br />
operational level <strong>of</strong> a system-wide model seems to be a ‘static’ model using techniques<br />
such as event trees, fault trees and influence diagrams. By definition fault trees, event trees<br />
and Bayesian belief nets cannot contain feedback loops. But we want to combine this with a<br />
model <strong>of</strong> a safety management system, which is best represented by a control model in<br />
which feedback loops are essential. These two kinds <strong>of</strong> model are not directly compatible.<br />
Either the ‘technical model’ must allow feedback loops, or the feedback loops in the<br />
‘management model’ must be removed. Which solution would be the most appropriate? To<br />
answer that question we must consider the consequences <strong>of</strong> either solution.<br />
According to Rasmussen [1997] one <strong>of</strong> the reasons why a control model is needed is the<br />
dynamic interaction between different parts <strong>of</strong> the (aviation) system that is the result <strong>of</strong> a<br />
‘very fast pace <strong>of</strong> change <strong>of</strong> technology’. But what rate <strong>of</strong> change necessitates the shift<br />
from a static to a dynamic model? Is the technology in aviation really changing that fast?<br />
The first flight <strong>of</strong> the Boeing 747 took place in 1969 [Sutter & Spenser 2006] and four<br />
decades later the <strong>air</strong>craft is still in production. Compared to the dynamics <strong>of</strong> an actual<br />
flight, technology moves at a snail’s pace. So at the abstract, strategic level <strong>of</strong> the<br />
organisation there is no need for a dynamic model. At the operational level however,<br />
dynamics are more important and a control model seems appropriate.<br />
Another argument for control <strong>models</strong> is the observation that safety management systems<br />
incorporate control loops. The task <strong>of</strong> piloting an <strong>air</strong>craft also is a control task, and indeed<br />
sophisticated control <strong>models</strong> have been developed to describe pilot behaviour in a variety <strong>of</strong><br />
circumstances. See McRuer et al [1965] for early work, Wewerinke [1989] for an all-round<br />
theoretical overview and Hosman et al [2005] for an example <strong>of</strong> a more recent pilot control<br />
model. A <strong>risk</strong> assessment model in which variables evolve over continuous time, affected<br />
by probabilistic disturbances and including (‘cognitive’) <strong>models</strong> for human operators<br />
involved is TOPAZ as described in Blom et al [2001], which also has its roots in control<br />
theory. Human operators are represented in TOPAZ as interacting agents who each have a<br />
certain situation awareness. The situation awareness is a dynamic state, and accidents are<br />
considered as emergent phenomena from the variability <strong>of</strong> the situation awareness updating<br />
process [Stroeve et al 2007]. Application <strong>of</strong> this approach requires a high level <strong>of</strong> expertise<br />
in stochastic analysis however. The greater simplicity is the primary reason to represent the<br />
flight crew in <strong>risk</strong> assessment <strong>models</strong> by simple static techniques like the model described<br />
in section 9.1 rather than the more sophisticated dynamic model. In any case, when it is<br />
being questioned whether control loops should be introduced explicitly it should be<br />
considered if static modelling techniques could be sufficiently adequate. It is here perhaps<br />
more than anywhere else necessary to find a proper balance between the desire to<br />
146
adequately represent the complexity <strong>of</strong> reality and the need to produce transparent and<br />
quantifiable <strong>models</strong>. Mosleh et al [2004], Perrin et al [2006] and Ale et al [2006] all<br />
propose to use simple static techniques like fault trees, event trees and BBNs to model<br />
flight crew behaviour. For the same reason simple static <strong>models</strong> using representation<br />
techniques such as fault trees, event trees and Bayesian belief nets can be used for<br />
representation <strong>of</strong> the ‘technical’ parts well as the managerial influences in the causal <strong>risk</strong><br />
model. Indeed Bayesian belief Nets are particularly suited to represent the influence <strong>of</strong><br />
managerial decisions [Roelen et al 2004b, Luxhøj et al 2001].<br />
Section 9.1 has already described a convenient way to provide a link between managerial<br />
influences and human performance by describing human performance shaping factors as<br />
the levers for managerial influence and representing their influence using a Bayesian belief<br />
Net. In the CATS model, the influence <strong>of</strong> human performance on aviation accident <strong>risk</strong> is<br />
described using three generic human operator <strong>models</strong> for flight crew, <strong>air</strong> traffic controllers<br />
and maintenance mechanics. Each human operator’s influence on the accident sequence (or<br />
accident avoidance sequence) is represented by an instantiation <strong>of</strong> one <strong>of</strong> these three<br />
<strong>models</strong>. The human operator <strong>models</strong> have been developed such that the delivery systems<br />
can be ‘hooked’ directly to the performance shaping factors. With this approach, two <strong>of</strong> the<br />
main problems that frustrated previous efforts to model managerial influences have been<br />
solved:<br />
• Both the ‘management model’ and the ‘technical model’ are represented using<br />
static modelling techniques; event trees, fault trees and Bayesian belief nets<br />
diagrams, solving the problem <strong>of</strong> static versus dynamic.<br />
• Managerial influences on human task performance are described by only six<br />
delivery systems, connecting to three generic human operator <strong>models</strong>. This limits<br />
the model development burden to acceptable levels.<br />
In a similar fashion, the managerial levers on the hardware (i.e. design and maintain) can be<br />
represented in a Bayesian belief Net as separate influences on hardware failure<br />
probabilities.<br />
Despite its simplifications this approach in essence is still capable <strong>of</strong> representing the safe<br />
envelope concept. The safe envelope is defined by the accident avoidance pathways <strong>of</strong> the<br />
event sequence diagrams.<br />
Liberty Bell, safety barriers or hazards?<br />
An example <strong>of</strong> a safety barrier that became a <strong>risk</strong> cause is provided by the experience <strong>of</strong> the<br />
second American in space, Gus Grissom, immediately following landing after his space<br />
flight on July 21, 1961. The spacecraft, Liberty Bell 7, was the first Mercury spacecraft to<br />
include a newly designed explosive hatch. Although the hatch had not been tested<br />
previously, it was considered to be superior in design to the older model, enabling the pilot<br />
to make a quicker and easier egress from the capsule. After splashdown, Grissom began<br />
final preparations for egress. "I opened up the faceplate on my helmet, disconnected the<br />
oxygen hose from the helmet, unfastened the helmet from my suit, released the chest strap,<br />
the lap belt, the shoulder harness, knee straps and medical sensors. And I rolled up the neck<br />
dam <strong>of</strong> my suit." Grissom was lying in his couch, waiting to receive final confirmation that<br />
it was time for him to blow the hatch and exit the spacecraft "when suddenly, the hatch<br />
blew <strong>of</strong>f with a dull thud". Water flooded the cabin. Grissom automatically threw <strong>of</strong>f his<br />
helmet, grabbed the sill <strong>of</strong> the hatch, hauled himself out <strong>of</strong> the sinking capsule and swam<br />
furiously to get away from the spacecraft. While helicopters tried to hoist-up the sinking<br />
147
capsule, Grissom realized that he was having a hard time just keeping his head above the<br />
water. "Then it dawned on me that in the rush to get out before I sank I had not closed the<br />
<strong>air</strong> inlet port in the belly <strong>of</strong> my suit, where the oxygen tube fits into the capsule. Although<br />
this hole was not letting much water in, it was letting <strong>air</strong> seep out, and I needed that <strong>air</strong> to<br />
help me stay afloat." His suit was quickly losing buoyancy. The space suit that was<br />
designed as a safety barrier against the <strong>risk</strong> <strong>of</strong> capsule decompression had become a cause<br />
<strong>of</strong> drowning <strong>risk</strong>. Unaware <strong>of</strong> the difficulty Grissom was having in staying afloat, none <strong>of</strong><br />
the helicopters surrounding him were dropping him a life line. Their rotor blades were<br />
churning up the surface <strong>of</strong> the water, making it necessary for Grissom to swim even harder<br />
to keep from going under. As exhaustion set in, he thought, "Well, you've gone through the<br />
whole flight, and now you're going to sink right here in front <strong>of</strong> all these people." Finally, a<br />
helicopter approached and dropped Grissom a horse collar. He managed to loop it over his<br />
neck and arms, albeit backwards, and was hoisted up [Carpenter et al 1962].<br />
Figure 31: Marine helicopter has astronaut Virgil I. Grissom in harness and is bringing<br />
him up out <strong>of</strong> the water. The Liberty Bell 7 spacecraft has just sunk below the water.<br />
9.3. Complexity, completeness and dependencies<br />
A model that describes causal pathways <strong>of</strong> accidents in the aviation system will consist <strong>of</strong><br />
many elements, irrespective <strong>of</strong> the modelling technique that is used. This is merely a<br />
reflection <strong>of</strong> the complexity and diversity <strong>of</strong> the <strong>air</strong> <strong>transport</strong> system. The model elements<br />
are logically linked and quite likely there will be several hierarchical levels. Think <strong>of</strong> for<br />
instance a fault tree, where elements are linked using ‘AND’ and ‘OR’ connectors and the<br />
148
failure events become more generic when moving upwards in the tree. When two model<br />
elements are not directly connected they are by definition independent 76 . The base events in<br />
a fault tree are independent and each base event is linked to only one event on the next<br />
higher level. This simplicity has drawbacks as well; common cause factors are notoriously<br />
difficult to represent in simple fault trees and there may also be cases in which base events<br />
are not independent. In the thrombosis example <strong>of</strong> section 8.2, pregnancy and the use <strong>of</strong><br />
birth control pills are not independent. A Bayesian belief net is a much better vehicle to<br />
represent dependencies and conditional dependencies. From a modelling perspective we<br />
would like to keep the number <strong>of</strong> interconnections as small as possible. More<br />
interconnections means increased complexity and hence more development effort and less<br />
transparency. But managerial influences are typically common causes so if we want to<br />
represent those influences in the model we introduce a great many common cause factors.<br />
And when we zoom in on specific areas <strong>of</strong> the model we will identify all sorts <strong>of</strong> possible<br />
dependencies. Consider for instance the simple flight crew error model that has been<br />
developed in the CATS project, in Figure 32.<br />
Workload<br />
Captain<br />
Experience<br />
Man-Machine<br />
Interface<br />
Captain Training<br />
Flight Crew Error<br />
Weather<br />
Fatigue<br />
Figure 32: CATS flight crew performance model.<br />
Workload<br />
Captain<br />
Experience<br />
Man-Machine<br />
Interface<br />
Captain Training<br />
Flight Crew Error<br />
Weather<br />
Fatigue<br />
Intra-cockpit<br />
Communication<br />
Captain Suitability<br />
First Officer<br />
Training<br />
Intra-cockpit<br />
Communication<br />
Captain Suitability<br />
First Officer<br />
Training<br />
Figure 33: CATS flight crew performance model expanded.<br />
Flight Crew<br />
Suitability<br />
First Officer<br />
Suitability<br />
First Officer<br />
Experience<br />
Flight Crew<br />
Suitability<br />
First Officer<br />
Suitability<br />
First Officer<br />
Experience<br />
76<br />
Dependence and conditional dependence are formally defined in the chapter on causality.<br />
149
According to this model, ‘fatigue’ for instance is independent <strong>of</strong> ‘weather’, but we know<br />
that prolonged flight in bad weather conditions can be quite exhausting, so strictly speaking<br />
there should be an arc between weather and fatigue. A good man machine interface design<br />
can reduce the task load, so there should be an arc between man machine interface and<br />
workload. High levels <strong>of</strong> fatigue decrease operator capabilities and will, for the same task<br />
demand, result in higher workload, so there also should be an arc from fatigue to workload.<br />
Likewise, experience and training can improve operator capabilities and hence reduce<br />
workload. Good ergonomics design can influence fatigue as well, so there should also be an<br />
arc from man machine interface to fatigue. This would then result in the model <strong>of</strong> Figure<br />
33.<br />
The number <strong>of</strong> arcs in this model has increased from 13 to 21, and the node ‘workload’<br />
now has 6 parent nodes. When each <strong>of</strong> the parent nodes only has 2 possible states we need<br />
to assess 64 conditional probabilities to quantify workload. The transparency <strong>of</strong> the model<br />
is also affected. This is a result <strong>of</strong> the increased number <strong>of</strong> arcs and also because arcs now<br />
not only run from the lower to the upper levels, but also the other way around, e.g. from<br />
weather to fatigue. While Figure 32 still looks neat and orderly, Figure 33 is becoming<br />
more obscure and beginning to look like a ‘giant h<strong>air</strong>ball’. And this is just a simple<br />
example; imagine what will happen when an arc is drawn for every possible interaction in a<br />
model consisting <strong>of</strong>, say, 5000 nodes. The assessment burden will then become excessive<br />
and it may be simply impossible to complete model development. It is necessary to find a<br />
proper balance between model completeness and practical feasibility. The proposed way <strong>of</strong><br />
doing this is by developing the model from the generic to the specific, starting at the<br />
highest level <strong>of</strong> abstraction and introducing additional detail step-by-step. This can be done<br />
systematically if the model is hierarchical, with separate levels <strong>of</strong> abstraction that are<br />
formally defined. The first instance <strong>of</strong> the model only considers dependencies at the highest<br />
level <strong>of</strong> abstraction and the model is then incrementally detailed by moving to the next<br />
lower level at each development step [Mosleh et al 2004].<br />
This top-down approach obviously raises the question whether it will ever be possible to<br />
reach a level that is sufficiently detailed for our purposes. Every accident is a unique<br />
occurrence. Each accident involves different causes, different components, different<br />
locations, environmental circumstances, organisations and people. Representing every<br />
single detail <strong>of</strong> every possible accident is practically impossible. Accident <strong>risk</strong> modelling<br />
requires generalisation and discretisation <strong>of</strong> such individual occurrences. A model is an<br />
abstraction <strong>of</strong> reality. Individual uniqueness must be generalised such that the essential<br />
parts are not lost while a balance must be found between uniqueness and generality.<br />
There are two possible approaches to this; inductive and deductive. The inductive approach<br />
is to reason from the individual cases to a generic construct. A deductive approach involves<br />
reasoning from the generic to the specific. An example <strong>of</strong> deductive approach to aviation<br />
<strong>risk</strong> modelling would be to start with the main functions that are required to prevent an<br />
accident, e.g. lift, thrust, control, structural integrity and separation between <strong>air</strong>craft. Each<br />
next step in the modelling process would then make a further functional decomposition.<br />
This kind <strong>of</strong> reasoning is similar to that used to construct Fault Trees. The approach is<br />
straightforward and works well when only hardware is involved, but is more complicated<br />
when humans, organizations and management play an important role. Task analysis and<br />
functional analysis <strong>of</strong> for instance barriers and delivery systems are sometimes helpful, but<br />
there are many <strong>risk</strong> control failures that are difficult to identify by means <strong>of</strong> a functional<br />
decomposition [De Jong 2004]. Errors <strong>of</strong> commission may not be found at all. The<br />
150
inductive approach starts with the individual accidents and then tries to develop a generic<br />
construct. This is only useful when certain patterns exist at the higher level <strong>of</strong> abstraction<br />
but is useless if accidents are just random combinations <strong>of</strong> random events. A review <strong>of</strong><br />
<strong>air</strong>craft accidents indeed shows that <strong>of</strong>ten event sequences are very similar, even for cases<br />
where human error plays an important role in the accident sequence. An example <strong>of</strong> such a<br />
recurring accident type is an <strong>air</strong>craft stall and loss <strong>of</strong> control following an attempt to take<br />
<strong>of</strong>f while the <strong>air</strong>craft’s wing is contaminated with snow or ice. See infobox ‘Take-<strong>of</strong>f stall<br />
in icing condition’. Crash due to stall and loss <strong>of</strong> control following an attempt to take <strong>of</strong>f<br />
with a contaminated wing in icing conditions can be considered an accident archetype.<br />
Another example <strong>of</strong> an accident archetype is a runway overrun following landing long and<br />
fast on a wet runway, possibly in combination with cross- or tailwind. A review <strong>of</strong> a large<br />
set <strong>of</strong> <strong>air</strong>craft accidents identified 33 <strong>of</strong> such accident archetypes [Roelen & Wever 2005a].<br />
Later in this thesis we will also show that the set <strong>of</strong> 33 accident scenarios is sufficiently<br />
complete to provide a suitable backbone for a causal <strong>risk</strong> model.<br />
In Roelen & Wever [2005a], each accident archetype is described as a chain <strong>of</strong> discrete<br />
events. This is a useful concept because it is easy to understand; the structure is identical to<br />
the way we tell stories. The accident can be prevented by removing any one <strong>of</strong> the links in<br />
the accident chain. Each link represents an opportunity for accident prevention. If the link is<br />
removed the sequence <strong>of</strong> events enters a different pathway that does not result in an<br />
accident. This can be represented in an event sequence diagram, where each <strong>of</strong> the links <strong>of</strong><br />
the accident chain is an initiating event or a pivotal event.<br />
The advantage <strong>of</strong> the use <strong>of</strong> accident archetypes is that this is a data driven approach which<br />
results in realistic accident scenarios. It easily captures the most frequent accidents which<br />
means that the model quickly focuses on those events that are really relevant for flight<br />
safety. The total number <strong>of</strong> accident archetypes (33 in Roelen & Wever [2005a]) is easily<br />
surveyable. There are a very large number <strong>of</strong> consequences that are the possible result <strong>of</strong> a<br />
set <strong>of</strong> causes, but there are a much smaller number <strong>of</strong> consequences that are probable. The<br />
accident archetypes capture the most probable cause - consequence relations. The accident<br />
archetype / event sequences therefore provide a suitable interface between (more detailed<br />
layers <strong>of</strong>) the model and the users <strong>of</strong> the model. In Roelen & Wever [2005a] the accident<br />
archetypes are described as a series <strong>of</strong> active failures. This has the advantage that the<br />
archetypes are mostly independent. Dependencies are only introduced at the detailed level<br />
where also latent failures are described. This is convenient because the model remains more<br />
transparent and the assessment burden for quantification is reduced. A disadvantage <strong>of</strong> the<br />
accident archetypes is that the sequence delineation is more or less analyst dependent<br />
[Labeau et al 2000]. Peer review will therefore be an essential part <strong>of</strong> the scenario<br />
validation process (see Chapter 10).<br />
151
Archetype accident example 1: Take-<strong>of</strong>f stall in icing conditions<br />
On March 5, 1993, Pal<strong>air</strong> Flight PMK301, a Fokker 100, crashed shortly after take-<strong>of</strong>f from<br />
Skopje Airport, Republic <strong>of</strong> Macedonia, for a scheduled passenger flight to Zürich,<br />
Switzerland. Seventy-nine passengers and four crewmembers were fatally injured and<br />
thirteen passengers and one cabin crewmember survived. The accident was caused by<br />
degraded aerodynamic characteristics due to contamination <strong>of</strong> the wings with snow and ice.<br />
The situation resulted from an omission to de-ice the <strong>air</strong>craft with de-icing or anti-icing<br />
fluid in weather conditions conducive to icing. At the time <strong>of</strong> the accident there was<br />
moderate snowfall and the temperature was 0 degrees Celsius [Netherlands Aviation Safety<br />
Board 1996]. This accident was not unique, in the decade before the Pal<strong>air</strong> accident there<br />
had been at least 7 major accidents <strong>of</strong> Western built jet <strong>air</strong>craft during take-<strong>of</strong>f that were<br />
caused by degraded aerodynamic characteristics due to contamination <strong>of</strong> the wings with<br />
snow and ice, see table 7. The dangers <strong>of</strong> taking <strong>of</strong>f with a contaminated wing were well<br />
known to the aviation community. The NTSB’s first investigation <strong>of</strong> an <strong>air</strong> <strong>transport</strong><br />
category <strong>air</strong>craft accident caused by an attempt to take <strong>of</strong>f with a contaminated wing<br />
involved a DC-9 <strong>air</strong>craft [NTSB 1993]. That accident occurred on December 27, 1968 at<br />
the Sioux City Airport at Sioux City, Iowa. The Safety Board’s finding <strong>of</strong> probable cause in<br />
that accident was “a stall [..] with subsequent loss <strong>of</strong> control as a result <strong>of</strong> the aerodynamic<br />
[..] penalties <strong>of</strong> <strong>air</strong>foil icing. The flight crew failed to have the <strong>air</strong>foil ice removed prior to<br />
the attempted take-<strong>of</strong>f from Sioux City” [NTSB 1970]. This type <strong>of</strong> accident continues to<br />
occur today: on January 25, 2007, a Régional Fokker 100 crashed shortly after take<strong>of</strong>f from<br />
the <strong>air</strong>port <strong>of</strong> Pau, France. Control was lost because the <strong>air</strong>craft wing was contaminated<br />
with snow [BEA 2007].<br />
The lift which is developed by a wing depends on the angle <strong>of</strong> attack (the relative angle <strong>of</strong><br />
the impinging <strong>air</strong> to the wing chord), and the <strong>air</strong>speed. The higher the angle <strong>of</strong> attack and<br />
the higher the speed, the greater the amount <strong>of</strong> lift developed so long as the <strong>air</strong>flow over the<br />
wing is smooth and adheres to its contour surface. When the <strong>air</strong>flow separates from the<br />
surface, the lift produced by the wing diminishes. The <strong>air</strong>flow starts to separate from any<br />
wing when its angle <strong>of</strong> attack reaches a critical value, typically 15 - 18 degrees. As the<br />
angle <strong>of</strong> attack is increased further, the lift will decay rapidly. Even a small amount <strong>of</strong> snow<br />
or ice on the wing surface has an influence on the smooth flow <strong>of</strong> <strong>air</strong> over the surface<br />
contour. Changes in the contour shape and roughness <strong>of</strong> the surface will cause the <strong>air</strong>flow<br />
to begin to separate from the wing at a lower angle <strong>of</strong> attack than normal and cause a<br />
reduction in the lift. The extent and way that performance will be affected depends on the<br />
position <strong>of</strong> the contaminant on the wing as well as the nature <strong>of</strong> the contaminant. Generally,<br />
contamination <strong>of</strong> the forward leading edge <strong>of</strong> the wing will be the most degrading to the<br />
lift-producing efficiency <strong>of</strong> the wing. For this reason, <strong>air</strong>craft without leading edge slats or<br />
flaps are more susceptible to wing contamination than <strong>air</strong>craft with leading edge slats. Note<br />
that all but one <strong>of</strong> the accidents in Table 7 involves an <strong>air</strong>craft without leading edge slats<br />
(the Boeing 737 is the exception). Due to the influence <strong>of</strong> the Reynolds number on <strong>air</strong>flow<br />
characteristics, contaminated wings are more <strong>of</strong> a problem for smaller <strong>air</strong>craft than for very<br />
large <strong>air</strong>craft.<br />
Aircraft that have snow or ice on the wings are de-iced before take-<strong>of</strong>f to prevent these<br />
types <strong>of</strong> accidents. De-icing is conducted by spraying a de-icing fluid, typically a mixture<br />
<strong>of</strong> glycol and water, on the <strong>air</strong>craft’s surfaces. The de-icing fluid removes snow or ice and<br />
also prevents the build-up <strong>of</strong> additional layers <strong>of</strong> snow or ice for a predefined time period <strong>of</strong><br />
time called the hold-over time. Typical values for the hold over time are 30 minutes.<br />
152
Table 7: Accidents involving attempted take-<strong>of</strong>f with contaminated wing, 1982-1993,<br />
Western built commercial jet <strong>air</strong>craft.<br />
Date Aircraft type Location Weather Ref.<br />
13/01/82<br />
05/02/85<br />
15/10/87<br />
Boeing 737-<br />
200<br />
Douglas DC-<br />
9-15<br />
Douglas DC-<br />
9-14<br />
10/03/89 Fokker F-28<br />
17/02/91<br />
Douglas DC-<br />
9-15<br />
22/03/92 Fokker F-28<br />
05/03/93 Fokker 100<br />
Washington, D.C.<br />
USA<br />
Philadelphia,<br />
Pennsylvania, USA<br />
Denver, Colorado,<br />
USA<br />
Dryden, Ontario,<br />
Canada<br />
Cleveland, Ohio,<br />
USA<br />
Flushing, New York,<br />
USA<br />
Skopje,<br />
Macedonia.<br />
153<br />
-4 deg. C.<br />
Heavy snowfall.<br />
-2 deg. C.<br />
Ice pellets, snow.<br />
-2 deg. C.<br />
Moderate snow.<br />
+ 2 deg. C.<br />
Locally heavy<br />
snow.<br />
-5 deg. C. Light<br />
snow.<br />
0 deg. C.<br />
Drifting snow.<br />
0 deg. C.<br />
Moderate snowfall.<br />
NTSB<br />
1982<br />
MacIntosh<br />
1993<br />
NTSB<br />
1988<br />
Moshansky<br />
1992<br />
NTSB<br />
1991<br />
NTSB<br />
1993<br />
Netherlands Aviation<br />
Safety Board 1996<br />
Accident archetype 2: Landing long and fast on a wet or contaminated runway<br />
On June 1, 1999, American Airlines flight 1420, a McDonnell Douglas MD-82, crashed<br />
after it overran the end <strong>of</strong> runway 4R during landing at Little Rock National Airport in<br />
Little Rock, Arkansas. The captain and 10 passengers were killed; the <strong>air</strong>craft was<br />
destroyed by impact forces and a postcrash fire. Analysis <strong>of</strong> the accident revealed that the<br />
<strong>air</strong>craft had touched down at a speed <strong>of</strong> 160 kts, which was 29 kts too fast, at 2000 ft past<br />
the runway threshold. A normal touchdown point is 1000 - 1500 ft beyond the runway<br />
threshold. Because the runway was wet, the braking performance <strong>of</strong> the <strong>air</strong>craft was also<br />
negatively affected [NTSB 2001]. Less than a year later, an accident occurred under similar<br />
circumstances. On March 5, 2000, Southwest Airlines flight 1455, a Boeing 737-300,<br />
overran the departure end <strong>of</strong> runway 8 after landing at Burbank-Glendale-Pasadena Airport<br />
in Burbank, California. The <strong>air</strong>craft came to rest on a city street near a gas station <strong>of</strong>f <strong>of</strong> the<br />
<strong>air</strong>port property. Of the 142 persons on board, 2 passengers sustained serious injuries; the<br />
<strong>air</strong>craft sustained extensive exterior damage. In this accident the <strong>air</strong>craft touched down at a<br />
speed <strong>of</strong> 182 kts, which was 44 kts too fast at 2150 ft past the runway threshold. Again the<br />
runway was wet [NTSB 2002b]. Both instances are examples <strong>of</strong> landing overrun accidents<br />
that are the result <strong>of</strong> landing long and fast on a wet or contaminated runway, possibly in<br />
combination with tailwind. Additional examples <strong>of</strong> this type <strong>of</strong> accident are presented in<br />
Table 8.
Table 8: Runway overrun accidents after landing long and fast on a wet or contaminated<br />
runway.<br />
Date Aircraft type Location Touchdown RWY Wind Ref.<br />
point/ total condition<br />
RWY length<br />
(ft)<br />
21/02/1986 McDonnell-<br />
Douglas DC9<br />
Erie, PA,<br />
USA<br />
2000/6000 snow/wet 10 kts tail NTSB<br />
1987<br />
14/09/1993 Airbus A-320 Warsaw,<br />
Poland<br />
2500/9100 flooded 18 kts tail<br />
01/06/1999 McDonnell- Little Rock,<br />
Douglas MD-82 AR, USA<br />
2000/7500 wet<br />
5 kts tail, 20-<br />
25 kts cross<br />
NTSB<br />
2001<br />
22/09/1999 Boeing 747-400 Bangkok,<br />
Thailand<br />
3300/10300 flooded 8 kts cross<br />
ATSB<br />
2001<br />
05/03/2000 Boeing 737-300 Burbank,<br />
CA, USA<br />
2150/6000 wet 6 kts tail<br />
NTSB<br />
2002b<br />
02/11/2002<br />
Fokker F-27 Sligo,<br />
Ireland<br />
1500/3900 wet 3 kts cross AAIU<br />
2005<br />
02/08/2005 Airbus A-340<br />
Toronto,<br />
Canada<br />
4000/9000 flooded 5 kts tail<br />
TSB<br />
2007<br />
Chicago, IL,<br />
08/12/2005 Boeing 737-700<br />
USA<br />
2000/6500 snow 9 kts tail<br />
NTSB<br />
2007<br />
How do we know if the set <strong>of</strong> accident archetypes is sufficiently complete? The accident<br />
archetypes should be mutually exclusive categories and the total set <strong>of</strong> archetypes must<br />
represent all probable accident occurrences, so that their results can be added together and<br />
should give complete coverage <strong>of</strong> all accident <strong>risk</strong>s. Based on ICAO’s definition, an<br />
accident 77 can be divided into subcategories ‘personal injury’ (including fatality), ‘<strong>air</strong>craft<br />
destroyed’ and ‘<strong>air</strong>craft damaged’. On a high level <strong>of</strong> abstraction there are four ways for a<br />
person to get fatally or seriously injured, three <strong>of</strong> which result in the <strong>air</strong>craft being<br />
destroyed or sustaining major damage:<br />
• Personal injury (without the <strong>air</strong>craft being damaged or destroyed)<br />
• Collision <strong>of</strong> <strong>air</strong>craft with the ground<br />
• Collision <strong>of</strong> <strong>air</strong>craft with an object<br />
• General disintegration <strong>of</strong> <strong>air</strong>craft.<br />
There can be occurrences in which the <strong>air</strong>craft receives only little damage, but the<br />
occupants are seriously injured or even killed. Other than security related events, this can<br />
happen when there is an abrupt manoeuvre, e.g. a sudden and unexpected turbulence<br />
encounter resulting in passengers thrown around in the cabin, or in case <strong>of</strong> an event<br />
involving the cabin environment like a lack <strong>of</strong> oxygen. A collision with the ground is called<br />
‘controlled’ when the <strong>air</strong>craft has no malfunctions and is under control <strong>of</strong> the flight crew,<br />
albeit that the crew is not aware <strong>of</strong> the fact that they are flying towards terrain, i.e.<br />
controlled flight into terrain. A collision with the ground can also be uncontrolled, when the<br />
flight crew has lost control <strong>of</strong> the <strong>air</strong>craft, which can be induced by the crew, an <strong>air</strong>craft<br />
system/mechanical malfunction or the environment. Thirdly, collision with the ground can<br />
also be a forced landing, where the crew makes an unscheduled landing <strong>of</strong>f a runway<br />
77<br />
An accident is an occurrence where a person has been fatally or seriously injured, or the<br />
<strong>air</strong>craft sustains major damage or structural failure [ICAO 2001].<br />
154
ecause they are unable to continue flight. This happens when for instance the <strong>air</strong>craft runs<br />
out <strong>of</strong> fuel and all engines stop producing power. A collision with an object can be an inflight<br />
collision with another <strong>air</strong>craft, or it can be a collision on the ground with another<br />
<strong>air</strong>craft, a vehicle, or other object. A ‘general disintegration’ is an occurrence where the<br />
<strong>air</strong>craft’s structure is overloaded and damaged, including in-flight disintegration, either due<br />
to a structural failure or due to fire or an explosion (e.g. fuel tank explosion or the<br />
detonation <strong>of</strong> a bomb) .<br />
Accident<br />
Personal<br />
injury<br />
Aircraft<br />
destroyed<br />
Aircraft<br />
damaged<br />
Personal<br />
injury<br />
Collision<br />
with ground<br />
Collision<br />
with object<br />
General<br />
destruction<br />
Figure 34 Accident breakdown into subtypes.<br />
The resulting set <strong>of</strong> accident types is shown in Figure 34. This way <strong>of</strong> categorizing<br />
accidents is generally in agreement with the tradition in <strong>air</strong>craft accident statistics (see for<br />
instance brochures published by the CAA-UK [1998, 2000] and CAA-NL [2007]),<br />
although there is no strict convention. It provides a convenient framework to map the<br />
accident archetypes and allows a straightforward check if the set <strong>of</strong> archetypes is<br />
sufficiently complete. A next step is to map past accidents on the set <strong>of</strong> accident archetypes.<br />
In CATS this was done for 8969 accidents without obvious omissions being identified.<br />
By using generic accident scenarios as the backbone <strong>of</strong> a causal <strong>risk</strong> model, the model<br />
structure is explicitly based on observations in practice, rather than a theoretical approach<br />
such as structural decomposition or functional abstraction. Aggregation in the accident<br />
scenarios was performed heuristically by the analysts’ knowledge <strong>of</strong> the accident<br />
155<br />
Abrupt<br />
manoeuvre<br />
Cabin<br />
environment<br />
Uncontrolled<br />
collision<br />
with ground<br />
Controlled<br />
flight into<br />
terrain<br />
Forced<br />
landing<br />
Mid-<strong>air</strong><br />
collision<br />
Collision<br />
on ground<br />
Structure<br />
overload<br />
Fire &<br />
explosion
evolution 78 . An advantage <strong>of</strong> this approach is the ability to simultaneously capture technical<br />
malfunctions, human behaviour and managerial influences without being confined by a<br />
theoretical modelling construct. On the down side, this practical approach is predominantly<br />
based on observations from the past and ‘new’ accidents and accident types where <strong>risk</strong><br />
control measures work so well that they do not happen are not necessarily captured. A<br />
failure to capture ‘new’ accidents is <strong>of</strong>ten used as an argument against <strong>models</strong> that are<br />
based on past accidents, but as a matter <strong>of</strong> fact new accidents are rare indeed [Levy 2001].<br />
Nevertheless, this restriction should be made clear to the user and it should be verified that<br />
this is indeed acceptable.<br />
The concept <strong>of</strong> accident archetypes is also useful in identifying the relevant human<br />
performance shaping factors, a problem identified in section 9.1. Because accidents are not<br />
random event sequences, not all errors are equally hazardous. In many cases there will be<br />
sufficient time for the flight crew to detect an error and recover from the situation, without<br />
flight safety being compromised. Instead <strong>of</strong> starting human performance assessment with<br />
the human operator and determining how he or she can fail, it is therefore proposed to start<br />
with the accidents and the errors that have contributed to those accidents. The accident<br />
archetypes define the types <strong>of</strong> errors and associated contexts that have been shown to be<br />
relevant.<br />
Consider Controlled Flight Into Terrain (CFIT) accidents as an example. CFIT accidents<br />
are those in which an <strong>air</strong>craft, under the control <strong>of</strong> the crew, is flown (unintentionally) into<br />
terrain, obstacles or water with no or insufficient prior awareness on the part <strong>of</strong> the crew <strong>of</strong><br />
the impending disaster [Khatwa & Roelen 1996]. It is a class <strong>of</strong> accidents that received<br />
special attention in the 1990s because it was seen as the deadliest ‘killer’ in aviation [FSF<br />
1999]. In these accidents, situational awareness errors 79 and tactical decision making<br />
errors 80 are dominant. Situation awareness errors were identified in almost 100% <strong>of</strong> CFIT<br />
accidents in the approach phase <strong>of</strong> flight [Khatwa & Roelen 1996]. Non-precision<br />
approaches are particularly <strong>risk</strong>y [Enders et al 1996]. During a precision approach the flight<br />
crew receives detailed information on the position <strong>of</strong> the <strong>air</strong>craft relative to the desired<br />
approach path, both in the horizontal plane (deviation from the localiser) as well as in the<br />
vertical plane (deviation from the glideslope). When such information is missing, i.e. when<br />
the approach is non-precision, it is easier to become ‘lost’. If during a non-precision<br />
approach the flight crew reaches the minimum descent altitude 81 and they do not have the<br />
runway in sight the approach should be abandoned. Continuation <strong>of</strong> the approach is a<br />
tactical decision error. This error, under these circumstances, in combination with a<br />
situation awareness error, is especially dangerous.<br />
This example <strong>of</strong> CFIT accidents shows how certain types <strong>of</strong> human error can be linked to<br />
certain types <strong>of</strong> <strong>air</strong>craft accidents. If we are also be able to link certain delivery systems to<br />
particular error types, the connection can be made from organisational influences all the<br />
way to accident occurrence. Research by Lin [2007, 2008] is aimed at identifying the links<br />
between managerial influences on flight crew error with the aim <strong>of</strong> directly connecting<br />
78<br />
Peer review is required to validate this aggregation (see section 10).<br />
79<br />
Situational awareness error was defined as controlling the <strong>air</strong>craft to wrong parameters.<br />
80<br />
Tactical decision making error was defined as failing to revise action in response to a<br />
signal to do so or failing to heed warnings or alerts that suggest a revision <strong>of</strong> action.<br />
81<br />
The minimum descent altitude is the lowest altitude to which descent is authorized on<br />
final approach in execution <strong>of</strong> a non-precision approach procedure. Continuation <strong>of</strong> the<br />
approach is then only permitted when the runway or runway lights can be seen.<br />
156
management <strong>models</strong> (section 9.2) to human performance <strong>models</strong> (section 9.1). Figure 35<br />
shows the relative contribution <strong>of</strong> delivery systems to five types <strong>of</strong> flight crew error. This<br />
figure is based on a sample <strong>of</strong> accident and incident data from the ADREP database.<br />
According to this information, competence is the dominant delivery system for all five<br />
types <strong>of</strong> flight crew errors being identified, but the research also shows significant<br />
differences for the next most important delivery system across error types. For<br />
perception/judgement and <strong>air</strong>craft handling the 2 nd most influential delivery system is<br />
technology interface design, for decisions it is manpower planning and execution, for action<br />
in respect to procedures it is communication and coordination, and for operation <strong>of</strong><br />
equipment there is a large part not specific. Notice that the five error types are described on<br />
a generic level rather than being very specific. Again the approach in the analysis is to start<br />
at a generic level to identify the most important patterns and trends, and only add more<br />
detail if this is required by the user and allowed by the available data.<br />
perception/judgement decisions operation <strong>of</strong> equipment<br />
<strong>air</strong>craft handling action in respect to procedures<br />
not specific<br />
technology function<br />
procedures and<br />
regulation<br />
manpower planning and<br />
availability<br />
technology interface<br />
design<br />
conflict resolution<br />
competence and<br />
suitability<br />
communication and<br />
coordination<br />
commitment<br />
0% 10% 20% 30% 40% 50% 60% 70%<br />
Figure 35: Relative contribution <strong>of</strong> delivery systems to flight crew error types.<br />
9.4. Conclusions for this section<br />
<strong>Causal</strong> aviation <strong>risk</strong> <strong>models</strong> necessarily require causal sequences and probabilities to be<br />
estimated for (failure) events involving human actions and decisions. Because there is<br />
greater variability and interdependence in human performance than in hardware<br />
performance, specific human performance <strong>models</strong> must be developed. The classical<br />
approach in human error quantification is to use basic error probabilities for specific tasks<br />
and to modify those to account for specific circumstances or contexts. This approach is not<br />
good at supporting the identification <strong>of</strong> errors <strong>of</strong> commission and assumes that the<br />
performance shaping factors are independent, which is not a very reasonable assumption.<br />
Some <strong>of</strong> these limitations can be overcome by using influence diagrams like Bayesian<br />
Belief Nets to represent the influence <strong>of</strong> the context or performance shaping factors on error<br />
probability. The performance shaping factors can also be described as the output <strong>of</strong> delivery<br />
157
systems. They then provide a convenient link between safety management and human error<br />
probability. It is also proposed to use the associated event in e.g. the fault tree (or any other<br />
type <strong>of</strong> model representation that is used), which the human performance model ties into, to<br />
estimate the basic human error probability instead <strong>of</strong> deriving this from a task analysis as is<br />
the case in first generation human performance methods. Mapping <strong>of</strong> accident and incident<br />
data on those fault trees will ensure that both errors <strong>of</strong> omission as well as errors <strong>of</strong><br />
commission will be captured in the model. Whether this approach is indeed suitable for<br />
analysis <strong>of</strong> errors <strong>of</strong> commission is still open however and needs solving.<br />
There is also a requirement for the causal <strong>risk</strong> model to be able to represent the effect <strong>of</strong><br />
managerial influences on safety, but this is not a straightforward task. The difficulty is that<br />
the influence <strong>of</strong> management is always via the failure at the operational level. To describe<br />
the effect <strong>of</strong> management on safety the description <strong>of</strong> the managerial system must be linked<br />
to the description <strong>of</strong> the failure events at the operational level. This requires a meeting point<br />
<strong>of</strong> two model types that are inherently different. The failure events at the operational level<br />
are described as causal chains and failure pathways, but safety management is considered a<br />
control function aimed at maintaining a particular operational process within the boundaries<br />
<strong>of</strong> safe operation. This way <strong>of</strong> formulating safety management as a control function<br />
logically results in attempts to apply control theory as a modelling approach and to use<br />
dynamic <strong>models</strong> with control loops. Strictly technically this seems feasible, but it can be<br />
problematic to link this to ‘simple’ static <strong>models</strong> using representation techniques like fault<br />
trees and Bayesian belief nets. If static <strong>models</strong> are used to represent the failure events at the<br />
operational level, the management influences must be described in a different way, one that<br />
allows the link with these static <strong>models</strong>. As is proposed in this chapter, this can be done by<br />
describing managerial influences on human task performance by six delivery systems,<br />
connecting to generic human operator <strong>models</strong>. The delivery systems are represented as<br />
parent nodes <strong>of</strong> Bayesian Belief Net representations <strong>of</strong> human operator performance.<br />
There are potentially many interactions between individual model elements and if these<br />
must all be represented we may end up with an excessive development and assessment<br />
burden and a model that looks like a giant h<strong>air</strong>ball which is not very transparent. It is<br />
necessary to find a proper balance between model completeness and practical feasibility.<br />
The proposed way <strong>of</strong> doing this is by developing the model from the generic to the specific,<br />
starting at the highest level <strong>of</strong> abstraction and introducing additional detail step-by-step.<br />
This can be done systematically if the model is hierarchical, with separate levels <strong>of</strong><br />
abstraction that are formally defined and if certain patterns exist at higher levels <strong>of</strong><br />
abstraction rather than accidents being random combinations <strong>of</strong> random events. A review <strong>of</strong><br />
accidents shows that indeed event sequences are <strong>of</strong>ten very similar even in cases where<br />
human error plays an important part in the accident sequence. A review <strong>of</strong> a large set <strong>of</strong><br />
accidents identified 33 <strong>of</strong> such accident archetypes. These provide a suitable backbone for a<br />
causal <strong>risk</strong> model. The advantage <strong>of</strong> the use <strong>of</strong> accident archetypes is that it is a data driven<br />
approach which results in realistic scenarios. It easily captures the most frequent accidents<br />
which means that it quickly focuses on those elements which are most relevant for flight<br />
safety. The accident archetypes create a top level <strong>of</strong> the model that is intuitively transparent<br />
and reduce the assessment burden because dependencies are limited. The concept <strong>of</strong><br />
accident archetypes is also useful to help in identifying the relevant performance shaping<br />
factors for human reliability assessment.<br />
158
Chapter 10. Model validation<br />
10.1. Introduction<br />
Model validation is usually described as a process <strong>of</strong> checking if the model provides, for<br />
the objective for which it is applied, a correct description <strong>of</strong> the reality that it represents. An<br />
alternative definition is that model validation is a process <strong>of</strong> checking the degree to which<br />
the model provides, for the objective for which it is applied, a correct description <strong>of</strong> the<br />
reality that it represents [AIAA 1998]. The fact that a model is by definition unequal to<br />
reality is the basis for a validation approach developed by Everdij et al [2006]. This shifts<br />
the validation activities from proving that the model is correct to evaluating what the<br />
difference between model and reality means in terms <strong>of</strong> the model output. In this thesis the<br />
first definition <strong>of</strong> validation is adopted.<br />
The reason we need validation is because the model is only a representation <strong>of</strong> reality and<br />
during the process <strong>of</strong> modelling numerous assumptions and simplifications have been<br />
made. Typically, validation involves comparison <strong>of</strong> the behaviour <strong>of</strong> the model with the<br />
behaviour <strong>of</strong> the part <strong>of</strong> the ‘real’ world that the model is supposed to represent. In this case<br />
the represented reality is the safety behaviour <strong>of</strong> the <strong>air</strong> <strong>transport</strong> system and in the model<br />
this is expressed as accident probability (or probability distribution) as a function <strong>of</strong> the<br />
probability <strong>of</strong> occurrence <strong>of</strong> certain base parameters. Validation <strong>of</strong> a causal <strong>risk</strong> model <strong>of</strong><br />
<strong>air</strong> <strong>transport</strong> is problematic because <strong>of</strong> the complexity <strong>of</strong> the system, the small number <strong>of</strong><br />
accidents now occurring and the intangibility <strong>of</strong> <strong>risk</strong>. Full validation <strong>of</strong> a complete causal<br />
<strong>risk</strong> model <strong>of</strong> <strong>air</strong> <strong>transport</strong> is not possible because model results cannot be compared with a<br />
continuous observation <strong>of</strong> an unaltered system; the time period involved in observing<br />
reality until sufficient events have accumulated makes real life observations impractical and<br />
creating these events on purpose is unethical. Full validation would also involve<br />
comparison <strong>of</strong> model results with reality for every possible set <strong>of</strong> conditions. For the sort <strong>of</strong><br />
<strong>models</strong> that are considered here the number <strong>of</strong> possible conditions is so large that this is<br />
impossible. Moreover a causal <strong>risk</strong> model <strong>of</strong> <strong>air</strong> <strong>transport</strong> exhausts all accident data for the<br />
development <strong>of</strong> the model and checking the model results with independent accident data is<br />
not possible. Therefore alternative methods for demonstrating the ‘validity’ <strong>of</strong> the model<br />
must be sought.<br />
To circumvent the problems <strong>of</strong> complexity and intangibility <strong>of</strong> <strong>risk</strong>, individual segments <strong>of</strong><br />
the model with directly observable outputs will have to be validated, where ‘validation’ is<br />
restricted to a few specific conditions. Pro<strong>of</strong> must be provided that the overall process for<br />
combining these segments into a single model is sufficiently correct for the objective(s)<br />
under consideration and that this not only holds for the specific condition but also for other<br />
possible conditions. The proposed hierarchical structure <strong>of</strong> a causal <strong>risk</strong> model is<br />
advantageous in this respect. The hierarchical structure is composed <strong>of</strong> accident scenarios<br />
(e.g. represented as ESDs) at the highest level <strong>of</strong> aggregation, direct causal factors <strong>of</strong><br />
scenario events (e.g. represented as fault trees) at the next highest level, and common mode<br />
human and managerial influences (e.g. represented as BBNs) at the most detailed level. The<br />
modelling techniques used in each <strong>of</strong> the ‘layers’ <strong>of</strong> the model necessitate specific<br />
assumptions and simplifications and by demonstrating the validity <strong>of</strong> a small section <strong>of</strong><br />
each layer it is plausible that the results are equally valid for the rest <strong>of</strong> the layer, provided<br />
159
that the rest contains no ‘new’ general assumptions or simplifications. For instance, where<br />
the BBNs at the most detailed level <strong>of</strong> a causal <strong>risk</strong> model are quantified using expert<br />
judgement, by demonstrating the validity <strong>of</strong> this quantification process for a small part, the<br />
validity <strong>of</strong> this process for the rest <strong>of</strong> the model components is made plausible as well,<br />
assuming the experts there can be considered to be equally knowledgeable. On top <strong>of</strong> this,<br />
there is the issue whether experts have the impression that the model looks right (for<br />
instance with respect to the sequence delineation in the scenarios) and behaves as experts<br />
expect. This is called face validity and peer review.<br />
This section provides examples <strong>of</strong> the way in which validation <strong>of</strong> a causal aviation <strong>risk</strong><br />
model could be conducted. It simultaneously provides ‘pro<strong>of</strong>’ for some <strong>of</strong> the statements<br />
that have been made in previous sections. Four aspects will be discussed:<br />
• Validity <strong>of</strong> the process <strong>of</strong> decomposition (e.g. breakdown into different accident<br />
scenarios) and aggregating the results<br />
• Case validity: comparison <strong>of</strong> behaviour <strong>of</strong> (a section <strong>of</strong>) the model with real world<br />
behaviour<br />
• Face validity and peer review<br />
• Assumption analysis<br />
Because <strong>of</strong> the problems identified earlier (comparison <strong>of</strong> model results with a continuous<br />
observation <strong>of</strong> the unaltered system is not possible, the development <strong>of</strong> the model exhausts<br />
all accident data, the set <strong>of</strong> possible conditions is infinitely large) this is all that can (and<br />
should) be done.<br />
10.2. Validation <strong>of</strong> the generic accident scenarios<br />
10.2.1. Validation <strong>of</strong> take-<strong>of</strong>f and landing overrun probability estimates<br />
This section gives an example <strong>of</strong> checking the validity <strong>of</strong> the process <strong>of</strong> breakdown into<br />
different accident scenarios and aggregating the results. Such a validity check was done for<br />
a causal <strong>risk</strong> model developed for the FAA. That model represents <strong>risk</strong>s <strong>of</strong> all flight phases,<br />
but the validity check was limited to take-<strong>of</strong>f overrun accidents and landing overrun<br />
accidents. The FAA model is a hybrid causal model combining three hierarchical levels.<br />
The highest level is identical to that used in the Dutch CATS model and consists <strong>of</strong> 33<br />
Event Sequence Diagrams that each represent a generic accident scenario [Roelen et al<br />
2006b]. Take-<strong>of</strong>f overrun accidents are represented as possible end-states in 10 different<br />
scenarios, landing overrun accidents are possible end states in 8 scenarios. The model was<br />
quantified with worldwide accident data for large Western-built <strong>air</strong>craft (MTOW > 5,700<br />
kg) in commercial operations from 1990 - 2003. Quantified model results were compared<br />
with three other research reports that contain estimates <strong>of</strong> the probability <strong>of</strong> occurrence <strong>of</strong><br />
take-<strong>of</strong>f overrun accidents or landing overrun accidents. These studies had similar data<br />
inclusion criteria, although there are some differences in the time frame. Results <strong>of</strong> the<br />
comparison are presented in table 9.<br />
160
Table 9: Comparison <strong>of</strong> model results with study reports<br />
Accident type FAA <strong>Causal</strong> Model <strong>NLR</strong> study<br />
1990-2004<br />
82<br />
Boeing study<br />
1980-2004<br />
83<br />
<strong>NLR</strong> study<br />
1990-1999<br />
84<br />
1970-2004<br />
Take-<strong>of</strong>f overrun 1.27 x 10 -7 1.36 x 10 -7 1.4 x 10 -7<br />
Landing overrun 4.17 x 10 -7 3.87 x 10 -7 5.0 x 10 -7<br />
The match between the model results and the other results are good. All results are based on<br />
more or less the same data source and are in that sense not independent, but the comparison<br />
is important because it shows that indeed the process <strong>of</strong> breaking accidents down into<br />
generic accident scenarios and then aggregating the results is valid or at least acceptable.<br />
The model reproduces the data that was used to construct it so there are no overrun accident<br />
scenarios missing from the FAA model.<br />
10.2.2. Completeness <strong>of</strong> the accident scenarios<br />
The concept <strong>of</strong> generic accidents scenarios as the top level <strong>of</strong> the model hinges on the<br />
assumption <strong>of</strong> repeatable accidents. The validity <strong>of</strong> this assumption was discussed in<br />
section 9.3. Aggregation in the accident scenarios was performed heuristically by the<br />
analysts’ knowledge <strong>of</strong> the accident evolution. Peer review is required to validate this<br />
aggregation (see also section 10.4).<br />
10.3. Validation <strong>of</strong> a model for missed approaches: case validity<br />
This section provides an example <strong>of</strong> the validation process for a small segment <strong>of</strong> a causal<br />
<strong>risk</strong> model. The output <strong>of</strong> this sub-model is a directly observable variable -the average<br />
missed approach rate- which makes validation more straightforward than in the case <strong>of</strong><br />
intangible variables such as ‘<strong>risk</strong>’. Like every other sub-model <strong>of</strong> the causal <strong>risk</strong> model, the<br />
missed approach model consists <strong>of</strong> input variables, a computational engine and an output<br />
variable. The model is considered valid if the values <strong>of</strong> the input variables correspond with<br />
reality and the value <strong>of</strong> the output variable as a function <strong>of</strong> the values <strong>of</strong> the input variables<br />
corresponds with reality. In the example the observed missed approach rate at Schiphol<br />
<strong>air</strong>port is compared with model results. The model includes an aspect <strong>of</strong> human<br />
performance and is therefore representative <strong>of</strong> the most detailed level <strong>of</strong> a causal <strong>risk</strong><br />
model.<br />
10.3.1. Qualitative description <strong>of</strong> the model<br />
For the purpose <strong>of</strong> demonstrating causal modelling techniques for safety analysis, a<br />
Bayesian Belief Net describing the case <strong>of</strong> a missed approach was developed [Roelen et al<br />
2002]. A ‘missed approach’ should be initiated by the pilots when a situation arises that<br />
would make the continuation <strong>of</strong> the approach and landing unsafe. Generally speaking,<br />
during a missed approach the flight crew advances the throttle to go-around power, the flap<br />
setting is reduced (typically to 20 degrees) and the <strong>air</strong>craft is rotated to 15 degrees pitch<br />
attitude. The <strong>air</strong>craft climbs to a predefined altitude from where a new approach is initiated,<br />
or the <strong>air</strong>craft diverts to an alternate <strong>air</strong>port. The purpose <strong>of</strong> the missed approach procedure<br />
is to reject flying into unsafe conditions or under unsafe circumstances and to enable the<br />
crew to carry out a new approach and landing under safe circumstances. The missed<br />
approach phase is a dynamic and complex phase <strong>of</strong> flight, requiring decision making, and<br />
82 [Cheung & Post 2005].<br />
83 [MacKinnon 2000].<br />
84 [Van Es 2005].<br />
161
quick handling by the flight crew and <strong>air</strong> traffic controller. It is characterised by relatively<br />
large changes <strong>of</strong> the <strong>air</strong>craft configuration (from landing to climb out configuration). There<br />
can be various reasons why an approach is discontinued and a missed approach procedure<br />
is executed. The failure to recognise the need for and to execute a missed approach when<br />
appropriate is a major cause <strong>of</strong> approach and landing accidents. According to a study<br />
published by the Flight Safety Foundation in 1998, “the most common primary causal<br />
factor [<strong>of</strong> approach and landing accidents] was judged to be omission <strong>of</strong><br />
action/inappropriate action, which most <strong>of</strong>ten referred to the crew continuing the descent<br />
below the Decision Height or Minimum Descent Altitude without visual reference or when<br />
visual cues were lost” [FSF 1998]. Although it has been recognised that the execution <strong>of</strong><br />
the missed approach manoeuvre itself can, if conducted incorrectly, play a role in the<br />
sequence <strong>of</strong> events that results in an accident, this issue is not described in the model<br />
validated here 85 . The model is, therefore, strictly focussing on ‘failure to execute a missed<br />
approach’. This failure to execute a missed approach is a pivotal event in several approach<br />
and landing accident scenario’s.<br />
A missed approach is ultimately initiated by the flight crew, based on their mental<br />
representation <strong>of</strong> the current situation, a sort <strong>of</strong> cognitive envelope which the flight crew<br />
uses to assess dynamically the safety state <strong>of</strong> the approach and landing phase. A potentially<br />
unsafe situation exists when there is a mismatch between the flight crew’s mental<br />
representation <strong>of</strong> the situation and the ‘actual’ situation. The main factors that are important<br />
in the missed approach decision making are considered to be the following:<br />
• Visibility<br />
• Cross wind<br />
• Longitudinal separation from the preceding <strong>air</strong>craft in the approach path<br />
• Speed deviation from the reference approach speed at 500 ft altitude<br />
• Crew alertness<br />
• Fuel weight<br />
The corresponding influence diagram is presented in Figure 36. In the missed approach<br />
model, the following assumptions/techniques are applied:<br />
• Expert judgement for the quantification <strong>of</strong> some causal influences,<br />
• Existing databases for the quantification <strong>of</strong> other causal influences,<br />
• Combination <strong>of</strong> expert judgement results with other quantified data,<br />
• Bayesian Belief Net to represent human reliability.<br />
Quantification <strong>of</strong> the model requires quantification <strong>of</strong> the parent nodes and <strong>of</strong> the influence<br />
<strong>of</strong> the parent nodes on the child node. This is further described in the next two sections.<br />
85<br />
In a later development <strong>of</strong> the model for CATS, the incorrect missed approach execution<br />
is indeed represented in the model as potentially leading to an accident.<br />
162
Failure to execute MA<br />
when conditions are<br />
present<br />
Visibility<br />
Failure to execute MA<br />
when conditions are<br />
present<br />
Mean cross<br />
wind<br />
Missed approach<br />
execution<br />
Separation<br />
in <strong>air</strong><br />
Figure 36: Missed approach model influence diagram<br />
10.3.2. Quantification <strong>of</strong> the model variables (the parent nodes)<br />
The initial model described in Roelen et al [2002] is a discrete BBN in which each <strong>of</strong> the<br />
parameters can only take two values; ‘OK’ or ‘not OK’. Because <strong>of</strong> the inherent limitations<br />
<strong>of</strong> a discrete BBN the model was further developed into a continuous BBN with variables<br />
modelled as continuous quantities [Morales et al 2008]. The probability distributions <strong>of</strong> the<br />
parent nodes were quantified using readily available data from the <strong>NLR</strong> Air Safety<br />
Database. Because the validation centres around comparison <strong>of</strong> model results with observed<br />
values for Schiphol <strong>air</strong>port, the aim <strong>of</strong> the quantification was to have probability<br />
distributions that are representative for the situation at Schiphol.<br />
Visibility<br />
Described in metres, visibility is based on 27 million observations across Europe. The<br />
cumulative probability distribution is presented in Figure 37, the unit <strong>of</strong> measure for<br />
visibility is meters.<br />
163<br />
Speed<br />
deviation<br />
Crew<br />
alertness<br />
Fuel weight
Cumulative probability<br />
1<br />
0.9<br />
0.8<br />
0.7<br />
0.6<br />
0.5<br />
0.4<br />
0.3<br />
0.2<br />
0.1<br />
0<br />
0 2000 4000 6000 8000 10000 12000 14000 16000 18000 20000<br />
Figure 37: Probability distribution for visibility<br />
Visibility (m)<br />
Mean cross wind<br />
The mean cross wind is the steady state crosswind measured at landing. The probability<br />
estimate is based on world-wide in service operations <strong>of</strong> UK <strong>air</strong>lines (sample size about<br />
2000) as presented as reference in EASA’s <strong>air</strong>craft certification specifications for all<br />
weather operations [EASA 2003b]. Crosswinds from the left and right are be equally likely.<br />
In Figure 38 the cumulative probability <strong>of</strong> the crosswind is shown, the unit <strong>of</strong> measure is<br />
knots.<br />
Cumulative probability<br />
1<br />
0.9<br />
0.8<br />
0.7<br />
0.6<br />
0.5<br />
0.4<br />
0.3<br />
0.2<br />
0.1<br />
0<br />
0 5 10 15 20 25<br />
Mean crosswind (kts)<br />
Figure 38: Cumulative probability for mean cross wind<br />
164
Traffic separation in the <strong>air</strong><br />
Traffic separation in the <strong>air</strong> refers to the longitudinal separation distance between two<br />
successive <strong>air</strong>craft on the approach to the same runway. The minimum required separation<br />
distance depends on the type <strong>of</strong> approach and the weight category <strong>of</strong> the <strong>air</strong>craft. The<br />
probability distribution was determined by analyzing a sample <strong>of</strong> FANOMOS data.<br />
FANOMOS stands for “Flight Track and Aircraft Noise Monitoring System”. The system<br />
is controlled by the Dutch Aviation Inspectorate (IVW). The FANOMOS system calculates<br />
actual flight paths <strong>of</strong> individual <strong>air</strong>craft by combining radar track data and flight plan data.<br />
These data are received automatically from ATC the Netherlands. Figure 39 shows a<br />
probability density that is based on a sample <strong>of</strong> 2382 approaches on Schiphol <strong>air</strong>port<br />
runway 18R between 1 and 8 March 1999. Separation distance is measured in nautical<br />
miles. Although the sample size is relatively small, and despite the fact that the sample only<br />
represents one approach for one particular <strong>air</strong>port, the data is considered sufficiently<br />
representative because the rules on separation distances are largely governed by<br />
international standards. Correctness <strong>of</strong> this assumption is provided by comparison with a<br />
distribution <strong>of</strong> separation distances that was found at the Dallas Fort Worth International<br />
Airport [Ballin & Erzberger 1996].<br />
Probability density<br />
0.3<br />
0.25<br />
0.2<br />
0.15<br />
0.1<br />
0.05<br />
0<br />
0 2 4 6 8 10 12 14 16 18 20 22 24<br />
Separation distance (nm)<br />
Figure 39: Probability distribution for traffic separation<br />
Speed deviation<br />
During the approach, the <strong>air</strong>craft must be on the correct lateral and vertical flight path<br />
(based on radio navigation guidance or visual reference), the <strong>air</strong>craft must be in the desired<br />
landing configuration and at the desired speed and the landing checklist must have been<br />
accomplished. For precision approaches, deviations from the lateral and vertical glide path<br />
are hardly an issue. Speed is a different matter. Before the approach, the crew will have<br />
calculated the approach reference speed for their particular <strong>air</strong>craft. This reference speed<br />
mainly depends on the weight <strong>of</strong> the <strong>air</strong>craft. A correction will be added to this reference<br />
speed to cater for wind conditions or other external factors. The reference speed plus the<br />
correction determines the ‘bug-speed’, which is the desired speed during the approach.<br />
When at 500 ft altitude the <strong>air</strong>craft’s speed deviates too much from the bug speed (e.g, the<br />
speed drops below bug speed minus 5 knots or exceeds bug speed plus 10 knots), a missed<br />
approach is required. Figure 40 presents the distribution <strong>of</strong> <strong>air</strong>craft speed relative to the bug<br />
165
speed 86 for the 500 ft altitude gate. This data represents a total sample <strong>of</strong> 13,753 approaches<br />
flown by a large European <strong>air</strong>line. Speed is indicated <strong>air</strong>speed in knots.<br />
Probability density<br />
0.14<br />
0.12<br />
0.1<br />
0.08<br />
0.06<br />
0.04<br />
0.02<br />
0<br />
-10 -5 0 5 10 15 20<br />
Deviation from bug speed (kts)<br />
Figure 40: Probability distribution for speed deviation at 500 ft altitude.<br />
Flight crew alertness<br />
Alertness (or its opposite, flight crew fatigue) is an important issue in flight crew<br />
performance. Fatigue was reported as a contributory factor in 21% <strong>of</strong> the incident reports to<br />
the NASA Aviation Safety Reporting System [Lyman & Orlady 1980]. Since 1990, fatigue<br />
has been a major issue in national and international <strong>transport</strong>ation research programs. The<br />
concept <strong>of</strong> fatigue is very complex; it can be defined in terms <strong>of</strong> performance decrement,<br />
subjective feelings <strong>of</strong> fatigue, or physiological changes. For practical purposes, excessive<br />
fatigue can best be considered as a general description <strong>of</strong> the multi-causal condition <strong>of</strong><br />
feeling unfit. The influence <strong>of</strong> alertness on flight crew performance justifies its<br />
representation in the model. To quantify the probability <strong>of</strong> occurrence <strong>of</strong> the degree <strong>of</strong><br />
alertness <strong>of</strong> the flight crew during the approach phase, results from field and laboratory<br />
studies on the different determinants <strong>of</strong> <strong>air</strong>crew fatigue and their effects on alertness and<br />
performance <strong>of</strong> <strong>air</strong>crew are used. These studies were conducted by the Aviation Medicine<br />
Group <strong>of</strong> TNO Human Factors as also described in section 8.5.6. The studies, employing<br />
subjective and objective measures <strong>of</strong> in-flight performance and alertness, concerned quality<br />
and duration <strong>of</strong> sleep, effects <strong>of</strong> early reporting times, effects <strong>of</strong> night flying, effects <strong>of</strong><br />
alcohol and medication, and the effects <strong>of</strong> countermeasures, such as onboard sleep<br />
(augmented crew) and pre-planned napping in the cockpit seat. The results <strong>of</strong> these studies<br />
provide an extensive database on factors causing <strong>air</strong>crew fatigue and imp<strong>air</strong>ed performance<br />
and alertness in flight. It has been demonstrated that pre-flight levels <strong>of</strong> sleepiness and<br />
vigilance are good predictors <strong>of</strong> the level <strong>of</strong> in-flight crew alertness [Valk & Simons 1998].<br />
Therefore, sleepiness is used as input for the model. Pre-flight and in-flight sleepiness were<br />
measured by means <strong>of</strong> the Stanford Sleepiness Scale (SSS). The result <strong>of</strong> the SSS is a score<br />
with increasing sleepiness from 1 to 7, where 1 signifies “feeling active and vital; wide<br />
awake” and 7 stands for “almost in reverie; sleep onset soon; losing struggle to remain<br />
86<br />
The bug speed is the target speed for the approach. ‘Bug’ refers to a movable pointer on<br />
the <strong>air</strong>speed indicator that can be positioned by the pilot at the target speed to act as a visual<br />
aid for maintaining the correct speed during the approach.<br />
166
awake”, see also section 8.1. Studies have indicated a high correlation between SSS<br />
measures and flying performance. Field studies by the Aviation Medicine Group <strong>of</strong> TNO<br />
Human Factors were used to determine probability densities for crew alertness. Sleepiness<br />
was measured before the flight and at the top <strong>of</strong> descent. Sample size was 807 for ‘before<br />
flight’ and 12,965 for ‘top <strong>of</strong> descent’. The results are presented in Figure 41.<br />
Probability density<br />
0.45<br />
0.40<br />
0.35<br />
0.30<br />
0.25<br />
0.20<br />
0.15<br />
0.10<br />
0.05<br />
0.00<br />
Before flight Top <strong>of</strong> descent<br />
SSS 1 SSS 2 SSS 3 SSS 4 SSS 5 SSS 6 SSS 7<br />
Stanford Sleepiness Scale<br />
Figure 41: Probability distribution for flight crew alertness<br />
Fuel weight<br />
The amount <strong>of</strong> fuel on-board the <strong>air</strong>craft may affect a crew’s decision to fly a missed<br />
approach. If the amount <strong>of</strong> fuel is critical, they may decide to continue the approach in spite<br />
<strong>of</strong> unfavourable conditions. Airline fuel policies are delicate issues. On the one hand, an<br />
<strong>air</strong>line will want to have its <strong>air</strong>craft land with the minimum amount <strong>of</strong> fuel, because any<br />
surplus amount means either a lower payload or reduced range. On the other hand,<br />
(international) regulation requires that on arriving at the destination <strong>air</strong>port, the <strong>air</strong>craft has<br />
sufficient fuel to fly to the alternative <strong>air</strong>port and then to fly for a further 30 minutes at<br />
holding speed at 1500 ft. Actual fuel data is difficult to acquire because, as aviation is such<br />
a competitive environment, <strong>air</strong>lines are reluctant to share fuel information. Figure 42 shows<br />
a limited sample <strong>of</strong> fuel data for one particular <strong>air</strong>craft type <strong>of</strong> a large European <strong>air</strong>line. The<br />
total sample size is 172 flights. The most appropriate unit <strong>of</strong> measure is remaining fuel in<br />
kilograms after landing as this is the way it is represented to the pilots and hence is used in<br />
the flight crew’s decision making process.<br />
167
Probability density<br />
0.0008<br />
0.0007<br />
0.0006<br />
0.0005<br />
0.0004<br />
0.0003<br />
0.0002<br />
0.0001<br />
0<br />
Figure 42: Aircraft fuel weight distribution.<br />
0<br />
750<br />
1500<br />
2250<br />
3000<br />
3750<br />
4500<br />
5250<br />
6000<br />
6750<br />
7500<br />
8250<br />
9000<br />
9750<br />
Fuel quantity at arrival (kgs)<br />
10.3.3. Dependencies<br />
The dependencies between the nodes are described as unconditional and conditional rank<br />
correlations that were estimated on the basis <strong>of</strong> expert judgement utilizing the procedures<br />
described in Morales et al [2008]. A single expert, a pilot for a large international <strong>air</strong>line,<br />
answered a total <strong>of</strong> 7 questions. For the marginal distribution <strong>of</strong> the missed approach rate<br />
the expert was asked: ’Consider 100,000 randomly chosen flights at Schiphol <strong>air</strong>port , on<br />
how many <strong>of</strong> these flights will a missed approach be executed?’. Next the dependence<br />
information was obtained starting with the rank correlation <strong>of</strong> missed approach execution<br />
and separation as follows: ‘Suppose the variable separation was observed and its value was<br />
found to lie above its median value. What is your probability, that in this situation, the<br />
number <strong>of</strong> missed approaches will be above its median value?’ The conditional rank<br />
correlation <strong>of</strong> missed approach execution and mean cross wind given separation was then<br />
determined by asking ‘Suppose the variables separation and mean crosswind were<br />
observed and their values were was found to lie above their median values. What is your<br />
probability, that in this situation, the number <strong>of</strong> missed approaches will be above its<br />
median value?’ The rest <strong>of</strong> the rank correlations were elicited in a similar way by<br />
sequentially adding information about the variables entering the conditional set.<br />
The results <strong>of</strong> the elicitation for the 6 arcs in the BBN for missed approach are summarized<br />
in Table 10. A negative rank correlation indicates a decreasing missed approach probability<br />
if the variable increases. In this case for instance the missed approach probability decreases<br />
if the separation distance increases. The value <strong>of</strong> the rank correlation is an indication <strong>of</strong> the<br />
strength <strong>of</strong> the dependence, the higher the number the stronger the dependence. A<br />
functioning model was obtained using the copula vine approach and the UniNet s<strong>of</strong>tware<br />
application.<br />
168
Table 10: Conditional rank correlations<br />
r7,6 -0.88 7 = missed approach execution<br />
r7,5│6 0.20 6 = separation in <strong>air</strong><br />
r7,4│6,5 0.12 5 = mean cross wind<br />
r7,3│6,5,4 0.23 4 = speed deviation at 500 ft<br />
r7,2│6,5,4,3 -0.11 3 = crew alertness<br />
r7,1│6,5,4,3,2 0.11 2 = visibility<br />
1 = fuel weight<br />
10.3.4. Comparison <strong>of</strong> model results with observations in practice<br />
Flight track data was analysed to validate this missed approach model. The objective was to<br />
obtain a realistic estimate <strong>of</strong> the probability <strong>of</strong> a missed approach in correlation with the<br />
separation distance and to compare this with model estimates. The flight track data was<br />
derived from FANOMOS [Kreijkamp & Veerbeek 1997]. The flight tracks in FANOMOS<br />
are collected through measurements with the secondary surveillance radar (SSR) located at<br />
Amsterdam Airport Schiphol. This raw data is updated every 4 seconds and is used by<br />
FANOMOS to reconstruct the actual flight track <strong>of</strong> the <strong>air</strong>craft. FANOMOS computes the<br />
position <strong>of</strong> the <strong>air</strong>craft (in the “Rijksdriehoek” co-ordinate system (RDC)), the ground<br />
speed, and the total recorded length <strong>of</strong> the track. All reconstructed flight tracks are stored in<br />
a database. For this study, flight tracks <strong>of</strong> <strong>air</strong>craft landing on any runway in the period from<br />
November 2004 until October 2005 were selected from the database, resulting in a total <strong>of</strong><br />
207,478 approaches. For each approach the flight track was inspected to verify if a missed<br />
approach had occurred. In addition, for each approach the longitudinal separation with the<br />
previous approach on the same runway was determined. Since a missed approach is by<br />
definition executed in the final approach segment, it was sufficient for this study to<br />
determine the separation in the segment from final approach fix (FAF) to runway threshold.<br />
The total number <strong>of</strong> missed approaches found in the dataset is 277. This means that<br />
approximately 1.3 <strong>of</strong> 1000 approaches is aborted. An example <strong>of</strong> a missed approach flight<br />
track is shown in Figure 43.<br />
Y (RDC) [m x 105 Y (RDC) [m x 10 ] 5 ]<br />
4.8<br />
4.7<br />
4.6<br />
4.5<br />
0.9 1.0 1.1 1.2 1.3 1.4 1.5<br />
Figure 43: Flight Track Analysis<br />
X (RDC) [m x 105 X (RDC) [m x 10 ] 5 ]<br />
169
This example concerns an approach from the south to runway 18R that includes a missed<br />
approach. The figure shows the plan view <strong>of</strong> the situation with the <strong>air</strong>port at the top center.<br />
The flight track <strong>of</strong> the approach under consideration is depicted in as a solid line. The tracks<br />
<strong>of</strong> two other <strong>air</strong>craft are also included. The dotted line corresponds to the leading <strong>air</strong>craft<br />
before the missed approach is executed, the dash-dot-dash track corresponds to the leading<br />
<strong>air</strong>craft after the missed approach. In this example the order <strong>of</strong> occurrences is as follows:<br />
First the <strong>air</strong>craft represented by the dotted line conducts the approach, then the <strong>air</strong>craft<br />
represented by the solid line an approach but this is aborted and a missed approach<br />
manoeuvre is conducted and a right hand circuit pattern is flown. While the <strong>air</strong>craft turns to<br />
get lined-up again, the <strong>air</strong>craft represented by the dash-dot-dash line conducts the approach<br />
and lands. Finally, the solid line <strong>air</strong>craft conducts its second approach and lands. The<br />
position <strong>of</strong> the <strong>air</strong>craft at the moment the missed approach is initiated is indicated by the<br />
‘O’ marker. The FAF and runway threshold are denoted by stars.<br />
Analysis <strong>of</strong> all flight tracks resulted in the probability <strong>of</strong> a missed approach for a given<br />
separation distance. The missed approach probability as a function <strong>of</strong> separation distance<br />
that follows from the FANOMOS data is compared in Figure 44 with results from the<br />
missed approach model. The model calculations were made in UniNet, a continuous and<br />
discrete non parametric Bayesian belief net application, functioning as a module <strong>of</strong><br />
UniCorn, a stand-alone uncertainty analysis s<strong>of</strong>tware package. UnitNet was developed by<br />
Delft University <strong>of</strong> Technology to support the CATS project [Cooke et al 2007]. The order<br />
<strong>of</strong> magnitude <strong>of</strong> the probabilities and the shape <strong>of</strong> the curve <strong>of</strong> the model results<br />
corresponds reasonably well with observed results, albeit that the model underestimates the<br />
missed approach probability for very small separation distances. Whether the model results<br />
are an acceptably close approximation <strong>of</strong> the real world will depend on the use <strong>of</strong> the<br />
model.<br />
Missed approach probability<br />
0.03<br />
0.025<br />
0.02<br />
0.015<br />
0.01<br />
0.005<br />
0<br />
UniNet FANOMOS<br />
1 to 2 2 to 3 3 to 4 4 to 5 5 to 6 6 to 7 7 to 8 8 to 9 9 to 10<br />
Separation distance (nm)<br />
Figure 44: Comparison <strong>of</strong> FANOMOS data with model results (UniNet).<br />
170
10.4. Face validity and peer review<br />
Face validity is important to check to quality <strong>of</strong> the model structure. Face validity is<br />
obtained by presenting the model and model results to experts and obtaining their feedback.<br />
Obtaining face validity is essential for the model to be able to be accepted for use. If an<br />
expert considers the model not valid, it is difficult to challenge that opinion, because there<br />
is no alternative way for validation. The only possibility (apart from rejecting the model <strong>of</strong><br />
course) then would be to find an expert with more authority to contradict the first expert,<br />
which is undesirable because <strong>of</strong> the <strong>risk</strong> <strong>of</strong> getting involved in a fruitless discussion on who<br />
is the most authoritative expert.<br />
During the development <strong>of</strong> the CATS model, face validity was obtained during regular<br />
meetings with an ‘expert group’. Importantly, this expert group consisted <strong>of</strong> operational<br />
experts (e.g. pilots) as well as experts in <strong>risk</strong> modelling and human behaviour.<br />
The effect <strong>of</strong> presenting the model to operational experts is that they will always and almost<br />
immediately spot where the model is incorrect, which will lead to the question whether the<br />
model should be rejected or adapted. This is aggravated when the experts are considered<br />
specialists in a particular field. Without proper introduction <strong>of</strong> the purpose <strong>of</strong> the model and<br />
its intended use, the experts will invariably call the model ’too simplistic’. Experts should<br />
be asked to review the model in relation to its intended use. For CATS, the intended use <strong>of</strong><br />
the model was initially not specified, which made it difficult for the experts to provide<br />
comments and for the developers to determine what to do with those comments.<br />
For the FAA causal <strong>risk</strong> model [Roelen et al 2008], face validity was obtained by having<br />
the 33 accident scenarios checked by former employees <strong>of</strong> the National Transportation<br />
Safety Board (NTSB). Principal Inspectors and Operational Research Analysts from the<br />
FAA who are the proposed users <strong>of</strong> the model, were invited during progress meetings and<br />
this provided further face validity <strong>of</strong> the model. The advantage <strong>of</strong> involving future users is<br />
that they are in a much better position to appreciate the assumptions and simplifications in<br />
relation to the intended use <strong>of</strong> the model.<br />
In summary, face validity is essential. It should be obtained from experts with various<br />
backgrounds, including potential future users <strong>of</strong> the model. The intended use <strong>of</strong> the model<br />
should be defined and explained to the experts at the start <strong>of</strong> the process.<br />
10.5. Assumption analysis<br />
During the development and quantification <strong>of</strong> a model, several assumptions are always<br />
adopted. An assumption analysis identifies and analyses all assumptions adopted and<br />
assesses the individual and combined effect <strong>of</strong> these assumptions on the model-based <strong>risk</strong><br />
result. Assumptions are made due to the method selected, due to scoping, or they are<br />
adopted during the modelling, e.g. due to unavailability <strong>of</strong> data or lack <strong>of</strong> time [Everdij &<br />
Blom 2006]. The validity <strong>of</strong> each and every assumption <strong>of</strong> the causal <strong>risk</strong> <strong>models</strong> needs to<br />
be assessed separately. This requires strict discipline <strong>of</strong> the model developers in<br />
meticulously keeping records <strong>of</strong> all the assumptions, including parameter value<br />
assumptions, numerical approximation assumptions, model structure assumptions. During<br />
development <strong>of</strong> the CATS model for instance, parameter value and numerical<br />
approximation assumptions were painstakingly stored in a database called CATSPAWS<br />
(CATS PArameters With Sources). It is imperative to do this during development because<br />
it will be almost impossible to infer assumptions from a completed model. Without an<br />
assumption analysis it is impossible to define the boundaries within which the model is<br />
considered valid for use.<br />
171
10.6. Conclusions for this section<br />
This section discussed four aspects <strong>of</strong> validation:<br />
• Validity <strong>of</strong> the process <strong>of</strong> decomposition (e.g. breakdown into different accident<br />
scenarios) and aggregating the results<br />
• Case validity: comparison <strong>of</strong> behaviour <strong>of</strong> (a section <strong>of</strong>) the model with real world<br />
behaviour<br />
• Face validity and peer review<br />
• Assumption analysis<br />
When the <strong>risk</strong> model is constructed the developers should keep record <strong>of</strong> all assumptions,<br />
including parameter value assumptions, numerical approximation assumptions and model<br />
structure assumptions. Because <strong>of</strong> the expected size and complexity <strong>of</strong> a causal <strong>risk</strong> model<br />
for aviation the four types <strong>of</strong> validation cannot be obtained for the model as a whole.<br />
Instead, the validity <strong>of</strong> parts <strong>of</strong> the model should be checked. This chapter showed some<br />
examples <strong>of</strong> how this could be done. The example on missed approaches showed how, for<br />
specific cases and a specific part <strong>of</strong> the model, comparisons <strong>of</strong> the model results with real<br />
world data are possible. This type <strong>of</strong> validation provides valuable insight but is also labour<br />
intensive. The choice <strong>of</strong> cases should be done carefully, such as to represent the full<br />
spectrum <strong>of</strong> intended model use. Case validity can only be obtained for situations where<br />
data on real world behaviour is available.<br />
Nevertheless, full validation <strong>of</strong> the complete model cannot be obtained. Therefore the<br />
results <strong>of</strong> a causal <strong>risk</strong> model should always be used carefully. For every use it should be<br />
established how the model assumptions could impact the result. The model results should<br />
never be used as the sole source <strong>of</strong> information for decision making. Whenever possible,<br />
alternative sources <strong>of</strong> information should be considered as well.<br />
The added value <strong>of</strong> using the alternative definition <strong>of</strong> validation as described in the<br />
introduction (i.e. validation is a process <strong>of</strong> checking the degree to which the model<br />
provides, for the objective for which it is applied, a correct description <strong>of</strong> the reality that it<br />
represents [AIAA 1998]) could be a topic for future research.<br />
172
Chapter 11. Summary, discussion and conclusions<br />
Affordable and reliable aviation plays a vital role in supporting economic growth and<br />
expanding personal options for where individuals can live, work, travel, and conduct<br />
business. Adequate control <strong>of</strong> aviation <strong>risk</strong> is a necessity, and this requires the availability<br />
<strong>of</strong> a method to determine the level <strong>of</strong> accident <strong>risk</strong> as a function <strong>of</strong> changes to the aviation<br />
system. This method must be methodologically sound. <strong>Causal</strong> <strong>risk</strong> <strong>models</strong> have been<br />
proposed for this purpose. Aviation is possibly well-suited for the application <strong>of</strong> causal <strong>risk</strong><br />
<strong>models</strong>, but research has primarily been focussed on the technical feasibility, without close<br />
consideration <strong>of</strong> the methodological consistency in relation to user requirements. This<br />
thesis has investigated the usefulness <strong>of</strong> causal <strong>risk</strong> <strong>models</strong> for <strong>air</strong> <strong>transport</strong> by analysing<br />
user needs, appropriateness <strong>of</strong> modelling techniques, model structure, quantification<br />
methods and validation.<br />
The main research question <strong>of</strong> this thesis was “What does causal <strong>risk</strong> modelling add to<br />
current safety management approaches, and what are the criteria for ensuring it makes a<br />
successful contribution?”. Several sub-questions were defined to help answer the main<br />
research question. The preceding sections have provided the information to answer the subquestions<br />
and subsequently the main question.<br />
Sub-question 1: What is a proper way to express <strong>risk</strong>?<br />
A decisive characteristic <strong>of</strong> ‘safety’, with important consequences for (the application <strong>of</strong>) a<br />
causal <strong>risk</strong> model is its inherent intangibility. Safety is defined as freedom from<br />
unacceptable <strong>risk</strong>, where <strong>risk</strong> is a combination <strong>of</strong> the probability <strong>of</strong> occurrence <strong>of</strong> harm and<br />
the severity <strong>of</strong> the harm across a defined range <strong>of</strong> scenarios. The acceptability <strong>of</strong> <strong>risk</strong> is<br />
influenced by <strong>risk</strong> perception, which is shaped by many factors, including the level <strong>of</strong><br />
control, the chance <strong>of</strong> multiple fatalities, the time passed since a similar event took place,<br />
whether the exposure to <strong>risk</strong> is voluntary, etc. Policies to control major <strong>risk</strong>s have been in<br />
development from the 1960s onwards. Many <strong>of</strong> these policies are based on some sort <strong>of</strong><br />
quantification <strong>of</strong> the <strong>risk</strong> that could be allowed to continue. Most safety critical industries<br />
apply probabilistic <strong>risk</strong> assessment to quantify the <strong>risk</strong> in their business. Correctly applied,<br />
probabilistic <strong>risk</strong> assessment can be the basis for <strong>risk</strong> informed decision making.<br />
Probabilistic <strong>risk</strong> assessment has only sporadically been applied in the aviation industry,<br />
but it has been suggested that a causal model for aviation safety should be developed and<br />
applied to assess <strong>risk</strong> and to evaluate the effect <strong>of</strong> operational and managerial changes<br />
(decisions, measures, etc.) on the level <strong>of</strong> safety. The need for quantitative safety<br />
assessment methods is explicitly voiced by safety regulators like the FAA, EASA,<br />
Eurocontrol and the Dutch Ministry <strong>of</strong> Transport. The purpose <strong>of</strong> such a model is to reduce<br />
aviation accident <strong>risk</strong> by improving safety management, for instance by identifying those<br />
areas where intervention in the future would be most efficacious<br />
A proper way to express <strong>air</strong>craft crash <strong>risk</strong> for this type <strong>of</strong> objective is accident probability<br />
per flight, using ICAO’s definition <strong>of</strong> an accident. This is an objective metric, not<br />
influenced by the perception <strong>of</strong> <strong>risk</strong>. If deemed necessary it can be used as input for third<br />
party <strong>risk</strong> calculations and it can be objectively compared with a target level <strong>of</strong> safety. The<br />
ICAO terminology defines incidents as precursors to accidents. They can be seen as<br />
173
accident chains in which the ultimate link(s) towards an accident did not occur, a<br />
formulation that is compatible with the accident causation theories <strong>of</strong> Heinrich, Reason and<br />
Rasmussen. The way in which an incident is defined ensures that incident data can be used<br />
to estimate accident probability; this is a necessity for aviation where the accidents are so<br />
rare that even large observed differences need not attain significance. Using incident data<br />
will decrease the uncertainty boundaries <strong>of</strong> the model results.<br />
Sub-question 2: What is a causal relation and which characteristics <strong>of</strong> causal relations are<br />
important for causal <strong>risk</strong> model development?<br />
A causal relation is a formal description <strong>of</strong> the link between cause and effect. Statistical<br />
associations alone are not sufficient to construct a causal relation. There also has to be an<br />
underlying assumption, a causal assumption, which should be based on deeper scientific<br />
knowledge on cause and effect through theoretical studies and accumulated knowledge.<br />
Inferring causal relations requires subject-specific background knowledge. It is therefore<br />
essential for developers <strong>of</strong> a causal model <strong>of</strong> aviation safety to have substantial knowledge<br />
on relevant aspects <strong>of</strong> aviation, including technology, operations, regulation and procedures<br />
for the complete lifecycle. Even then, what is actually the cause <strong>of</strong> an event can be<br />
ambiguous. To a certain extent, it is an assumption that has to be agreed upon by those who<br />
work with it. The agreement is necessary because the assumption has consequences for the<br />
model output. It is therefore required that the underlying assumptions are transparent. Part<br />
<strong>of</strong> the challenges <strong>of</strong> causal relations is also their apparent probabilistic nature. The causal<br />
relations in a <strong>risk</strong> model are generic. We <strong>of</strong>ten arrive at generic causal relations by<br />
generalising from individual cases <strong>of</strong> occurrence and then apply this general knowledge to<br />
other individual occurrences. But evidence <strong>of</strong> a generic causal relationship is not sufficient<br />
to prove a singular causal relationship, and the absence <strong>of</strong> a singular cause effect relation is<br />
not sufficient to negate a generic causal relation. Whereas a causal model can be used for<br />
both forward and backward reasoning, a causal <strong>risk</strong> model for <strong>air</strong> <strong>transport</strong> is most useful<br />
for forward reasoning; predicting the most likely effect, given a cause or a change in the set<br />
<strong>of</strong> causes. The call for more systemic views on accident causation and the underlining <strong>of</strong><br />
the role <strong>of</strong> ‘normal’ occurrences in accident causation emphasise the need for <strong>risk</strong> <strong>models</strong><br />
that go beyond traditional ‘hard wired’ approaches like fault trees and events trees. The<br />
causal <strong>risk</strong> model should be able to represent the seemingly stochastic and evolving nature<br />
<strong>of</strong> the system in relation to its hazards.<br />
Sub question 3: What is a causal <strong>risk</strong> model?<br />
A causal model is a mathematical object that provides an interpretation and computation <strong>of</strong><br />
causal queries about the domain. A causal model can be associated with a directed graph in<br />
which each node corresponds to a variable in the model and the arrows point from the<br />
variables that have direct influence to each <strong>of</strong> the other variables that they influence. The<br />
causal <strong>risk</strong> <strong>models</strong> addressed in this thesis are <strong>models</strong> for forward reasoning and are used to<br />
predict the effect <strong>of</strong> changes in the aviation system on <strong>air</strong>craft accident <strong>risk</strong>.<br />
Sub question 4: What are the needs <strong>of</strong> users?<br />
The main drivers for aviation safety improvement have been technological development<br />
and the industry’s practice <strong>of</strong> thorough accident investigation and subsequent remedial<br />
actions. Because <strong>of</strong> the high level <strong>of</strong> safety, the latter approach is no longer effective and<br />
there is a need for a new safety performance evaluation methodology, <strong>of</strong> which a causal<br />
<strong>risk</strong> model could be a central part. The increased integration, automation and complexity <strong>of</strong><br />
the aviation system, including integration <strong>of</strong> ground-based and <strong>air</strong>borne systems, will lead<br />
to new regulatory requirements for safety. The complexity <strong>of</strong> the matter will restrain<br />
authorities from specifying detailed requirements. Instead, quantitative target levels <strong>of</strong><br />
174
safety will be specified. Quantitative safety assessment methods such as causal <strong>risk</strong> <strong>models</strong><br />
will have to be applied to demonstrate to the authorities that the requirements have been<br />
met. There is a growing awareness <strong>of</strong> the need to apply a total systems approach in safety<br />
assessments, considering the complete aviation system rather than the individual<br />
components. Because the human operators (pilot, <strong>air</strong> traffic controller) play a decisive role<br />
in the aviation system, these quantitative safety assessment methods must be able to<br />
satisfactorily represent the human operators.<br />
The potential users <strong>of</strong> a causal <strong>risk</strong> model are <strong>air</strong>lines, <strong>air</strong> navigation service providers,<br />
<strong>air</strong>port organisations, maintenance and rep<strong>air</strong> organisations, <strong>air</strong>craft manufactures, the<br />
central government and the aviation inspectorate.<br />
This need for quantitative safety assessment methods is explicitly voiced by safety<br />
regulators. FAA, EASA, Eurocontrol and the Dutch Ministry <strong>of</strong> Transport have all<br />
expressed the need for a <strong>risk</strong> assessment method. There are differences though. The FAA<br />
calls for the development <strong>of</strong> a method for a probabilistic evaluation <strong>of</strong> <strong>risk</strong> associated with<br />
hazards in the area <strong>of</strong> operational functions and procedures, if possible extended with<br />
hazards and <strong>risk</strong> in other areas <strong>of</strong> the aviation system such as <strong>air</strong>craft and equipment<br />
malfunctions, hazards due to organisational set-up, human errors, environmental hazards<br />
(wind, turbulence, terrain) and contributory hazards (regulatory, economy). A specific<br />
requirement is to have a top-level representation as the user interface for performing <strong>risk</strong><br />
analysis. The European regulator EASA is specifically looking for a methodology to<br />
quantify the safety effects <strong>of</strong> proposed regulatory changes in terms <strong>of</strong> accident probability<br />
and severity. The Dutch Ministry <strong>of</strong> Transport and Water Management also sees a role for<br />
causal <strong>risk</strong> <strong>models</strong> in the regulation <strong>of</strong> third party <strong>risk</strong>. Furthermore, the Ministry believes<br />
that a causal <strong>risk</strong> model can be used for communication with citizens, to provide insight in<br />
how various components interact and influence aviation safety. Eurocontrol has mandated<br />
the use <strong>of</strong> quantitative safety assessments <strong>of</strong> significant changes in the ATM system to<br />
demonstrate that the probability <strong>of</strong> ATM directly contributing to accidents is less than 1.55<br />
x 10 -8 per flight hour. Eurocontrol also emphasises the development <strong>of</strong> safety monitoring<br />
and data collection mechanisms. The rationale is that any model used in <strong>risk</strong> assessment<br />
must be validated, and real data could contribute significantly to this validation process.<br />
The different views by the regulators on the use <strong>of</strong> a causal <strong>risk</strong> model are not fully<br />
compatible. Particularly the requirement to use a causal <strong>risk</strong> model for communication with<br />
citizens is incompatible with the other requirements.<br />
The industry (<strong>air</strong>craft manufacturers, <strong>air</strong>lines, ANSPs, <strong>air</strong>ports) has not explicitly expressed<br />
a need for a causal <strong>risk</strong> model. That does not mean that such a model could not be useful<br />
for them. A feature that would make such <strong>models</strong> attractive for them is the ability to<br />
perform cost benefit analysis. Some <strong>of</strong> potential industry applications may require very<br />
detailed <strong>models</strong> however, for instance that describe the <strong>air</strong>craft down to component level.<br />
Detailed user requirements were defined (see chapter 4) which can be grouped under the<br />
following high level headings: The model must be integrated, meaning that it represents the<br />
complexity <strong>of</strong> the complete aviation system and its many interdependencies and explicitly<br />
includes human operators and represents managerial influences. It should produce<br />
quantitative results to demonstrate to authorities that quantitative requirements have been<br />
met. The model structure representation and the model development process should be<br />
transparent and clear to provide insight and for communication purposes. The model<br />
should be validated and turn out reproducible results, this is particularly required if the<br />
175
esults are being used in a certification process. Finally, the model should be able to<br />
represent current and future accident scenarios.<br />
Requirements that cannot be met at present are the requirement to capture very specific<br />
information and the requirement to represent the influence <strong>of</strong> regulations.<br />
User requirements demand a quantitative and transparent causal <strong>risk</strong> model that should be<br />
able to represent environmental and managerial influences. The results <strong>of</strong> the model should<br />
be reliable, and the model should be useable to indicate possible solution areas for further<br />
safety improvement. The variety <strong>of</strong> users and diversity in the users’ questions make it<br />
impossible to develop a causal <strong>risk</strong> model that is capable <strong>of</strong> answering all needs<br />
simultaneously. The requirements call for a system-wide representation <strong>of</strong> <strong>air</strong> <strong>transport</strong>.<br />
Such a model is not suitable to answer very specific questions. This limitation should be<br />
explained to the aviation community to avoid the creation <strong>of</strong> false expectations.<br />
Due to the diversity <strong>of</strong> possible users and the limited view they currently have on the use <strong>of</strong><br />
causal <strong>risk</strong>s <strong>models</strong>, significant work remains to be done on the systematic identification <strong>of</strong><br />
user needs. Feedback from the modellers to the potential users is required to get a better<br />
grip on user requirements. It should also be verified, for each kind <strong>of</strong> user, that the causal<br />
<strong>risk</strong> model definition as adopted in this thesis, is suitable for them. Because users are not<br />
good at imagining what a causal model could do they are not good at articulating uses and<br />
needs for it. Therefore, the modellers should indicate possibilities and limitations <strong>of</strong> the<br />
model, and should come-up with real-life examples <strong>of</strong> cases in which a causal <strong>risk</strong> model<br />
would be a helpful tool. This will have to be an iterative process. Support from the industry<br />
is essential for the provision <strong>of</strong> data and to provide insight, to the model developers, into<br />
operational aviation processes.<br />
Sub-question 5: What are currently drivers for aviation safety improvement and what could<br />
be the role <strong>of</strong> a causal <strong>risk</strong> model in the process <strong>of</strong> aviation safety improvement?<br />
Aviation has realised tremendous safety improvements since the first commercial <strong>air</strong>lines<br />
started operations. The drivers for safety improvements have been primarily catastrophic<br />
accidents, regulation, technological advances and liability. Systematic analysis <strong>of</strong> accidents<br />
and subsequent remedial action (‘fix and fly’) is the natural evolutionary way <strong>of</strong><br />
improvement and leads to spectacular advances when technology is still immature.<br />
However, when the technology matures the rate <strong>of</strong> improvement reduces until a level<br />
plateau has been reached; this phenomenon is well known in reliability engineering and is<br />
<strong>of</strong>ten represented as the first part <strong>of</strong> the bathtub curve, also referred to as infant mortality.<br />
The maturity <strong>of</strong> aviation causes this driver to become more and more ineffective.<br />
Technological advances have been focussing on improving reliability <strong>of</strong> <strong>air</strong>craft as a<br />
necessity to be more pr<strong>of</strong>itable and this has naturally improved safety as well. However,<br />
currently the biggest challenge is not <strong>air</strong>craft reliability but efficiency, and technological<br />
development is aimed at improving that. But what is good for efficiency is not always good<br />
for safety. Regulation traditionally has a role <strong>of</strong> safeguarding minimum safety levels but it<br />
follows safety developments rather than initiating them and regulation is aimed at specific<br />
disciplines rather than the integrated system. Liability issues are perhaps currently the<br />
strongest drivers for aviation safety improvement, especially since some highly visible<br />
cases have involved personal accusations <strong>of</strong> manslaughter (e.g. the Überlingen mid<strong>air</strong><br />
collision and the Milan Malpensa runway collision). But this can also be very<br />
counterproductive, when known safety problems are hidden and incident reporting systems<br />
stop working because <strong>of</strong> fear <strong>of</strong> liability claims.<br />
176
The <strong>air</strong> <strong>transport</strong> industry is <strong>of</strong>ten driven by the need <strong>of</strong> capacity increase on one hand<br />
whereas it is not clear how to do so without jeopardizing safety criteria. To maintain and<br />
improve the current level <strong>of</strong> safety, there is need for an aviation safety performance<br />
evaluation methodology that is not based on fatal accidents and hull losses alone. While<br />
accidents are rare events, the consequences <strong>of</strong> an accident can be enormous for the <strong>air</strong>line,<br />
the <strong>air</strong>craft manufacturer, the <strong>air</strong> navigation service provider and society. Society is<br />
becoming less tolerant towards accidents. Accident prevention is therefore as important as<br />
ever, but due to the rarity <strong>of</strong> accidents it becomes more and more difficult to understand the<br />
‘current state <strong>of</strong> aff<strong>air</strong>s’; there are simply too few ‘data points’. Feedback <strong>of</strong> lessons learned<br />
is frustrated by a tendency towards criminal prosecution <strong>of</strong> those involved in accidents and<br />
incidents. As a complicating factor, the aviation system is characterised by a multifarious<br />
arrangement <strong>of</strong> organisations and activities. It is a distributed system with many different<br />
players. Each discipline in the aviation industry has its own process for managing safety<br />
and regulation is aimed at specific disciplines rather than targeting the integrated system.<br />
The lack <strong>of</strong> an integrated approach is worrisome as the breakdown <strong>of</strong> the communication<br />
paths between the members <strong>of</strong> the aviation industry is <strong>of</strong>ten causal or contributory to<br />
accidents and incidents. The aviation industry cannot afford to resign itself to the current<br />
situation as environmental and economical pressures will then slowly but surely force the<br />
level <strong>of</strong> safety down. Aviation is a competitive environment, and the investments are <strong>of</strong>ten<br />
huge. Any proposed safety improvement measure must be well-reasoned. Therefore an<br />
integrated safety assessment methodology is needed. A causal <strong>risk</strong> model could potentially<br />
provide an accurate estimate <strong>of</strong> the actual accident probability and simultaneously indicate<br />
the relative contribution to <strong>risk</strong> <strong>of</strong> each <strong>of</strong> the different actors, processes and <strong>risk</strong> control<br />
measures within the aviation system. This will then allow the choice <strong>of</strong> adjustments to the<br />
system which are most effective in improving safety. It will also provide solid arguments to<br />
safety managers for standing up against decisions to change the system which are<br />
motivated by environmental and economic grounds but are counter-productive for safety.<br />
Sub question 6: What are shortcomings <strong>of</strong> the current methods for aviation safety analysis?<br />
Although causal <strong>risk</strong> <strong>models</strong> for aviation that represent the complexity <strong>of</strong> the complete<br />
aviation system and its interdependencies including human operators and organisations<br />
have not yet been developed and applied, safety analyses are frequently conducted in the<br />
aviation industry. Generally speaking there is no standardized or prescribed procedure for<br />
conducting safety analyses for <strong>air</strong> <strong>transport</strong>. Selection <strong>of</strong> the safety analysis methodology<br />
for a specific problem depends on the scope <strong>of</strong> the safety question, the type <strong>of</strong> operation,<br />
the level <strong>of</strong> involvement <strong>of</strong> the customer, the domain knowledge <strong>of</strong> the customer and the<br />
usage <strong>of</strong> the results. While the currently used methods <strong>of</strong>ten follow similar steps, they differ<br />
in the details. One <strong>of</strong> the consequences is that quite frequently safety analyses start with an<br />
activity that has already been performed earlier, albeit slightly differently. Activities such<br />
as hazard identification and accident scenario development are repeatedly done, without<br />
taking full advantage <strong>of</strong> the results and lessons learned from previous studies. Data<br />
collection is also an activity that sometimes requires a significant effort. Often data is not<br />
available or there are insufficient resources for a dedicated data collection campaign. Many<br />
safety analyses therefore rely heavily on experts, or more precisely, on the black boxes<br />
inside the expert’s heads, for hazard identification, accident scenario development and<br />
quantification. Each expert will have his own ‘model <strong>of</strong> the world’ which is used to come<br />
to certain conclusions. These <strong>models</strong> have not been made explicit, and criteria for experts<br />
have not existed. In aviation safety analyses, selected experts are <strong>of</strong>ten people with (ample)<br />
operational experience, such as pilots and <strong>air</strong> traffic controllers. Analytical skills and ability<br />
to provide judgement on future operations are only rarely taken into consideration. Experts<br />
177
are not ‘calibrated’. These aspects have a negative effect on the transparency and<br />
reproducibility <strong>of</strong> model results.<br />
Air traffic management and <strong>air</strong>ports are, in comparison with <strong>air</strong>craft design, operation and<br />
maintenance, far less regulated in the form <strong>of</strong> detailed requirements for specific <strong>risk</strong> control<br />
means. Air navigation service providers and <strong>air</strong>port authorities are relatively free in<br />
developing infrastructure, procedures, etc., that fulfil their specific needs. However, they<br />
still need to demonstrate that all applicable target levels <strong>of</strong> safety are met. As a result, there<br />
is a growing need for support in conducting <strong>risk</strong> assessments in the field <strong>of</strong> ATM and<br />
<strong>air</strong>ports. In <strong>air</strong>craft design, operation and maintenance, there is less freedom due to more<br />
detailed regulations.<br />
Current methods for safety analysis are not unified, resulting in unnecessary duplication <strong>of</strong><br />
work and possibly diverse outcomes, undermining the credibility <strong>of</strong> the analyses. None <strong>of</strong><br />
the currently available methods for safety analysis and assessment fulfils the main<br />
requirements: ability to analyse the whole integrated system including dependencies,<br />
reproducibility <strong>of</strong> results, transparency, ability to provide quantitative results and ability to<br />
represent current as well as future accident scenarios. An effort to develop a method that<br />
will meet these criteria therefore seems fully justified.<br />
Sub question 7: What can be learned from other industries?<br />
The way in which probabilistic <strong>risk</strong> <strong>models</strong> were introduced in the nuclear power industry,<br />
manned spaceflight, and the oil and gas industry followed a similar pattern. Traditionally,<br />
<strong>risk</strong> assessment methods were deterministic and qualitative. Probabilistic <strong>risk</strong> analysis<br />
methods were occasionally applied but were not seen by everyone as an improvement over<br />
the traditional methods. Lack <strong>of</strong> data to populate the <strong>models</strong>, lack <strong>of</strong> transparency and<br />
failure to adequately represent human and organisational performance were mentioned as<br />
weak points. However, almost within a single decade several major accidents 87 resulted in<br />
regulatory changes that forced the introduction <strong>of</strong> probabilistic <strong>risk</strong> <strong>models</strong> for system-wide<br />
analysis. Even then it was a slow process, and it took a long time to develop methods and<br />
<strong>models</strong> that are considered acceptable. It is recognised that these methods should not be<br />
used as a substitute for the traditional approaches, but as a complement. The combination <strong>of</strong><br />
qualitative, deterministic and quantitative probabilistic methods allows <strong>risk</strong>-informed<br />
regulation and decision-making. Yet there is still sometimes resistance, when people<br />
believe that the money spent in quantitative safety analysis could be better invested in<br />
improving the system directly. Because <strong>of</strong> the many assumptions that have to be made in<br />
the <strong>models</strong>, the results <strong>of</strong> the analyses are at times considered to be too subjective to be<br />
used for decision support. It is only when people realise that there are no alternatives, that<br />
current decision making is even more subjective, and that complex integrated systems<br />
require systematic and consistent analysis, that people appreciate the value <strong>of</strong> causal <strong>risk</strong><br />
<strong>models</strong>. Prescription <strong>of</strong> a unified method for <strong>risk</strong> assessment, as is the case in the<br />
Netherlands for sites involving flammable or toxic substances, leads to less variability in<br />
the outcomes and better acceptance <strong>of</strong> model outcomes. Based on these experiences it can<br />
be expected that introduction <strong>of</strong> causal <strong>risk</strong> <strong>models</strong> in <strong>air</strong> <strong>transport</strong> will be similarly jerkily<br />
and it could take decades before the industry has fully accepted the use <strong>of</strong> quantitative <strong>risk</strong><br />
<strong>models</strong>. Data to populate the model, transparency <strong>of</strong> the <strong>models</strong> and the representation <strong>of</strong><br />
87 The Seveso calamity (1976) in the process industry, the Three Mile Island accident<br />
(1979) in the nuclear power industry, the Challenger explosion (1986) in manned<br />
spaceflight and the Piper Alpha disaster (1988) in the oil and gas industry.<br />
178
human and organisational influences are important to promote and support the<br />
development. It is also essential to state from the outset that the <strong>models</strong> should be used as a<br />
complement rather than as a replacement <strong>of</strong> current practice. The use <strong>of</strong> diagnostic <strong>models</strong><br />
in the health care industry demonstrates that such <strong>models</strong> are indeed suitable instruments<br />
for communication on probabilistic relationships and to provide a coherent representation<br />
<strong>of</strong> domain knowledge under uncertainty.<br />
Sub-question 8: Which modelling techniques are most appropriate?<br />
A causal <strong>risk</strong> model can be regarded as being composed <strong>of</strong> a representation scheme and a<br />
computational engine. The representation scheme is the interface between the<br />
computational engine and the user <strong>of</strong> the model and is the primary means <strong>of</strong><br />
communicating the model to the outside world. Many people will regard the representation<br />
scheme as ‘the model’. The representation scheme must therefore be comprehensive, and<br />
most importantly, transparent. A scheme is transparent when a simple set <strong>of</strong> rules and<br />
symbols applies and when it is intuitive. Simplicity <strong>of</strong> the representation scheme can also<br />
be achieved by a (physical, functional, or other) decomposition. Whenever a decomposition<br />
is made, a mechanism must be in place to keep track <strong>of</strong> possible dependencies between<br />
components.<br />
Modelling methods with a very simple set <strong>of</strong> rules and symbols are tree-like structures such<br />
as fault trees and event trees. They are therefore ideally suited to provide the top layer <strong>of</strong><br />
the representation scheme, the level that is used most directly by the user. However, beyond<br />
a few levels <strong>of</strong> the trees, the events are strongly influenced by many to many influences <strong>of</strong><br />
common mode factors, particularly related to management. Since the assumption in fault<br />
tree logic is that all events are independent events, the model must be linked at this level<br />
with another type <strong>of</strong> model. Bayesian Belief Nets are a suitable candidate as they can<br />
capture dependencies and s<strong>of</strong>t interactions among component behaviour. The graphical<br />
representation <strong>of</strong> a Bayesian Belief Net is still intuitive, although the rules are more<br />
complex than those <strong>of</strong> a fault tree. A BBN is therefore less transparent. When dynamic<br />
interactions between components are important it becomes necessary to shift to another<br />
type <strong>of</strong> modelling technique such as Petri Nets in combination with Monte Carlo<br />
simulation.<br />
The degree <strong>of</strong> detail and sophistication <strong>of</strong> the model representation must be decided upon<br />
based on the purpose <strong>of</strong> the model and the performance that is required by the<br />
computational engine. If the computational engine must be able to handle<br />
interdependencies and dynamic behaviour, a simplified representation <strong>of</strong> the model via a<br />
user interface is required to obtain transparency.<br />
Even though a causal <strong>risk</strong> model is a mathematical object, developing a causal <strong>risk</strong> model is<br />
not primarily a mathematical problem. Examples show that proper mathematical techniques<br />
are available and the required computer power is not excessive. Developing a causal <strong>risk</strong><br />
model <strong>of</strong> the <strong>air</strong> <strong>transport</strong> system is much more a problem <strong>of</strong> assembling all available<br />
knowledge and data on a very large and complex system and unravelling this complexity<br />
into cause-effect relations that can be assembled in a model and representing this<br />
information in a useful way.<br />
The development <strong>of</strong> a causal <strong>risk</strong> model for aviation should be guided by questions and<br />
functional requirements from the users <strong>of</strong> the model. The model developers should use<br />
techniques, develop (mathematical) solutions, and go to the level <strong>of</strong> detail that fits the user<br />
179
equirements. The degree to which dynamic modelling is necessary will require careful<br />
consideration and will depend on the type <strong>of</strong> user and type <strong>of</strong> application <strong>of</strong> the model.<br />
Sub question 9: How should a causal model be quantified, what numerical accuracy is<br />
required and how can that be obtained?<br />
Quantification <strong>of</strong> the probability <strong>of</strong> occurrence <strong>of</strong> variables and the conditional probabilities<br />
in the causal <strong>risk</strong> model is done by using existing data or by expert opinion. Often different<br />
sources <strong>of</strong> data will need to be combined. It is therefore extremely important to ascertain<br />
that the same variable descriptions and units <strong>of</strong> measurement are used. The use <strong>of</strong> standard<br />
units is preferred, but sometimes it is impossible or impractical to apply a standard<br />
quantitative unit <strong>of</strong> measurement and a qualitative rating scale must be used, or a proxy<br />
variable that is closely related to the variable <strong>of</strong> interest and which can be quantified must<br />
be found. One <strong>of</strong> the main difficulties in developing a causal <strong>risk</strong> model for aviation lies in<br />
the need to express ‘s<strong>of</strong>t’ factors in objectively quantifiable units. Proper units for e.g. the<br />
quality <strong>of</strong> procedures, commitment <strong>of</strong> personnel, safety culture or non-technical skills <strong>of</strong><br />
pilots do not yet exist. Proxy variables are also difficult to find as many <strong>of</strong> these s<strong>of</strong>t factors<br />
are multidimensional. Less well defined quantities and units <strong>of</strong> measurement must be used<br />
at the <strong>risk</strong> <strong>of</strong> adding variability to the model and increased uncertainty <strong>of</strong> the model results.<br />
The credibility <strong>of</strong> the whole causal <strong>risk</strong> model depends on the quality <strong>of</strong> the model structure<br />
and on the sources <strong>of</strong> the numerical data to be used and the confidence that one can have in<br />
the figures. The accident investigation report is without doubt the single most complete and<br />
accurate source <strong>of</strong> information regarding an accident. Due to the low frequency <strong>of</strong> major<br />
accidents the investigation reports are not sufficient to populate all parts <strong>of</strong> the causal <strong>risk</strong><br />
model. Other sources <strong>of</strong> information are required to complete quantification <strong>of</strong> the model.<br />
Incident reporting systems capture vast amounts <strong>of</strong> data with relatively little effort, but<br />
during the coding process information may get lost or be incorrectly classified. Voluntary<br />
incident reporting systems are not very well suited to conduct a statistical analysis or to<br />
provide quantitative data to the causal <strong>risk</strong> model. In-flight recorded data is the most<br />
accurate and detailed data, suited to quantify large pieces <strong>of</strong> the causal <strong>risk</strong> model.<br />
Unfortunately for model developers these data are <strong>of</strong>ten company confidential because <strong>of</strong><br />
the competition and liability issues. Nevertheless, experience has shown that <strong>air</strong>lines are<br />
sometimes quite willing to share data, provided that certain conditions are met. But incident<br />
reporting systems and in-flight recorded data are usually rather weak in capturing data on<br />
human performance and managerial influences. Empirical data can sometimes be used to<br />
fill this gap. Applying the data may require some flexibility and creativity from the causal<br />
model developers because the empirical studies may provide data on parameters that are<br />
defined slightly differently than those in the model. Unfortunately there are hardly any<br />
usable empirical studies on organisational influences. The only alternative is expert<br />
judgement. The experts should preferably combine analytical skills and the ability to<br />
provide judgement on unknown (e.g. future) operations. If systematically elicited from<br />
experts who are both knowledgeable and well-calibrated for the relevant area <strong>of</strong> expertise,<br />
expert judgement can <strong>of</strong>fer quite acceptable accuracy <strong>of</strong> quantification. The drawbacks <strong>of</strong><br />
the use <strong>of</strong> expert judgement are primarily practical issues: finding proper experts is not<br />
always easy and expert elicitation can be a time consuming activity.<br />
Quantification <strong>of</strong> the occurrence rate <strong>of</strong> events also requires denominator data. Due to the<br />
large number <strong>of</strong> variables and combinations <strong>of</strong> variables, collection and analysis <strong>of</strong><br />
denominator data is more than simply counting the number <strong>of</strong> flights but requires<br />
combining the information from several different data sources. In-flight recorded data is<br />
potentially a significant source for denominator data, but currently the focus there is<br />
180
primarily on parameter threshold crossings. Non-event data is usually discarded, although<br />
there are some initiatives to conduct flight data analysis <strong>of</strong> full datasets including normal as<br />
well as parameter threshold crossing data.<br />
For all quantitative data in the model the levels <strong>of</strong> uncertainty <strong>of</strong> the <strong>models</strong> are as equally<br />
important as point estimates <strong>of</strong> parameter values. Confidence intervals for expert judgement<br />
results require special attention. They should be regarded as ‘levels <strong>of</strong> belief or confidence’<br />
instead <strong>of</strong> 95% confidence levels in the strict mathematical sense. To get a proper picture <strong>of</strong><br />
the uncertainty <strong>of</strong> the results <strong>of</strong> a causal <strong>risk</strong> model it is necessary to conduct a thorough<br />
identification and analysis <strong>of</strong> all assumptions adopted, including assumptions on parameter<br />
values used, and assess the individual and combined effect <strong>of</strong> these assumptions on the<br />
model results.<br />
Sub question 10: What are, from a modelling point <strong>of</strong> view, the biggest bottlenecks?<br />
Because there is greater variability and interdependence in human performance than in<br />
hardware performance, specific human performance <strong>models</strong> must be developed.<br />
Representation <strong>of</strong> human reliability in <strong>risk</strong> <strong>models</strong> has always been one <strong>of</strong> the major<br />
hurdles. The classical approach in human error quantification is to use basic error<br />
probabilities for specific tasks and to modify those to account for specific circumstances or<br />
contexts. This approach is not good at supporting the identification <strong>of</strong> errors <strong>of</strong> commission<br />
and assumes that the performance shaping factors are independent, which is not a very<br />
reasonable assumption. Some <strong>of</strong> these limitations can be overcome by representing the<br />
influence <strong>of</strong> the context in an influence diagram. It is also proposed to use the associated<br />
event in e.g. the fault tree (or any other type <strong>of</strong> model representation that is used), into<br />
which the human performance model ties, to estimate the basic human error probability<br />
instead <strong>of</strong> deriving this from a task analysis as is the case in first generation human<br />
performance methods. Mapping <strong>of</strong> accident and incident data on those fault trees will<br />
ensure that both errors <strong>of</strong> omission as well as errors <strong>of</strong> commission will be captured in the<br />
model. Whether this approach is indeed suitable for analysis <strong>of</strong> errors <strong>of</strong> commission is still<br />
open however and needs solving. If the influence <strong>of</strong> management is described by means <strong>of</strong><br />
‘delivery systems’, these provide a convenient framework for selecting appropriate<br />
performance shaping factors and linking management influences and human error<br />
probability.<br />
A second bottleneck is representation <strong>of</strong> managerial influences. There is a requirement for<br />
the causal <strong>risk</strong> model to be able to represent the effect <strong>of</strong> managerial influences on safety,<br />
but this is not a straightforward task because the influence <strong>of</strong> management is always via the<br />
failure events at the operational level. Therefore a link must be found between the<br />
managerial system and the description <strong>of</strong> the failure events at the operational level. A<br />
possible solution is that <strong>of</strong> combining the generic delivery systems, to describe the<br />
provision by management <strong>of</strong> the resources and criteria for the frontline workforce to<br />
operate safely, with the concept <strong>of</strong> a safety envelope. Risk control measures ensure that the<br />
organisation stays within that safe envelope. Safety management is then considered a<br />
control function aimed at maintaining a particular operational process within the boundaries<br />
<strong>of</strong> safe operation. This requires a meeting point <strong>of</strong> two model types that are inherently<br />
different; failure events at the operational level are traditionally described as specific<br />
accident scenarios, while management is seen as a control function, which logically results<br />
in attempts to apply control theory as a modelling approach for safety management.<br />
Linking the generic control <strong>models</strong>, with their dynamic feedback loops, to the static<br />
accident scenarios has proven to be difficult. Therefore it is, at least for the moment, better<br />
to use ‘simple’ static representation techniques for modelling managerial influences, even if<br />
181
this may seem to be an oversimplification. In fact, the same simplification is used by<br />
representing the actions <strong>of</strong> the front line human operators (pilots, <strong>air</strong> traffic controller,<br />
maintenance technicians) by linear static <strong>models</strong> rather than by dynamic control <strong>models</strong><br />
incorporating feedback loops.<br />
The third bottleneck is the dependence between model elements. There are potentially<br />
many to many interactions between individual model elements and if we were to represent<br />
them all we would end up with an excessive development and assessment burden and a<br />
model that looks like a giant h<strong>air</strong>ball which is not very transparent. It is necessary to find a<br />
proper balance between model completeness and practical feasibility. The proposed way <strong>of</strong><br />
doing this is by developing the model from the generic to the specific, starting at the<br />
highest level <strong>of</strong> abstraction and introducing additional detail step-by-step. This can be done<br />
systematically if the model is hierarchical, with separate and formally defined levels <strong>of</strong><br />
abstraction and if accidents are not completely random combinations <strong>of</strong> random events. A<br />
review <strong>of</strong> <strong>air</strong>craft accidents shows that indeed accident event sequences are <strong>of</strong>ten very<br />
similar, even in cases where human error plays an important part in the accident sequence.<br />
As a matter <strong>of</strong> fact, almost all accidents <strong>of</strong> the last 30 years or so can be mapped onto a set<br />
<strong>of</strong> 33 archetype accidents. These archetypes provide a suitable backbone for a causal <strong>risk</strong><br />
model. The advantage <strong>of</strong> the use <strong>of</strong> accident archetypes is that it is a data driven approach<br />
which results in realistic scenarios. It easily captures the most frequent accidents which<br />
means that it quickly focuses on those elements which are most relevant for flight safety.<br />
The accident archetypes create a top level model that is intuitively transparent. By using<br />
generic accident scenarios as the backbone <strong>of</strong> a causal <strong>risk</strong> model the model structure is<br />
explicitly based on observations in practice, rather than a theoretical approach such as<br />
structural decomposition or functional abstraction. An advantage <strong>of</strong> this approach is the<br />
ability to simultaneously capture technical malfunctions, human behaviour and managerial<br />
influences without being confined by a theoretical modelling construct. On the down side,<br />
this practical approach is predominantly based on observations from the past and ‘new’<br />
accidents are not necessarily captured.<br />
Sub question 11: How should the validity <strong>of</strong> the model be demonstrated?<br />
Full validation <strong>of</strong> a complete causal <strong>risk</strong> model <strong>of</strong> <strong>air</strong> <strong>transport</strong> is not possible because<br />
model results cannot be compared with a continuous observation <strong>of</strong> an unaltered system;<br />
the time period involved in observing reality until sufficient events have accumulated<br />
makes real life observations impractical and creating these events on purpose is unethical.<br />
Therefore alternative methods for demonstrating the ‘validity’ <strong>of</strong> the model must be<br />
pursued. Individual segments <strong>of</strong> the model with directly observable outputs will have to be<br />
validated, and pro<strong>of</strong> must be provided that the overall process for combining these<br />
segments into a single model, including the possible interactions between various segments,<br />
is sufficiently correct for the objective(s) under consideration. When the <strong>risk</strong> model is<br />
constructed the developers should keep record <strong>of</strong> all assumptions, including parameter<br />
value assumptions, numerical approximation assumptions and model structure assumptions.<br />
It is imperative to do this during development because it will be almost impossible to infer<br />
assumptions from a completed model. Assumption analysis should be part <strong>of</strong> the validation<br />
process, and face validity should also be obtained. Nevertheless, full validation <strong>of</strong> the<br />
complete model cannot be obtained. Therefore the results <strong>of</strong> a causal <strong>risk</strong> model should<br />
always be used carefully. For every use it should be established how the model assumptions<br />
could impact the result. The model results should never be used as the sole source <strong>of</strong><br />
information for decision making. Whenever possible, alternative sources <strong>of</strong> information<br />
should be considered as well. The added value <strong>of</strong> using a different approach to validation,<br />
182
which emphasizes on evaluating what the difference between model and reality means in<br />
terms <strong>of</strong> the model output, could be a topic for future research.<br />
183
Main research question: What does causal <strong>risk</strong> modelling add to current safety management<br />
approaches, and what are the criteria for ensuring it makes a successful contribution?<br />
Current drivers for safety improvement fall short to bring about further safety<br />
improvements. Because accidents are very rare, the industry’s practice <strong>of</strong> thorough accident<br />
investigation and subsequent remedial action is no longer sufficient. A causal <strong>risk</strong> model<br />
can be used to assemble available knowledge and data <strong>of</strong> the <strong>air</strong> <strong>transport</strong> system to identify<br />
weaknesses in the system before they result in accidents or incidents. This systemic and<br />
pro-active approach would be an addition to current safety management approaches which<br />
are ad-hoc and reactive.<br />
A method for safety assessment and safety analysis is required that is not solely based on<br />
accident frequencies, provides a quantified accident probability and is able to properly<br />
represent the complex arrangements within the <strong>air</strong> <strong>transport</strong> system, including human and<br />
organisational influences. The method should be transparent and yield reproducible and<br />
demonstrable valid results. Using a causal <strong>risk</strong> model as described in this thesis is able to<br />
meet those requirements and therefore is a method to identify possibilities for safety<br />
improvements that cannot be obtained with a reactive response to accidents.<br />
Each and every day decisions are taken that potentially have an influence on <strong>air</strong> <strong>transport</strong><br />
safety. Often these decisions involve a consideration <strong>of</strong> safety against economic or<br />
environmental aspects. Safety analyses are conducted to help in making those decisions but<br />
the current methods used in those analyses fail to meet important requirements <strong>of</strong><br />
transparency, reproducibility, quantification and the ability to consider the integrated <strong>air</strong><br />
<strong>transport</strong> system rather than a part <strong>of</strong> it. A causal <strong>risk</strong> model can meet those requirements.<br />
Developing such a causal <strong>risk</strong> model is not a problem <strong>of</strong> mathematics; the tools for<br />
calculation and representation <strong>of</strong> the model are mathematically relatively simple and welldeveloped.<br />
The classical problems <strong>of</strong> <strong>risk</strong> modelling, i.e. representation <strong>of</strong> human operators<br />
and managerial influences present significant challenges but they are not insurmountable.<br />
The real problem is not so much describing those influences but more their quantification.<br />
A third dilemma that is <strong>of</strong>ten mentioned, the lack <strong>of</strong> data, is not as problematic in aviation<br />
as in other industries. The aviation industry has always been strong in data collection. This<br />
has not been limited to system reliability data but has been expanded to data on human<br />
performance and managerial influences. There is an industry-wide standard for accident<br />
and incident data collection (ADREP/ECCAIRS) which, while not perfect, provides a solid<br />
basis for quantification. In combination with FDR data and LOSA results (both <strong>of</strong> which<br />
are also standardised) this will help the proper representation <strong>of</strong> human and managerial<br />
influences. By using accident archetypes as the backbone <strong>of</strong> the model and top level<br />
representation and further development <strong>of</strong> the model from the generic to the specific with<br />
separate and formally defined levels <strong>of</strong> abstraction the seeming infinity <strong>of</strong><br />
interdependencies can be taken care <strong>of</strong>. Even though 100% representation <strong>of</strong> all<br />
dependencies cannot be obtained, this approach will result in a practicable and useable<br />
model and helps avoiding being bogged down in development difficulties. In summary,<br />
developing a causal <strong>risk</strong> model for aviation is not overly difficult; it is just a lot <strong>of</strong> work.<br />
And the majority <strong>of</strong> this work will have to be conducted by people with sufficient<br />
background knowledge <strong>of</strong> <strong>air</strong> <strong>transport</strong>, because behind each causal conclusion there must<br />
be a known mechanism. Inferring causal relations requires subject specific background<br />
knowledge. Without a doubt, representing the complexity <strong>of</strong> the <strong>air</strong> <strong>transport</strong> system in a<br />
causal <strong>risk</strong> model will require numerous assumptions, each <strong>of</strong> which can be challenged. The<br />
causal <strong>risk</strong> model can only be a success if these assumptions are agreed upon by all parties<br />
involved, and the <strong>air</strong> <strong>transport</strong> regulator is the appropriate lead in this process. Preferably<br />
184
this should be an international regulator like EASA or ICAO. They should initiate and lead<br />
the process to come to an industry standard model and to agree on how and when to apply<br />
this model. Examples from other industries, most notably the nuclear power industry and<br />
the process industry demonstrate the benefits <strong>of</strong> such a unified model.<br />
For further development <strong>of</strong> causal <strong>risk</strong> <strong>models</strong> <strong>of</strong> <strong>air</strong> <strong>transport</strong>, it is essential to link such<br />
<strong>models</strong> directly to a data system, preferably ECCAIRS as this is a European and world<br />
standard and data accessibility is almost unrestricted. Feedback from the modellers to the<br />
potential users and vice versa is required to get a better grip on user requirements. It should<br />
also be verified, for each kind <strong>of</strong> user, that the causal <strong>risk</strong> model definition as adopted in<br />
this thesis, is suitable for them. The modellers should indicate possibilities and limitations<br />
<strong>of</strong> the model, and should come-up with real-life examples <strong>of</strong> cases in which a causal <strong>risk</strong><br />
model would be a helpful tool. This will have to be an iterative process. Current experience<br />
shows that causal <strong>risk</strong> <strong>models</strong> are suitable to support strategic decision making by aviation<br />
pr<strong>of</strong>essionals. They are specifically useful when the decision involves multiple disciplines<br />
or stakeholders. They should be used as input to the decision making process instead <strong>of</strong><br />
using them for strictly assessing compliance with regulation. Support from the industry is<br />
essential for the provision <strong>of</strong> data and to provide insight, to the model developers, into<br />
operational aviation processes.<br />
Final conclusion<br />
This thesis did not describe the development <strong>of</strong> some new methodological <strong>risk</strong> modelling<br />
approach. Instead it considered <strong>risk</strong> modelling approaches with application examples from<br />
literature and investigated if and under which conditions the needs from the users can be<br />
met. The list <strong>of</strong> user needs that was developed is in itself an important result that had not<br />
been obtained before. The thesis also showed how difficult it will be to meet the needs <strong>of</strong><br />
the user and how different scientific disciplines need to be integrated to obtain the desired<br />
result. The model developers should be aware <strong>of</strong> these difficulties and should know what<br />
must be made explicit to allow such integration.<br />
Model development is very much comparable to <strong>air</strong>craft design. The difficulty <strong>of</strong> <strong>air</strong>craft<br />
design is not in aerodynamics, nor in structures. It is not in propulsion, and not in avionics.<br />
It is not in hydraulics and also not in <strong>air</strong>craft performance. The difficulty lies in integrating<br />
all these disciplines into a single design, in making compromises such the overall result<br />
meets the objectives. Compromises are even needed in the objectives, because they can be<br />
conflicting as well. In safety model development, the disciplines that need to be integrated<br />
are various shades <strong>of</strong> engineering, mathematics, psychology and a touch <strong>of</strong> philosophy and<br />
economics. The users <strong>of</strong> the model are the industry, the regulator, and the society. The<br />
added value <strong>of</strong> this thesis is that it brought together the various disciplines and articulated<br />
the challenges associated with integrating them into a model that meets the needs <strong>of</strong> the<br />
users.<br />
185
References<br />
AAIASB. (2006). Accident Investigation report 11 / 2006, Accident <strong>of</strong> the a/c 5B-DBY <strong>of</strong><br />
Helios Airways, Flight HCY522 on August 14, 2005, in the area <strong>of</strong> Grammatiko, Attikis,<br />
33 km Northwest <strong>of</strong> Athens International Airport, Hellenic Republic, Ministry <strong>of</strong> Transport<br />
and Communications, Air Accident Investigation Board, Athens, Greece.<br />
AAIB Switzerland. (2004). Investigation Report <strong>of</strong> the Aircraft Accident Investigation<br />
Bureau on the accident to <strong>air</strong>craft AVRO 146-RJ100, HB-IXM, operated by Cross<strong>air</strong> under<br />
flight number CRX 3597 on 24 November 2001 near Bassersdorf/ZH, Nr. u1793, Federal<br />
Department <strong>of</strong> the Environment, Transport, Energy and Communications, Bern,<br />
Switzerland.<br />
AAIU. (2005). Formal report 2005-015, Air Accident Investigation Unit, Dublin, Ireland.<br />
AAS. (2001). Airside Aerodrome Manual, Version 1, Amsterdam Airport Schiphol,<br />
Business Unit Airlines.<br />
Abbink, F.J. (1996). Integrated free-flight and 4-D gate-to-gate <strong>air</strong> traffic management,<br />
possibilities, promises and problems, <strong>NLR</strong> TP 96239U, National Aerospace Laboratory<br />
<strong>NLR</strong>, Amsterdam.<br />
Ahlbohm, A., Cardis, E., Green, A., Linet, M., Savitz, D., Swerdlow, A. (2001). Review <strong>of</strong><br />
the epidemiologic literature on EMF and health, Environmental Health Perspectives,<br />
Volume 109, Supplement 6, p. 911-933.<br />
AIAA. (1998). Guide for the verification and validation <strong>of</strong> computational fluid dynamics<br />
simulations, G-077-1998, American Institute <strong>of</strong> Aeronautics and Astronautics, Reston, VA,<br />
USA.<br />
Ale, B.J.M., Post, J.G., Bellamy, L.J. (1998). The interface between the technical and the<br />
management model for use in quantified <strong>risk</strong> analysis. In: Mosleh, A., Bari, R.A. (Eds.),<br />
Probabilistic Safety Assessment and Management, Vol. 3. Springer, p. 2087–2092.<br />
Ale, B.J.M., Piers, M.A. (2000). Policy options for dealing with societal <strong>risk</strong> around<br />
Schiphol, <strong>NLR</strong>-CR-2000-084, RIVM nr. 610066011, National Aerospace Laboratory <strong>NLR</strong>,<br />
Amsterdam.<br />
Ale, B.J.M., Golbach, G.A.M., Goos, D., Ham, K., Janssen, L.A.M., Shield, S.R. (2001).<br />
Benchmark <strong>risk</strong> analysis <strong>models</strong>, RIVM Report 610066015/2001, RIVM, Bilthoven, the<br />
Netherlands.<br />
Ale, B.J.M. (2005). Tolerable or acceptable: A comparison <strong>of</strong> <strong>risk</strong> regulation in the United<br />
Kingdom and in the Netherlands, Risk Analysis, Vol. 25, No. 2, p. 231-241.<br />
186
Ale, B.J.M., Bellamy, L.J., Cooke, R.M., Goossens, L.H.J., Hale, A.R., Roelen, A.L.C.,<br />
Smith, E. (2006). Towards a causal model for <strong>air</strong> <strong>transport</strong> safety - an ongoing research<br />
project, Safety Science 44, p. 657 - 673.<br />
Ale, B.J.M. (2007). <strong>Causal</strong> Model for Air Transport Safety, modified 7 th interim report,<br />
Risk Centre, Delft University <strong>of</strong> Technology, Delft.<br />
Ale, B.J.M., Bellamy, L.J., Van der Boom, R., Cooper, J., Cooke, R.M., Goossens, L.H.J.,<br />
Hale, A.R., Kurowicka, D., Morales, O., Roelen, A.L.C., Spouge, J. (2007). Further<br />
development <strong>of</strong> a <strong>Causal</strong> model for Air Transport Safety (CATS): building the<br />
mathematical heart. Aven & Vinnem (eds), Risk, Reliability and Societal Safety, p 1431-<br />
1439, Taylor & Francis Group, London, UK.<br />
Ale, B.J.M., Bellamy, L.J., Van der Boom, R., Cooper, J., Cooke, R.M., Lin, P.H., Morales,<br />
O., Roelen, A.L.C., Spouge, J. (2008). Using a <strong>Causal</strong> model for Air Transport Safety<br />
(CATS) for the evaluation <strong>of</strong> alternatives, ESREL2008, Valencia, Spain.<br />
Amalberti, R. (2001). The paradoxes <strong>of</strong> almost totally safe <strong>transport</strong>ation systems, Safety<br />
Science, 37, p. 109-126.<br />
Amalberti, R., Auroy, Y., Berwick, D., Barach, P. (2005). Five system barriers to achieving<br />
ultrasafe health care, Annals <strong>of</strong> Internal Medicine, Volume 142, Number 9, p. 756-764.<br />
Anderson, R.M. (1991). Discussion: The Kermack-McKendrick epidemic threshold<br />
theorem, Bulletin <strong>of</strong> Mathematical Biology, Vol. 53, Numbers 1 – 2, p. 1–32.<br />
ATSB. (2001). Boeing 747-438, VH-OJH, Bangkok, Thailand, 23 September 1999,<br />
Australian Transport Safety Bureau, Canberra, Australia.<br />
Avermaete, J.A.G. van. (1998). NOTECHS: Non-technical skill evaluation in JAR-FCL,<br />
<strong>NLR</strong>-TP-98518, National Aerospace Laboratory <strong>NLR</strong>, Amsterdam.<br />
Bailey, N.T.J. (1975). The mathematical theory <strong>of</strong> infectious diseases and its applications,<br />
second edition, Oxford University Press, New York.<br />
Baker, J.A. (ch<strong>air</strong>man). (2007). The report <strong>of</strong> the BP US refineries independent safety<br />
review panel.<br />
Ballin, M.G., Erzberger, H. (1996). An analysis <strong>of</strong> landing rates and separations at the<br />
Dallas / Fort Worth International Airport, NASA Technical Memorandum 110397.<br />
Barnett, A., LoFaso, A.J. (1983). After the crash: the passenger response to the DC-10<br />
disaster, Management Science, Vol. 29, issue 11, p. 1225-1236.<br />
Barnett, A., Menhigetti, J., Prete, M. (1992). The Market Response to the Sioux City DC-<br />
10 Crash, Risk Analysis, March 1992, p. 12.<br />
Barnett, A., Wang, A. (2000). Passenger-mortality <strong>risk</strong> estimates provide perspectives<br />
about <strong>air</strong>line safety, Flight Safety Digest, Vol. 19, No. 4, p. 1-12.<br />
187
BEA. (2001). Accident on 25 July 2000 at La Patte d’Oie in Gonesse (95) to the Concorde<br />
registered F-BTSC operated by Air France, report number F-SC000725A, Bureau<br />
d'Enquêtes et d'Analyses pour la Sécurité de l'Aviation civile, le Bourget, France.<br />
BEA. (2007). Rapport prélimin<strong>air</strong>e. Accident survenu le 25 janvier 2007 sur l’aérodrome<br />
de Pau Pyrénées (64) au Fokker 28-100 immatriculé F-GMPG exploité par Régional,<br />
Bureau d’Enquêtes et d’Analyses pour la Sécurité de l’Aviation civile, le Bourget, France.<br />
Beaumont, R. (1994). Flying to the limit: reminiscences <strong>of</strong> <strong>air</strong> combat, test flying and the<br />
<strong>air</strong>craft industry, Haynes Publishing, Somerset, UK.<br />
Bedford, T., Cooke, R. (2001). Probabilistic Risk Analysis: foundations and methods,<br />
Cambridge University Press, New York.<br />
Bedford, T.J., Cooke, R.M. (2002). Vines - a new graphical model for dependent Random<br />
Variables. Annals <strong>of</strong> Statistics, Vol. 30, No. 4, p. 1031-1068.<br />
Bellamy, L.J., Wright, M.S., Hurst, N.W. (1993). History and Development <strong>of</strong> a Safety<br />
Management System Audit for Incorporating into Quantitative Risk Assessment,<br />
International Process Safety Management Workshop, San Francisco, USA.<br />
Bellamy, L.J., Papazoglou, I.A., Hale, A.R., Aneziris, O.N., Ale, B.J.M., Morris, M.I., Oh,<br />
J.I.H. (1999). Development <strong>of</strong> an integrated technical and management <strong>risk</strong> control and<br />
monitoring methodology for managing and quantifying on-site and <strong>of</strong>f-site <strong>risk</strong>s, I-Risk<br />
main report, May 1999, EU Contract number ENVA CT96-0243.<br />
Benner, L. (1975). Accident investigations: Multilinear events sequencing methods, Journal<br />
<strong>of</strong> Safety Research, Vol. 7, Nr. 2, p. 67-73.<br />
Bentley, R. (2005). Former Concorde programme head under investigation, Flight<br />
International, 27 September 2005.<br />
Bernstein, L.N. (1996). Against the Gods, John Wiley & Sons, New York.<br />
BFU. (2004). Untersuchungsbericht AX001-1-2/02, Bundesstelle für<br />
Flugunfallenuntersuchung, Braunschweig, Germany.<br />
Biemans, M.C.M., Avermaete, J.A.G. van, Roelen, A.L.C., Meulen, G.J. van der. (1998).<br />
ADAMS Aircraft maintenance operational systems, identification <strong>of</strong> bottlenecks in the<br />
existing maintenance and dispatch system, Technical Report ADAMS –WP2B-TR01, Issue<br />
1.0, <strong>NLR</strong>-TR-98120, National Aerospace Laboratory <strong>NLR</strong>, Amsterdam.<br />
Bisignani, G. (2006). We need to do even better. Aviation Safety World, August 2006<br />
issue, p. 11-12, published by the Flight Safety Foundation, Alexandria, VA, USA.<br />
Bland, L.M. (1962). The problem <strong>of</strong> <strong>air</strong> <strong>transport</strong> flight safety, paper presented at the 15th<br />
Annual International Air Safety Seminar, Flight Safety Foundation.<br />
Blom, H.A.P., Bakker, G.J., Blanker, P.J.G., Daams, J., Everdij, M.H.C., Klompstra, M.B.<br />
(2001). Accident <strong>risk</strong> assessment for advanced <strong>air</strong> traffic management, <strong>NLR</strong>-TP-2001-642,<br />
National Aerospace Laboratory <strong>NLR</strong>, Amsterdam.<br />
188
Blom, H.A.P., Stroeve, S.H., Jong, H.H. de. (2006). Safety <strong>risk</strong> assessment by Monte Carlo<br />
simulation <strong>of</strong> complex safety critical operations, Proceedings <strong>of</strong> the 14th Safety Critical<br />
Systems Symposium, Bristol, UK.<br />
Blom, H.A.P., Stroeve, S.H., Scholte, J.J., Jong, H.H. de. (2008). Accident <strong>risk</strong> analysis<br />
benchmarking Monte Carlo simulation versus event sequences, 3rd international conference<br />
on research in <strong>air</strong> <strong>transport</strong>ation (ICRAT), F<strong>air</strong>fax, VA, USA.<br />
Brandsaeter, A. (2002). Risk assessment in the <strong>of</strong>fshore industry, Safety Science, Vol. 40.<br />
p. 231-269.<br />
Brauer, C. (2004). The <strong>risk</strong> landscape <strong>of</strong> the future. Swiss Reinsurance Company, Zurich,<br />
Switzerland.<br />
Braun, C., Gründl, M, Marberger, C, Scherber, C. (2001). Beautycheck, Ursache und<br />
Folgen von Attraktivität, Universität Regensburg.<br />
Bridgeman, W., Hazard, J. (1955). The lonely sky, Henri Holt and Company, New York,<br />
USA.<br />
Brink, W.P. van den, Koele, P. (1985). Statistiek, deel 1, Datareductie, Boom, Amsterdam.<br />
Brooker, P., Ingham T. (1977). Target Levels <strong>of</strong> Safety for Controlled Airspace, CAA<br />
Paper 77002, Civil Aviation Authority , London, UK.<br />
Brooker, P. (2004). P-RNAV, Safety Targets, Blunders and Parallel Route Spacing, The<br />
Journal <strong>of</strong> Navigation, Vol. 57, p. 371-394.<br />
Brown, E. (1981). The helicopter in civil operations. Granada Publishing, London, UK.<br />
Burnside, E.S., Rubin, D.L., Fine, J.P., Shachter, R.D., Sisney, G.A., Leung, W.K. (2006).<br />
Bayesian network to predict breast cancer <strong>risk</strong> <strong>of</strong> mammographic microcalcifications and<br />
reduce number <strong>of</strong> benign biopsy results: initial experience. Radiology: 240: 3, p. 666-673.<br />
Buys, J.R., Clark, J.L. (1995). Events and <strong>Causal</strong> Factors Analysis, SCIE-DOE-01-TRAC-<br />
14-95, Technical Research and Analysis Center, SCIENTECH Inc, Idaho Falls, USA.<br />
CAA. (1998). Global fatal Accident Review 1980-1996, CAP 681, Safety Regulation<br />
Group, Civil Aviation Authority, London, UK.<br />
CAA. (2000). Aviation Safety Review 1990-1999, CAP 701, Safety Regulation Group,<br />
Civil Aviation Authority, London, UK.<br />
CAA. (2005). The mandatory occurrence reporting scheme, CAP 382, Safety Regulation<br />
Group, Civil Aviation Authority, London, UK.<br />
CAA-NL. (2007). Civil aviation safety data, 1991-2005, Civil Aviation Authority<br />
Netherlands, The Hague.<br />
189
Carpenter, M.S., Cooper, L.G., Glenn, J.H., Grissom, V.I., Schirra, W.M., Shepard, A.B.,<br />
Slayton, DK. (1962). We Seven, Simon and Schuster, New York, USA.<br />
Castano, D.J., Graeber, R.C. (2002). Aircraft manufacturer eager to learn from reliability<br />
data on normal flight operations, ICAO Journal, Vol. 57, Nr. 4, p. 10-11.<br />
CCPS. (1989). Guidelines for Chemical Process Quantitative Risk Analysis, Centre for<br />
Chemical Process Safety (CCPS), American Institute <strong>of</strong> Chemical Engineers, New York,<br />
USA.<br />
Chaikin, A. (1994). A man on the Moon, Michel Joseph, UK.<br />
Chalk, A. (1986). Market forces and <strong>air</strong>craft safety: The case <strong>of</strong> the DC-10, Economic<br />
Enquiry, Vol. 24, issue 1, p. 43-60.<br />
Chappell, S.C. (1994). Using voluntary incident reports for human factors evaluations, in<br />
McDonald, N., Johnston, N, Fuller, R. (eds), Aviation Psychology in Practice, Avebury<br />
Technical, Aldershot, UK.<br />
Cheung, Y.S., Post, J.A. (2005). Revised accident rates <strong>of</strong> third generation <strong>air</strong>craft for <strong>NLR</strong><br />
IMU model 2004 (RANI-2004), <strong>NLR</strong>-CR-2005-656, National Aerospace Laboratory <strong>NLR</strong>,<br />
Amsterdam.<br />
Columbia Accident Investigation Board. (2003). Report Volume 1.<br />
Cooke, R.M., Goossens, L.H.J. (2000). Procedures guide for structured expert judgement,<br />
EURATOM document EUR 18820EN, European Communities.<br />
Cooke, R.M., Kurowicka, D., Hanea, A.M., Morales, O., Ababei, D.A., Ale, B, Roelen, A.<br />
(2007). Continuous/Discrete Non Parametric Bayesian Belief Nets with UNICORN and<br />
UNINET, Proceedings <strong>of</strong> Mathematical Methods in Reliability MMR 2007, Glasgow, UK.<br />
Cooper, G.E., Harper, R.P. (1967). The use <strong>of</strong> pilot rating in the evaluation <strong>of</strong> <strong>air</strong>craft<br />
handling qualities, AGARD report 567, France.<br />
Corrigan, J., Kohn, L.T., Donaldson, M.S. (eds). (2000). To err is human. Building a safer<br />
health system. National Academy Press, Washington D.C., USA.<br />
Court <strong>of</strong> Session. (2005). Statement by the Right Hon. Lord Nimmo Smith when delivering<br />
judgment in the cause mrs. Margaret McTear against Imperial Tobacco ltd at the Court <strong>of</strong><br />
Session, Edinburgh on 31 May 2005, Edinburgh, UK.<br />
Crossfield, A.S., Bl<strong>air</strong>, C. (1960). Always another dawn: the story <strong>of</strong> a rocket test pilot, The<br />
World Publishing Company, Cleveland, Ohio, USA.<br />
Cullen, W.C. (2001). The Ladbroke Grove Rail Inquiry, HSE books, Sudbury, Suffolk, UK.<br />
Czerwinski, D., Barnett, A. (2004). Airlines as baseball players: An alternative approach to<br />
evaluating <strong>air</strong> carrier safety record, Draft report prepared for FAA Tech Center, Atlantic<br />
City, NJ. USA.<br />
190
Daso, D.A. (2003). Doolittle, aerospace visionary, Brassey’s, Dulles, VA, USA.<br />
Davoudian, K., Wu. J-S., Apostolakis, G. (1994). The work process analysis model<br />
(WPAM) Reliability Engineering and System Safety, Vol. 45, p. 107-125.<br />
Deacon, N., Rochard, B. (2000). Fifty years <strong>of</strong> <strong>air</strong>field grass management in the UK, In J.<br />
van Nugteren (ed), Proceedings <strong>of</strong> the 25 th meeting <strong>of</strong> the International Bird Strike<br />
Committee, IBSC, Amsterdam, p. 71-79.<br />
Deazle, A., Hayes, P, Schmidlin, M., Tress, G. (1999). The development <strong>of</strong> a taxonomy <strong>of</strong><br />
cost factors, DESIRE technical report WP-3-TR3B.<br />
Dekker, S.W.A. (2005). Why we need new accident <strong>models</strong>, Technical report 2005-02,<br />
Lund University <strong>of</strong> Aviation, Sweden.<br />
Deming, W.E. (1990). Out <strong>of</strong> crisis: quality, productivity and competitive position.<br />
Cambridge University Press, Cambridge, UK.<br />
DGL. (2002a). Luchthavenindelingbesluit Schiphol, Ministerie van Verkeer en Waterstaat,<br />
Directoraat Generaal Luchtvaart, The Hague.<br />
DGL. (2002b). Luchthavenverkeersbesluit, Ministerie van Verkeer en Waterstaat,<br />
Directoraat Generaal Luchtvaart, The Hague.<br />
DGL. (2004). Evaluatie Schipholbeleid, Plan van Aanpak, Ministerie van Verkeer en<br />
Waterstaat, Directoraat Generaal Luchtvaart, The Hague.<br />
DGTL. (2005). Beleidsagenda Luchtvaartveiligheid, Ministerie van Verkeer en Waterstaat,<br />
The Hague.<br />
Dierikx, M. (1997). Dwarswind, een biografie van Anthony Fokker, Sdu publishers, The<br />
Hague.<br />
Dijk, W. van, Molemaker, R.J., Hayes, P., Roelen, A.L.C. (2001). The cost <strong>of</strong> unsafety,<br />
ASTER WP3, <strong>NLR</strong>-CR-2001-154, National Aerospace Laboratory <strong>NLR</strong>, Amsterdam.<br />
DNV. (2002a). Marine Risk Assessment, Offshore Technology Report 2001/063, Published<br />
by the Health and Safety Executive, UK.<br />
DNV. (2002b). <strong>Causal</strong> modelling <strong>of</strong> <strong>air</strong> safety, CM-DNV-018, DNV London, UK.<br />
Doolittle, J.H. 1952. The Airport and Its Neighbors, President’s Airport Commission.<br />
Doorn, B.A. van. (2006). Analysis <strong>of</strong> a selection <strong>of</strong> safety assessments with respect to<br />
ATSF strategic objectives. <strong>NLR</strong> Memorandum ATSF-2006-068, National Aerospace<br />
Laboratory <strong>NLR</strong>, Amsterdam.<br />
Duke, N. (1953). Test pilot, Allan Wingate, London, UK.<br />
191
EAI. (2002). Review <strong>of</strong> <strong>Causal</strong> Modeling <strong>of</strong> Air Safety for the Directorate General <strong>of</strong> Civil<br />
Aviation - the Netherlands, Report <strong>of</strong> Peer Reviews, Enders Associates International,<br />
Bethesda, MD, USA.<br />
EASA. (2003a). Certification Specification for Large Aeroplane, CS-25, European<br />
Aviation Safety Agency, Brussels, Belgium.<br />
EASA. (2003b). Decision No. 2003/6/RM <strong>of</strong> the Executive Director <strong>of</strong> the Agency <strong>of</strong> 17<br />
October 2003 on certification specifications, including <strong>air</strong>worthiness codes and acceptable<br />
means <strong>of</strong> compliance, for all weather operations (« CS-AWO »), European Aviation Safety<br />
Agency, Brussels, Belgium.<br />
EC. (1982). Council Directive 82/501/EEC 1982 on the major-accident hazards <strong>of</strong> certain<br />
industrial activities, Council <strong>of</strong> the European Communities, Luxemburg.<br />
EC. (1996). Council Directive 96/82/EC on the control <strong>of</strong> major-accident hazards involving<br />
dangerous substances, Council <strong>of</strong> the European Union, Brussels, Belgium.<br />
EC. (2003). Council Directive 2003/42/EC on occurrence reporting in civil aviation,<br />
Council <strong>of</strong> the European Union, Brussels, Belgium.<br />
EC. (2004). Corrigendum to Directive 2004/49/EC <strong>of</strong> the European Parliament and <strong>of</strong> the<br />
Council <strong>of</strong> 29 April 2004 on safety on the Community’s railways and amending Council<br />
Directive 95/18/EC on the licensing <strong>of</strong> railway undertakings and Directive 2001/14/EC on<br />
the allocation <strong>of</strong> railway infrastructure capacity and the levying <strong>of</strong> charges for the use <strong>of</strong><br />
railway infrastructure and safety certification (Railway Safety Directive), Official Journal<br />
<strong>of</strong> the European Union L 220 <strong>of</strong> 21 July 2004.<br />
EC. (2005). Rapid agreement reached on <strong>air</strong>line blacklist, Press release IP/05/1429,<br />
European Commission, Brussels, Belgium.<br />
Eijndhoven, J.C.M. van, Weterings, R.A.P.M., Worrell, C.W., Boer, J. de, Pligt, J. van der,<br />
Stallen, P.J.M. (1994). Risk communication in the Netherlands: the monitored introduction<br />
<strong>of</strong> the EC ‘post-Seveso’ Directive, Risk Analysis, Vol. 14, no. 1, p. 87-95.<br />
Enders, J.H., Dodd, R., Tarrel, R., Khatwa, R., Roelen, A.L.C., Karwal, A.K. (1996).<br />
Airport safety: A study <strong>of</strong> accidents and available approach-and-landing aids, Flight Safety<br />
Digest, Vol. 15, No. 3, Flight Safety Foundation, Alexandria, VA, USA.<br />
Ericson, C.A. (1999). Fault tree analysis - a history, 17 th International System Safety<br />
Conference, Orlando, Florida, USA.<br />
Es, G.W.H. van, Roelen, A.L.C., Kruijsen, E.A.C., Giesberts, M.K.H. (1998). Safety<br />
aspects <strong>of</strong> <strong>air</strong>craft performance on wet and contaminated runways, paper presented at the<br />
10th European Aviation Safety Seminar, Amsterdam.<br />
Es, G.W.H. van. (2005). Running out <strong>of</strong> runway, analysis <strong>of</strong> 35 years <strong>of</strong> landing overrun<br />
accidents, <strong>NLR</strong>-TP-2005-498, National Aerospace Laboratory <strong>NLR</strong>, Amsterdam.<br />
192
Es, G.W.H. van, Geest, P.J. van der. (2006). A study <strong>of</strong> normal operational landing<br />
performance on subsonic civil narrow body jet <strong>air</strong>craft during ILS approaches, <strong>NLR</strong>-CR-<br />
2006-049, National Aerospace Laboratory <strong>NLR</strong>, Amsterdam.<br />
ETSC. (1997). Transport accident costs and the value <strong>of</strong> safety, European Transport Safety<br />
Council, Brussels, Belgium.<br />
Eurocontrol. (2001a). The EUR RVSM pre-implementation safety case, RVSM 691,<br />
version 2.0, Eurocontrol, Brussels, Belgium.<br />
Eurocontrol. (2001b). Eurocontrol Safety Regulatory Requirement (ESARR) 4, Risk<br />
assessment and mitigation in ATM, Edition 1.0, Eurocontrol Safety Regulation<br />
Commission, Brussels, Belgium.<br />
Eurocontrol. (2003). Explanatory Material on ESARR 4 Requirements, Edition 1.0,<br />
Eurocontrol Safety Regulation Commission, Brussels, Belgium.<br />
Eurocontrol. (2004). EAM 4/ AMC Acceptable means <strong>of</strong> compliance with ESARR 4,<br />
Edition 3.0, Eurocontrol Safety Regulation Commission, Brussels, Belgium<br />
Eurocontrol. (2006a). Safety Assessment Methodology (SAM), SAF.ET1.ST03.1000-<br />
MAN-01, version 2.1, Eurocontrol, Brussels, Belgium.<br />
Eurocontrol. (2006b). Safety Assessment report on independent approaches to parallel<br />
instrument runways at Helsinki-Vantaa Airport, final version 1.2, Eurocontrol, Brussels,<br />
Belgium.<br />
Eurocontrol. (2007). EEC Mid-Term Validation Safety Plan, version 1.0, Eurocontrol,<br />
Brussels, Belgium.<br />
Evans, A.W., Foot, P., Mason, S.M., Parker, I.G., Slater, K. (1997). Third party <strong>risk</strong> near<br />
<strong>air</strong>ports and public safety zone policy, R&D Report 9636, National Air Traffic Services,<br />
London, UK.<br />
Everdij, M.H.C. (2004). Review <strong>of</strong> techniques to support the EATMP safety assessment<br />
methodology, Volume I, EEC Note No. 01/04, Project SRD-3-E1.<br />
Everdij, M.H.C., Blom, H.A.P. (2005). Piecewise Deterministic Markov Processes<br />
represented by Dynamically Coloured Petri Nets, Stochastics, Vol. 77, p. 1-29.<br />
Everdij, M.H.C., Blom, H.A.P., Stroeve, S.H. (2006). Structured assessment <strong>of</strong> bias and<br />
uncertainty in Monte Carlo simulated accident <strong>risk</strong>, paper presented at the 8th International<br />
Conference on Probabilistic Safety Assessment and Management (PSAM 8), New Orleans,<br />
Louisiana, USA.<br />
Everdijk, H. (2006). Luid maar duidelijk. Commissie deskundigen vliegtuiggeluid, The<br />
Hague.<br />
FAA. (1988). Advisory Circular AC 25.1309-1A, System Design and Analysis, 21 June<br />
1988, Federal Aviation Administration, Washington D.C., USA.<br />
193
FAA. (1995a). Aviation safety action plan. Zero accidents, a shared responsibility, Federal<br />
Aviation Administration, Washington D.C., USA.<br />
FAA. (1995b). Proceedings <strong>of</strong> the Aviation Safety Conference held in Washington DC on<br />
January 9 and 10, 1995, Federal Aviation Administration, Washington D.C., USA.<br />
FAA. (1997). Aviation Safety Data Accessibility Study Index, a report on issues related to<br />
public interest in aviation safety data, Office <strong>of</strong> System Safety, Federal Aviation<br />
Administration, Washington D.C., USA.<br />
FAA. (2001). System Approach for Safety Oversight, Mission Need Statement, Federal<br />
Aviation Administration, Washington D.C., USA.<br />
FAA. (2002). The report on the FAA Associate Administrator for Regulation and<br />
Certification’s Study on the Commercial Airplane Certification Process, Federal Aviation<br />
Administration, Washington D.C., USA.<br />
FAA. (2003). FAR 121.344, Digital flight data recorders for <strong>transport</strong> category <strong>air</strong>planes,<br />
Doc. No. 28109, 62 FR 38378, July 17, 1997; 62 FR 48135, Sept. 12, 1997, as amended by<br />
Amdt. 121–300, 68 FR 42936, July 18, 2003; 68 FR 50069, Aug. 20, 2003, Federal<br />
Aviation Administration, Washington D.C. USA.<br />
FAA. (2004). System Approach for Safety Oversight, Commercial Aviation, RE&D<br />
Requirements, FY2004-2005, version 7.0, Federal Aviation Administration, Washington<br />
D.C., USA.<br />
FAA. (2006). Advisory Circular 120-90, Line Operations Safety Audit. Federal; Aviation<br />
Administration, Washington D.C., USA.<br />
Feynman, R. (1965). The character <strong>of</strong> physical law, The British Broadcasting Corporation.<br />
London, UK.<br />
Flight International. (2006a). Editorial, The danger <strong>of</strong> hindsight in criminal <strong>air</strong> accident<br />
cases, 21 March 2006.<br />
Flight International. (2006b). France prosecutes six over 1992 Air Inter Crash, 21 March<br />
2006.<br />
Forsyth, R.J., Balogh, A., Smith, E.J. (2002). Latitudinal variation <strong>of</strong> the underlying<br />
heliospheric magnetic field direction: Comparison <strong>of</strong> the Ulysses first and second orbits,<br />
Space Science Reviews, 97, p. 161-164.<br />
Fragola, J.R. (1996). Risk management in US manned spacecraft, from Apollo to Alpha<br />
and beyond, Proceedings <strong>of</strong> the ESA Product Assurance Symposium and S<strong>of</strong>tware Product<br />
Assurance Workshop, ESA SP 377, p. 83-92.<br />
FSF. (1998). A Study <strong>of</strong> Fatal Approach-and-Landing Accidents Worldwide, 1980-1996,<br />
Flight Safety Digest, Vol. 17, No. 2/3, Flight Safety Foundation, Alexandria, VA, USA.<br />
194
FSF. (1999). Killers in Aviation: FSF Task Force Presents Facts About Approach-andlanding<br />
and Controlled-flight-into-terrain Accidents, Flight Safety Digest, Vol. 17, No. 11-<br />
12, Vol. 18, No. 1-2, Flight Safety Foundation, Alexandria, VA, USA.<br />
Galles, D., Pearl, J. (1998). An axiomatic characterization <strong>of</strong> causal counterfacts,<br />
Foundations <strong>of</strong> Science, Volume 3, Issue 1, p. 151-182.<br />
Geest, P.J. van der, Kruijsen, E.A.C., Ramsay, C.G., Slater, D.H. (2005). Safety and<br />
compatibility <strong>of</strong> mixed VFR/IFR <strong>air</strong> traffic at Geneva Airport, <strong>NLR</strong>-CR-2005-102,<br />
National Aerospace laboratory <strong>NLR</strong>, Amsterdam.<br />
Gier, M, de. (2005). Luchtvaartveiligheid, de beleving van de Nederlandse bevolking,<br />
TNS-NIPO consult, report E1537, TNS-NIPO Amsterdam.<br />
Goold, I. (2000). The Modern Jet Airliner - the trailblazers, in Ph. Jarret (series editor),<br />
Modern Air Transport, worldwide <strong>air</strong> <strong>transport</strong> from 1945 to the present, Putnam<br />
Aeronautical Books, London, UK.<br />
Goossens, L.J.J., Cooke, R.M., Hale, A.R., Rodíc-Wiersma, Lj. (2008). Fifteen years <strong>of</strong><br />
expert judgement at TU Delft, Safety Science, Vol. 46, Issue 2, p. 234-244.<br />
Gould, S.J. (1981). The mismeasure <strong>of</strong> man, W.W. Norton & Company, New York.<br />
Groen, F.J., Smidts, C., Mosleh, A. (2006). QRAS - the quantitative <strong>risk</strong> assessment<br />
system, Reliability Engineering and System Safety, Volume 91, Issue 3, p. 292-304.<br />
Group <strong>of</strong> Personalities. (2001). European Aeronautics: a vision for 2020. Meeting society’s<br />
needs and winning global leadership, Office for Official Publications <strong>of</strong> the European<br />
Communities.<br />
GS. (2003). Antwoord van Gedeputeerde Staten op schriftelijke vragen van het lid<br />
mevrouw E. Tans inzake Uitlatingen van Gedeputeerde Vestjens in het programma<br />
Confrontatie van de RVU over geluidsoverlast rond MAA, 28 oktober 2003.<br />
GVA. (2005). Gazet van Antwerpen, www.gva.be, Dossier Enschede.<br />
Hakfoort, J., Poot, T., Rietveld, P. (2001). The regional economic impact <strong>of</strong> an <strong>air</strong>port: the<br />
case <strong>of</strong> Amsterdam Schiphol Airport, Regional Studies, 35:7, p. 595-604.<br />
Hale, A.R., Glendon, A.I. (1987). Individual behaviour in the control <strong>of</strong> danger. Elsevier,<br />
Amsterdam.<br />
Hale, A.R., Heming, B.H.J., Carthey, J., Kirwan, B. (1997). Modelling <strong>of</strong> safety<br />
management systems, Safety Science, Vol 26, No. 1/2, p. 121-140.<br />
Hale, A.R., Goossens, L.H.J., Bellamy, L.J. (1999). Modelling errors <strong>of</strong> commission:<br />
applicability <strong>of</strong> ATHEANA in the chemical industry. In: L.H.J. Goossens (eds.);<br />
Proceedings Rotterdam '99. Risk Analysis: Facing the New Millennium (Rotterdam,<br />
10/10/99), Delft University Press, Delft, p. 243-246.<br />
195
Hale, A.R. (2000). Railway safety management: the challenges <strong>of</strong> the new millennium,<br />
Safety Science monitor, issue 1, vol. 4.<br />
Hale, A.R. (2001). Conditions <strong>of</strong> occurrence <strong>of</strong> major and minor accidents, Journal <strong>of</strong> the<br />
Institution <strong>of</strong> Occupational Safety and Health, Vol. 5, No. 1, p. 7-21.<br />
Hale, A.R. Guldenmund, F. (2004). ARAMIS audit manual, version 1.3Safety Science<br />
Group, Delft University <strong>of</strong> Technology, Delft, the Netherlands.<br />
Hale, A.R., Ale, B.J.M., Goossens, L.H.J., Heijer, T., Bellamy, L.J., Mud, M.L., Roelen,<br />
A., Baksteen, H., Post, J., Papazoglou, I.A., Bloemh<strong>of</strong>f, A., Oh, J.I.H. (2007). Modeling<br />
accidents for prioritizing prevention, Reliability Engineering and System Safety, Vol. 92,<br />
No. 12, p. 1701-1715.<br />
Halpern, J.Y., Pearl, J. (2001). Causes and Explanations: A Structured-Model approach,<br />
Part I: Causes, in Proceedings <strong>of</strong> the Seventeenth Conference on Uncertainty in Artificial<br />
Intelligence, San Francisco, CA, Morgan Kauffmann, p. 194-202.<br />
Hansen, M., McAndrews, C., Berkeley, E. (2005). History <strong>of</strong> aviation safety oversight in<br />
the United States, Research Report NR-2005-001, Institute <strong>of</strong> Transportation Studies,<br />
University <strong>of</strong> California at Berkeley, USA.<br />
Haubrich, E.J.A. (1984). The certification <strong>of</strong> a new type <strong>of</strong> <strong>transport</strong> category <strong>air</strong>craft, <strong>NLR</strong><br />
TR 84001, National Aerospace laboratory <strong>NLR</strong>, Amsterdam.<br />
Health Council <strong>of</strong> the Netherlands. (1999). Public health impact <strong>of</strong> large <strong>air</strong>ports. Health<br />
Council <strong>of</strong> the Netherlands 1999/14E, Committee on the Health Impact <strong>of</strong> Large Airports,<br />
The Hague, Netherlands.<br />
Heijden, F.M.M.A., van der. (2006). Toegewijd, maar oververmoeid, Medisch Contact, Nr.<br />
45, p. 1792-1995.<br />
Heimplaetzer, P., Busch, C. (2006). Safety management in rail infrastructure, paper<br />
presented at the 3 rd International Conference ‘Working on Safety’, 12-15 September 2006,<br />
Zeewolde, the Netherlands.<br />
Heinrich, H., Petersen, D., Roos, N. (1980). Industrial accident prevention, McGraw-Hill,<br />
New York (original edition, H. Heinrich, 1931).<br />
Helmreich, R.L., Butler, R.E., Taggart, W.R.,Wilhelm, J.A. (1994). The NASA / University<br />
<strong>of</strong> Texas / FAA Line / LOS Checklist: A behavioral marker based checklist for CRM skills<br />
assessment. NASA/UT/FAA Technical Report 94-02, revised 12/8/95, The University <strong>of</strong><br />
Texas Austin, TX, USA.<br />
Hesslow, G. (1976). Discussion: two notes on the probabilistic approach to causality,<br />
Philosophy and Science, 43, p. 290-292.<br />
Hesslow, G. (1988). The problem <strong>of</strong> causal selection, in Hilton, D.J. (ed.) Contemporary<br />
science and natural explanation, Common sense conceptions <strong>of</strong> causality, Harvester Press,<br />
Sussex, UK.<br />
196
Hilburn, B.G., Bakker, M.W.P., Pekela, W.D. (1998). Free flight and the <strong>air</strong> traffic<br />
controller: an exploratory study <strong>of</strong> human factors issues, <strong>NLR</strong>-TP-98237, National<br />
Aerospace Laboratory <strong>NLR</strong> Amsterdam.<br />
Hoddes, E., Zarcone, V., Smythe, H., Phillips, R., Dement, W.C. (1973). Quantification <strong>of</strong><br />
sleepiness: A new approach. Psychophysiology, 10, p. 431-436.<br />
Hollnagel, E. (1998). Cognitive reliability and error analysis method, Elsevier Science,<br />
Oxford, UK.<br />
Hollnagel, E. (2004). Barriers and accident prevention, Ashgate Publishing, Aldershot, UK.<br />
Hollnagel, E., Woods D.D., Leveson, N.G. (eds). (2006). Resilience engineering: Concepts<br />
and precepts, Ashgate Publishing, Aldershot, UK.<br />
Hooey, B.L., Foyle, D.C., Andre, A.D. (2000). Integration <strong>of</strong> cockpit displays for surface<br />
operations: The final stage <strong>of</strong> a human-centered design approach. SAE Transactions:<br />
Journal <strong>of</strong> Aerospace, 109, p. 1053-1065.<br />
Horibe, K., Kawahari, K., Sakai, J., Sakaki, J. (2004). Development <strong>of</strong> GE90-115B<br />
turb<strong>of</strong>an engine, IHI Engineering Review, Vol. 37, No. 1.<br />
Hörmann, H.J., Berg, P. van den, Peixoto, J.L., Robinson, J., Rager, T., Belyavin, A.,<br />
Hosman, R. (2005). Analysis <strong>of</strong> pilot control behaviour during balked landing manoeuvres,<br />
AIAA 2005-5881, AIAA Modelling and Simulation Technologies Conference and Exhibit,<br />
San Francisco, California, USA.<br />
Hosman, R., Schuring, J., Geest, P.J. van der. (2005). Pilot model development for the<br />
balked landing manoeuvre, AIAA 2005-5884, AIAA Modelling and Simulation<br />
Technologies Conference and Exhibit, San Francisco, California, USA.<br />
Hourtolou, D., Salvi, O. (2003). ARAMIS project: development <strong>of</strong> an integrated accidental<br />
<strong>risk</strong> assessment methodology for industries in the framework <strong>of</strong> SEVESO II directive, in<br />
Bedford T., Van Gelder P.H.A.J.M (eds), Safety and Reliability - ESREL 2003, p. 575 -<br />
581.<br />
HSE. (1998). A Guide to the Offshore Installations (Safety Case) Regulations 1992, Health<br />
& Safety Executive, HSE Books, Sudbury, UK.<br />
Hubert, Ph., Barni, M.H., Moatti, J.P. (1990). Elicitation <strong>of</strong> criteria for management <strong>of</strong><br />
major hazards, 2sd SRA conference, Laxenburg, Austria.<br />
Hudson, P. (2003). Applying the lessons <strong>of</strong> high <strong>risk</strong> industries to health care, Quality and<br />
Safety in Health Care, 12, p. 7-12.<br />
Hyams, K.C., Wignall, F.S., Roswell, R. (1996). War syndromes and their evaluation -<br />
From the U.S. Civil War to the Persian Gulf War, Annals <strong>of</strong> Internal Medicine, Volume<br />
125, Issue 5, p. 398-405.<br />
IATA. (2008a). Operational Safety Audits, Programme Manual, 3<br />
197<br />
rd edition, International<br />
Air Transport Association, Montreal, Canada.
IATA. (2008b). IOSA Standards Manual, 2nd edition, Revision 1, International Air<br />
Transport Association, Montreal, Canada.<br />
ICAO. (1980). Manual on the Use <strong>of</strong> the Collision Risk Model (CRM) for ILS Operations,<br />
Doc 9274 AN/904, International Civil Aviation Organization, Montreal, Canada.<br />
ICAO. (2001). Aircraft accident and incident investigation, Annex 13 to the Convention on<br />
International Civil Aviation, ninth edition, International Civil Aviation Organization,<br />
Montreal, Canada.<br />
ICAO. (2002a). Operation <strong>of</strong> Aircraft, Part 1 International Commercial Air Transport –<br />
Aeroplanes, Annex 6 to the Convention on International Civil Aviation, eighth edition,<br />
International Civil Aviation Organization, Montreal, Canada.<br />
ICAO. (2002b). Line Operations Safety Audit (LOSA). Doc 9803 AN/761, International<br />
Civil Aviation Organization, Montreal, Canada.<br />
ICAO. (2002c). Manual on <strong>air</strong>space planning methodology for the determination <strong>of</strong><br />
separation minima, Doc 9689 AN/953, Amendment No. 1, International Civil Aviation<br />
Organization, Montreal, Canada.<br />
ICAO. (2004a). Manual on simultaneous operations on parallel or near-parallel instrument<br />
runways (SOIR), Doc 9643 AN/941, International Civil Aviation Organization, Montreal,<br />
Canada.<br />
ICAO. (2004b). Aerodromes, Volume 1, Aerodrome design and operations, Annex 14 to<br />
the Convention on International Civil Aviation, fourth edition, International Civil Aviation<br />
Organization, Montreal, Canada.<br />
ICAO. (2006). Safety Management Manual, Doc 9859, International Civil Aviation<br />
Organization, Montreal, Canada.<br />
Isaac, A., Straeter, O., Damme, D, van. (2004). A method for predicting human error in<br />
ATM (HERA-PREDICT). Eurocontrol report HRS/HSP-002-REP-07, EURONTROL,<br />
Brussels, Belgium.<br />
ISO. (1999). Safety aspects – guidelines for their inclusion in standards, ISO/IEC guide<br />
51:1999, International Organisation for Standardisation, Geneva, Switzerland.<br />
IVW. (2003). Handhavingsbeleid: Wet Luchtvaart; De Luchthaven Schiphol, Inspectie<br />
Verkeer en Waterstaat, Divisie Luchtvaart, Ho<strong>of</strong>ddorp.<br />
IVW. (2007). Visiedocument toezicht in beweging, Regiemodel toezicht Schiphol,<br />
Inspectie Verkeer en Waterstaat, Toezichteenheid Luchthavens en Luchtruim, Ho<strong>of</strong>ddorp,<br />
the Netherlands.<br />
IVW. (2008). Implementatie van de EU richtlijn (2003/42/EG), rapportage over het eerste<br />
jaar van meldingen van voorvallen in de Burgerluchtvaart, Inspectie Verkeer en Waterstaat,<br />
Ho<strong>of</strong>ddorp, the Netherlands.<br />
198
Jensen, F.V. (1995). Introduction to Bayesian networks, University College London Press,<br />
UK.<br />
JIAA. (1996). Final Aviation Accident Report, Birgen<strong>air</strong> flight ALW-301, Puerto Plata,<br />
Dominican Republic, February 6, 1996; Original report published by the Junta<br />
Investigadora de Accidentes Aéreos (JIAA), Director General <strong>of</strong> Civil Aeronautics,<br />
Dominican Republic; Translated copy distributed by the Air Line Pilots Association.<br />
Johnson, W.G. (1975). MORT: The management oversight and <strong>risk</strong> tree, Journal <strong>of</strong> Safety<br />
Research, Vol. 7. No. 1, p. 4-15.<br />
Johnston, A.M., Barton, C. (1991). Tex Johnston, jet-age test pilot, Smithsonian Institution<br />
Press, Washington D.C., USA.<br />
Jones, E., Hodgins-Vermaas, R., McCartney, H., Everitt, B., Beech, C., Poynter, D.,<br />
Palmer, I., Hyams, K., Wessely, S. (2002). Post-combat syndromes from the Boer war to<br />
the Gulf War: a cluster analysis <strong>of</strong> their nature and attribution, BMJ, Volume 324.<br />
Jong, H.H. de. (2004). Guidelines for the identification <strong>of</strong> hazards, how to make<br />
unimaginable hazards imaginable? <strong>NLR</strong>-CR-2004-094, National Aerospace Laboratory<br />
<strong>NLR</strong>, Amsterdam.<br />
Jong, H.H. de. (2006). Identification <strong>of</strong> user requirements for CATS, <strong>NLR</strong> Memorandum<br />
ATSF-2006-096, National Aerospace Laboratory <strong>NLR</strong>, Amsterdam.<br />
Jong, H.H. de. (2007). Second round <strong>of</strong> interviews to identify CATS user requirements,<br />
<strong>NLR</strong> Memorandum <strong>ATSI</strong>-2007-085, National Aerospace Laboratory <strong>NLR</strong> Amsterdam.<br />
Joyce, T., Graham, G., Kinnersly, S., Van Eenige, M.J.A., Roelen, A.L.C. (2001). A study<br />
into Target Levels <strong>of</strong> Safety (TLS) within the aviation industry, including comparative<br />
analyses with the rail and nuclear power sectors, ASTER WP 1, <strong>NLR</strong>-CR-2001-145,<br />
National Aerospace Laboratory <strong>NLR</strong>, Amsterdam.<br />
JPDO. (2004). Evaluation working group <strong>of</strong> the Joint Planning and Development Office,<br />
Overall evaluation process and first year test plans, DRAFT 1407 EWG Plan 1-1, version 2.<br />
Kampen, A. van. (1960). Plesman. De Boer publishing company, Hilversum.<br />
Kant, I. (1781). Kritik der reinen vernunft.<br />
Keller, W., Modarres. M. (2005). A historical overview <strong>of</strong> probabilistic <strong>risk</strong> assessment<br />
development and its use in the nuclear power industry, a tribute to the late Pr<strong>of</strong>essor<br />
Norman Carl Rasmussen, Reliability Engineering and System Safety, 89, p. 271-285.<br />
Kelly, T. J. (2001). Moon Lander, Smithsonian Institution Press, Washington D.C., USA.<br />
Kemeny, J., (1979). Report <strong>of</strong> the President’s Commission on the accident at Three Mile<br />
Island, Washington D.C., USA.<br />
199
Khatwa, R., Roelen, A.L.C. (1996). An analysis <strong>of</strong> controlled-flight-into-terrain (CFIT)<br />
accidents <strong>of</strong> commercial operators, 1988 through 1994, Flight Safety Foundation, Flight<br />
Safety Digest, Vol. 15, No. 4/5, p. 1-45.<br />
Kho, M.E., Carbone, J.M., Luicas, J., Cook, D.J. (2005). Safety Climate Survey: reliability<br />
<strong>of</strong> results from a multicenter ICU survey, Quality and Safety in Health Care, 14, p. 273-<br />
288.<br />
Kingsley-Jones, M. (1997). A330-200 flight testing programme takes <strong>of</strong>f, Flight<br />
International, 20 August 1997.<br />
Kingsley-Jones, M. (2005). A380 powers on through flight-test, Flight International, 20<br />
December 2005.<br />
Kirwan, B. (1994). A practical guide to human reliability assessment, Taylor and Francis,<br />
London, UK.<br />
Kirwan, B. (2007). Safety informing design, Safety Science 45, p. 155-197.<br />
Klinect, J.R., Murray, P., Merritt, A., Helmreich, R. (2003). Line Operations Safety Audit<br />
(LOSA): Definition and operating characteristics, Proceedings <strong>of</strong> the 12th International<br />
Symposium on Aviation Psychology, Dayton, OH, USA, p. 663-668.<br />
Klinect, J.R. (2005). Line operations safety audit: a cockpit observation methodology for<br />
monitoring <strong>air</strong>line safety performance, PhD dissertation, The University <strong>of</strong> Texas, Austin,<br />
TX, USA.<br />
KLM. (2007). Continuation Training Bulletin 07/11, p. 4.<br />
Koornneef, F. (2000). Organised learning from small scale incidents, Delft University<br />
Press, Delft, the Netherlands.<br />
Kreijkamp, H.A., Veerbeek, H.W. (1997). Mid-life Update FANOMOS RLD: Reference<br />
manual version 1.0, Report <strong>NLR</strong>-CR-97386 L, National Aerospace laboratory <strong>NLR</strong>,<br />
Amsterdam<br />
Kurowicka, D., Cooke, R.M., Charitos, T., Speijker, L.J.P. (2005). ATC- wake <strong>risk</strong><br />
assessment model, Annex 1, Continuous Bayesian Belief Networks, ATC Wake, EC<br />
contract number IST-2001-34729, Deliverable d3_5b, Annex 1.<br />
Kurowicka, D., Cooke, R.M. (2004). Distribution - free continuous Bayesian Belief Nets,<br />
Proceedings <strong>of</strong> the Conference on Mathematical Methods in Reliability, Santa Fe, New<br />
Mexico, USA.<br />
K+V. (2005). Eindrapport, Veiligheidsadviescommissie Schiphol, Veiligheidsonderzoek<br />
Schiphol 2005.<br />
Labeau, P.E., Smidts, C., Swaminathan, S. (2000). Dynamic reliability: towards an<br />
integrated platform for probabilistic <strong>risk</strong> assessment, Reliability Engineering and System<br />
Safety 68, p. 219-254.<br />
200
P.S. Laplace, P.S. (1814). Essai Philosophique sure les Probabilites. Courcier, New York,<br />
English translation by F.W. Truscott and F.L. Emory, Wiley, NY, 1902.<br />
Lawson, T.W., Considine, R. (1944). Thirty seconds over Tokyo, Blue Ribbon Books,<br />
Garden City, NY, USA.<br />
Leary, W.M. (1992). Safety in the <strong>air</strong>: the impact <strong>of</strong> instrument flying and radio navigation<br />
on U.S. commercial <strong>air</strong> operations between the wars, Leary, W.M. (ed), The history <strong>of</strong> civil<br />
and commercial aviation, Vol. 1 Infrastructure and environment, Smithsonian Institution<br />
Press, Washington D.C., USA.<br />
Leege, A.P.M. de, Hörmann, H.J. (2006). Balked landing study, modelling <strong>of</strong> flare<br />
initiation altitude and determination <strong>of</strong> decrab initiation altitude, Boeing Research &<br />
Technology Europe, Madrid, Spain.<br />
Le Maitre A.S. (Ch<strong>air</strong>man). (1957). Report <strong>of</strong> Departmental Committee on Safeguarding<br />
Policy, Ministry <strong>of</strong> Transport and Civil Aviation, London, UK.<br />
Leeuw, R. de (ed). (1994). Fokker commercial <strong>air</strong>craft, Public Relations department <strong>of</strong> the<br />
N.V. Koninklijke Nederlandse Vliegtuigenfabriek Fokker.<br />
Leveson, N. (2004a). A systems-theoretic approach to safety in s<strong>of</strong>tware-intensive systems,<br />
IEEE Transactions on Dependable and Secure computing, Vol. 1, Issue 1, p. 66-86.<br />
Leveson, N. (2004b). A new accident model for engineering safer systems, Safety Science,<br />
Vol. 42, No. 4, p. 237-270.<br />
Levy, R.A. (2001). There are no new accidents - most <strong>air</strong>craft accidents preventable, Flying<br />
safety, July 2001.<br />
Lewis, H.W., Budnitz, R.J., Kouts, H.J., Lowenstein, W.B., Rowe, W.D., Von Hippel, F.,<br />
Zachariasen, F. (1979). Risk assessment review group report to the U.S. Nuclear<br />
Regulatory Commission, NUREG/CR-0400, U.S. Nuclear Regulatory Commission,<br />
Washington D.C., USA.<br />
Lin, P.H. (2007). <strong>Causal</strong> model for <strong>air</strong> <strong>transport</strong> safety: findings from the accident and<br />
incident data, in P.H. Lin and J. Klungers (eds), The research agenda <strong>of</strong> <strong>risk</strong> and design<br />
anno 2007, PhD student symposium, Faculty <strong>of</strong> Technology, Policy and Management,<br />
Delft University <strong>of</strong> Technology, Delft, the Netherlands.<br />
Lin, P.H., Hale, A.R., Gulijk, C. van, Ale, B.J.M., Roelen, A.L.C., Bellamy, L.J. (2008).<br />
Testing a Safety Management System in aviation, paper presented at the Ninth International<br />
Probabilistic Safety Assessment and Management Conference, Hong Kong.<br />
Lindbergh, C.A. (1953). The Spirit <strong>of</strong> St. Louis, Charles Scribner’s Sons, USA.<br />
Lindley, D.V. (1986). Obituary: Bruno de Finetti, 1906-1985, Journal <strong>of</strong> the Royal<br />
Statistical Society, Series A149, p. 252.<br />
Lithgow, M. (1956). Vapour Trails, Allan Wingate, London, UK.<br />
201
Lloyd, E. (1980). The development <strong>of</strong> requirements for safety assessment, Cranfield<br />
College <strong>of</strong> Aeronautics, UK.<br />
Lloyd, E., Tye, W. (1982). Systematic Safety, Civil Aviation Authority, London, UK.<br />
Loo, M. van het, Bosman, S., Vader, J., Frinking, E., Kahan, J. (1999). Berichtgeving en<br />
percepties ten aanzien van de externe veiligheid van de luchtvaart, RE-99.013, Rand<br />
Europe.<br />
Lorenz, E.N. (1993). The Essence <strong>of</strong> Chaos, Jessie and John Danz lecture, University <strong>of</strong><br />
Washington Press, Seattle, USA.<br />
Luxhøj, J.T., Choopavang, A., Arendt, D.N. (2001). Risk assessment <strong>of</strong> organizational<br />
factors in aviation systems, Air Traffic Quarterly, Vol. 9, p. 135-137.<br />
Luxhøj, J.T. (2003). Probabilistic causal analysis for system safety <strong>risk</strong> assessments in<br />
commercial <strong>air</strong> <strong>transport</strong>, paper presented at the Second Workshop on the Investigation and<br />
Reporting <strong>of</strong> Accidents and Incidents, IRIA 2003, Williamsburg, Virginia, USA.<br />
Luxhøj, J.T. (2004). Building a safety <strong>risk</strong> management system: a pro<strong>of</strong> <strong>of</strong> concept<br />
prototype, FAA/NASA Risk Analysis Workshop, Arlington, VA, USA, August 19, 2004.<br />
LVNL. (2001a). Veiligheid is niet het doel, Air Traffic Control the Netherlands.<br />
LVNL. (2001b). Evaluatie VEM rapportage UDP, version 1.0, Air Traffic Control the<br />
Netherlands.<br />
LVNL. (2002). VEM Effect Report ATM System Increment 2002, Volume 1, main<br />
document, version 1.1, Department Research & Development / Performance Analysis, Air<br />
Traffic Control the Netherlands.<br />
Lyman, E.G., Orlady, H.W. (1980). Fatigue and associated performance decrements in <strong>air</strong><br />
<strong>transport</strong> operations, NASA Contract NAS2-100060, Batelle Memorial Laboratories,<br />
Aviation Safety Reporting System ASRS, Mountain View, CA, USA.<br />
MacIntosh, R.M. (1993). Accidents show need for comprehensive ground deicing<br />
programs, Airport Operations, Vol. 19, No. 6, Flight Safety Foundation, Arlington, VA,<br />
USA.<br />
MacKinnon, R.A. (2000). Rejected Take-<strong>of</strong>f Studies, Aero magazine 11, published<br />
quarterly by Boeing Commercial Airplane Group.<br />
McRuer, D.T., Graham, D., Krendel, E.S., Reisener, W. (1965). Human pilot dynamics in<br />
compensatory system. theory, <strong>models</strong> and experiments with controlled element and forcing<br />
function variations. AFFDL-TR-65-15. Wright Patterson Air Force Base, Ohio, USA.<br />
Meltzer, M. (2007). Mission to Jupiter, a history <strong>of</strong> the Galileo project, NASA SP-2007-<br />
4231, NASA, Washington D.C., USA.<br />
Mermoz, J. (1937). Mes vols, Flammarion, France.<br />
202
MNP. (2005). Het milieu rond Schiphol, 1990 - 2010, feiten en cijfers, Milieu- en<br />
NatuurPlanbureau, Bilthoven.<br />
Molemaker, R.J., Piers, R., Adamidis, P., Cloos, B., Geest, P. van der. (2005). Impact<br />
Assessment on the extension <strong>of</strong> EASA competences to ANS, ATM and Airports, Final<br />
report, ECORYS, Rotterdam.<br />
Morales, O., Kurowicka, D., Roelen, A. (2008). Eliciting conditional and unconditional<br />
rank correlations from conditional probabilities, Reliability Engineering and System Safety,<br />
Vol. 93, Issue 5, p. 699-710.<br />
Morier, Y. (2002). NPA 11-2; Regulatory Impact Assessment Guidance, letter to NPA<br />
Distribution List, Sectorial Teams and Working Parties, reference 07/03-2-2 02-L197, Joint<br />
Aviation Authorities, Ho<strong>of</strong>ddorp, the Netherlands.<br />
Moshansky, V.P. (1992). Commission <strong>of</strong> Inquiry into the Air Ontario crash at Dryden,<br />
Ontario, Final report (Vol 1-4), Published by the Ministry <strong>of</strong> Supply and Services, Canada.<br />
Mosleh, A., Goldfeiz, E.B. (1994). An approach for assessing the impact <strong>of</strong> organisational<br />
factors on <strong>risk</strong>, Unites States Nuclear Regulatory Commission, Office <strong>of</strong> Nuclear Research,<br />
Washington D.C., USA.<br />
Mosleh, A., Dias, A., Eghbali, G., Fazen, K. (2004). An integrated framework for<br />
identification, classification and assessment <strong>of</strong> aviation system hazards. Probabilistic safety<br />
assessment and management: PSAM 7 - ESREL '04: proceedings <strong>of</strong> the 7th International<br />
Conference on Probabilistic Safety Assessment and Management, Berlin, Germany.<br />
Muller, F., Thiel, J.H. (1986). Beknopt Grieks-Nederlands Woordenboek, elfde druk,<br />
Wolters-Noordh<strong>of</strong>f, Groningen.<br />
Murata, T. (1989). Petri Nets: Properties, Analysis and Applications, Proceedings <strong>of</strong> the<br />
IEEE, Vol 77, No. 4, p. 541-580.<br />
Nater, J.P. (1983). De Uiver, glorie en tragiek in de Melbourne race, hoogtepunten uit de<br />
luchtvaarthistorie in de jaren dertig. Donker, Rotterdam.<br />
NEA/CSNI. (1999). Identification and assessment <strong>of</strong> organisational factors related to the<br />
safety <strong>of</strong> NPPs, State-<strong>of</strong>-the-art report, Volume 1, NEA/CSNI/R(99)21/VOL1, Nuclear<br />
Energy Agency, Committee on the Safety <strong>of</strong> Nuclear Installations, Le Seine St-Germain,<br />
France.<br />
Netherlands Aviation Safety Board. (1994). Aircraft Accident Report 92-11, El Al Flight<br />
1862, Boeing 747-258F, 4X-AXG, Bijlmermeer, Amsterdam, October 4, 1992, SDU<br />
Uitgeverij<br />
Netherlands Aviation Safety Board. (1996). Report <strong>of</strong> the views <strong>of</strong> the Netherlands<br />
Aviation Safety Board on the accident to Pal<strong>air</strong> Flight PMK301, Fokker 100, PH-KXL,<br />
Skopje, Republic <strong>of</strong> Macedonia, March 5, 1993, Aircraft Accident Report 93-01.<br />
203
Nijenhuis, W.A.S., Spek, F., Moeleker, P. (1996). De Lambach HL II. De geschiedenis van<br />
het origineel en de bouw van de replica, Barjesteh van Waalwijk van Doorn & Co's<br />
Uitgeversmaatschappij, Rotterdam, the Netherlands.<br />
Norris, G. (1998). 757-300 prepared for flight test, Flight International, 10 June 1998.<br />
NRC. (1975). Reactor Safety Study, WASH-1400, NUREG –751014, United States<br />
Nuclear Regulatory Commission, Washington D.C., USA.<br />
NRC. (1983). PRA Procedures guide, a guide to the performance <strong>of</strong> probabilistic <strong>risk</strong><br />
assessments for nuclear power plants, Final Report, Vol. 1-2, NUREG/CR-2300, United<br />
States Nuclear Regulatory Commission, Washington D.C., USA.<br />
NRC. (1995). Use <strong>of</strong> probabilistic <strong>risk</strong> assessment methods in nuclear regulatory activities,<br />
final policy statement, Federal register, Vol. 60, No. 158.<br />
NRC. (1998). White Paper on Risk-Informed and Performance-Based Regulation, SECY-<br />
98-144, United States Nuclear Regulatory Commission, Washington D.C., USA.<br />
NRC. (2007a). Fact Sheet, Three Mile Island accident, United States Nuclear Regulatory<br />
Commission, Washington, D.C., USA, http://www.nrc.gov/reading-rm/doccollections/fact-sheets/3mile-isle.html,<br />
NRC. (2007b). ATHEANA user’s guide, NUREG-1880, United States Nuclear Regulatory<br />
Commission, Office <strong>of</strong> Nuclear Regulatory Research, Washington, D.C., USA.<br />
NTSB. (1970). Aircraft Accident Report: Ozark Airlines, Douglas DC-9-15, N974Z, Sioux<br />
City Airport, Sioux City, Iowa, December 27, 1968, AAR-70-20, National Transportation<br />
Safety Board, Washington D.C., USA.<br />
NTSB. (1979). Aircraft Accident Report: American Airlines Inc, DC-10-10, N110AA,<br />
Chicago-O'Hare International Airport, Chicago, Illinois, May 25, 1979, AAR-79-17,<br />
National Transportation Safety Board, Washington D.C., USA.<br />
NTSB. (1982). Aircraft Accident Report: Air Florida, Inc., Boeing 737-222, N62AF,<br />
Collision with 14th Street Bridge, near Washington Nat'l Airport, Washington, DC, January<br />
13, 1982. AAR-82/08, National Transportation Safety Board, Washington. D.C., USA.<br />
NTSB. (1987). Aircraft Accident/Incident Summary Report, NTSB/AAR-87/02/SUM,<br />
National Transportation Safety Board, Washington D.C., USA.<br />
NTSB. (1988). Aircraft Accident Report: Continental Airlines, Inc., Flight 1713,<br />
McDonnell Douglas DC-9-14, N626TX, Stapleton International Airport, Denver, Colorado,<br />
November 15, 1987, AAR-88/09, National Transportation Safety Board, Washington D.C.,<br />
USA.<br />
NTSB. (1989). Aircraft Accident Report: Aloha Airlines Flight 243, Boeing 737-200,<br />
N73711, near Maui, Hawaii, April 28, 1988, AAR-89/03, National Transportation Safety<br />
Board, Washington D.C., USA.<br />
204
NTSB. (1990). Aircraft Accident Report: United Airlines Flight 232, McDonnell Douglas<br />
DC-10-40, Sioux Gateway Airport, Sioux City, Iowa, July 19, 1989, AAR-90/06, National<br />
Transportation Safety Board, Washington D.C., USA.<br />
NTSB. (1991). Aircraft Accident Report: Ryan International Airlines DC-9-15, N565PC,<br />
Loss <strong>of</strong> control on take<strong>of</strong>f, Cleveland-Hopkins International Airport, Cleveland, Ohio,<br />
February 17, 1991, NTSB/AAR-91/09, National Transportation Safety Board, Washington<br />
D.C., USA.<br />
NTSB. (1993). Aircraft Accident Report: Take-<strong>of</strong>f stall in icing conditions, US Air Flight<br />
405, Fokker F-28, N485US, LaGuardia Airport, Flushing, New York, March 22, 1992,<br />
AAR-93/02, National Transportation Safety Board, Washington D.C., USA.<br />
NTSB. (1997). Aircraft Accident Report: In-Flight Fire and Impact with Terrain, Valujet<br />
Airlines Flight 592, DC-9-32, N904VJ, Everglades, Near Miami, Florida, May 11, 1996.<br />
AAR-97/06, National Transportation Safety Board, Washington D.Cc, USA.<br />
NTSB. (2000). Aircraft Accident Report: In-flight breakup over the Atlantic Ocean Trans<br />
World Airlines Flight 800, Boeing 747-141, N93119, near East Moriches, New York July<br />
17, 1996, AAR-00/03, National Transportation Safety Board, Washington D.C., USA.<br />
NTSB. (2001). Aircraft Accident Report: Runway overrun during landing, American<br />
Airlines Flight 1420, McDonnell Douglas MD-82, N215AA, Little Rock, Arkansas, June 1,<br />
1999, AAR-01/02, National Transportation Safety Board, Washington D.C., USA.<br />
NTSB. (2002a). Aircraft Accident Report: Loss <strong>of</strong> control and impact with Pacific Ocean,<br />
Alaska Airlines flight 261, McDonnell-Douglas MD-83, N963AS, about 2.7 miles north <strong>of</strong><br />
Anacapa Island, California, January 31, 2000, AAR-02/01, National Transportation Safety<br />
Board, Washington D.C., USA.<br />
NTSB. (2002b). Aircraft Accident Brief: Southwest Airlines Flight 1455, Boeing 737-300,<br />
N668SW, Burbank, California, March 5, 2000, AAB-02/04, National Transportation Safety<br />
Board, Washington D.C., USA.<br />
NTSB. (2007). Aircraft Accident Report: Runway overrun and collision, Southwest<br />
Airlines Flight 1248, Boeing 737-7H4, N471WN, Chicago Midway International Airport,<br />
Chicago, Illinois, December 8, 2005, AAR-07/06, National Transportation Safety Board,<br />
Washington D.C., USA.<br />
O’Banion, K. (1980). Public reaction to imposed <strong>risk</strong>, paper presented at the US<br />
Environmental Protection Agency Workshop on Environmental Risk Assessment <strong>of</strong><br />
Synfuels, Alexandria, Virginia, USA.<br />
O’Conner, S., Reynolds, T. (1996). A review <strong>of</strong> <strong>air</strong>craft maintenance and dispatch,<br />
ADAMS working document ADAMS-DRA-WD.01.<br />
O’Hare, D. (2006). Cognitive functions and performance shaping factors in aviation<br />
accidents and incidents, The International Journal <strong>of</strong> Aviation Psychology, Vol. 16, nr. 2, p<br />
145-156.<br />
205
Onisko, A., Druzdzel M.J., Wasyluk, H. (1998). A probabilistic causal model for diagnosis<br />
<strong>of</strong> liver disorders. In Proceedings <strong>of</strong> the Seventh Symposium on Intelligent Information<br />
Systems (IIS-98), p. 379-387, Malbork, Poland.<br />
Onisko, A., Druzdel, M.J., Wasyluk, H. (1999). A Bayesian network model for diagnosis <strong>of</strong><br />
liver disorders, Research Report CBMI-99-27, Center for Biomedical Informatics,<br />
University <strong>of</strong> Pittsburgh.<br />
Owens, D.K., Shachter, R.D., Nease, R.F. (1997). Representation and analysis <strong>of</strong> medical<br />
decision problems with influence diagrams, Journal <strong>of</strong> Medical Decision Making, Vol 17,<br />
No. 3, p. 241-262.<br />
Papazoglou I.A., Aneziris O.N. (1999). On the quantification <strong>of</strong> the effects <strong>of</strong><br />
organisational and management factors in chemical installations. Reliability Engineering<br />
and System Safety 63, p. 33-45.<br />
Papazoglou, I.A., Bellamy, L.J., Hale, A.R., Aneziris, O.N., Ale, B.J.M., Post, J.G., Oh,<br />
J.I.H. (2003). I-Risk, development <strong>of</strong> an integrated technical and management <strong>risk</strong><br />
methodology for chemical installations, Journal <strong>of</strong> Loss Prevention in the Process<br />
Industries, Vol. 16, p. 575-591.<br />
Paté-Cornell, E., Dillon, R. (2001). Probabilistic <strong>risk</strong> analysis for the NASA Space Shuttle:<br />
a brief history and current work, Reliability Engineering and System Safety, Volume 74, p.<br />
345-352.<br />
Pearl. J. (2000a). <strong>Causal</strong>ity, Cambridge University Press, New York.<br />
Pearl. J. (2000b). The logic <strong>of</strong> counterfactuals in causal inference, Journal <strong>of</strong> the American<br />
Statistical Association, Vol. 95, No. 450, p. 428-435.<br />
Pearl, J. (2003). Statistics and causal inference: A review, Sociedad de Estadística e<br />
Investigatión Operativa, Test, Vol. 12, p. 281-345.<br />
Perrin, E., Kirwan, B., Stroup, R. (2006). A systematic model <strong>of</strong> ATM safety: the<br />
Integrated Risk Picture, paper presented at the Conference on Risk Analysis and Safety<br />
Performance in Aviation, September 19-21, 2006, Atlantic City, New Jersey.<br />
Perrow, C. (1984). Normal accidents: Living with high-<strong>risk</strong> technology, Basic Books Inc,<br />
New York.<br />
Piers, M.A., Ale, B.J.M. (2000). Policy Options for dealing with societal <strong>risk</strong> around<br />
Schiphol, <strong>NLR</strong>-CR-2000-084, RIVM nr. 610066011, <strong>NLR</strong> Amsterdam.<br />
Piers, R., Lebouille, R., Roelen, A., Smeltink, J. (2006). Safety has value! An approach for<br />
the assessment <strong>of</strong> the costs and benefits <strong>of</strong> safety measures, Second International<br />
Conference on research in Air Transport (ICRAT), Belgrade, June 24-28 2006, ICRAT<br />
Conference proceedings p. 351-355.<br />
Plas, M, van der, Luijk, C.M. van. (2005). Performance Luchtverkeersleiding schiphol,<br />
Beoordeling van het VEM Raamwerk, report 6200030001/2005, RIVM, Bilthoven, The<br />
Netherlands.<br />
206
Poot, M.J.M., Lensink, R., Brandjes, J., Dirksen, S., Buurma, L.S. (2000). Spatial patterns<br />
<strong>of</strong> bird movements on and around an <strong>air</strong>port, a case study on Eindhoven Airport 1998-99.<br />
In J. van Nugteren (ed), Proceedings <strong>of</strong> the 25 th meeting <strong>of</strong> the International Bird Strike<br />
Committee, IBSC, Amsterdam, p. 175-186.<br />
Prigogine, A. (1977). Time, structure and fluctuations, Nobel lecture, 8 December 1977.<br />
Rasmussen, J. (1983). Skills, rules, and knowledge: Signals, signs, and symbols, and other<br />
distinctions in human performance model, IEEE Transactions on Systems, Man, and<br />
Cybernetics, SMC-13(3), p. 257-266.<br />
Rasmussen, J. (1997). Risk management in a dynamic society, a modelling problem, Safety<br />
Science Vol. 27, No. 2/3, p. 183-213.<br />
Reason, J. (1990). Human Error, Cambridge University Press, New York.<br />
Reason, J. (1997). Maintenance related errors: The biggest threat to aviation safety after<br />
gravity?, in H. Soekkha (ed.) ‘Aviation Safety , Proceedings <strong>of</strong> the IASC-97 International<br />
Aviation Safety Conference VSP publishing, Utrecht, The Netherlands.<br />
Reason, J., Hollnagel, E., Paries, J. (2006). Revisiting the ‘Swiss cheese’ model <strong>of</strong><br />
accidents, EEC note no. 13/06, Eurocontrol Experimental Centre, Brétigny-sur-Orge,<br />
France.<br />
Reich, P.G. (1966a). Analysis <strong>of</strong> long range <strong>air</strong> traffic systems, separation standards - I,<br />
Journal <strong>of</strong> the Institute <strong>of</strong> Navigation, Vol. 19, Nr. 1, p. 88-89.<br />
Reich, P.G.(1966b). Analysis <strong>of</strong> long range <strong>air</strong> traffic systems, separation standards - II,<br />
Journal <strong>of</strong> the Institute <strong>of</strong> Navigation, Vol. 19, Nr. 2, p. 169-186.<br />
Reich, P.G. (1966c). Analysis <strong>of</strong> long range <strong>air</strong> traffic systems, separation standards - III,<br />
Journal <strong>of</strong> the Institute <strong>of</strong> Navigation, Vol. 19, Nr. 3, p. 331-347.<br />
RGCSP. (1995). A Review <strong>of</strong> Work on Deriving a Target Level <strong>of</strong> Safety (TLS) for Enroute<br />
Collision Risk, Review <strong>of</strong> the General Concept on Separation Panel Working Group<br />
A, Brussels, 1st – 12th May, 1995 RGCSP-WG/A-WP/8.<br />
RLD. (1996). Safety Policy Report Civil Aviation, Ministry <strong>of</strong> Transport, Public Works and<br />
Watermanagement, Directorate General <strong>of</strong> Civil Aviation, The Hague.<br />
RMI. (2003). Regeling Milieu-informatie Luchthaven Schiphol, Staatscourant 18 februari<br />
2003, nr. 34, page 15.<br />
Roelen, A.L.C., Lynch, R.E., Statler, I.C. (1998). KLM Royal Dutch Airlines user needs<br />
study for the Aviation Performance Measurement System, <strong>NLR</strong> CR 97545, National<br />
Aerospace Laboratory <strong>NLR</strong>, Amsterdam.<br />
Roelen, A.L.C., Bellamy, L.J., Hale, A.R., Molemaker, R.J., Paassen, M.M. van. (2000a).<br />
Feasibility <strong>of</strong> the development <strong>of</strong> a causal model for the assessment <strong>of</strong> third party <strong>risk</strong><br />
207
around <strong>air</strong>ports, Part 1: Main report, <strong>NLR</strong>-CR-2000-189-PT-1, National Aerospace<br />
Laboratory <strong>NLR</strong>, Amsterdam.<br />
Roelen, A.L.C., Bellamy, L.J., Hale, A.R., Molemaker, R.J., Paassen, M.M. van. (2000b).<br />
Feasibility <strong>of</strong> the development <strong>of</strong> a causal model for the assessment <strong>of</strong> third party <strong>risk</strong><br />
around <strong>air</strong>ports, Part 3: Modelling methodologies/techniques, <strong>NLR</strong>-CR-2000-189-PT-3,<br />
National Aerospace Laboratory <strong>NLR</strong>, Amsterdam.<br />
Roelen, A.L.C., Pikaar, A.J., Ovaa, W. (2000c). An analysis <strong>of</strong> the safety performance <strong>of</strong><br />
<strong>air</strong> cargo operators, <strong>NLR</strong>-TP-2000-210, National Aerospace Laboratory <strong>NLR</strong>, Amsterdam.<br />
Roelen, A.L.C., Wever, R., Cooke, R.M., Lopuhaä, R., Hale, A.R., Goossens, L.H.J.,<br />
Simons, M., Valk, P.J.L. (2002). <strong>Causal</strong> modelling <strong>of</strong> <strong>air</strong> safety, Demonstration model,<br />
<strong>NLR</strong>-CR-2002-662, National Aerospace Laboratory <strong>NLR</strong>, Amsterdam.<br />
Roelen, A.L.C., Wever, R., Verbeek, M.J. (2003). Improving aviation safety by better<br />
understanding and handling <strong>of</strong> interfaces, A pilot study, <strong>NLR</strong>-CR-2004-025, National<br />
Aerospace Laboratory <strong>NLR</strong>, Amsterdam.<br />
Roelen, A.L.C. (2004). A description <strong>of</strong> main safety affecting interface problems between<br />
different aviation disciplines, <strong>NLR</strong>-CR-2004-398, National Aerospace Laboratory <strong>NLR</strong>,<br />
Amsterdam.<br />
Roelen, A.L.C., Wever, R. (2004). A causal model <strong>of</strong> a rejected take-<strong>of</strong>f, <strong>NLR</strong>-CR-2004-<br />
039, National Aerospace Laboratory <strong>NLR</strong>, Amsterdam.<br />
Roelen, A.L.C., Cooke, R.M., Goossens L.H.J. (2004a). An assessment <strong>of</strong> the validity <strong>of</strong><br />
expert judgement techniques and their application at Air Traffic Control the Netherlands,<br />
<strong>NLR</strong>-CR-2004-360, National Aerospace Laboratory <strong>NLR</strong>, Amsterdam.<br />
Roelen, A.L.C., Wever, R., Cooke, R.M., Lopuhaä, R., Hale, A.R., Goossens, L.H.J.,<br />
Simons, M., Valk, P.J.L. 2004b. <strong>Causal</strong> modeling using Bayesian belief nets for integrated<br />
safety at <strong>air</strong>ports, Risk Decision and Policy, Vol 9, number 3, p. 207-222.<br />
Roelen, A.L.C., Wever, R. (2005a). Accident scenarios for an integrated aviation safety<br />
model, <strong>NLR</strong>-CR-2005-560, National Aerospace Laboratory <strong>NLR</strong>, Amsterdam.<br />
Roelen, A.L.C., Wever, R. (2005b). An analysis <strong>of</strong> flight crew response to system failures,<br />
paper presented at the 2005 seminar <strong>of</strong> the International Society <strong>of</strong> Air Safety Investigators,<br />
ISASI 2005, September 12-17, Fort Worth, Texas, USA.<br />
Roelen, A.L.C., Bos, T.J.J., Modiri, B. (2006a). Aircraft maintenance program<br />
development needs improvement; An analysis <strong>of</strong> the maintenance program development<br />
process and its effect on safety for large <strong>transport</strong> <strong>air</strong>craft in commercial service, <strong>NLR</strong>-CR-<br />
2006-351, National Aerospace Laboratory <strong>NLR</strong>, Amsterdam.<br />
Roelen, A.L.C., Van Doorn, B.A., Smeltink, J.W., Verbeek, M.J., Wever, R. (2006b).<br />
Quantification <strong>of</strong> Event Sequence Diagrams for a causal <strong>risk</strong> model <strong>of</strong> commercial <strong>air</strong><br />
<strong>transport</strong>, <strong>NLR</strong>-CR-2006-520, National Aerospace Laboratory <strong>NLR</strong>, Amsterdam.<br />
208
Roelen, A.L.C., Van Baren, G.B., Smeltink, J.W., Lin, P.H., Morales, O. (2007). A generic<br />
flight crew performance model for application in a causal model <strong>of</strong> <strong>air</strong> <strong>transport</strong>, <strong>NLR</strong>-CR-<br />
2007-562, <strong>NLR</strong> Amsterdam.<br />
Roelen, A.L.C. (2008). Presentation for CATS group <strong>of</strong> experts, 14 January 2008, Victoria<br />
Hotel, Amsterdam.<br />
Roelen, A.L.C., Wever, R, Mosleh, A, Growth, K. (2008). Development and validation <strong>of</strong> a<br />
comprehensive hybrid causal model for safety assessment and management <strong>of</strong> aviation<br />
systems, ninth International Probabilistic Safety Assessment and Management Conference,<br />
PSAM 9, Hong Kong, China.<br />
Rogers, W.P. (1986). Report <strong>of</strong> the Presidential Commission on the Space Shuttle<br />
Challenger Accident.<br />
Rotundo, L.C. (1994). Into the unknown: the X-1 Story, Smithsonian Institution Press,<br />
Washington D.C., USA.<br />
Rouvroye, J.L., Bliek, E.G. van den. (2002). Comparing safety analysis techniques,<br />
Reliability Engineering and System Safety, Vol. 75, No. 3, p. 289-294<br />
SAE. (2003). Safety Assessment <strong>of</strong> Transport Airplanes in Commercial Service, SAE ARP<br />
5150, proposed draft 2003-03-04, Society <strong>of</strong> Automotive Engineers, Aerospace Standards<br />
Development and Research Division, Warrendale, PA, USA.<br />
Sarter, N.B., Woods, D.D. (1995). “How the world did we ever get into that mode?” Mode<br />
error and awareness in supervisory control, Human Factors, 37 (1), p. 5-19.<br />
Schatzberg, E. (1994). Ideology and technical choice: the decline <strong>of</strong> the wooden <strong>air</strong>plane in<br />
the United States, 1920-1945. Technology and Culture, Vol. 35, No. 1, p. 34-69.<br />
Schiphol Group. (2007). Facts and Figures 2006, published by Schiphol Group Corporate<br />
Communications, Schiphol, the Netherlands.<br />
Shayler, D.J. (2000). Disasters and accidents in manned spaceflight, Springer-Praxis,<br />
Chichester, UK.<br />
Simons, M., Valk, P.J.L. (1993). Review <strong>of</strong> human factors problems related to long<br />
distance and long endurance operation <strong>of</strong> <strong>air</strong>craft. NATO-AGARD CP-547: Recent<br />
Advances in Long Range and Long Endurance Operation <strong>of</strong> Aircraft. Neuilly sur Seine:<br />
NATO-AGARD. p. 15/1-15/9.<br />
Simons, M., Valk, P.J.L., de Ree, J.J.D., Veldhuijzen van Zanten, O.B.A., D'Huyvetter, K.<br />
(1994). Quantity and quality <strong>of</strong> onboard and layover sleep: effects on crew performance<br />
and alertness. Report RD-31-94. Netherlands Aerospace Medical Centre, Soesterberg.<br />
Simons, M., Valk, P.J.L. (1997). Effects <strong>of</strong> a Controlled Rest on the Flight Deck on Crew<br />
Performance and Alertness. Report: <strong>NLR</strong>GC 1997-B3. Netherlands Aerospace Medical<br />
Centre, Soesterberg.<br />
209
Simons, M., Valk, P.J.L. (1998). Early starts: effects on sleep, alertness and vigilance.<br />
AGARD-CP-599; NATO-AGARD, Neuilly-sur-Seine, France. p. 6/1-6/5.<br />
Sinha, N.K. (2002). Environmental and runway surface conditions during friction tests at<br />
North Bay Airport: January - February 2002, TP 14158E, Transport Canada, Montreal,<br />
Canada.<br />
Slovic, P., Fischh<strong>of</strong>f, B., Lichtenstein, S. (1976). Cognitive processes and societal <strong>risk</strong><br />
taking. In J. S. Carroll and J. W. Payne (Eds.), Cognition and social behavior, p. 165-184,<br />
Erlbaum, Potomac, MD, USA.<br />
Smith, N.M., Lee, P.U., Prevot, T., Mercer, J., Palmer, E.A., Battiste, V., Johnson, W.<br />
(2004). A Human-in-the-loop Evaluation <strong>of</strong> Air-Ground Trajectory Negotiation. AIAA 4th<br />
Aviation Technology, Integration, and Operations Forum, Chicago, Illinois, USA.<br />
SP. (1999). SP wil opheldering over laagvliegend toestel boven woonwijk,<br />
Nieuwsberichten 09-08-1999, www.sp.nl.<br />
Stallen, P.J., Hudson, P. (2006). Publieke communicatie over luchtvaartveiligheid,<br />
VACS/06.01.04.<br />
Stamatelatos, M. (2002). Probabilistic <strong>risk</strong> assessment procedures guide for NASA<br />
managers and practitioners, Version 1.1.<br />
Starmer, G.A., Mascord, D.J., Tattam, B., Vine, J.H., Watson, T.R. (1994). The effects <strong>of</strong><br />
single acute therapeutic doses <strong>of</strong> Dexchlorpheniramine, alone and in combination with<br />
alcohol, on human performance in driving related tests: Exploration <strong>of</strong> the relationships<br />
between performance imp<strong>air</strong>ment and blood concentrations <strong>of</strong> Dexchlorpheniramine and<br />
Alcohol, Consultant Report CR 1/94, Roads and Traffic Authority, Road Safety Bureau,<br />
Australia.<br />
State <strong>of</strong> California. (2002). California Airport Land Use Planning Handbook, 2002. State <strong>of</strong><br />
California, Department <strong>of</strong> Transportation, Division <strong>of</strong> Aeronautics.<br />
Stephenson A.G. (ch<strong>air</strong>man), (1999). Mars Climate Orbiter Mishap Investigation Board<br />
Phase 1 Report. National Aeronautics and Space Administration, Washington D.C., USA.<br />
Stevens, S.S. (1946). On the theory <strong>of</strong> scales <strong>of</strong> measurement, Science, Vol. 103, No. 2684,<br />
p. 677-680.<br />
Stroeve, S.H., Bakker, G.J., Blom, H.A.P. (2007). Safety <strong>risk</strong> analysis <strong>of</strong> runway incursion<br />
alert systems in the tower and cockpit by multi-agent systemic accident modelling, ATM<br />
2007, 7 th USA/Europe ATM R&D seminar, Barcelona, Spain.<br />
Strotz, R.H., Wold, H.O.A. (1960). <strong>Causal</strong> <strong>models</strong> in the social sciences. Econometrica, 28,<br />
p 417-427.<br />
Sutter, J., Spenser, J. (2006). 747: Creating the World's first Jumbo Jet and other adventures<br />
from a life in aviation. Smithsonian Books, Washington D.C., USA.<br />
210
Svedung, I., Rasmussen, J. (2002). Graphic representation <strong>of</strong> accident scenarios: mapping<br />
system structure and the causation <strong>of</strong> accidents. Safety Science, Vol. 40, p. 397-417.<br />
Swain, A.D., Guttmann, H.E. (1983). Handbook <strong>of</strong> human reliability analysis with<br />
emphasis on nuclear power plant applications, Final report, NUREG/CR-1278-F, SAND80-<br />
0200, Sandia National Laboratories, Albuquerque, NM, USA.<br />
Swaminathan, S., Smidts, C. (1999). The event sequence diagram framework for dynamic<br />
probabilistic <strong>risk</strong> assessment, Reliability Engineering and System Safety, 63, p. 73-90.<br />
Swiss Re. (1996). High volatility in aviation insurance: are premium rates due for a<br />
nosedive?, Sigma, No. 1/1996, Swiss Reinsurance Company, Zurich, Switzerland.<br />
Taylor, B.N. (Ed.). (1995). Guide for the Use <strong>of</strong> the International System <strong>of</strong> Units (SI),<br />
National Institute <strong>of</strong> Standards and Technology (NIST) Special Publication 811, 1995<br />
Edition, U.S. Government Printing Office, Washington D.C., USA.<br />
Taylor. B.N. (Ed.). (2002). The International System <strong>of</strong> Units (SI), National Institute <strong>of</strong><br />
Standards and Technology (NIST) Special Publication 330, 2001 Edition, U.S. Government<br />
Printing Office, Washington D.C., USA.<br />
Thompson, M.O. (2000). Flight research: problems encountered and what they should teach<br />
us. Monographs in Aerospace History, number 22, NASA SP-2000-4522, NASA,<br />
Washington D.C., USA.<br />
Tiemeyer, B. (2003). Reduced vertical separation minimum (RVSM): pre- and postimplementation<br />
safety cases, in Bedford, T and Van Gelder, P.H.A.J.M (eds), Safety and<br />
Reliability, A.A. Balkema publishers, Lisse, the Netherlands.<br />
Transport Canada. (2004). Overview <strong>of</strong> the Joint Winter Runway Friction Measurement<br />
Program, TP 13361, Transport Canada, Montreal, Canada.<br />
TSB. (2007). Aviation Investigation Report A05H0002, Runway Overrun And Fire, Air<br />
France Airbus A340-313 F-GLZQ, Toronto/Lester B. Pearson International,Airport,<br />
Ontario, 02 August 2005 Transportation Safety Board <strong>of</strong> Canada, Gatineau, Quebec,<br />
Canada.<br />
Tweede Kamer. (1983). Integrale Nota LPG, Tweede Kamer der Staten General,<br />
vergaderjaar 1983-1984, 18233 nrs 1-2, SDU, Den Haag, the Netherlands.<br />
Tweede Kamer. (2001). Planologische Kernbeslissing Vijfde Nota ruimtelijke ordening,<br />
deel 3: kabinetsstandpunt, Tweede Kamer der Staten-Generaal, vergaderjaar 2001-2002, 27<br />
578, nr 5, SDU, Den Haag, the Netherlands.<br />
Tweede Kamer. (2003a). Vaststelling van de begrotingsstaat van het Ministerie van<br />
Verkeer en Waterstaat (XII) voor het jaar 2004, Verslag houdende een lijst van vragen en<br />
antwoorden, Tweede Kamer, vergaderjaar 2003-2004, 29 200 XII, nr. 10, SDU, Den Haag,<br />
the Netherlands.<br />
211
Tweede Kamer. (2003b). Toekomst van de nationale luchthaven, lijst van vragen en<br />
antwoorden, Tweede Kamer der Staten-Generaal, vergaderjaar 2003-2004, 26959, nr. 54,<br />
SDU, Den Haag, the Netherlands.<br />
Tweede Kamer. (2003c). Motie van de leden Samsom en Duyvendak, voorgesteld 25<br />
november 2003, Tweede Kamer der Staten-Generaal, vergaderjaar 2003-2004, 26959, nr.<br />
55, SDU, Den Haag, the Netherlands.<br />
Tweede Kamer. (2005). Vragen van de leden Koopmans en Haverkamp (beiden CDA) aan<br />
de staatssecretaris van Verkeer en Waterstaat over een incident met een vliegtuig van Onur<br />
Air. (Ingezonden 12 mei 2005); Antwoord. Aanhangsel van de handelingen, Tweede<br />
Kamer der Staten-Generaal, Vergaderjaar 2004-2005, 23125, nr. 1749, SDU, Den Haag, the<br />
Netherlands.<br />
UKOOA. (1999). A framework for <strong>risk</strong>-related decision support. UK Offshore Operators<br />
Association, London, UK.<br />
USAir. (1997). Fokker 100 Pilot’s Handbook. US Airways, Flight Publications Department<br />
Pittsburgh, PA, USA.<br />
VACS. (2003a). Inhoudelijke rapportage projectgroep, VACS/03.04.21a.<br />
VACS. (2003b). Advies <strong>Causal</strong>e modellering en groepsrisico, VACS/03.08.33.<br />
Valk, P.J.L., Simons, M. (1994). Aircrew and Hypnotics: Residual effects <strong>of</strong> temazepam<br />
and brotizolam on performance. Report <strong>NLR</strong>GC 1994-K8. Netherlands Aerospace Medical<br />
Centre, Soesterberg.<br />
Valk, P.J.L., Simons, M. (1996). Effects <strong>of</strong> early reporting times and irregular work<br />
schedules on sleep, alertness, and performance <strong>of</strong> pilots engaged in short-haul operations<br />
Report: <strong>NLR</strong>GC 1996-B2. Netherlands Aerospace Medical Centre, Soesterberg.<br />
Valk, P.J.L., Simons, M., Struyvenberg, P.A.A., Kruit, J., Van Berge Henegouwen, M.<br />
(1997). Effects <strong>of</strong> a single dose <strong>of</strong> loratadine on flying ability under conditions <strong>of</strong> simulated<br />
cabin pressure. American Journal <strong>of</strong> Rhinology, 11(1), p. 27-33.<br />
Valk, P.J.L., Simons, M. (1998). Pros and cons <strong>of</strong> strategic napping on long haul flights.<br />
AGARD-CP-599; NATO-AGARD, Neuilly-sur-Seine, France, p. 5/1-5/5.<br />
Valk, P.J.L., Roon, D.B. van, Simons, M. (1999). Effects <strong>of</strong> an alcohol hangover on<br />
performance and alertness. Report 1999-B2. Netherlands Aeromedical Institute,<br />
Soesterberg, The Netherlands.<br />
Vesely, W.E., Goldberg, F.F., Roberts, N.H., Haasl, D.F. (1981). Fault Tree Handbook,<br />
NUREG-0492, U.S. Nuclear Regulatory Commission, Washington D.C., USA.<br />
Visser, H.C. (1997). If I were a rich man ... my accident record wouldn’t be so bad!, in H.<br />
Soekkha (ed.), ‘Aviation Safety , Proceedings <strong>of</strong> the IASC-97 International Aviation Safety<br />
Conference VSP publishing, Utrecht, the Netherlands.<br />
212
Von Thaden, T.L., Wiegmann, D.A., Mitchell, A.A., Sharma, G., Zhang, H. (2003). Safety<br />
culture in a regional <strong>air</strong>line, results from an aviation safety survey, 12 th international<br />
symposium on Aviation Psychology, Dayton, Ohio, USA.<br />
Vos, P.R. (1996). The development <strong>of</strong> a relational database, based on <strong>air</strong>line timetables, to<br />
solve the denominator problem for aviation safety, Memorandum M-793, Faculty <strong>of</strong><br />
Aerospace Engineering, Delft University <strong>of</strong> Technology, Delft.<br />
Waveren, R.H. van, Groot, S., Scholten, H., Geer, F.H. van, Wösten, J.H.M., Kroeze, R.D.,<br />
Noort, J.J. (1999). Good modelling practice handbook, STOWA report 99-05, Dutch<br />
Department <strong>of</strong> Public Works, Institute for inland water management and waste water<br />
treatment, Lelystad, the Netherlands.<br />
Wertheimer, N., Leeper, E. (1979). Electrical wiring configurations and childhood cancer,<br />
American Journal <strong>of</strong> Epidemiology, nr. 109, p. 273-284.<br />
Wever, R., Karwal, A.K., Smit, H.H. (2006). The Lugano Aeronautical Study, Safety<br />
assessment <strong>of</strong> the <strong>of</strong>fset steep approach procedures, <strong>NLR</strong>-CR-2006-038, National<br />
Aerospace Laboratory <strong>NLR</strong>, Amsterdam.<br />
Wewerinke, P.H. (1989). Models <strong>of</strong> the human observer and controller <strong>of</strong> a dynamic<br />
system, Ph.D. Thesis, Delft University <strong>of</strong> Technology.<br />
Wiegman, D., Shappell, S. (2001). A human error analysis <strong>of</strong> commercial aviation<br />
accidents using the Human Factors Analysis and Classification System (HFACS).<br />
DOT/FAA/AM-01/3, Federal Aviation Administration, Washington D.C., USA.<br />
Wolfe, T. (1979). The right stuff. Farrar, Straus and Giroux, New York, USA.<br />
Wright, L.B. (2006). A PROMISE for improvement, the ProRail management information<br />
for safety and environment database, paper presented at the 3 rd International Conference<br />
‘Working on Safety’, 12-15 September 2006, Zeewolde, the Netherlands.<br />
Yeager, C.E., Janos, L. (1985). Yeager, Bantam Books, New York, USA.<br />
Zaidel, D.W., Cohen., J.A. (2005). The face, beauty and symmetry: perceiving asymmetry<br />
in beautiful faces International Journal <strong>of</strong> Neuroscience, Nr 155, p. 1165-1173.<br />
213
Summary<br />
Aviation safety is so well developed that individual organisations cannot rely on the<br />
number <strong>of</strong> accidents as useful indicators <strong>of</strong> the safety level <strong>of</strong> their operation. Adequate<br />
control <strong>of</strong> <strong>risk</strong>s requires the availability <strong>of</strong> a method to determine the level <strong>of</strong> safety as a<br />
function <strong>of</strong> the current status and <strong>of</strong> proposed or expected changes to the aviation system.<br />
Aviation safety policy plans have therefore proposed the development <strong>of</strong> causal <strong>risk</strong><br />
<strong>models</strong>. Unfortunately however, they failed to specify or even describe such <strong>models</strong> other<br />
than in the most general <strong>of</strong> terms. <strong>Causal</strong> model development was stated as a goal in itself,<br />
without consideration <strong>of</strong> how such a model should be used. The objective <strong>of</strong> this thesis is to<br />
clarify these issues by comparing user requirements with the performance that can be<br />
delivered by various modelling techniques. The thesis answers the question what causal<br />
<strong>risk</strong> modelling adds to current safety management approaches and what the criteria are for<br />
ensuring it makes a successful contribution to safety. Experience gained in several causal<br />
model development projects (particularly for the Federal Aviation Administration and the<br />
Dutch Ministry <strong>of</strong> Transport and Water Management) are used to illustrate how a causal<br />
model should and should not be developed and used.<br />
Chapter 2 describes what we mean with the term ‘safety’ and in what ways it can be<br />
expressed. The most relevant theories on accident causation are described, emphasizing the<br />
role <strong>of</strong> ‘normal’ occurrences in the accident sequence. These normal occurrences should<br />
therefore be correctly represented in a causal model. The influence <strong>of</strong> human behaviour and<br />
<strong>of</strong> organisations is also important and should be represented adequately.<br />
Chapter 3 delves deeper into causality and the difference between causality and association.<br />
From this it follows that cause-effect relations can only be substantiated from specific<br />
knowledge on the mechanisms <strong>of</strong> the system. This means that substantial knowledge <strong>of</strong> the<br />
aviation system is a prerequisite for the development <strong>of</strong> a causal <strong>risk</strong> model for <strong>air</strong><br />
<strong>transport</strong>. To avoid confusion between singular and generic causal relations, a causal <strong>risk</strong><br />
model should represent success scenarios as well as failure scenarios. <strong>Causal</strong> chains never<br />
really end, in practice a useful criterion for the extent <strong>of</strong> a causal <strong>risk</strong> model is that it will<br />
have to include decisions and actions up to the highest managerial level <strong>of</strong> the actors that<br />
are directly involved.<br />
Requirements from potential users <strong>of</strong> a causal <strong>risk</strong> model for <strong>air</strong> <strong>transport</strong> are the subject <strong>of</strong><br />
Chapter 4. A short overview <strong>of</strong> the history <strong>of</strong> aviation safety shows that the current level <strong>of</strong><br />
safety is so high that the mechanisms that previously resulted in continuous safety<br />
improvement do not work anymore. Because each <strong>of</strong> the potential users <strong>of</strong> a causal <strong>risk</strong><br />
model (<strong>air</strong>lines, <strong>air</strong> navigation service providers, <strong>air</strong>ports organisations, maintenance and<br />
rep<strong>air</strong> stations, <strong>air</strong>craft manufacturers and aviation authorities) can influence safety in a<br />
different way and each has different drivers for improving safety, some <strong>of</strong> the user<br />
requirements are not compatible. The most important general requirements are that the<br />
model should represent to complete <strong>air</strong> <strong>transport</strong> system including dependencies, that the<br />
model should properly represent the influence <strong>of</strong> the human operator and <strong>of</strong> organisations,<br />
that the model is validated and produces quantitative and reproducible results, that the<br />
214
model representation is transparent and that the model is able to represent current as well as<br />
future accident scenarios.<br />
Chapter 5 demonstrates with some practical examples how safety analyses are currently<br />
conducted. The approach followed in each example is compared to the user requirements<br />
that were derived in Chapter 4. This provides an even better insight into the performance<br />
that is required for a causal model in order to have added benefits compared to current<br />
approaches. From this chapter it follows that currently there is no standardised procedure<br />
for conducting safety analyses, each time it is performed differently. Available results from<br />
previous analyses are not fully utilised and results rely heavily on expert judgement. None<br />
<strong>of</strong> the examples fulfils all the user requirements that have been derived in Chapter 4. An<br />
effort to develop a method that meets these criteria therefore seems fully justified.<br />
<strong>Causal</strong> <strong>risk</strong> modelling is applied for management <strong>of</strong> safety in industries other than <strong>air</strong><br />
<strong>transport</strong>. Chapter 6 gives an overview <strong>of</strong> how causal <strong>risk</strong> <strong>models</strong> are being applied in the<br />
nuclear power industry, manned spaceflight, <strong>of</strong>fshore industry, process industry, rail<br />
<strong>transport</strong> and health care and it discusses the lessons than can be learned with respect to<br />
development and application <strong>of</strong> similar <strong>models</strong> in <strong>air</strong> <strong>transport</strong>. Initially there was<br />
resistance against the application <strong>of</strong> <strong>risk</strong> <strong>models</strong> in the nuclear power industry, manned<br />
spaceflight, <strong>of</strong>fshore industry and process industry, but catastrophic accidents led to<br />
regulatory changes that forced the industry to use probabilistic <strong>risk</strong> methods. Development<br />
<strong>of</strong> <strong>models</strong> and methods that were considered acceptable required a lot <strong>of</strong> time. Based on<br />
these experiences it can be expected that the introduction <strong>of</strong> causal <strong>risk</strong> model in <strong>air</strong><br />
<strong>transport</strong> will be similarly jerkily and it could take decades before the industry has fully<br />
accepted the use <strong>of</strong> quantitative <strong>risk</strong> <strong>models</strong>. It is essential to state from the outset that the<br />
<strong>models</strong> should be used as a complement rather than as a replacement <strong>of</strong> current practice.<br />
Several techniques are available for model representation and calculations. The most<br />
commonly applied techniques (fault trees, event trees, Bayesian belief nets and Petri-nets)<br />
and their characteristics are described in Chapter 7. Fault trees and event trees have the<br />
important advantage <strong>of</strong> simplicity. This makes them transparent but the areas <strong>of</strong> application<br />
are limited. Bayesian belief nets are better suited for the representation <strong>of</strong> ‘s<strong>of</strong>t’ influences,<br />
but as a drawback are less transparent. Petri-nets can also represent dynamic situations but<br />
are even less transparent. The conclusion <strong>of</strong> this chapter is that a combination <strong>of</strong> techniques<br />
should be applied, e.g. with fault trees and event trees for the representation <strong>of</strong> the<br />
uppermost level <strong>of</strong> the model (the part which is directly visible to the user), while Bayesian<br />
belief nets and perhaps also Petri-nets should be applied, where necessary, for the correct<br />
representation <strong>of</strong> details.<br />
The ability to provide quantitative results is one <strong>of</strong> the requirements <strong>of</strong> a causal <strong>risk</strong> model.<br />
Quantification is the subject <strong>of</strong> Chapter 8. One <strong>of</strong> the problems in modelling is finding the<br />
right units, specifically if the influence <strong>of</strong> complex factors like safety culture, safety<br />
management or non-technical pilot skills must be expressed. The credibility <strong>of</strong> the model<br />
depends on the model structure and the sources used for quantification. Important sources<br />
<strong>of</strong> information are accident investigation reports and incident reporting systems <strong>of</strong> <strong>air</strong>lines.<br />
Results from empirical studies can sometimes also be used. If correctly elicited, expert<br />
opinion can <strong>of</strong>fer a quite acceptable accuracy <strong>of</strong> quantification. In addition to information<br />
on accidents and incidents, information on normal operations is required to determine the<br />
relative influence <strong>of</strong> causal factors. Flight data recorders can be an important source <strong>of</strong> this<br />
information. To use the information from existing data bases as efficiently as possible, it is<br />
important that definitions and descriptions <strong>of</strong> model elements match with those used in<br />
215
existing data bases. Preferably the model should conform to the definitions used in<br />
ECCAIRS, the European standard for incident reporting, but this also requires that some <strong>of</strong><br />
the current problems <strong>of</strong> ECCAIRS are resolved.<br />
The biggest difficulties are to be expected in representing the influences <strong>of</strong> the human<br />
operator, management and the organisation, and the many dependencies between model<br />
elements. These problems and possible solutions are discussed in Chapter 9. Solutions are<br />
the application <strong>of</strong> Bayesian belief nets for representing ‘s<strong>of</strong>t’ influences and dependencies<br />
and also the definition <strong>of</strong> a limited number (33) <strong>of</strong> archetype accidents. These archetype<br />
accidents can be the backbone <strong>of</strong> a causal <strong>risk</strong> model. The human operator can be<br />
represented in the model by means <strong>of</strong> a Bayesian belief net, while the influence <strong>of</strong><br />
management on human performance can be represented by means <strong>of</strong> generic ‘delivery<br />
systems’.<br />
Chapter 10 addressed the possibilities for validating a causal <strong>risk</strong> model. Full validation is<br />
not possible due to the complexity <strong>of</strong> the <strong>air</strong> <strong>transport</strong> system, but limited validation <strong>of</strong><br />
model components is feasible. Some examples are provided in the chapter.<br />
Conclusions <strong>of</strong> this thesis, presented in Chapter 11, are that current drivers for safety<br />
improvement fall short to bring about further safety improvements. A method for safety<br />
assessment and safety analysis is required that is not solely based on accident frequencies,<br />
provides a quantified accident probability and is able to properly represent the complex<br />
arrangements within the <strong>air</strong> <strong>transport</strong> system, including human and organisational<br />
influences. The method should be transparent and yield reproducible and demonstrable<br />
valid results. Using a causal <strong>risk</strong> model as described in this thesis is able to meet those<br />
requirements and therefore is a method to identify safety improvement opportunities that<br />
will not be obtained with the current methods. Developing a causal <strong>risk</strong> model for aviation<br />
is not overly difficult; it is just a lot <strong>of</strong> work. And the majority <strong>of</strong> this work will have to be<br />
conducted by people with sufficient background knowledge <strong>of</strong> <strong>air</strong> <strong>transport</strong>. Representing<br />
the complexity <strong>of</strong> the <strong>air</strong> <strong>transport</strong> system in a causal <strong>risk</strong> model requires numerous<br />
assumptions, each <strong>of</strong> which can be challenged. The causal <strong>risk</strong> model can only be a success<br />
if these assumptions are agreed upon by all parties involved, and the <strong>air</strong> <strong>transport</strong> regulator<br />
is the appropriate lead in this process. Preferably this should be an international regulator<br />
like EASA or ICAO. They should initiate and lead the process to come to an industry<br />
standard model and to agree on how and when to apply this model. For further development<br />
<strong>of</strong> a causal <strong>risk</strong> model <strong>of</strong> <strong>air</strong> <strong>transport</strong>, it is essential to link the model directly to an accident<br />
and incident data system, preferably ECCAIRS. Feedback from the modellers to the<br />
potential users and vice versa is required to get a better grip on user requirements. The<br />
modellers should indicate possibilities and limitations <strong>of</strong> the model, and should come-up<br />
with real-life examples <strong>of</strong> cases in which a causal <strong>risk</strong> model would be a helpful tool. This<br />
will have to be an iterative process. Support from the industry is essential to provide data<br />
and insight, to the model developers, into operational aviation processes.<br />
216
Samenvatting<br />
Luchtvaartveiligheid is zo goed ontwikkeld dat voor individuele organisaties het aantal<br />
ongevallen geen goede indicator is voor de veiligheid. Voor adequate risicobeheersing is<br />
een methode vereist waarmee het veiligheidsniveau als functie van de huidige status en van<br />
voorgestelde <strong>of</strong> te verwachten veranderingen van het luchtvaartsysteem kan worden<br />
vastgesteld. In plannen voor luchtvaartveiligheidsbeleid is daarom de ontwikkeling van<br />
causale risicomodellen voorgesteld. Helaas worden deze modellen in de beleidsplannen niet<br />
verder gespecificeerd <strong>of</strong> beschreven anders dan in zeer algemene termen. Ontwikkeling van<br />
een causaal model is als een doel op zich gesteld, zonder aandacht voor het gebruik van<br />
zulke modellen. Het doel van dit proefschrift is hier helderheid in te verschaffen door<br />
gebruikerseisen te vergelijken met de prestaties die met verschillende modelleertechnieken<br />
kunnen worden bereikt. Het proefschrift beantwoordt de vraag wat causale risicomodellen<br />
kunnen toevoegen aan de huidige benadering voor veiligheidsmanagement and wat de<br />
criteria zijn om te verzekeren dat de bijdrage van causale modellen aan veiligheid succesvol<br />
is. Ervaringen opgedaan in verschillende projecten voor de ontwikkeling van een causaal<br />
risicomodel (in het bijzonder voor de Federal Aviation Administration en het Nederlandse<br />
Ministerie van Verkeer en Waterstaat) worden gebruikt ter illustratie van hoe een causaal<br />
model wel <strong>of</strong> niet ontwikkeld en toegepast dient te worden.<br />
Ho<strong>of</strong>dstuk 2 beschrijft wat we verstaan onder het begrip ‘veiligheid’ en op welke manier dit<br />
kan worden uitgedrukt. Er wordt ingegaan op gangbare theorieën over de manier waarop<br />
risico tot stand komt. Hierin wordt de rol van ‘normale’ gebeurtenissen bij het tot stand<br />
komen van ongevallen benadrukt, en dat moet derhalve correct kunnen worden<br />
gerepresenteerd in een causaal model. Ook de invloed van menselijk gedrag en de rol van<br />
organisaties is belangrijk en moet correct worden gerepresenteerd.<br />
In ho<strong>of</strong>dstuk 3 wordt dieper ingegaan op het begrip causaliteit en het verschil tussen<br />
causaliteit en associatie. Hieruit blijkt dat oorzaak-gevolg relaties alleen kunnen worden<br />
opgesteld op basis van specifieke kennis aangaande de werking van het systeem. Dit<br />
betekent dat substantiële kennis van het luchtvaartsysteem een vereiste is voor de<br />
ontwikkeling van een causaal risicomodel voor lucht<strong>transport</strong>. Om mogelijke verwarring<br />
tussen singuliere en generieke oorzaak-gevolg relaties te voorkomen is het belangrijk dat<br />
het model in staat is zowel scenarios van falen als van herstel en succes te representeren.<br />
Het begin en einde van oorzaak-gevolg relaties is arbitr<strong>air</strong>, een praktisch criterium voor een<br />
causaal model is dat het model de effecten van beslissingen en handelingen van<br />
betrokkenen op het hoogste management niveau moet kunnen representeren.<br />
Eisen die mogelijke gebruikers stellen aan een causaal risicomodel voor lucht<strong>transport</strong><br />
worden behandeld in ho<strong>of</strong>dstuk 4. Een kort overzicht van de geschiedenis van<br />
luchtvaartveiligheid laat zien dat de veiligheid op dit moment zo groot is dat de<br />
mechanismen die voorheen tot continue veiligheidsverbeteringen hebben geleid nu niet<br />
meer werken. Omdat elk van de mogelijke gebruikers van een causaal risicomodel<br />
(luchtvaartmaatschappijen, luchtverkeersleidingsorganisaties, luchthaven organisaties,<br />
onderhoudsorganisaties, vliegtuigfabrikanten en luchtvaartautoriteiten) elk op een andere<br />
manier invloed hebben op de veiligheid en elk verschillende drijfveren hebben voor het<br />
217
verder verbeteren daarvan, zijn er verschillende gebruikerseisen die soms niet compatibel<br />
zijn. De belangrijkste eisen zijn, op ho<strong>of</strong>dlijnen, de eis dat het hele luchtvaartsysteem<br />
inclusief afhankelijkheden wordt gerepresenteerd, dat het model de invloed van de mens en<br />
van organisaties representeert, dat het model is gevalideerd en kwantitatieve en<br />
reproduceerbare resultaten levert, dat de model representatie transparant is en dat het model<br />
huidige en toekomstige ongevallenscenarios kan representeren.<br />
In ho<strong>of</strong>dstuk 5 wordt aan de hand van enkele praktijkvoorbeelden beschreven op welke<br />
wijze op dit moment veiligheidsanalyses worden uitgevoerd in de luchtvaart. De in die<br />
voorbeelden gekozen aanpak wordt vergelijken met de gebruikerseisen die in ho<strong>of</strong>dstuk 4<br />
zijn afgeleid. Hierdoor wordt een nog scherper inzicht verkregen in wat een causaal<br />
risicomodel moet kunnen om een meerwaarde te hebben ten opzichte van huidige methodes<br />
en technieken. Uit het ho<strong>of</strong>dstuk blijkt dat er op dit moment geen standaard is voor het<br />
uitvoeren van veiligheidsanalyses. Dit leidt telkens opnieuw tot een andere aanpak.<br />
Beschikbare resultaten van eerdere analyses worden vaak onvoldoende benut en de<br />
resultaten zijn sterk afhankelijk van expert mening. Geen van de besproken voorbeelden<br />
voldoet volledig aan de in ho<strong>of</strong>dstuk 4 genoemde gebruikerseisen. Ontwikkeling van een<br />
methode die wel aan die eisen voldoet lijkt daarom gerechtvaardigd.<br />
In andere industrieën dan de luchtvaart worden causale risicomodellen toegepast voor de<br />
beheersing van veiligheid. In ho<strong>of</strong>dstuk 6 wordt besproken op welke wijze causale<br />
modellen worden gebruikt in de nucle<strong>air</strong>e industrie, bemande ruimtevaart, <strong>of</strong>fshore<br />
industrie, proces industrie, rail <strong>transport</strong> en de medische wereld en welke lessen daaruit<br />
kunnen worden getrokken voor de ontwikkeling en gebruik van soortgelijke modellen in de<br />
luchtvaart. Voor de nucle<strong>air</strong>e industrie, bemande ruimtevaart, <strong>of</strong>fshore en de proces<br />
industrie geldt dat aanvankelijk weerstand bestond tegen de toepassing van risicomodellen.<br />
Enkele catastr<strong>of</strong>ale ongevallen leidden echter tot veranderingen in regelgeving die de<br />
partijen er toe dwongen om probabilistische methoden te gaan gebruiken. Ontwikkeling van<br />
modellen en methoden die als acceptabel konden worden beschouwd vergde veel tijd. Op<br />
basis van deze ervaringen kan worden verwacht dat ontwikkeling en invoering van causale<br />
risicomodellen in de luchtvaart eveneens met horten en stoten zal geschieden and dat het<br />
tientallen jaren kan duren voordat het gebruik ervan volledig is geaccepteerd. Het is<br />
essentieel om vanaf het begin duidelijk te maken dat deze modellen bedoeld zijn om<br />
bestaande methoden aan te vullen en niet om ze te vervangen.<br />
Voor modelrepresentatie en berekeningen zijn verschillende technieken beschikbaar. De<br />
meest gangbare methoden (foutenbomen, gebeurtenisbomen, Bayesian belief nets en Petrinets)<br />
en hun belangrijkste eigenschappen worden beschreven in ho<strong>of</strong>dstuk 7. Foutenbomen<br />
en gebeurtenisbomen hebben als belangrijk voordeel dat ze eenvoudig zijn. Hierdoor zijn ze<br />
transparant maar de toepassingmogelijkheden zijn beperkt. Bayesian belief nets zijn beter<br />
geschikt voor de representatie van ‘zachte’ invloeden, maar hebben als nadeel dat ze<br />
minder transparant zijn. Met Petri-nets kunnen ook dynamische situaties worden<br />
gerepresenteerd, maar hiervan is de transparantie nog minder. De conclusie in dit ho<strong>of</strong>dstuk<br />
is dan ook dat een combinatie van technieken moet worden toegepast, bijvoorbeeld met<br />
gebeurtenisbomen en foutenbomen voor de representatie van de bovenliggende laag van het<br />
model (het deel wat direct door de gebruiker wordt gezien), terwijl invloedsdiagrammen en<br />
mogelijk Petri-nets gebruikt kunnen worden, daar waar nodig, voor correcte representatie<br />
van dieper liggende details.<br />
Een van de eisen aan een causaal risicomodel is dat het kwantitatieve resultaten moet<br />
leveren. Ho<strong>of</strong>dstuk 8 is geheel gewijd aan kwantificering. Een van de problemen bij het<br />
218
modelleren is het vinden van de juiste eenheden, in het bijzonder als de invloed van<br />
samengestelde factoren zoals veiligheidscultuur, veiligheidsmanagement <strong>of</strong> niet-technische<br />
vaardigheden van piloten moet worden uitgedrukt. De gelo<strong>of</strong>waardigheid van het model<br />
hangt af van de kwaliteit van de <strong>models</strong>tructuur en van de gegevensbronnen die worden<br />
benut voor kwantificering. Belangrijke bronnen zijn ongevalsonderzoeksrapporten en<br />
incident rapportage systemen van luchtvaartmaatschappijen. Soms kunnen resultaten van<br />
empirische studies worden gebruikt. Expert mening kan, mits op de juiste wijze verkregen,<br />
resulteren in gegevens van voldoende kwaliteit en nauwkeurigheid. Naast gegevens over<br />
ongevallen en incidenten zijn voor het vaststellen van de relatieve invloed van factoren ook<br />
gegevens nodig over normale operaties. Flight data recorders kunnen hiervoor een<br />
belangrijke bron zijn. Om de gegevens uit bestaande databestanden zo efficiënt mogelijk te<br />
benutten is het een vereiste dat definities en beschrijvingen van gebeurtenissen in het model<br />
overeenkomen met die zoals gebruikt in de bestaande databestanden. Bij voorkeur moet het<br />
model zich conformeren aan de definities van het Europese systeem voor<br />
incidentenrapportage ECCAIRS. Een voorwaarde daarbij is wel dat een aantal van de<br />
huidige problemen van ECCAIRS worden opgelost.<br />
Naar verwachting zullen de grootste moeilijkheden optreden bij de representatie van de<br />
mens, de representatie van de invloed van organisaties en management en het representeren<br />
van de vele onderlinge afhankelijkheden tussen delen van het model. In ho<strong>of</strong>dstuk 9<br />
worden deze problemen besproken en worden oplossingen aangedragen. Enerzijds worden<br />
die gevonden in het toepassen van Bayesian belief nets voor representatie van ‘zachte’<br />
invloeden en afhankelijkheden, anderzijds door definitie van een beperkt aantal (33)<br />
‘archetype’ ongevallen. Deze archetype ongevallen kunnen de ruggengraat vormen van een<br />
causaal risicomodel. De menselijke operator kan in het model gerepresenteerd worden door<br />
middel van een Bayesian belief net, waarbij de invloed van het management op het<br />
presteren van de mens wordt gerepresenteerd door middel van generieke ‘delivery<br />
systemen’.<br />
In ho<strong>of</strong>dstuk 10 wordt ingegaan op mogelijkheden tot validatie van een causaal<br />
risicomodel. Volledige validatie van een model is niet mogelijk vanwege de complexiteit<br />
van het luchtvaartsysteem, maar validatie van deelcomponenten is wel beperkt mogelijk.<br />
Hiervan worden enkele voorbeelden gegeven.<br />
De conclusies van dit proefschrift worden vermeld in ho<strong>of</strong>dstuk 11. De huidige<br />
mechanismen voor veiligheidsverbetering zijn onvoldoende om voortdurende verbetering<br />
van de veiligheid te bewerkstelligen. Er is een methode voor veiligheidsanalyse nodig die<br />
op niet alleen is gebaseerd op ongevalfrequenties. Met de methode moet de kwantitatieve<br />
kans op een ongeval kunnen worden bepaald, en de methode moet op de juiste wijze de<br />
complexe inrichting van het lucht<strong>transport</strong>systeem beschrijven, inclusief de invloed van<br />
mensen en organisaties. De methode moet transparant zijn en aantoonbaar valide resultaten<br />
opleveren. Gebruik van een causaal risicomodel zoals beschreven in dit proefschrift voldoet<br />
aan deze eisen en is derhalve een manier om mogelijke veiligheidsverbeteringen te<br />
identificeren die met gangbare methoden niet mogelijk zijn. De ontwikkeling van een<br />
causaal risicomodel voor lucht<strong>transport</strong> is niet uitzonderlijk moeilijk, het is alleen veel<br />
werk. Het grootste deel van dit werk zal moeten worden uitgevoerd door mensen met<br />
voldoende achtergrondkennis van lucht<strong>transport</strong>. Om de complexiteit van het lucht<strong>transport</strong><br />
te kunnen representeren in een causaal model zijn vele aannames nodig, en elk van deze<br />
aannames is opponeerbaar. Een causaal risicomodel kan alleen succesvol zijn indien<br />
overeenstemming aangaande deze aannames wordt bereikt met alle betrokken partijen. Dit<br />
proces zou geleid moeten worden door een regelgevende instantie, bij voorkeur een<br />
219
internationale regelgever zoals EASA <strong>of</strong> ICAO. Zij zouden een proces moeten initiëren en<br />
leiden om te komen tot een internationaal standaard model en om overeenstemming te<br />
bereiken over hoe en wanneer het model dient te worden toegepast. Voor de verdere<br />
ontwikkeling van causale risicomodellen voor lucht<strong>transport</strong> is het essentieel dat deze<br />
modellen direct gekoppeld kunnen worden aan een gegevensbestand van ongevallen en<br />
incidenten, bij voorkeur het ECCAIRS systeem. Terugkoppeling van modelontwikkelaars<br />
naar potentiële gebruikers en vice versa is vereist om de gebruikerseisen beter te definiëren.<br />
De modelontwikkelaars moeten de mogelijkheden en beperkingen van het model aangeven,<br />
en moeten praktijkvoorbeelden aandragen van gevallen waarbij een causaal risicomodel een<br />
bruikbaar instrument zou zijn. Dit is een iteratief proces. De steun van de industrie is nodig<br />
voor het leveren van gegevens en om de modelontwikkelaars inzicht te verschaffen in<br />
operationele luchtvaart processen.<br />
220
Appendix A: The history <strong>of</strong> third party <strong>risk</strong> regulation at<br />
Schiphol<br />
Background<br />
The involuntary exposure to the <strong>risk</strong> <strong>of</strong> <strong>air</strong>craft accidents <strong>of</strong> the people living in the vicinity<br />
<strong>of</strong> an <strong>air</strong>port is referred to as third party <strong>risk</strong>. It is usually expressed as individual <strong>risk</strong> and<br />
group <strong>risk</strong>.<br />
In 1952, the President’s Airport Commission in the USA, best known as the Doolittle<br />
Commission in honor <strong>of</strong> its ch<strong>air</strong>man, James Doolittle 88 , conducted one <strong>of</strong> the first<br />
comprehensive studies <strong>of</strong> the noise and safety relationships between <strong>air</strong>ports and<br />
surrounding communities. Among other things, the commission plotted the location <strong>of</strong> over<br />
30 <strong>of</strong>f-<strong>air</strong>port commercial and military <strong>air</strong>craft crashes which caused death or injury to<br />
persons on the ground (there is no indication in the report that any data was gathered<br />
regarding non-injury accidents). Despite the rather limited database, the commission’s<br />
report led to the establishment <strong>of</strong> what became known as clear zones and are now called<br />
runway protection zones at the ends <strong>of</strong> <strong>air</strong>port runways [Doolittle 1952, State <strong>of</strong> California<br />
2002].<br />
The importance <strong>of</strong> <strong>risk</strong> around <strong>air</strong>ports was recognised in the UK in the 1950s. Public<br />
Safety Zones (PSZs) were introduced in 1958 following the recommendations <strong>of</strong> the<br />
Committee <strong>of</strong> Safeguarding Policy [Le Maitre 1957]. A PSZ was defined as an area<br />
adjacent to the end <strong>of</strong> a runway in which development <strong>of</strong> land is restricted if it would be<br />
likely to increase significantly the numbers <strong>of</strong> persons "residing, working or congregating<br />
there". The suggestion <strong>of</strong> the 1957 Committee <strong>of</strong> Safeguarding Policy was for a<br />
longitudinal limit <strong>of</strong> 4,500 feet (1,372 m) for the PSZ. This was based on the subjective<br />
choice that 65% <strong>of</strong> landing and take-<strong>of</strong>f crashes should be contained within the PSZ area<br />
[Evans et al 1997].<br />
A string <strong>of</strong> high pr<strong>of</strong>ile accidents in the mid seventies (Flixborough, UK, chemical plant<br />
explosion 1974, explosion and fire at DSM in Beek, the Netherlands, 1975, the accidental<br />
release <strong>of</strong> dioxin near the Italian town <strong>of</strong> Seveso,1976) started a debate in Europe on the<br />
extent to which governments should control hazardous industry. New regulations were<br />
developed such as CIMAH (Control <strong>of</strong> Industrial Major Accident Hazard) in the UK.<br />
Regulation on <strong>risk</strong> management in the Netherlands was mainly shaped by the regulation on<br />
88 James ‘Jimmy’ Doolittle (1896 - 1993) was one <strong>of</strong> the most famous pilots during the<br />
inter-war period. He conducted flight testing <strong>of</strong> artificial horizons and directional<br />
gyroscopes which resulted in the first take-<strong>of</strong>f and landing conducted on instruments alone,<br />
i.e. with no outside view. In 1932, Doolittle set the world's high speed record for land<br />
planes in the notorious Gee Bee R-1 racer with a speed averaging 252 miles per hour [Daso<br />
2003]. In 1942, he led the daring one-way attack <strong>of</strong> sixteen B-25 bombers from the <strong>air</strong>craft<br />
carrier USS Hornet, with targets in Japan [Lawson & Considine 1944].<br />
221
LPG [Tweede Kamer 1983], which set quantitative limits to individual <strong>risk</strong> and societal<br />
<strong>risk</strong>.<br />
Stand still for Schiphol <strong>risk</strong><br />
Third party <strong>risk</strong> around Schiphol Airport was formally addressed for the first time in the<br />
‘Plan van Aanpak Schiphol en Omgeving’ (PASO) at the end <strong>of</strong> the 1980’s. In the<br />
framework <strong>of</strong> the expected doubling <strong>of</strong> the number <strong>of</strong> movements at Schiphol, an<br />
Environmental Impact Assessment (Milieu Effect Rapportage, MER) was conducted within<br />
which third party <strong>risk</strong> was also investigated. Starting point was the concept that the growth<br />
<strong>of</strong> traffic at Schiphol should not lead to an increase in <strong>risk</strong>, the so-called stand still<br />
principle. The discussion on third party <strong>risk</strong> was intensified on October 4, 1992, when a<br />
Boeing 747-200 cargo <strong>air</strong>craft lost two engines immediately after take-<strong>of</strong>f from Schiphol<br />
and subsequently crashed into an apartment building in a suburb <strong>of</strong> Amsterdam during an<br />
attempt to return to the <strong>air</strong>port. All 4 crew members and 39 people on the ground were<br />
killed.<br />
At that point, the stand still principle for third party <strong>risk</strong> was not yet translated into<br />
measurable norms. As a result <strong>of</strong> the first Schiphol MER, the MER Commission advised<br />
that the stand still principle should be interpreted as no increase <strong>of</strong> the number <strong>of</strong> houses<br />
within the 10 -5 , 10 -6 , 10 -7 and 10 -8 individual <strong>risk</strong> contours and no increase <strong>of</strong> group <strong>risk</strong>’,<br />
thereby accepting <strong>risk</strong> criteria (individual <strong>risk</strong> and group <strong>risk</strong>) that had been used for third<br />
party <strong>risk</strong> <strong>of</strong> stationary installations.<br />
When it became clear that stand-still <strong>of</strong> third party <strong>risk</strong> was not feasible with these criteria,<br />
new policy was developed in the Planologische Kernbeslissing Schiphol en Omgeving<br />
(PKB) using a new <strong>risk</strong> measure: the ‘Gesommeerd Gewogen Risico’ (GGR) (summed<br />
weighted <strong>risk</strong>) [Tweede Kamer 2001]. GGR is the sum <strong>of</strong> all houses within a particular area<br />
multiplied by the individual <strong>risk</strong> at each house. To some extent, the GGR takes aspects <strong>of</strong><br />
spatial planning into consideration, and therefore it is a <strong>risk</strong> measure that falls between<br />
individual <strong>risk</strong> and group <strong>risk</strong>. The GGR only considers houses and not objects such as<br />
<strong>of</strong>fice buildings, schools, hospitals etc. The stand-still policy was now formulated as: The<br />
GGR shall not increase within the 10 -5 and 10 -6 individual <strong>risk</strong> contours.<br />
New law for Schiphol<br />
With the change in 2001 <strong>of</strong> the aviation law with respect to Schiphol, the GGR was<br />
dropped. External safety is considered in both the luchthavenindelingbesluit (<strong>air</strong>port layout<br />
decree) [DGL 2002a] and the luchthavenverkeersbesluit (<strong>air</strong>port traffic decree) [DGL<br />
2002b] <strong>of</strong> the new Chapter 8 <strong>of</strong> the Aviation Law. In the luchthavenindelingbesluit<br />
restrictions regarding permissible buildings are described, taking into consideration third<br />
party <strong>risk</strong>. Four types <strong>of</strong> areas are indicated upon which different building restrictions act.<br />
These areas are defined by noise contours and contours <strong>of</strong> individual <strong>risk</strong>. For most<br />
locations the noise contours are larger than the individual <strong>risk</strong> contours and hence<br />
determining. In the luchthavenverkeersbesluit the Total Risk Weight (TRG) was presented<br />
as a measure for third party <strong>risk</strong>. The TRG is defined as the product <strong>of</strong> the average accident<br />
probability per <strong>air</strong>craft movement per year and the summed maximum take-<strong>of</strong>f weight <strong>of</strong> all<br />
<strong>air</strong>craft movements in that year. The TRG was an attempt to express the <strong>risk</strong> to which the<br />
whole neighbourhood <strong>of</strong> the <strong>air</strong>port is subjected as a single number. This TRG does not<br />
take into account (changes in) use and location <strong>of</strong> routes, runways and changes in buildings<br />
and population densities in the surroundings <strong>of</strong> the <strong>air</strong>port. The maximum allowable limit<br />
value for the TRG was determined at 9.724 tons per year. The rules <strong>of</strong> the<br />
luchthavenverkeersbesluit encourage that the limit value for third party <strong>risk</strong> is not exceeded<br />
222
ut they do not guarantee this. The explanation <strong>of</strong> the luchthavenverkeersbesluit states “To<br />
optimally conduct the luchthavenverkeersbesluit within the limit values requires tuning and<br />
co-operation between sector parties. Article 8.18 <strong>of</strong> the law requires sector parties to take<br />
such measures, as can reasonable be demanded, individually and in joint co-operation, in<br />
order to accomplish that the limit values are not exceeded”. The way in which the norms for<br />
third party <strong>risk</strong> with respect to Schiphol <strong>air</strong>port must be upheld is described in the safety<br />
oversight policy for Schiphol [IVW 2003]. This document refers among other things to the<br />
Regeling Milieu Informatie Schiphol (Ruling on Environmental Information for Schiphol)<br />
[RMI 2003]. When limit values are exceeded, the government can take sanctions, such as<br />
issuing a fine. In 2005 the number <strong>of</strong> <strong>air</strong>craft movements was substantially more limited by<br />
noise contours than by the TRG norm.<br />
In the first instance the luchthavenverkeersbesluit [DGL 2002b] did not contain a limit<br />
value for (a measure for) group <strong>risk</strong>. Up to then it had not proven to be feasible to establish<br />
a method suitable for aviation to ‘capture’ group <strong>risk</strong> in a number and to compare this<br />
number with a fitting limit value. The failure to find a feasible metric for group <strong>risk</strong> that<br />
was suitable for aviation led, in the debate between the government and the parliament<br />
about the proposal for an amendment, to a change in the original bill, wherein it was laid<br />
down that a statistical-causal safety model should be ready by 2005. The model should also<br />
serve as foundation for the implementation <strong>of</strong> a measure to determine group <strong>risk</strong>. This<br />
group <strong>risk</strong> should not be higher than the group <strong>risk</strong> <strong>of</strong> 1990, calculated in the same manner.<br />
Group <strong>risk</strong>, particularly when presented in the form <strong>of</strong> FN-curves, is a concept that is<br />
difficult to grasp. It does however provide insight into the probability and size <strong>of</strong> a calamity<br />
or disaster. Additional to this is the problem <strong>of</strong> a limit value for group <strong>risk</strong>. For static<br />
installations this was perfectly possible, be defining an unacceptable area under a line on<br />
the FN graph. The fact that in the last few years no norm for group <strong>risk</strong> at Schiphol was<br />
established has led to a situation where concrete limit values for group <strong>risk</strong> have not been<br />
included in the Aviation Law. This clearly illustrates the difference between calculating a<br />
level <strong>of</strong> safety and setting a target level <strong>of</strong> safety. With group <strong>risk</strong> the calculation is not a<br />
problem. The problem is the limit value, since all limits proved unattainable almost as soon<br />
as suggested. This was not a problem <strong>of</strong> setting a limit, but <strong>of</strong> predicting in advance if it<br />
could be met and what would be the (political) consequences <strong>of</strong> keeping to it [Piers & Ale<br />
2000]. These would have been the closure <strong>of</strong> the <strong>air</strong>port to any more traffic, thus damaging<br />
its role as driver <strong>of</strong> the Dutch economy.<br />
By then the linkage between a statistical causal model and a norm for group <strong>risk</strong> had also<br />
been abandoned. The main issue was that the causal model would not solve the problem<br />
because the Ministry and Chamber completely misunderstood what it could do. In answer<br />
to questions from parliament it was also explained that the sector parties, given the results<br />
<strong>of</strong> the demonstration phase <strong>of</strong> the project causal modelling, had insufficient faith in the<br />
feasibility <strong>of</strong> a complete causal model. The loss <strong>of</strong> faith however was more general and<br />
linked to the anticipated use <strong>of</strong> the model by the Ministry, i.e. to use the model for<br />
enforcement. In any case, the sector parties stopped their contribution to the development <strong>of</strong><br />
a statistical causal model. In consequence <strong>of</strong> this, it was no longer possible that, in<br />
accordance with the amended aviation law, a causal model Schiphol would be operational<br />
before 1 January 2005 [Tweede Kamer 2003a, 2003b, 2003c].<br />
In almost all relevant studies that have been conducted since 1990 it was concluded that the<br />
intended stand still for group <strong>risk</strong> is not feasible due to the increase in the number <strong>of</strong><br />
movements at Schiphol and the increase <strong>of</strong> buildings in the vicinity <strong>of</strong> the <strong>air</strong>port. Because<br />
223
<strong>of</strong> this a situation has been created in which requirements for group <strong>risk</strong> are an obstruction<br />
for the growth <strong>of</strong> the <strong>air</strong>port. Suitable criteria for group <strong>risk</strong> have proven to be politically<br />
difficult to find. This has complicated and delayed the discussion regarding external safety.<br />
<strong>Causal</strong> model as a solution?<br />
In conclusion it can be stated that the government, in its policy with respect to third party<br />
<strong>risk</strong> in the vicinity <strong>of</strong> Schiphol Airport, has mainly been focussing on individual <strong>risk</strong>.<br />
Criteria for group <strong>risk</strong> are too complicated to develop a policy that fulfils the requirements<br />
<strong>of</strong> the government (transparent, maintainable, measurable, controllable, technically and<br />
operationally feasible) and there is no political will to put limits on the use <strong>of</strong> Schiphol. The<br />
stand-still norm is, given the <strong>risk</strong> measures that were selected in the past (in particular with<br />
respect to group <strong>risk</strong>), restricting for the growth <strong>of</strong> Schiphol. This has complicated and<br />
delayed the discussion regarding third party <strong>risk</strong>. The government is also looking for a<br />
policy to control the ‘disaster potential’. This desire is to a large extent, but not completely,<br />
a result <strong>of</strong> the Bijlmer disaster (see for example the motion <strong>of</strong> Samson and Duyvendak <strong>of</strong><br />
25 November 2003) [Tweede Kamer 2003c].<br />
The industry is confronted with an individual <strong>risk</strong> limit value similar to limit values for<br />
<strong>air</strong>craft noise and <strong>air</strong> pollution. These limit values are in the first place regarded by the<br />
industry as possible restrictions for the activities at and around the <strong>air</strong>port and not as limits<br />
to prevent the neighbourhood from being subjected to a <strong>risk</strong> that is too high. The present<br />
limit value for third party <strong>risk</strong> (TRG <strong>of</strong> 9.724 tons per year) is calculated from an accident<br />
probability, the number <strong>of</strong> <strong>air</strong>craft movements and the maximum take-<strong>of</strong>f weight. The<br />
sector can influence the TRG by the types <strong>of</strong> <strong>air</strong>craft that are being allowed to use Schiphol<br />
and the number <strong>of</strong> movements. With respect to the types <strong>of</strong> <strong>air</strong>craft, already 95%<br />
(percentage from 2002) <strong>of</strong> all movements at Schiphol are being conducted by third<br />
generation <strong>air</strong>craft, the most modern and hence safest class <strong>of</strong> <strong>air</strong>craft. Practicably, a<br />
reduction <strong>of</strong> the number <strong>of</strong> flights is the only option that is available for the sector when the<br />
limit value for TRG is in danger <strong>of</strong> being exceeded. Article 8.18 <strong>of</strong> the Aviation Law<br />
obliges the sector parties to take such measures as can reasonably be demanded,<br />
individually and in co-operation, to accomplish that the limit values are not exceeded. All<br />
in all, the sector has little choice regarding those ‘measures’. In any case this policy does<br />
not provide impetus for the sector to start focussed development and to take measures for<br />
the improvement <strong>of</strong> internal and external safety.<br />
The Ministry <strong>of</strong> Transport and Water Management has recognised this and is looking for<br />
ways to come to a solution. <strong>Causal</strong> <strong>risk</strong> <strong>models</strong> are being considered as one possible<br />
solution. The Ministry argues that causal <strong>risk</strong> <strong>models</strong> can be used to quantify improvements<br />
in safety in the accident probability [Tweede Kamer 2003b]. It is then possible to use this<br />
accident probability for the calculation <strong>of</strong> safety levels and compare those with the target.<br />
In doing so, the causal <strong>risk</strong> model provides directions to the sector for the improvement <strong>of</strong><br />
safety. It becomes a tool for <strong>risk</strong> informed decision making and can help the industry to<br />
capitalize on measures they have already taken. Only then can we expect support from the<br />
industry in the development on such a model.<br />
224
Appendix B: The aviation system<br />
The aviation system is characterised by a complex arrangement <strong>of</strong> organisations and<br />
activities that has virtually no geographical boundaries. Air <strong>transport</strong> has always been an<br />
international aff<strong>air</strong>. Because <strong>of</strong> its relatively high speed the <strong>air</strong>craft is an attractive means <strong>of</strong><br />
<strong>transport</strong>ation for long distance travel. In Europe this is synonymous with international<br />
travel; KLM’s very first destination in 1920 was Amsterdam on a flight from London [Van<br />
Kampen 1960]. Aviation today is an international business in almost every aspect. Airlines<br />
have become international organisations (SAS, Air France/KLM) that cooperate in code<br />
sharing alliances such as One World, STAR and Skyteam. The <strong>air</strong>craft that are being<br />
operated are manufactured by international consortia like Airbus. Air traffic control,<br />
particularly in Europe, requires coordination and integration <strong>of</strong> national traffic control<br />
centres in the pursuit <strong>of</strong> a ‘single European sky. ‘Rules <strong>of</strong> the <strong>air</strong>’ are developed by a<br />
special body <strong>of</strong> the United Nations that is called the International Civil Aviation<br />
Organisation (ICAO). Aviation is also a business with many different actors (<strong>air</strong>lines,<br />
<strong>air</strong>craft manufacturers, <strong>air</strong> traffic control service providers, <strong>air</strong>port organisations,<br />
maintenance providers, security etc) and it is a distributed system in the sense that the<br />
different actors are not physically located in a single spot. At minimum there are two<br />
locations; the location <strong>of</strong> departure and the destination.<br />
Central to all aviation system processes is the primary process <strong>of</strong> flying ‘from A to B’ as<br />
schematically represented in Figure B1. The primary- and subsidiary aviation processes are<br />
described in the following sections. They are the current processes in developed countries.<br />
In some underdeveloped countries the <strong>air</strong>craft and infrastructure may be lacking some<br />
technologies and procedures may also be less well developed. These processes are also in a<br />
continual state <strong>of</strong> change due to technological advances and demands from society.<br />
225
Holding<br />
En-route<br />
Approach<br />
Go-around<br />
Departure<br />
control<br />
Start-up control<br />
Landing Taxi-in<br />
Inspection<br />
Power connect<br />
Figure B1: Air <strong>transport</strong> processes<br />
Arrival control<br />
Area control<br />
Ground control<br />
Tower control<br />
Rejected take<strong>of</strong>f<br />
Docking Pushback Taxi-out Take-<strong>of</strong>f<br />
Line<br />
maintenance<br />
Pass. (dis)<br />
embarking<br />
Cleaning &<br />
catering<br />
Runway<br />
maintenance<br />
Approach<br />
planning<br />
Heavy<br />
maintenance<br />
Power<br />
disconnect<br />
Security<br />
checking<br />
Anti/de-icing<br />
A typical flight<br />
Pre-flight, crew centre<br />
The cockpit crew normally consists <strong>of</strong> a Captain and a First Officer. On long flights an<br />
additional First Officer or Cruise Relief Pilot (CRP) may be scheduled for the flight. The<br />
cockpit crew reports for duty at the Crew Centre at the <strong>air</strong>port typically 90 minutes before<br />
scheduled departure time. For larger <strong>air</strong>lines much <strong>of</strong> the preparation has been done by then<br />
by the Dispatcher. A briefing package has been prepared with anticipated loading figures<br />
and weights, special loads (if any), <strong>air</strong>craft deficiencies relevant for flight planning (if any),<br />
flight plan route, including speed and altitude schedule, a copy <strong>of</strong> the ATC filed flight plan,<br />
departure slot-time (if any), actual and forecasted weather and NOTAMs 89 for departure<br />
<strong>air</strong>port, destination, alternate and en-route <strong>air</strong>ports, temperature and wind charts and<br />
significant weather charts for en-route and a minimum block fuel for the planned flight.<br />
Based on the information available the cockpit crew may choose to take extra fuel. When<br />
the flight plan is accepted, the final fuel figure is then forwarded to the fuelling department<br />
by the Dispatcher. The cockpit crew then proceeds through <strong>air</strong>port customs and security<br />
checks to the <strong>air</strong>craft and normally arrives at the <strong>air</strong>craft approximately 40 minutes prior to<br />
departure, just before passenger boarding commences. If not already met in the crew centre,<br />
the cockpit crew meets the cabin crew on-board the <strong>air</strong>craft and discusses any relevant<br />
Fuelling<br />
Cargo (<strong>of</strong>f)<br />
loading<br />
Marking &<br />
lighting<br />
Bird control Emergency<br />
response<br />
Approach<br />
control<br />
Airport control<br />
Aircraft design<br />
& production<br />
Weather info<br />
89<br />
NOTAM stands for Notice to Airmen. NOTAMs are messages to alert the pilots <strong>of</strong><br />
hazards or abnormalities anywhere along the planned route.<br />
226<br />
Climb
issues with the Senior Flight Attendant, such as anticipated delays, flight time, forecasted<br />
turbulence and security procedures.<br />
Pre-flight, <strong>air</strong>craft at the gate<br />
Any deficiencies to the <strong>air</strong>craft, cockpit or cabin are stated in the Hold-Item-List (HIL) in<br />
the Aircraft Technical Log (ATL) for <strong>air</strong>craft and cockpit matters and Cabin Technical Log<br />
(CTL) for cabin matters. The release <strong>of</strong> the <strong>air</strong>craft by the maintenance department is done<br />
after the pre-flight inspection by the ground engineer and signed in the ATL. The cockpit<br />
crew verifies that all open items recorded on the previous flight are either rep<strong>air</strong>ed or added<br />
to the HIL and verifies release <strong>of</strong> the <strong>air</strong>craft. The <strong>air</strong>craft may be released to service with<br />
<strong>air</strong>craft or cockpit system deficiencies if these deficiencies are stated in the Minimum<br />
Equipment List (MEL). Any contingency procedure for unserviceable equipment is<br />
mentioned in the MEL as well. Acceptance <strong>of</strong> any cabin deficiencies is done by the cockpit<br />
crew in concert with the Senior Flight Attendant.<br />
During the boarding <strong>of</strong> the passengers, loading <strong>of</strong> the cargo and fuelling <strong>of</strong> the <strong>air</strong>craft, the<br />
cockpit crew prepares the <strong>air</strong>craft for departure. On the flight deck duties are normally<br />
divided between Pilot Flying (PF) and Pilot Not Flying (PNF) but some actions are<br />
specifically assigned to the Captain or First Officer irrespective <strong>of</strong> which <strong>of</strong> the two is PF<br />
on the stretch. The decision who is going to be PF on the stretch is taken either at flight<br />
planning or when arriving in the cockpit.<br />
The time that the <strong>air</strong>craft is parked at the gate is a busy time for the cockpit crew. One pilot<br />
(normally the PF but this also may be assigned to the First Officer) enters the flight plan<br />
data in the Flight Management System (FMS) and prepares all other <strong>air</strong>craft systems for<br />
departure; the other pilot communicates with the gate agent, the <strong>air</strong>line maintenance<br />
department, the cabin crew, <strong>air</strong>line hub control and the Dispatcher to keep track <strong>of</strong> latest<br />
developments. When fuelling is complete the fuelling department will bring the fuelling<br />
ticket to the cockpit, the flight crew then checks the actual fuel loading with the flight plan<br />
fuel.<br />
The latest weather observation for the departure <strong>air</strong>port is recorded from the Automatic<br />
Terminal Information System (ATIS). Approximately 20 minutes prior to departure ATC<br />
Departure Clearance Control is contacted to obtain a departure clearance for the departure<br />
runway, Standard Instrument Departure (SID) route, transponder code and ATC slot-time<br />
(if any), this is done either by voice or via datalink. The ATIS weather observation, the<br />
latest estimate <strong>of</strong> the take-<strong>of</strong>f weight and the expected departure runway are used to<br />
calculate take-<strong>of</strong>f performance figures (weight limitation, engine duration, bleed-<strong>air</strong><br />
demand and take-<strong>of</strong>f speeds).<br />
When all systems settings and take-<strong>of</strong>f performance calculations have been examined by<br />
both pilots, these are verified by reading the pre-departure checklist. The PF briefs the PNF<br />
on the taxi- and departure route, special weather conditions, applicable NOTAMS and other<br />
relevant issues such as discussing high terrain in the departure route, related safe altitudes,<br />
and the engine-failure procedure and highlighting some Standard Operating Procedures<br />
(SOPs) 90 .<br />
90<br />
All actions <strong>of</strong> the flight crew, including those in abnormal or emergency situations, are<br />
prescribed in procedures. These are described in the Basic Operating Manual, which<br />
contains the general procedures <strong>of</strong> the <strong>air</strong>line, and the Aircraft Operating Manual, which<br />
contains procedures specific for the type <strong>of</strong> <strong>air</strong>craft.<br />
227
Approximately 5 minutes prior to departure the gate agent (or alternatively the Dispatcher<br />
through datalink) hands over the cargo manifest for special cargo, passenger information<br />
list, load sheet and any last-minute changes to this data, all based on the actual loading<br />
figures. The latest data are entered in the FMS and checked against the take-<strong>of</strong>f<br />
performance data that was based on pre-flight estimates.<br />
Push-back and engine-start<br />
When all passenger and cargo doors are closed and the push-back truck has arrived, start-up<br />
and pushback clearance is requested from ATC Start-Up Control and Ground Control<br />
successively. The direction <strong>of</strong> the push-back and possible subsequent pull-out is prescribed<br />
per gate or overruled by ATC. During the push-back or after the pull-out the engines are<br />
started. During the push-back the PF normally remains in contact with the push-back<br />
driver, the PNF remains in contact with ATC Ground Control.<br />
Taxi-out<br />
The push-back truck will disconnect after completion <strong>of</strong> the push-back manoeuvre. When<br />
the engines have successfully been started and relevant cockpit systems have been set for<br />
taxiing, the taxi clearance is obtained from ATC Ground Control. The taxi clearance<br />
indicates the cleared taxi route from the gate to the departure runway. This may be a<br />
standard route if this route is published in the <strong>air</strong>port information (AIP) or else a detailed<br />
instruction on which route to take. Runway signs and markings as well as a map <strong>of</strong> the<br />
<strong>air</strong>port layout are used by the cockpit crew to navigate on the <strong>air</strong>port. During taxi-out<br />
<strong>air</strong>craft systems and configuration are set and verified for departure by reading the taxi-out<br />
checklist. The cabin crew reports that the cabin is secured and ready for departure. The<br />
flight crew will report their position and ready for departure when the <strong>air</strong>craft has reached<br />
the runway, where ATC Ground Control will hand the <strong>air</strong>craft over to ATC Tower Control.<br />
Tower must then check the position <strong>of</strong> the <strong>air</strong>craft either visually or by using the ground<br />
radar system, after which a line up approval will be given when the preceding <strong>air</strong>craft has<br />
initiated the take-<strong>of</strong>f roll.<br />
Take-<strong>of</strong>f<br />
ATC Tower Control will issue a take-<strong>of</strong>f clearance when the preceding <strong>air</strong>craft has lifted<br />
<strong>of</strong>f and no further <strong>air</strong>space restrictions apply. When the before take-<strong>of</strong>f checklist is<br />
completed, the take-<strong>of</strong>f roll is commenced by the PF. All actions and call-outs, performed<br />
for the purpose <strong>of</strong> cross-checking, during take-<strong>of</strong>f and initial climb are prescribed and<br />
performed according to SOPs. As the <strong>air</strong>craft accelerates down the runway, the PNF calls<br />
out <strong>air</strong>speed, typically at 80 kts, V1 (take-<strong>of</strong>f decision speed) and VR (rotation speed). If a<br />
problem occurs before V1, the take-<strong>of</strong>f will be aborted. After passing V1 the <strong>air</strong>craft is<br />
committed to take-<strong>of</strong>f. Immediately after lift-<strong>of</strong>f the gear is retracted, followed later by<br />
thrust reduction, flap retraction and acceleration to climb speed. Also the autopilot will be<br />
engaged.<br />
Climb<br />
During flight, duties are assigned according to PF/PNF roles. The PF will monitor the flight<br />
path and adjust where required by selecting autopilot modes or changing data in the FMS.<br />
The PNF will assist the PF where required, will do the communication with ATC and<br />
perform administrative duties. The departure is flown according to the applicable SID, but<br />
sometimes a flight may have to deviate from the planned departure route because <strong>of</strong><br />
weather or by ATC request. As the <strong>air</strong>craft climbs to the assigned cruising altitude, and<br />
during cruise flight, the flight crew will have to switch to different ATC centres. The flight<br />
228
proceeds to its destination by following assigned <strong>air</strong>ways. Navigation is predominantly<br />
done using the FMS that obtains its information from a range <strong>of</strong> different sources (<strong>air</strong> data<br />
measurements, fuel calculation, GPS and radio position information, <strong>air</strong>craft system status).<br />
An on-board weather radar provides information on actual cumulative weather conditions<br />
ahead <strong>of</strong> the <strong>air</strong>craft. The useable range <strong>of</strong> the weather radar is approximately 100 NM or<br />
15 minutes flying time ahead.<br />
Cruise/descent<br />
During the flight updated actual weather observations and forecasts <strong>of</strong> key <strong>air</strong>ports<br />
(destination, en-route alternates) can be obtained directly through datalink, via dedicated<br />
radio transmissions or as a request to ATC. Also the flight crew can obtain any information<br />
as required from the Dispatcher who may be reached via datalink, radio (when in reach) or<br />
satellite phone (if installed on the <strong>air</strong>craft). With the information available the flight crew<br />
can continuously update contingency planning for an en-route diversion or emergency.<br />
The flight is normally flown along the <strong>air</strong>ways that were planned in the pre-flight phase, but<br />
ATC may issue short-cuts where appropriate. The FMS will continuously calculate<br />
important parameters such as distance to, time until over and fuel remaining at the<br />
waypoints that make up the flight plan and will calculate optimum speed and altitude. The<br />
cockpit crew will negotiate the flight pr<strong>of</strong>ile with ATC so that an optimal altitude and speed<br />
schedule will be flown, subject to traffic restrictions.<br />
The flight crew will start preliminary landing preparations approximately 45 minutes prior<br />
to landing. When in range the destination <strong>air</strong>port ATIS is copied. Landing calculations are<br />
made using the latest weather data, expected landing runway, estimated landing weight and<br />
planned landing configuration. Navigation systems (FMS programming, radio beacon pretuning)<br />
and flight deck preparation for descent, approach and landing are performed well in<br />
time and correct settings verified according to the descent checklist. The company handling<br />
agent may be contacted on a dedicated radio frequency to obtain the gate assignment and<br />
discuss items such as special handling requests for passengers or cargo and discussion <strong>of</strong><br />
possible maintenance actions upon arrival. The PF will give the crew briefing on expected<br />
arrival route and approach type, cockpit settings, <strong>air</strong>craft landing configuration, weather<br />
conditions, applicable NOTAMS, expected taxi-route to the gate after landing, instructions<br />
for a possible missed approach and other relevant issues such as high terrain during arrival,<br />
related safe altitudes and highlighting applicable SOPs.<br />
The descent and arrival may be conducted according to a Standard Arrival Route (STAR)<br />
until radar vectoring to final approach (on the extended centreline <strong>of</strong> the landing runway) is<br />
applied by ATC Arrival or Approach Control. During descent and arrival speed is reduced<br />
from cruise speed to final approach speed according to the optimal schedule, as prescribed<br />
by the STAR or by ATC. Approximately 10 minutes before landing the cabin crew is<br />
alerted to prepare the cabin for landing and the approach checklist is read.<br />
Approach/landing<br />
Weather permitting, non-precision or CAT I 91 ILS approaches can be flown manually<br />
following the Flight Director (FD) or with the autopilot (AP) engaged. The PF is either<br />
hand-flying the <strong>air</strong>craft and following the FD or is monitoring autopilot operation, being<br />
ready to take over if required. Meanwhile, the PNF scans alternately inside and outside the<br />
91<br />
Three main categories <strong>of</strong> automatic approach and landing are distinguished: CAT I, CAT<br />
II and CAT III. CAT III indicating an automatic landing under practically zero visibility.<br />
229
cockpit announcing flight parameter deviations and standard call-outs for cross-checking<br />
purposes according to SOPs. CAT II automatic approaches can be followed by a manual<br />
landing, although usually SOPs will prescribe an automatic landing with the autopilot<br />
engaged. In CAT III weather conditions an automatic landing is mandatory.<br />
When established on final approach, ATC Approach Control will hand over to ATC Tower<br />
Control who will provide the latest weather and runways conditions update. When the<br />
preceding <strong>air</strong>craft has vacated the landing runway, Tower Control will issue a landing<br />
clearance. Sometimes this is just seconds prior to anticipated touchdown.<br />
On final approach the <strong>air</strong>craft is configured for landing: flaps are extended in steps, gear is<br />
extended and speed is reduced to Final Approach Speed (FAS), which is a function <strong>of</strong><br />
<strong>air</strong>craft weight, <strong>air</strong>craft configuration and weather conditions. Before reaching the<br />
applicable stabilisation height (usually 1000 or 500 ft, depending on weather conditions),<br />
the <strong>air</strong>craft must be on the correct lateral and vertical flight path (based on radio navigation<br />
guidance or visual reference), the <strong>air</strong>craft must be in the desired landing configuration and<br />
at the desired speed (FAS) and the landing checklist must have been accomplished.<br />
Otherwise a missed approach must be initiated.<br />
During the approach, at any time the cockpit crew may abandon the approach if the<br />
visibility is below the required minimums, criteria for stabilised approach are not achieved,<br />
or when the flight crew is not convinced that safe landing is possible for whatever reason.<br />
When a missed approach is initiated, the thrust is advanced, gear and flaps are retracted.<br />
The missed approach path is followed using FMS or radio navigation or additional<br />
instructions may be obtained from ATC. The <strong>air</strong>craft then goes around for a second<br />
approach <strong>of</strong> diverts to an alternate <strong>air</strong>port.<br />
After touchdown, the following braking devices are used to decelerate the <strong>air</strong>craft and bring<br />
it to a complete stop: ground spoilers, wheel brakes (including anti-skid and autobrake<br />
systems) and the thrust reverser system. Typically at 80 kts the thrust reverse levers are<br />
returned to the reverse idle position and then to the stow position when reaching taxi speed.<br />
ATC Ground Control will provide a taxi clearance from the runway to the gate or parking<br />
spot on the apron. When the engines are shut down the doors may be opened and cargo and<br />
passengers are <strong>of</strong>f-loaded. During disembarkation the cockpit crew shuts down the different<br />
<strong>air</strong>craft systems and completes administrative duties. If on an outstation and the same crew<br />
will perform the return flight, initial preparations may be started for the return flight.<br />
Abnormal and emergency procedures<br />
During a flight, events may occur that differ from normal operational practise. For instance<br />
a technical malfunction may occur on-board the <strong>air</strong>craft or weather conditions at the <strong>air</strong>port<br />
<strong>of</strong> destination may prevent the <strong>air</strong>craft from landing. Like almost all aviation processes, the<br />
course <strong>of</strong> actions in such abnormal conditions is for the greater part described in<br />
procedures. For technical failures on-board the <strong>air</strong>craft, the associated procedures are<br />
described in the form <strong>of</strong> checklists in the abnormal and emergency procedures sections <strong>of</strong><br />
the <strong>air</strong>craft operations manual. While every attempt is made by the <strong>air</strong>craft manufacturer to<br />
establish necessary non-normal checklists, it is not possible to develop checklists for all<br />
conceivable situations, especially those involving multiple unrelated failures. Pilots should<br />
follow these procedures as long as they fit the emergency or abnormal situation. If at any<br />
time they are not adequate or do not apply, the Captain’s best judgement should prevail.<br />
Only the flight crew operating the <strong>air</strong>craft at the time the emergency occurs can evaluate the<br />
situation sufficiently to make the proper decision [USAir 1997]. The <strong>air</strong>craft operations<br />
230
manual also contains procedures for events such as missed approaches and encounters with<br />
windshear or severe turbulence. Procedures that are not <strong>air</strong>craft type specific are described<br />
in the <strong>air</strong>line’s Basic Operations Manual.<br />
Because normal as well as abnormal situations and procedures can be causal or contributing<br />
to accidents and incidents it is important for the scope <strong>of</strong> the causal <strong>risk</strong> model to<br />
encompass all.<br />
Subsidiary processes<br />
Flight crew training<br />
An average commercial <strong>air</strong> <strong>transport</strong> pilot’s career typically starts at a flying school where<br />
the pilot receives training for, successively, a private pilot license, a commercial pilot<br />
license, an IFR multi engine rating and a multi crew coordination course. Some pilots will<br />
have had their initial training in the military services. After this the pilot may spend some<br />
time at a smaller operator (e.g. business aviation), which initially requires type qualification<br />
training, and <strong>of</strong> course the periodic recurrent training, pr<strong>of</strong>iciency checks and line checks.<br />
When the pilot moves to a large <strong>air</strong>line, (s)he will initially again receive type qualification<br />
training, and during the operational career the periodic recurrent training, pr<strong>of</strong>iciency<br />
checks and line checks. Command qualification training will be required when the progress<br />
step is made from First Officer to Captain. New type qualification training will be required<br />
when the switch is made from one <strong>air</strong>craft type to another. Each training step may involve<br />
ground school, simulator training, training flights and line flight under supervision.<br />
Training flights are only required in case the simulators are not qualified for zero flight time<br />
training or in case <strong>of</strong> the first type qualification entering an <strong>air</strong>line.<br />
Air Traffic Control<br />
The captain <strong>of</strong> a flight is always responsible for the safety <strong>of</strong> the flight. In those areas that<br />
are under Air Traffic Control (ATC), the <strong>air</strong> traffic controller is responsible for the<br />
separation between <strong>air</strong>craft. Sufficient separation is required to prevent collisions in the <strong>air</strong><br />
and to prevent an <strong>air</strong>craft from entering the wake <strong>of</strong> a preceding <strong>air</strong>craft. This wake consists<br />
<strong>of</strong> a p<strong>air</strong> <strong>of</strong> counter rotating and slowly dissipating vortices. When an <strong>air</strong>craft enters a wake<br />
that has not yet dissipated, it can suddenly and unexpectedly start to roll, which can be<br />
dangerous if close to the ground. To meet this responsibility, the <strong>air</strong> traffic controller issues<br />
instructions that need to be obeyed by the pilot, but when the pilot is <strong>of</strong> the opinion that<br />
following the controller’s instruction compromises flight safety, the pilot is allowed to<br />
disregard the controller’s instruction. The <strong>air</strong>space is divided into different blocks (see<br />
Figure B2) and generally speaking each ATCo has responsibility for one such block.<br />
Horizontally the <strong>air</strong>space is divided into different sectors with each normally having a<br />
separate area controller. Within these sectors, the <strong>air</strong>craft fly along ATS routes. In the<br />
vicinity <strong>of</strong> the <strong>air</strong>port, the control zone (CTR) and terminal area (TMA) are additional<br />
blocks <strong>of</strong> <strong>air</strong>space to help control the flows <strong>of</strong> arriving and departing <strong>air</strong>craft. The area<br />
controllers handle <strong>air</strong>craft entering their sector on the way to the <strong>air</strong>port and also crossing<br />
traffic overflying the area, either military or civil. Aircraft can be led to a stack if they have<br />
to wait for arrival clearance. The area controller hands over to the arrivals controller either<br />
directly on the way to the <strong>air</strong>port, if there is no delay, or when leaving the stack, if there is<br />
delay. The arrivals controller takes the <strong>air</strong>craft from there until they are lined up for the<br />
runway and ILS is established. The tower controller then brings the <strong>air</strong>craft in to land. Once<br />
it has cleared the runway it is handed over to the ground controller who supervises the<br />
taxiing up to the gate. For departure there are usually two additional controllers; one who<br />
gives the en route clearance and a second who gives clearance for start-up and push-back.<br />
231
The ground controller then takes over for the taxiing to the holding point just before the<br />
take-<strong>of</strong>f runway. The tower controller then takes over for the take-<strong>of</strong>f up to 2000ft, when<br />
the departure controller takes over up to the point where the <strong>air</strong>craft is free <strong>of</strong> all conflict<br />
with other traffic at and around the <strong>air</strong>port. At this point the area controller takes over for<br />
the transit to the following sector/area.<br />
In controlled <strong>air</strong>space, flight crew and Air Traffic Control communicate by means <strong>of</strong> VHF<br />
radio. Communication involves instructions according to a protocol that is laid down in<br />
ICAO Annex 10, part II, Chapter 5: R/T. Air-ground radiotelephony communications must<br />
be conducted in the language normally used by the station on the ground or, preferably, in<br />
the English language.<br />
Sector<br />
Figure B2: Airspace schematic.<br />
CTR<br />
Upper Airspace<br />
TMA<br />
Sector<br />
Aircraft design and certification<br />
The Aircraft Type Certification process is <strong>of</strong>ficially initiated by the submission <strong>of</strong> an<br />
“application for a type certificate” by the <strong>air</strong>craft manufacturer. The regulator establishes<br />
the Type Certification Basis; the applicable rules and any additional requirements to which<br />
the manufacturer must show (and the regulator must find) compliance in order to be granted<br />
a Type Certificate. The regulator will now create a Type Certification Board, a management<br />
level group charged with confirming that all applicable regulations have been complied<br />
with prior to final approval <strong>of</strong> the particular design under evaluation. The regulator<br />
identifies significant certification items which will require special attention during the<br />
certification program. These items are described in “Issue Papers”. The manufacturer then<br />
submits data on how it is intended to demonstrate compliance with the applicable<br />
regulation in the form <strong>of</strong> a Certification Plan. After approval <strong>of</strong> the Certification Plan the<br />
actual certification process will start. Detailed design submittals begin, including drawings,<br />
reports, analyses, test plans and test reports. These data are reviewed and any revisions or<br />
additions that are found necessary must be incorporated before final acceptance by the<br />
authorities [Haubrich 1984].<br />
An important aspect <strong>of</strong> the <strong>air</strong>craft certification process is the flight test program. Flight test<br />
programs are divided into an evaluation flight test program and a certification flight-test<br />
232<br />
24,500 ft<br />
9,500 ft<br />
3,000 ft
program. The evaluation flight tests are executed by the manufacturer, usually in close cooperation<br />
but without direct involvement <strong>of</strong> the certifying authority in order to obtain a first<br />
overview <strong>of</strong> the handling and performance characteristics <strong>of</strong> the <strong>air</strong>craft. The certification<br />
flight tests are executed with the participation <strong>of</strong> representatives <strong>of</strong> the authority and<br />
partially flown by the authority’s test pilots.<br />
A Compliance Check List is composed which provides information concerning the<br />
substantiation information which has been provided to show compliance with applicable<br />
regulation. When the regulator determines that the manufacturer has demonstrated<br />
compliance with all applicable <strong>air</strong>worthiness standards, the required inspections have been<br />
satisfactory completed, and the required documentation is approved, the Type Certificate is<br />
issued. A Type Certificate Data Sheet is issued as part <strong>of</strong> the Type Certificate. It describes<br />
the conditions and limitations under which the <strong>air</strong>craft meets the applicable <strong>air</strong>worthiness<br />
requirements. Within 90 days after issuing the Type Certificate, a Type Inspection Report<br />
has to be issued which includes the final documentation <strong>of</strong> the ground inspection and flight<br />
test phase <strong>of</strong> the certification program. In addition to the Type Certification, a number <strong>of</strong><br />
provisions must cater for the <strong>air</strong>worthiness <strong>of</strong> each individual <strong>air</strong>craft. Before the<br />
manufacturer can produce <strong>air</strong>craft intended for sale it must obtain a Production Certificate.<br />
For each individual <strong>air</strong>craft coming <strong>of</strong>f the production line a Certificate <strong>of</strong> Airworthiness<br />
has to be issued. After the Type Certification is completed and <strong>air</strong>craft <strong>of</strong> the type are<br />
introduced into service, the authorities continue to monitor the safety <strong>of</strong> the design through<br />
a service difficulty reporting and analysis system.<br />
Aircraft maintenance<br />
Maintenance refers to ‘all activities necessary to keep the <strong>air</strong>craft in, or restore it to, a<br />
specified condition’. Aircraft maintenance is a complicated and costly business and is<br />
characterized by large amounts <strong>of</strong> regulations, procedures and documentation. This section<br />
describes generally the way in which a maintenance program is created and how it is<br />
implemented and executed.<br />
To ensure that the necessary regulations, guidelines and standards are applied and adhered<br />
to, and that the correct tasks and inspections are conducted at the correct time, every <strong>air</strong>craft<br />
type will have an approved <strong>air</strong>craft maintenance program. This lays down the mandatory<br />
minimum maintenance program and is produced by the Maintenance Review Board (MRB)<br />
consisting <strong>of</strong> manufacturers and aviation authorities, in consultation with the <strong>air</strong>lines, to<br />
ensure the continuous maintenance needs <strong>of</strong> the <strong>air</strong>craft are met. It includes details relating<br />
to the minimum maintenance tasks and inspections which have to be carried out on each<br />
<strong>air</strong>craft at pre-determined times, depending upon either the number <strong>of</strong> flying hours, number<br />
<strong>of</strong> flights or calendar time. Tasks and inspections above the absolute minimum should<br />
normally accompany those which are required and advice is included in the manufacturer’s<br />
documentation. Due to an <strong>air</strong>line’s fleet size, route structure, <strong>air</strong>craft utilization etc and<br />
from years <strong>of</strong> operational experience, the maintenance program can be customized for the<br />
individual <strong>air</strong>line.<br />
The actual implementation <strong>of</strong> the <strong>air</strong>craft maintenance schedule is a detailed and complex<br />
process. Most <strong>air</strong>lines have departments which are dedicated to the detailed planning,<br />
scheduling and control <strong>of</strong> <strong>air</strong>craft maintenance tasks and inspections. Aircraft maintenance<br />
is usually scheduled in ‘checks’ <strong>of</strong> varying proportions, ranging from walk-around<br />
inspections to heavy maintenance ‘D’ checks. The Production Planning / Engineering<br />
Department controls the contents <strong>of</strong> any maintenance check, in accordance with the <strong>air</strong>craft<br />
maintenance program and the manufacturer’s manual and decides when and where the<br />
233
<strong>air</strong>craft input will occur. They will therefore plan which particular <strong>air</strong>craft is due for which<br />
check and prepare and produce all job cards and documentation necessary to complete the<br />
check. They also ensure the correct spares, manpower, tools, equipment, hangar space and<br />
<strong>air</strong>craft are organised for a scheduled check in order that everything should be ready when<br />
the <strong>air</strong>craft comes in. This planning process will take about 4-5 weeks for a large<br />
commercial <strong>air</strong>craft like a Boeing 767.<br />
In the case <strong>of</strong> heavy maintenance, once the work has been planned, production control<br />
teams take over about 4 weeks before the <strong>air</strong>craft arrives. Sometimes a pre-input survey <strong>of</strong><br />
the <strong>air</strong>craft will be carried out by qualified personnel, who will establish the condition <strong>of</strong><br />
the <strong>air</strong>craft and highlight any areas where extra work will be needed, e.g. rep<strong>air</strong> <strong>of</strong><br />
unforeseen minor damage and long standing defects. In the 4 weeks prior to the <strong>air</strong>craft<br />
coming in, the proposed work schedule will be thoroughly reviewed and all work scheduled<br />
to teams <strong>of</strong> engineers. Milestones are created to enable the progress to be monitored. The<br />
same process would apply for light maintenance except time scales would be significantly<br />
reduced since the length <strong>of</strong> the input and amount <strong>of</strong> work would be less. Some <strong>air</strong>lines may<br />
try to schedule major work for periods <strong>of</strong> reduced activity (typically the winter months<br />
from September to March), to save on revenue which would otherwise be lost in down<br />
time.<br />
Once the actual contents <strong>of</strong> a check are known, resourcing <strong>of</strong> hangar space, people,<br />
materials, tools and equipment also takes place in this department to ensure that the work to<br />
be carried out can be achieved. This process is not as straightforward as it might seem,<br />
since for many inputs only about 60% <strong>of</strong> the work will be predictable beforehand; the rest<br />
<strong>of</strong> the work is raised only as the results <strong>of</strong> inspections or entries made in the <strong>air</strong>craft<br />
technical log.<br />
A few days before the <strong>air</strong>craft is scheduled to arrive in the hangar, the completed work<br />
package for that <strong>air</strong>craft will be forwarded to the appropriate hangar control centre. A work<br />
package is literally the package <strong>of</strong> work which defines and sets out all the activities, i.e.<br />
tasks and inspections which must be conducted for a scheduled check on a particular<br />
<strong>air</strong>craft. It typically contains a list <strong>of</strong> contents, job cards, a job card deviation list (to notify<br />
planning <strong>of</strong> jobs not done and therefore carried as Acceptable Deferred Defect (ADD)),<br />
Additional Work Requirements (i.e. non-critical extra tasks such as changing the cabin<br />
boarding tape), any relevant Service Bulletins or Airworthiness Directives, a list <strong>of</strong> parts<br />
and equipment needed and ordered, the dispatch reliability list and Certificate <strong>of</strong><br />
Maintenance release. The work package will be organised and checked by the shift<br />
manager who is responsible for monitoring the work progress and output <strong>of</strong> the work. Shift<br />
managers will locate tools, equipment, parts and documentation necessary for the job. They<br />
are also responsible for ensuring that they have enough staff on the shift and that such staff<br />
has received adequate training. The shift manager will liaise with Planning to advise on the<br />
man hours necessary for particular tasks in order to help plan the work.<br />
Once the <strong>air</strong>craft has come into the hangar the shift manager will allocate staff to a<br />
particular work area. Typically the resourcing <strong>of</strong> tasks and work allocation is written up on<br />
a control board in the control centre <strong>of</strong> each hangar, so that each technician will know when<br />
and where they will be working.<br />
Tasks are scheduled to technicians via ‘job cards’ which detail information in relation to an<br />
individual task, or a number <strong>of</strong> tasks, depending on the practices <strong>of</strong> the maintenance<br />
organisation. A major check may have as many as 5,000 - 10,000 job cards. Each card will<br />
234
contain a description <strong>of</strong> the task and contain information pertaining to the type <strong>of</strong> <strong>air</strong>craft,<br />
the identity <strong>of</strong> the <strong>air</strong>craft, the original work package the card is from and the zone <strong>of</strong> the<br />
<strong>air</strong>craft where the task is to be conducted. They will also indicate how long the task is<br />
expected to take and what license requirements are needed to be able to sign the job <strong>of</strong>f as<br />
completed. Although all job cards will contain the same basic information, the overall<br />
content and format <strong>of</strong> these cards will differ between maintenance organisations. All tasks<br />
will also have a reference to the relevant section <strong>of</strong> the Maintenance Manual. This<br />
Maintenance Manual contains a description <strong>of</strong> how to carry out every conceivable task on<br />
the <strong>air</strong>craft, and as such runs to thousands <strong>of</strong> pages. It includes detailed diagrams where<br />
necessary to aid in the location <strong>of</strong> components and structures. As previously noted, detailed<br />
planning can only be done for those tasks which were scheduled prior to input. The<br />
remaining unscheduled defect items will have been raised as defect cards from the original<br />
scheduled inspections, i.e. any defects which are discovered have job cards raised as they<br />
are discovered. During the pre-planning <strong>of</strong> a check, all job cards are arranged into suitable<br />
functional groups ready for the input. The job cards are distributed to the technicians by<br />
placing them on racks in designated areas. For example job cards appear on a number <strong>of</strong><br />
separate display boards depending on the nature <strong>of</strong> the tasks. The technicians will collect<br />
their assigned job cards from these racks to perform the tasks. On completion <strong>of</strong> the tasks<br />
the technician must sign or stamp in the designated place depending on what type <strong>of</strong> tasks<br />
they are licensed to complete. Safety critical tasks will require duplicate inspections. Once<br />
signed the job cards are returned to the <strong>air</strong>craft’s technical records where they are stored for<br />
a minimum <strong>of</strong> two years.<br />
For ramp maintenance, task resourcing and work allocation is a bit more hectic. For typical<br />
European <strong>air</strong>lines from about 6:00 -22:30 there are some 100 to 200 narrow body<br />
departures each day and it is the Traffic Coordinators job to assign technicians to particular<br />
<strong>air</strong>craft. The traffic coordinator will have a ‘time-line’ <strong>of</strong> daily departures with the<br />
technicians name, radio call and <strong>air</strong>craft registration shown against each time window. If an<br />
<strong>air</strong>craft is delayed the coordinator will try and reassign the work for an <strong>air</strong>craft to another<br />
technician. In this way they attempt to keep a technician or team <strong>of</strong> technicians assigned to<br />
an <strong>air</strong>craft for the duration <strong>of</strong> its stay rather than swapping and changing the schedule<br />
[O’Conner & Reynolds 1996, Roelen et al 2006a].<br />
Airport processes<br />
The <strong>air</strong>port operator is responsible for providing and maintaining the required infrastructure<br />
such as ground equipment, runways, buildings etc and provides services supporting the<br />
users <strong>of</strong> the <strong>air</strong>port in ground operations. The <strong>air</strong>port operator shares a safety responsibility<br />
and therefore sets requirements regarding the knowledge and the capabilities <strong>of</strong> its<br />
personnel, especially for those that work on ‘<strong>air</strong>side’. The following processes under<br />
responsibility <strong>of</strong> the <strong>air</strong>port organisation are most relevant with respect to aviation safety:<br />
• Design, construction and maintenance <strong>of</strong> infrastructure<br />
• Runway friction control<br />
• Prevention <strong>of</strong> foreign object damage<br />
• Prevention and mitigation <strong>of</strong> bird <strong>risk</strong>s<br />
• De-icing <strong>air</strong>craft<br />
• Control <strong>of</strong> obstacle clearances<br />
• Fuelling<br />
Infrastructure<br />
235
Basic principles for the design, construction and maintenance <strong>of</strong> runways and taxiways<br />
are prescribed by ICAO. Heavy maintenance <strong>of</strong> the runways is scheduled according to<br />
a long-range plan with the aim to accommodate the maintenance activities within the<br />
operational activities.<br />
Runway friction control<br />
Safe operation <strong>of</strong> <strong>air</strong>craft on the ground requires runways, taxiways and aprons to have<br />
sufficient friction. The slipperiness <strong>of</strong> an existing section <strong>of</strong> a runway can vary<br />
significantly, even within a matter <strong>of</strong> minutes, as a result <strong>of</strong> rubber deposits, (heavy)<br />
rain, snow and ice [Transport Canada 2004, Sinha 2002]. Especially under winter<br />
conditions, additional activities like sweeping and application <strong>of</strong> grit are required to<br />
prevent runways from becoming too slippery.<br />
Foreign object damage<br />
Any loose item that is lying around in the vicinity <strong>of</strong> the apron, taxiway or runway can<br />
cause serious damage to the <strong>air</strong>craft when the objects are ingested in the engine or<br />
strike vulnerable parts <strong>of</strong> the <strong>air</strong>craft during take-<strong>of</strong>f and landing. The <strong>air</strong>port tries to<br />
minimise the <strong>risk</strong> <strong>of</strong> this so-called ‘foreign object damage’ by a combination <strong>of</strong><br />
instructions and procedures for all personnel working on <strong>air</strong>side and by regular visible<br />
checks and sweeping activities.<br />
Birds<br />
Birds are a special case <strong>of</strong> ‘foreign objects. Collisions between <strong>air</strong>craft and birds can be<br />
catastrophic if the bird strikes a vital part <strong>of</strong> the <strong>air</strong>craft like the engine. The majority <strong>of</strong><br />
bird strikes take place during landing or take-<strong>of</strong>f, because the bird density is higher at<br />
the lower altitudes [Poot et al 2000]. The bird strike probability is influenced by the<br />
number <strong>of</strong> local birds and by migration. The local bird population depends on the<br />
layout <strong>of</strong> the <strong>air</strong>port and the <strong>air</strong>port vicinity. Local measures by the <strong>air</strong>port, such as<br />
habitat management and bird control (scaring, culling) can significantly reduce the <strong>risk</strong><br />
[Deacon & Rochard 2000]. Bird migration is more difficult to control for the <strong>air</strong>port,<br />
because this is largely unaffected by the <strong>air</strong>port itself.<br />
De-icing <strong>air</strong>craft<br />
Snow or ice on the wings <strong>of</strong> <strong>air</strong>craft can be a safety hazard, especially during take-<strong>of</strong>f,<br />
as the contaminants can disrupt the <strong>air</strong>flow over the wing and cause the <strong>air</strong>craft to stall<br />
out <strong>of</strong> control. Aircraft that have snow or ice on the wings are de-iced before take-<strong>of</strong>f<br />
to prevent these types <strong>of</strong> accidents. De-icing is performed by mobile de-icing trucks or<br />
in a stationary de-icing stand at the <strong>air</strong>port and involves spraying a de-icing fluid,<br />
typically a mixture <strong>of</strong> glycol and water, on the <strong>air</strong>craft’s surfaces. The de-icing fluid<br />
removes snow or ice and also prevents the build-up <strong>of</strong> additional layers <strong>of</strong> snow or ice<br />
for a predefined time period <strong>of</strong> time called the hold-over time. Typical values for the<br />
hold over time are 30 minutes.<br />
Obstacle free zones<br />
The <strong>air</strong>port must be permanently aware <strong>of</strong> any construction plans in the vicinity <strong>of</strong> the<br />
<strong>air</strong>port to prevent the obstacle free zones for departing and arriving <strong>air</strong>craft from<br />
becoming obstructed. If necessary the <strong>air</strong>port must take action at the level <strong>of</strong> the<br />
competent authorities.<br />
236
Fuelling<br />
This section describes the fuelling process at Amsterdam Airport Schiphol as<br />
performed by the Gezamenlijke Tankdienst Schiphol BV (GTS). The fuelling process<br />
at other <strong>air</strong>ports may be different.<br />
Aircraft fuel is directly <strong>transport</strong>ed to the <strong>air</strong>port by a pipeline from the storage<br />
facilities <strong>of</strong> the oil companies in Amsterdam and Rotterdam. At the <strong>air</strong>port fuel is<br />
stored in the fuel depot. The <strong>air</strong>craft fuel suppliers (the major oil companies) have to<br />
guarantee the quality <strong>of</strong> the <strong>air</strong>craft fuel. This quality is checked several times in<br />
different stages <strong>of</strong> the fuel production process. Upon arrival at the <strong>air</strong>port, the fuel will<br />
be left in the storage for 24 hours to allow water and sediments to settle down and be<br />
drained.<br />
There are two ways <strong>of</strong> tanking at Schiphol: A fuel truck can be filled with fuel from the<br />
storage facility and this fuel truck can then fuel the <strong>air</strong>craft directly from its tank, or the<br />
fuel can be distributed using the hydrant system; a network <strong>of</strong> pipelines underneath the<br />
apron. Using the hydrant system one worker with one fuel dispenser, a light vehicle,<br />
can perform refuelling.<br />
The <strong>air</strong>line may have requested a certain amount <strong>of</strong> fuel before the fuel truck or<br />
dispenser leaves GTS for refuelling a certain <strong>air</strong>craft. Alternatively the fuel operator<br />
may be informed by the <strong>air</strong>line representative on the ramp about the fuel quantity that<br />
has to be delivered when he arrives at the <strong>air</strong>craft. The <strong>air</strong>line can requests an initial<br />
amount <strong>of</strong> fuel, which will be filled up later with more fuel when accurate data on<br />
cargo and passengers has become available.<br />
The fuel operator connects the fuel hoses to the fuel panel on the <strong>air</strong>craft and the<br />
hydrant system, or directly from the tanker to <strong>air</strong>craft. The parking brake <strong>of</strong> the fuel<br />
truck engages automatically until the fuel hose is fully stowed. The required fuel<br />
quantity is entered either in the fuel panel underneath the wing by the <strong>air</strong>line<br />
representative or by the flight crew from the cockpit. The <strong>air</strong>craft’s fuel system will<br />
automatically divide the fuel over the tanks and will shut <strong>of</strong>f the valves when the<br />
requested amount has been reached. A fuel filter monitors the fuel flow and shuts <strong>of</strong>f<br />
the flow when it detects water in the fuel. The fuel operator monitors the process: he<br />
keeps an eye on the indicators, his equipment and ramp safety. There are four ‘safety<br />
tools’ to prevent ramp accidents: the dead mans handle (must be activated each 2<br />
minutes, otherwise the fuel flow will stop automatically), a lanyard (when pulled, the<br />
valves shut), a motor stop (when the pump fails, the fuel flow stops) and, finally, the<br />
hydrant emergency stop (which stops the fuel flow from the hydrant system).<br />
After tanking has been completed, the representative or ground-handling agent receives<br />
a fuel receipt (with fuel quantity, truck number etc.), that will be used for the<br />
preparation <strong>of</strong> the loadsheet. That sheet and the data on the delivered fuel quantity are<br />
provided to the cockpit crew. Finally, the fuel operator will disconnect and stow away<br />
the fuel hoses, remove the fuel tanker or dispenser and drive to the next <strong>air</strong>craft.<br />
Safety regulation and oversight<br />
Until the Second World War, aviation regulation had primarily been the responsibility <strong>of</strong><br />
national governmental bodies like for instance the Civil Aeronautics Authority in the US<br />
[Hansen et al 2005]. Towards the end <strong>of</strong> the war however the need for international<br />
237
egulation became evident and the International Civil Aviation Organisation ICAO, a<br />
specialised agency <strong>of</strong> the United Nations, was founded in 1944. ICAO’s main task is<br />
rulemaking. Certification and supervision are still national tasks [Molemaker et al 2005].<br />
ICAO is responsible for developing international rules governing all areas <strong>of</strong> civil aviation.<br />
In the Convention <strong>of</strong> Chicago in 1944 the ground rules were established to ensure a safe<br />
and orderly growth <strong>of</strong> civil aviation throughout the world. All European countries have<br />
ratified this treaty. ICAO’s Air Navigation Commission develops regulation in the form <strong>of</strong><br />
international Standards and Recommended Practices (SARPs). SARPs are designated as<br />
Annexes to the Convention on International Civil Aviation (the Chicago Convention) and<br />
are signed and adopted, in part and sometimes with reservations, by the individual ICAO<br />
member states.<br />
Annex 1 Personnel Licensing<br />
Annex 2 Rules <strong>of</strong> the Air<br />
Annex 3 Meteorological Service for International Air<br />
Navigation<br />
Annex 4 Aeronautical Charts<br />
Annex 5 Units <strong>of</strong> Measurement to be used in Air and Ground<br />
Operations<br />
Annex 6 Operation <strong>of</strong> Aircraft<br />
Part I International Commercial Air Transport – Aeroplanes<br />
Part II International General Aviation – Aeroplanes<br />
Part III International Operations – Helicopters<br />
Annex 7 Aircraft Nationality and Registration Marks<br />
Annex 8 Airworthiness <strong>of</strong> Aircraft<br />
Annex 9 Facilitation<br />
Annex 10 Aeronautical Telecommunications<br />
Volume I (Radio Navigation Aids)<br />
Volume II (Communication Procedures including those with<br />
PANS status)<br />
Volume III (Part I - Digital Data Communication Systems and Part<br />
II – Voice Communication Systems)<br />
Volume IV (Surveillance Radar and Collision Avoidance Systems)<br />
Volume V (Aeronautical Radio Frequency Spectrum Utilization)<br />
Annex 11 Air Traffic Services<br />
Annex 12 Search and Rescue<br />
Annex 13 Aircraft Accident Investigation<br />
Annex 14 Aerodromes<br />
Volume I Aerodrome Design and Operations<br />
Volume II Heliports<br />
Annex 15 Aeronautical Information Services<br />
Annex 16 Environmental Protection<br />
Volume I Aircraft Noise<br />
Volume II Aircraft Engine Emissions<br />
Annex 17 Security - Safeguarding International Civil Aviation<br />
against Acts <strong>of</strong> Unlawful Interference.<br />
Annex 18 The Safe Transport <strong>of</strong> Dangerous Goods by Air<br />
238
Although all regions <strong>of</strong> the world follow the same global rules that are established through<br />
the regulatory framework <strong>of</strong> ICAO, this does not ensure that all states achieve similar levels<br />
<strong>of</strong> safety. One <strong>of</strong> the reasons is that States can circumvent compliance with ICAO standards<br />
by filing a formal notice <strong>of</strong> difference to ICAO 92 . Another reason for this is that ICAO’s<br />
main task is rulemaking. Certification and supervision are national tasks, and as such prone<br />
to local interpretations and to the local ability to provide sufficient oversight [Molemaker et<br />
al 2005]. Within Europe, some <strong>of</strong> the national tasks are being transferred to a European<br />
level.<br />
There is not a single European body that is responsible for aviation safety. There are at least<br />
six organisations, and not every European state is a member <strong>of</strong> each organisation (Figure<br />
B3).<br />
ICAO EUR<br />
JAA (39)<br />
ECAC (42)<br />
Armenia<br />
Serbia & Montenegro<br />
Estonia<br />
Latvia<br />
Lithuania<br />
Azerbaijan<br />
Georgia<br />
European Union<br />
(25)<br />
Eurocontrol (34)<br />
Bosnia H.<br />
Albania Monaco<br />
Croatia Turkey<br />
FYROM Ukraine<br />
Moldavia Switzerland<br />
Norway*<br />
Belgium Malta<br />
Bulgaria Netherlands<br />
Denmark Poland<br />
Finland Romania<br />
Germany Slovak Rep.<br />
Ireland Slovenia<br />
Italy Sweden<br />
United Kingdom<br />
Austria Hungary<br />
Cyprus Luxembourg<br />
France Portugal<br />
Greece<br />
Czech. Rep.<br />
Spain<br />
* Iceland and Norway are EASA members, in addition to the 25 EU States<br />
Belarus<br />
Russian Fed.<br />
& Kaliningrad FIR<br />
CIS Asiatic Republics<br />
Iceland*<br />
GASR (21)<br />
May 2008<br />
Figure B3: Distribution <strong>of</strong> European member states across different bodies associated with<br />
flight safety.<br />
Almost all European states are a member <strong>of</strong> the European Civil Aviation Conference<br />
(ECAC). Its objective is to promote the continued development <strong>of</strong> a safe, efficient and<br />
sustainable <strong>air</strong> <strong>transport</strong> system. The Joint Aviation Authorities (JAA) is an associated body<br />
<strong>of</strong> ECAC representing the civil aviation regulatory authorities <strong>of</strong> a number <strong>of</strong> European<br />
States who have agreed to co-operate in developing and implementing common safety<br />
regulatory standards and procedures. This co-operation was intended to provide high and<br />
consistent standards <strong>of</strong> safety and a "level playing-field" for competition in Europe. Much<br />
emphasis is also placed on harmonising the JAA regulations with those <strong>of</strong> the USA. One <strong>of</strong><br />
92<br />
Many States do this. In the case <strong>of</strong> Annex 14 volume 1 (Aerodrome design and<br />
operations) for instance, 14 countries, including the Netherlands, have filed a notice <strong>of</strong><br />
difference [ICAO 2004b].<br />
239
its functions was to develop and adopt Joint Aviation Requirements (JARs) in the fields <strong>of</strong><br />
<strong>air</strong>craft design and manufacture, <strong>air</strong>craft operations and maintenance, and the licensing <strong>of</strong><br />
aviation personnel. Because JAA acted merely as a coordinating body, relying on the good<br />
will <strong>of</strong> national authorities across Europe, there remained differences in the application <strong>of</strong><br />
JAA rules across the member states. To further improve aviation safety the European<br />
Aviation Safety Agency (EASA) was established by the European Parliament and Council<br />
Regulation (EC)1592/2002 <strong>of</strong> 15 July 2002. The aim <strong>of</strong> EASA is to create a single<br />
regulatory framework to promote the highest common standards <strong>of</strong> safety and<br />
environmental protection in civil aviation, to oversee their uniform application across<br />
Europe, and to promote them at world level. As a first step, part <strong>of</strong> JAA’s competences (in<br />
the domains <strong>of</strong> certification <strong>of</strong> aeronautical products, parts and appliances and the approval<br />
<strong>of</strong> organisations and personnel engaged in the construction and maintenance <strong>of</strong> these<br />
products) have been transferred by the European Parliament to EASA. The European<br />
Commission later enlarged the competences <strong>of</strong> EASA with <strong>air</strong> operations, the licensing <strong>of</strong><br />
<strong>air</strong> crew and safety <strong>of</strong> foreign <strong>air</strong>craft (first extension). The intention is to further extend the<br />
competences <strong>of</strong> EASA in the field <strong>of</strong> regulation (including safety & interoperability) <strong>of</strong><br />
<strong>air</strong>ports, <strong>air</strong> traffic management and <strong>air</strong> navigation services.<br />
Eurocontrol, the European Organisation for the Safety <strong>of</strong> Air Navigation, was established in<br />
the 1960s by six states, including the Netherlands, with the intention <strong>of</strong> creating a single<br />
upper <strong>air</strong>space. The current (2008) membership <strong>of</strong> Eurocontrol numbers 31 states and the<br />
primary goal is “One Sky for Europe”; a seamless, pan-European Air Traffic Management<br />
(ATM) system. As one <strong>of</strong> the means to accomplish that goal, Eurocontrol’s Regulatory<br />
Committee and the accompanying Regulatory Unit draw up regulation with respect to ATM<br />
safety. Most prominent <strong>of</strong> these are so-called Eurocontrol Safety Regulatory Requirements<br />
(ESARRs) that impose high level mandatory requirements to ensure harmonised ATM<br />
safety regulation. ESARRs are implemented and enforced by Member States through<br />
transposition into the national legal order. In December 2003 the European Commission<br />
and Eurocontrol signed a memorandum <strong>of</strong> cooperation in a number <strong>of</strong> areas, including the<br />
implementation <strong>of</strong> a Single European Sky. Eurocontrol was given mandates for the<br />
development <strong>of</strong> implementing rules for the Single European Sky. The rules are then<br />
partially or completely adopted by the European Commission. The fact that Eurocontrol<br />
requires conversion <strong>of</strong> rules into national or Community legislation leads to differences in<br />
implementation <strong>of</strong> ESARRs among member states. Also, Eurocontrol does not have the<br />
authority to certify or approve systems and to supervise and enforce the implementation <strong>of</strong><br />
regulation.<br />
Until EASA will become responsible for regulation <strong>of</strong> <strong>air</strong>ports, related subjects are left to<br />
the responsibility <strong>of</strong> individual states on the basis <strong>of</strong> ICAO provisions. In 1995 a number <strong>of</strong><br />
European states established the Group <strong>of</strong> Aerodrome Safety Regulators (GASR) to develop,<br />
on a voluntary basis, harmonised safety regulation standards for <strong>air</strong>ports and ground aids.<br />
On a national level, states have governmental organisations for rulemaking, certification<br />
and oversight. In the United States this is the Federal Aviation Administration FAA. The<br />
US has a very strong position in all fields <strong>of</strong> <strong>air</strong> <strong>transport</strong>, including rulemaking. US<br />
aviation rules are published as Federal Aviation Regulations (FARs). EASA and FAA work<br />
together in harmonisation groups to keep the differences between US rules and European<br />
rules limited.<br />
240
Appendix C: <strong>Causal</strong> Model for Air Transport Safety (CATS)<br />
In February 1997 a Safety Policy Report on Civil Aviation was accepted by parliament as<br />
the policy framework for aviation safety in the Netherlands. An update <strong>of</strong> policy goals and<br />
an accompanying implementation plan for 2006 - 2010 was published in 2005. The<br />
development <strong>of</strong> a causal model <strong>of</strong> aviation safety is one <strong>of</strong> the primary topics <strong>of</strong> the Safety<br />
Policy agenda. According to the plan, a causal <strong>risk</strong> model should be used to identify weak<br />
spots in the aviation processes and assess their effect on overall safety. This plan was put<br />
into practice: in 2005, the Ministry <strong>of</strong> Transport and Water Management launched a threeyear<br />
research effort to develop a causal model for <strong>air</strong> <strong>transport</strong>. The project, which received<br />
the acronym CATS (<strong>Causal</strong> model for Air Transport Safety) was conducted by a<br />
consortium <strong>of</strong> Delft University <strong>of</strong> Technology, <strong>NLR</strong>, DNV and White Queen [Ale et al<br />
2006].<br />
The original design <strong>of</strong> the model was based on results <strong>of</strong> feasibility studies for <strong>air</strong> <strong>transport</strong><br />
<strong>risk</strong> modelling [Roelen at al 2000a, Roelen et al 2002, DNV 2002b] and work done in the<br />
area <strong>of</strong> occupational safety [Ale et al 1998, Bellamy et al 1999, Papazoglou et al 2003].<br />
This design called for the combination <strong>of</strong> three modelling techniques, Event Sequence<br />
Diagrams (ESDs), Fault Trees and Bayesian Belief Nets (BBNs), in a single model.<br />
The backbone <strong>of</strong> the model consists <strong>of</strong> 33 generic accident scenarios represented as Event<br />
Sequence Diagrams. All ESDs are linked-up and are seen as challenges that have to be<br />
faced during a flight, from taxi through the take-<strong>of</strong>f, climb, en-route, approach and landing<br />
phase. Each event in the ESD is defined such that there are only two possible outcomes.<br />
The outcome is determined by an underlying fault tree. There are separate fault trees for<br />
each event in each accident scenario. Human operator <strong>models</strong> are attached to the fault trees<br />
wherever humans are involved in the fault tree events. These human operator <strong>models</strong> are<br />
represented as Bayesian Belief Nets. Separate <strong>models</strong> were developed for flight crew, <strong>air</strong><br />
traffic controllers, and maintenance technicians. The whole model was converted into one<br />
single integrated BBN. This allows using distributions <strong>of</strong> values rather than point estimates,<br />
dependencies can be handles conveniently and consistently throughout the model, and it<br />
removes the need for artificial transfer point between ESDs, fault trees and BBNs. The<br />
BBN is <strong>of</strong> the ‘distribution free continuous’ type, developed by Kurowicka and Cooke<br />
[2004]. Nodes in the BBN are associated with continuous distributions and arcs with<br />
conditional rank correlations. This means that the complexity is linear with the number <strong>of</strong><br />
parent nodes rather than exponential as in a discrete BBN. Model calculations are made in<br />
UniNet, a continuous and discrete non parametric Bayesian Belief Net application,<br />
functioning as a module <strong>of</strong> UniCorn, a stand-alone uncertainty analysis s<strong>of</strong>tware package.<br />
UniNet was developed specifically for CATS.<br />
Managerial influences on accident probability are represented in the model as the resources<br />
and direction which management provides for front line workers (pilots, <strong>air</strong> traffic<br />
controllers, maintenance technicians) to perform their task <strong>of</strong> controlling <strong>risk</strong>, this being<br />
done through their own actions and through use <strong>of</strong> hardware and s<strong>of</strong>tware. Those resources<br />
are clustered under the headings <strong>of</strong> human and technical delivery systems. The ‘quality’ <strong>of</strong><br />
241
the delivery systems determines a management modifier, which is used to modify the<br />
distribution <strong>of</strong> human error probabilities in the human operator model [Lin et al 2008].<br />
Model quantification was conducted from accessible accident and incident data, audit<br />
information, data on normal operations and from expert judgement. The method for<br />
structured expert judgement developed by Cooke and Goossens [2000] was used to<br />
maximise the chance <strong>of</strong> unbiased estimates. The origin and a characterisation <strong>of</strong> the quality<br />
<strong>of</strong> each number are stored in a separate database to help users in interpreting the results <strong>of</strong><br />
the analysis, and also forms a basis for future data requirements.<br />
The model was developed down to a level <strong>of</strong> detail for which it was considered feasible to<br />
derive probability numbers from either data or expert judgement. In many cases however<br />
this is not the way in which safety managers actually look at the <strong>air</strong> <strong>transport</strong> system. They<br />
<strong>of</strong>ten use aggregated notions such as the complexity <strong>of</strong> an <strong>air</strong>port, the complexity <strong>of</strong><br />
<strong>air</strong>space, runway conditions, etc. These notions translate influences on the probabilities <strong>of</strong><br />
many <strong>of</strong> the model elements. Therefore a translation or mapping was made from the<br />
notions common in the <strong>air</strong> <strong>transport</strong> industry to the base events <strong>of</strong> the model.<br />
242
Curriculum Vitae<br />
Alfred Roelen was born on 21 April 1968 in Vught, the Netherlands. In 1986 he received<br />
his VWO diploma from the Maurick College in Vught, after which he studied aeronautical<br />
engineering at Delft University <strong>of</strong> Technology. He obtained his MSc degree in aeronautical<br />
engineering in 1992, the title <strong>of</strong> his Master’s thesis was ‘Design and analysis <strong>of</strong> a tilt-wing<br />
V/STOL <strong>air</strong>craft for 19 passengers’. From 1992 to 1994 he joined the Technological<br />
Designer programme at Delft University <strong>of</strong> Technology, Faculty <strong>of</strong> Aerospace Engineering,<br />
obtaining a Master <strong>of</strong> Technological Design (MTD) degree in 1994. In 1994 he joined the<br />
National Aerospace Laboratory <strong>NLR</strong>, Department <strong>of</strong> Flight Testing and Safety. He is now a<br />
senior scientist at <strong>NLR</strong>’s Air Transport Safety Institute.<br />
243
244