Fütterungsbedingte mikrobielle Zusammensetzung von Rinderkot ...
Fütterungsbedingte mikrobielle Zusammensetzung von Rinderkot ...
Fütterungsbedingte mikrobielle Zusammensetzung von Rinderkot ...

Create successful ePaper yourself
Turn your PDF publications into a flip-book with our unique Google optimized e-Paper software.
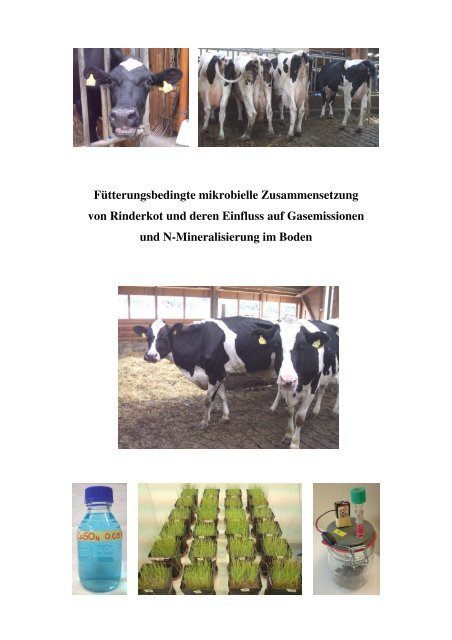
<strong>Fütterungsbedingte</strong> <strong>mikrobielle</strong> <strong>Zusammensetzung</strong><br />
<strong>von</strong> <strong>Rinderkot</strong> und deren Einfluss auf Gasemissionen<br />
und N-Mineralisierung im Boden
Fachgebiet Bodenbiologie und Pflanzenernährung<br />
Fachbereich Ökologische Agrarwissenschaften<br />
Universität Kassel<br />
<strong>Fütterungsbedingte</strong> <strong>mikrobielle</strong> <strong>Zusammensetzung</strong><br />
<strong>von</strong> <strong>Rinderkot</strong> und deren Einfluss auf Gasemissionen<br />
und N-Mineralisierung im Boden<br />
Dissertation<br />
zur Erlangung des akademischen Grades eines Doktors der Naturwissenschaften<br />
(Dr. rer. nat.)<br />
im Fachbereich Ökologische Agrarwissenschaften der Universität Kassel<br />
vorgelegt <strong>von</strong><br />
Daphne Isabel Jost<br />
Erstgutachter Prof. Dr. Albert Sundrum<br />
Zweitgutachter Prof. Dr. Rainer Georg Jörgensen<br />
Witzenhausen, September 2011
Mis queridos
Die vorliegende Arbeit wurde vom Fachbereich Ökologische Agrarwissenschaften der<br />
Universität Kassel als Dissertation zur Erlangung des akademischen Grades eines<br />
Doktors der Naturwissenschaften (Dr. rer. nat.) angenommen.<br />
Erstgutachter: Prof. Dr. A. Sundrum<br />
Zweitgutachter: Prof. Dr. R.G. Jörgensen<br />
Tag der mündlichen Prüfung: 2. Dezember 2011<br />
Eidesstattliche Erklärung<br />
Hiermit versichere ich, dass ich die vorliegende Dissertation selbständig und ohne<br />
unerlaubte Hilfe angefertigt und andere als die in der Dissertation angegebenen<br />
Hilfsmittel nicht benutzt habe. Alle Stellen, die wörtlich oder sinngemäß aus<br />
veröffentlichten oder unveröffentlichten Schriften entnommen sind, habe ich als solche<br />
kenntlich gemacht. Kein Teil dieser Arbeit ist in einem anderen Promotions- oder<br />
Habilitationsverfahren verwendet worden.<br />
Witzenhausen, den 30.09.2011 ....…………………………………..<br />
(Daphne I. Jost)
Vorwort<br />
Die vorliegende Dissertation wurde im Rahmen des DFG-Graduiertenkollegs 1397 an<br />
der Universität Kassel im Fachbereich Ökologische Agrarwissenschaften im Fachgebiet<br />
Bodenbiologie und Pflanzenernährung angefertigt, um die Anforderungen des<br />
akademischen Grades des Doktors der Naturwissenschaften (Dr. rer. nat.) zu erfüllen.<br />
Die Arbeit besteht aus drei wissenschaftlichen Publikationen. Die erste wurde bereits<br />
bei einer international begutachteten Fachzeitschrift veröffentlicht, die zweite und dritte<br />
stehen kurz vor der Einreichung. Die Artikel sind in Kapitel 4, 5 und 6 eingearbeitet.<br />
Kapitel 1 liefert eine generelle Einleitung zum Thema, während in Kapitel 2 die Ziele<br />
dieser Arbeit herausgestellt werden. Die methodische Herangehensweise, Vorversuche<br />
und nicht verwendete Ergebnisse werden im 3. Kapitel dargestellt. Kapitel 7 fasst die<br />
Ergebnisse der Kapitel 4, 5 und 6 zusammen, und wird in Kapitel 8 in Englisch<br />
aufgeführt. Eine Schlussfolgerung, die sich aus den Untersuchungen dieser Arbeit<br />
ergibt, bildet Kapitel 9. Einen Ausblick für weitere Untersuchungen findet sich in<br />
Kapitel 10. In Kapitel 11 finden sich die Quellen, die für die Kapitel 1, 2, 3 und 9<br />
benötigt wurden.<br />
Folgende Publikationen sind in die Arbeit eingebettet:<br />
Kapitel 4<br />
Jost, D. I., Indorf, I., Joergensen, R.G., Sundrum, A. (2011). The determination of<br />
microbial biomass in cattle faeces using soil microbiological methods. Soil Biology and<br />
Biochemistry 43, 1237-1244.<br />
Kapitel 5<br />
Jost, D. I., Aschemann, M., Lebzien, P., Joergensen, R.G., Sundrum, A. Microbial<br />
biomass in faeces of dairy cows affected by a nitrogen deficient diet. (to be submitted to<br />
Animal Feed Science and Technology).<br />
Kapitel 6<br />
Jost, D. I., Joergensen, R.G., Sundrum, A. Effect of cattle faeces with different<br />
microbial biomass content on soil properties, gaseous emissions and plant growth. (to<br />
be submitted to Agriculture, Ecosystems & Environment)
Inhaltsverzeichnis<br />
Abbildungsverzeichnis<br />
Tabellenverzeichnis<br />
Abkürzungsverzeichnis<br />
1. Einleitung ................................................................................................................... 1<br />
1.1 Steuerung des Nährstoffhaushalts in der Ökologischen Landwirtschaft .............. 1<br />
1.2 Biologische Indikatoren der Bodenfruchtbarkeit ................................................. 2<br />
1.3 N2O-Emissionen aus der Landwirtschaft ............................................................. 3<br />
2. Ziele der Arbeit .......................................................................................................... 4<br />
3. Methodik und Vorversuche ........................................................................................ 6<br />
3.1 Chloroform-Fumigations-Extraktionsmethode (CFE) ......................................... 6<br />
3.2 Ergosterolbestimmung .......................................................................................... 6<br />
3.3 Aminozuckerbestimmung .................................................................................... 7<br />
3.4 Luminometrische ATP-Bestimmung ................................................................... 8<br />
3.5 Probenkonservierung ............................................................................................ 9<br />
4. Determination of microbial biomass and fungal and bacterial distribution in cattle<br />
faeces ........................................................................................................................ 11<br />
4.1 Introduction ....................................................................................................... 12<br />
4.2 Materials and methods ....................................................................................... 14<br />
4.2.1. Faeces sampling, quality determination, and incubation ....................... 14<br />
4.2.2. Microbial biomass C and N estimation by CFE...................................... 16<br />
4.2.3. Ergosterol analysis .................................................................................. 17<br />
4.2.4. Amino sugar analysis .............................................................................. 17<br />
4.2.5. Statistical analysis ................................................................................... 18<br />
I
4.3 Results ............................................................................................................... 18<br />
4.3.1. Extractant efficiency, variability, and stability of the CFE method ........ 18<br />
4.3.2. Microbial biomass and ergosterol in incubated faeces........................... 20<br />
4.3.3. Relationships of microbial indices in faeces of different heifers............. 21<br />
4.4 Discussion.......................................................................................................... 22<br />
4.4.1. Microbial biomass in cattle faeces by the CFE method .......................... 22<br />
4.4.2. Bacterial and fungal distribution in cattle faeces ................................... 24<br />
4.4.3. Conclusions ............................................................................................. 26<br />
4.5 References ......................................................................................................... 27<br />
5. Microbial biomass in faeces of dairy cows affected by a nitrogen deficient diet ... 35<br />
5.1 Introduction ....................................................................................................... 36<br />
5.2 Materials and Methods ...................................................................................... 38<br />
5.2.1. Feeding regime ........................................................................................ 38<br />
5.2.2. Faecal C and N fractions ........................................................................ 39<br />
5.2.3. Microbial biomass C and N..................................................................... 40<br />
5.2.4. Ergosterol analysis .................................................................................. 40<br />
5.2.5. Amino sugars ........................................................................................... 41<br />
5.2.6. Statistical analysis ................................................................................... 42<br />
5.3 Results ............................................................................................................... 42<br />
5.4 Discussion ......................................................................................................... 47<br />
5.4.1. Microbial indices ..................................................................................... 47<br />
5.4.2. Bacterial and fungal contribution to microbial tissue ............................ 48<br />
5.4.3. Digestibility affected by N deficient diet ................................................. 50<br />
5.5 Conclusions ........................................................................................................ 51<br />
5.6 References .......................................................................................................... 52<br />
II
6. Effect of cattle faeces with different microbial biomass content on soil properties,<br />
gaseous emissions and plant growth ......................................................................... 59<br />
6.1. Introduction ...................................................................................................... 60<br />
6.2. Material and methods ....................................................................................... 61<br />
6.2.1. Soil ........................................................................................................... 61<br />
6.2.2. Faeces sampling and quality determination ........................................... 62<br />
6.2.3. Incubation experiment ............................................................................. 63<br />
6.2.4. Pot experiment ......................................................................................... 63<br />
6.2.5. Microbial biomass C and N..................................................................... 64<br />
6.2.6. Ergosterol analysis .................................................................................. 65<br />
6.2.7. Amino sugar analysis .............................................................................. 65<br />
6.2.8. Inorganic N.............................................................................................. 66<br />
6.2.9. Statistical analysis ................................................................................... 67<br />
6.3. Results .............................................................................................................. 67<br />
6.3.1. Differences in faeces characteristics ....................................................... 67<br />
6.3.2. Effects of faeces types on soil microorganisms and grass growth .......... 69<br />
6.4. Discussion......................................................................................................... 72<br />
6.4.1. Microbial indices ..................................................................................... 72<br />
6.4.2. Bacterial and fungal contribution to microbial tissue ............................ 73<br />
6.4.3. Effects of feeding regime and faeces composition ................................... 74<br />
6.4.4. Conclusions ............................................................................................. 76<br />
6.5. References ........................................................................................................ 76<br />
7. Zusammenfassung .................................................................................................... 82<br />
8. Summary .................................................................................................................. 84<br />
9. Schlussfolgerung und Ausblick ................................................................................ 86<br />
10. Literatur .................................................................................................................... 88<br />
11. Danksagung .............................................................................................................. 92<br />
III
Abbildungsverzeichnis<br />
Abb. 1a, b Pilzhyphen und -fruchtkörper auf <strong>Rinderkot</strong> nach 14 Tagen bei 25 °C ........ 7<br />
Abb. 2 Mikrobieller Biomasse-C in <strong>Rinderkot</strong> bei verschiedenen<br />
Konservierungsmethoden und Fütterungen. TM = Trockenmasse, HL =<br />
Hochleistung, LL = Niederleistung, HF = Färsen, N2 = schockgefroren in<br />
Flüssigstickstoff bei -210 °C, Gefriertruhe = langsam eingefroren bei -18<br />
°C, n = 6 ....................................................................................................... 10<br />
Abb. 3 <strong>Rinderkot</strong>konservierung in Flüssigstickstoff ............................................... 10<br />
Abb. 4 (Fig. 1): (a) Concentrations of microbial biomass C and (b) microbial<br />
biomass N in sub-samples of heifer 2 using different extractants over a 192<br />
h incubation of extracts at 25°C; bars indicate ± one standard error; n = 4. 19<br />
Abb. 5 (Fig. 2): (a) Concentrations of microbial biomass C, microbial biomass N,<br />
the microbial biomass C/N ratio; (b) concentrations of ergosterol and the<br />
ergosterol to microbial biomass C ratio during a 28-day incubation using<br />
faeces sub-samples of heifer 2 at 25°C; bars indicate ± one standard error; n<br />
= 4. ............................................................................................................... 20<br />
Abb. 6 (Fig. 1): Linear relationship between crude protein and microbial biomass<br />
N in faeces of dairy cows in relation to the different treatments (r = 0.55, n =<br />
30, P < 0.01). ............................................................................................... 46<br />
Abb. 7 (Fig. 2): Linear relationship between fungal C and ergosterol in faeces of<br />
dairy cows in relation to the different treatments (r = 0.43, n = 30, P < 0.01).<br />
..................................................................................................................... 46<br />
Abb. 8 (Fig. 3): Linear relationship between bacterial muramic acid and total N in<br />
faeces of dairy cows in rent treatments (r = -0.57, n = 30, P < 0.01). ......... 47<br />
Abb. 9 (Fig. 1): N2O emissions from different soil treatments during 14 days of<br />
incubation at 22°C; bars indicate ± one standard error; n = 6. .................... 70<br />
Abb. 10 (Fig. 2): Harvest of Italian ryegrass after growing for 62 days on different<br />
soil treatments. Plant dry weight er pot, plant nitrogen content and mineral<br />
nitrogen immobilised from the soil per pot; bars indicate ± one standard<br />
error; different letters indicate a significant difference (Tukey/Kramer, P <<br />
0.05); n = 6. .................................................................................................. 71<br />
IV
Tabellenverzeichnis<br />
Tabelle 1 ATP-Gehalt und daraus errechnete Biomasse-C in <strong>Rinderkot</strong> ...................... 9<br />
Tabelle 2 (Table 1): Variability of pH, elemental composition and organic<br />
components in cattle faeces from five identically fed heifers ..................... 15<br />
Tabelle 3 (Table 2): Variability of microbial indices in cattle faeces from five<br />
identically fed heifers .................................................................................. 21<br />
Tabelle 4 (Table 3): Variability of microbial indices in cattle faeces from five<br />
identically fed heifers .................................................................................. 22<br />
Tabelle 5 (Table 1): Feed intake of silage and concentrate in kg per day and diet<br />
composition.................................................................................................. 39<br />
Tabelle 6 (Table 2): Elemental composition and organic components in the faeces of<br />
dairy cows fed an N deficient and an N balanced diet ................................ 43<br />
Tabelle 7 (Table 3): Microbial biomass, amino sugar indices and microbial C in<br />
faeces of dairy cows fed an N deficient and an N balanced diet ................. 44<br />
Tabelle 8 (Table 4): Microbial ratios in faeces of dairy cows fed an N deficient and an<br />
N balanced diet ............................................................................................ 45<br />
Tabelle 9 (Table 1): Elemental composition and organic components in different<br />
cattle feeding regimes and in cattle faeces .................................................. 68<br />
Tabelle 10 (Table 2): Microbial biomass indices, amino sugar indices and microbial C<br />
in cattle faeces from different feeding regimes ........................................... 69<br />
Tabelle 11 (Table 3): Microbial indices in cattle faeces from different feeding regimes<br />
..................................................................................................................... 69<br />
Tabelle 12 (Table 4): Microbial indices, CO2 emissions and mineral nitrogen in<br />
different soil treatments after 14 days of incubation ................................... 70<br />
V
Abkürzungsverzeichnis<br />
ADF Säure-Detergenz-Faser<br />
ADL Säure-Detergenz-Lignin<br />
Al Aluminium<br />
ANOVA Varianzanalyse<br />
BaCl2<br />
Barriumdichlorid<br />
C Kohlenstoff<br />
Ca Kalzium<br />
CaCl2<br />
CHCl3<br />
Kalziumchlorid<br />
Chloroform<br />
Cmik (Cmic) Mikrobieller Biomasse-Kohlenstoff<br />
CO2<br />
CuSO4<br />
Kohlendioxid<br />
Kupfersulfat<br />
DFG Deutsche Forschungsgemeinschaft<br />
DMSO Dimethylsulfoxid<br />
DNA Desoxyribonukleinsäure<br />
Fe Eisen<br />
H2O Wasser<br />
HCl Salzsäure<br />
HNO3<br />
Salpetersäure<br />
HPLC Hochleistungsflüssigkeitschromatographie<br />
ICP-AES Induktiv gekoppeltes Hochfrequenzplasma-Atomemissionsspektrometer<br />
K Kalium<br />
K2SO4<br />
kEC, kEN<br />
Kaliumsulfat<br />
Extrahierbarer Teil des <strong>mikrobielle</strong>n Biomasse-Kohlenstoffs/-stickstoffs<br />
KOH Kaliumhydroxid<br />
M Molar<br />
Mg Magnesium<br />
Mn Mangan<br />
N Stickstoff<br />
N2O Distickstoffmonoxid, Lachgas<br />
Na Natrium<br />
VI
NaOH Natronlauge<br />
Na3PO4<br />
Trinatriumphosphat<br />
NDF Neutral-Detergenz-Faser<br />
NH3 Ammoniak<br />
NH4 + Ammonium<br />
NIRS Nahinfrarot-Spektroskopie<br />
Nmik (Nmic) Mikrobieller Biomasse-Stickstoff<br />
O2 Sauerstoff<br />
OPA ortho-Phthalaldehyd<br />
P Phosphor<br />
P Wahrscheinlichkeit<br />
PCA Perchlorsäure<br />
PLFA Phosphorlipidfettsäuren<br />
r Korrelationskoeffizient<br />
S Schwefel<br />
UDN unverdauter Futterstickstoff<br />
WHC Wasserhaltekapazität<br />
ZnSO4<br />
Zinksulfat<br />
VII
1. Einleitung 1<br />
1. Einleitung<br />
In der Landwirtschaft ist die Erhaltung und Förderung der Bodenfruchtbarkeit ein<br />
grundlegendes Ziel. Mikroorganismen regulieren die Bodenparameter und stellen somit<br />
eine wichtige Messgröße für die Bodenqualität dar. Hier spielt die Nährstoff-<br />
verfügbarkeit für das <strong>mikrobielle</strong> und pflanzliche Wachstum eine bedeutende Rolle.<br />
1.1 Steuerung des Nährstoffhaushalts in der Ökologischen Landwirtschaft<br />
In der Ökologischen Landwirtschaft werden keine synthetischen Dünger und<br />
Pestizide eingesetzt. Ziel ist, Nährstoffverluste zu minimieren (Vandermeer 1995;<br />
Mäder et al., 2002) und den Energieeinsatz zu optimieren (Kalk und Hülsbergen, 1996;<br />
Mäder et al., 2002). Die energetische Bilanz <strong>von</strong> ökologisch bewirtschafteten Betrieben<br />
kann günstiger sein als die <strong>von</strong> konventionellen (Salzgeber und Lörcher, 1997). Im<br />
Hinblick auf den innerbetrieblichen Nährstoffkreislauf und die Bodenfruchtbarkeit<br />
kommt der Düngerqualität eine große Bedeutung zu (Verhoeven et al., 1998).<br />
Das Verhältnis <strong>von</strong> anorganischem zu organisch gebundenem Stickstoff sowie die<br />
C/N-Relation in Wirtschaftsdünger spielen eine wichtige Rolle für die Nutzung durch<br />
die Pflanze bzw. die Mikroorganismen im Boden. Dieses Verhältnis ist wiederum stark<br />
<strong>von</strong> der Rationszusammensetzung abhängig (Van Bruchem et al., 2000). Auch<br />
Keimgehalt und Darmmilieu werden in hohem Maße <strong>von</strong> der Fütterung beeinflusst.<br />
Daraus resultieren unterschiedliche Ausscheidungs- und Bindungsverhältnisse <strong>von</strong><br />
Stickstoff, die auch das Emissionspotential <strong>von</strong> Ammoniak aus dem Kot erheblich<br />
beeinflussen. Im Gegensatz zum mineralischen Stickstoff wird der organisch gebundene<br />
Stickstoff nur durch den <strong>mikrobielle</strong>n Abbau pflanzenverfügbar. Dadurch kann er <strong>von</strong><br />
den Pflanzen langsamer, aber auch längerfristig aufgenommen werden. Der<br />
mineralische Teil des Stickstoffes im Kot liegt überwiegend als pflanzenverfügbares<br />
Ammonium vor.<br />
Bei Wiederkäuern wird die Stickstoffumsetzung vom Verhältnis der Energie-<br />
versorgung zum Stickstoffgehalt und der Abbaubarkeit des Proteins im Pansen<br />
bestimmt (Gruber 1990). Die Ausscheidung <strong>von</strong> organisch gebundenem Kot-N kann<br />
durch Erhöhung der Energiezufuhr bzw. durch einen erhöhten Anteil an Rohfaser in der<br />
Ration gesteigert werden. Allerdings setzt eine erhöhte Energiezufuhr durch leicht<br />
verdauliche Kohlenhydrate das C/N-Verhältnis herab. Aerobe Zersetzung im Boden und
1. Einleitung 2<br />
anaerobe Verdaulichkeit im Pansen sind <strong>mikrobielle</strong> Vorgänge, die auf enzymatischen<br />
Abbau beruhen. Diese Prozesse werden überwiegend <strong>von</strong> den Inhaltsstoffen des<br />
abzubauenden Pflanzenmaterials wie Stickstoff- und Fasergehalt bzw. der Art der<br />
Wirtschaftsdünger bestimmt.<br />
Über den Anteil an leicht verdaulichen Kohlenhydraten in der Futterration wird die<br />
Mikroflora im Pansen und im Dickdarm verändert. Mastrinder, deren Ration durch<br />
Kraftfutterbeigaben einen hohen Anteil leicht verdaulicher Kohlenhydrate enthielten,<br />
zeigten einen um mehr als 1000-fach höheren Keimgehalt im Kot im Vergleich zu mit<br />
Heu gefütterten Tieren (Diez-Gonzales et al., 1998; Harmon et al., 1999). Bei einer mit<br />
Rohprotein angereicherten Futterration traten zudem vermehrt phytotoxische und<br />
phenolhaltige Substanzen sowie biogene Amine auf, die negative Wirkungen auf den<br />
tierischen Organismus und die Mikroorganismen im Boden haben können (Van<br />
Bruchem et al., 2000). Die Fütterung verändert also die <strong>Zusammensetzung</strong> der<br />
Mikroorganismengemeinschaft im Dickdarm <strong>von</strong> Wiederkäuern und hat erhebliche<br />
Auswirkungen auf die mikrobiologischen Prozesse während der Mistlagerung und auf<br />
die Umsetzungsprozesse im Boden. Damit bildet die Fütterung eine zentrale<br />
Schnittstelle zwischen futterbaulichen und rationsgestaltenden Aspekten auf der einen<br />
Seite sowie der <strong>mikrobielle</strong>n Aktivität im Boden und der Nährstoffverfügbarkeit für das<br />
Pflanzenwachstum auf der anderen Seite. In welchem Ausmaß und mit welchem<br />
Aufwand durch die Fütterung der Humus- und Nährstoffhaushalt <strong>von</strong> Böden gesteuert<br />
werden kann, ist weitgehend unbekannt. Bislang liegen keine umfassenden Unter-<br />
suchungen zum Einfluss der Fütterung <strong>von</strong> Wiederkäuern auf das C/N-Verhältnis und<br />
die Mikroorganismen im Kot vor. Auch die Effekte auf den Boden nach <strong>Rinderkot</strong>-<br />
düngung sind kaum untersucht.<br />
1.2 Biologische Indikatoren der Bodenfruchtbarkeit<br />
Bodenorganismen sind für die Bodenfruchtbarkeit, d.h. die dauerhafte Produktivität<br />
<strong>von</strong> landwirtschaftlich genutzten Anbausystemen, <strong>von</strong> großer Bedeutung, vor allem<br />
aufgrund ihrer Rolle als treibende Kraft für die Nährstoffversorgung <strong>von</strong> Pflanzen<br />
(Singh et al., 1989). Die <strong>mikrobielle</strong> Biomasse kann mit einigen Methoden relativ leicht<br />
und schnell ermittelt werden. Diese Methoden beruhen auf der Messung <strong>von</strong><br />
organismen-spezifischen Zellinhaltsstoffen (Jenkinson 1988), Glucose-aktivierter<br />
Atmung (Anderson und Domsch, 1978) oder der Extraktion <strong>von</strong> Kohlenstoff und
1. Einleitung 3<br />
Stickstoff aus <strong>mikrobielle</strong>n Zellen kurz nach deren Abtöten (Brookes et al., 1985;<br />
Vance et al. 1987).<br />
Landwirtschaftlich genutzte Böden haben eine Biomasse zwischen 5 und 50<br />
Tonnen Frischmasse pro Hektar (Jörgensen 1995). Die <strong>mikrobielle</strong> Biomasse wird<br />
besonders durch die Menge, aber auch durch die Qualität der eingetragenen organischer<br />
Substanz beeinflusst. Je größer der Eintrag, desto größer ist die <strong>mikrobielle</strong> Biomasse<br />
(Höper und Kleefisch, 2001). Diese zählt damit als wichtigster Indikator für Boden-<br />
fruchtbarkeit, der im Boden direkt gemessen werden kann. Neben dem Eintrag an<br />
organischer Substanz wird die <strong>mikrobielle</strong> Biomasse auch durch Klimafaktoren und<br />
verschiedene Bodeneigenschaften beeinflusst. Wie die einzelnen Einflussgrößen<br />
zusammenspielen, ist Gegenstand vielfältigster Forschungsbemühungen.<br />
1.3 N2O-Emissionen aus der Landwirtschaft<br />
Ein wichtiger ökologischer Indikator zur Bewertung <strong>von</strong> Landbausystemen und<br />
ihrem Nährstoffmanagement ist die Belastung der Atmosphäre durch klimarelevante<br />
Emissionen. Die Freisetzung des Treibhausgases Distickstoffoxid (N2O) aus land-<br />
wirtschaftlich genutzten Böden ist hierbei <strong>von</strong> zentraler Bedeutung, da die Land-<br />
wirtschaft der bedeutendste Verursacher anthropogener N2O-Emissionen ist. Dieses Gas<br />
trägt sowohl zum globalen Treibhauseffekt als auch zum Ozonabbau in der Stratosphäre<br />
bei (IPCC, 1997). N2O-Emissionen aus landwirtschaftlichen Produktionsflächen haben<br />
ihren Ursprung hauptsächlich in den Prozessen der Nitrifikation und Denitrifikation, die<br />
durch Bodenbakterien verursacht werden, (Firestone und Davidson, 1989). Die<br />
wichtigste Ursache erhöhter Emissionen aus landwirtschaftlich genutzten Böden ist der<br />
N-Eintrag. Ungenügend dokumentiert ist die Wirkung unterschiedlicher organischer<br />
Wirtschaftsdünger auf die Bildung und Emission <strong>von</strong> N2O. Da die Datengrundlage nicht<br />
ausreicht, um Dünger-abhängige Emissionsfaktoren anzugeben, wird als grobe<br />
Schätzung derzeit <strong>von</strong> einem einheitlichen Emissionsfaktor für organische und<br />
mineralische N-Düngung ausgegangen (1.25% des N-Eintrags unter Berücksichtigung<br />
<strong>von</strong> N-Verlusten als NH3 und NOx) (IPCC 2001). Unberücksichtigt bleibt hierbei, dass<br />
sich die N-Dynamik in Abhängigkeit der Düngerform erheblich unterscheiden kann. Bei<br />
organischen Düngern können N2O-Emissionen durch eine gesteigerte O2-Zehrung auch<br />
aus anderen N-Pools induziert werden (Flessa et al., 1995; Sehy 2004).
2. Ziele der Arbeit 4<br />
2. Ziele der Arbeit<br />
Im Rahmen des DFG-Graduiertenkollegs "Steuerung des Humus und Nährstoff-<br />
haushalts in der Ökologischen Landwirtschaft" sollen im Fachgebiet Tierernährung und<br />
Tiergesundheit in Zusammenarbeit mit dem Fachgebiet Bodenbiologie und Pflanzen-<br />
ernährung die Auswirkungen der Futterration mit unterschiedlichen Anteilen leicht<br />
verdaulicher Kohlenhydrate in Kombination mit unterschiedlichen Rohprotein- und<br />
Rohfasergehalten, auf die <strong>mikrobielle</strong> Aktivität im Kot des Endarms sowie auf das C/N-<br />
Verhältnis im Kot untersucht werden. Bei dem zu bearbeitenden Projekt handelt es sich<br />
um ein interdisziplinäres Forschungsvorhaben an der Schnittstelle zwischen Boden-<br />
biologie, Umweltchemie und Tierernährung.<br />
Erforscht werden Interaktionen zwischen verschiedenen Nutzungsoptionen bei der<br />
Fütterung <strong>von</strong> Wiederkäuern und der Zielgröße Bodenfruchtbarkeit. Ziel ist die<br />
Beeinflussung der <strong>mikrobielle</strong>n Aktivität im Boden durch unterschiedliche Kot-<br />
qualitäten zu erfassen und schließlich die Düngerqualität durch gezielte Fütterung zu<br />
steuern. Eine Kombination <strong>von</strong> unterschiedlichen Futterkomponenten soll zur Auf-<br />
wertung des Wirtschaftsdüngers und zur Bodenverbesserung beitragen. Außerdem soll<br />
die Grundlage geschaffen werden, Ressourcennutzung effizienter zu gestalten und tier-<br />
bedingte Umweltbelastungen zu verringern.<br />
Die vielfältigen Interaktionen zwischen der Nährstoffzusammensetzung und den<br />
<strong>mikrobielle</strong>n Umsetzungen im Pansen und im Dickdarm der Wiederkäuer haben eine<br />
große Variation in der Beschaffenheit des Wirtschaftsdüngers zur Folge. Daraus<br />
resultiert ein entsprechendes Optimierungspotential im Hinblick auf eine zielgerichtete<br />
Abstimmung der beteiligten Steuerungsfaktoren mit dem Ziel, die Nutzung vorhandener<br />
Nährstoffpotentiale zu verbessern. Hier setzt das Forschungsvorhaben an. Gleichzeitig<br />
soll die Variationsbreite ermittelt werden, welche die Eigenschaften der Wirtschafts-<br />
dünger unter spezifischen Voraussetzungen beeinflusst. Diese führt zu einer variablen<br />
Düngungswirkung auf Bodenmikroorganismen und Pflanzen.<br />
In Laborexperimenten soll die <strong>mikrobielle</strong> Biomasse aus Kotproben <strong>von</strong> Milch-<br />
kühen ermittelt werden. Einen weiteren Schwerpunkt der Arbeiten bildet der Vergleich<br />
verschiedener Methoden zur Bestimmung <strong>mikrobielle</strong>r Parameter in Kotproben. Die<br />
Untersuchungen schließen die Bestimmung der Nährstoffgehalte und Vergleiche<br />
zwischen Tieren verschiedener Alters- bzw. Nutzungsklassen ein. In einem Fütterungs-<br />
versuch sollen schließlich die Auswirkungen der <strong>Zusammensetzung</strong> <strong>von</strong> Futterrationen
2. Ziele der Arbeit 5<br />
auf die Kotqualität untersucht werden. Die Kotproben werden für nachfolgende Unter-<br />
suchungen zur Bestimmung der Mikroorganismenaktivität im Boden in Inkubations-<br />
experimenten und zur Pflanzenverfügbarkeit <strong>von</strong> Stickstoff in Gewächshausgefäß-<br />
versuchen verwendet. Ziel ist hierbei auch die Bewertung unterschiedlicher Fütterungs-<br />
strategien hinsichtlich der N-Umsetzung und der Emission <strong>von</strong> N2O und CO2.
3. Methodik und Vorversuche 6<br />
3. Methodik und Vorversuche<br />
Die nachfolgenden Methoden wurden an <strong>Rinderkot</strong> getestet und angepasst.<br />
Ausführliche Informationen zur Probenbehandlung finden sich in der ersten Publikation<br />
(Kapitel 4.2). Bisher nicht verwendete Ergebnisse, z.B. zur Methode der Adenylat-<br />
bestimmung, werden ebenfalls dargestellt.<br />
3.1 Chloroform-Fumigations-Extraktionsmethode (CFE)<br />
Für Bodenproben wird zur Bestimmung der <strong>mikrobielle</strong>n Biomasse häufig die<br />
Chloroform-Fumigations-Extraktionsmethode (CFE) nach Vance et al. (1987)<br />
angewendet. Die Begasung (Fumigation) <strong>von</strong> Bodenmaterial mit CHCl3 bewirkt eine<br />
Zerstörung der Zellmembranen lebender Organismen. Dadurch steigt nach der<br />
Entfernung des Chloroforms der Anteil an extrahierbaren Substanzen gegenüber einer<br />
unbegasten Bezugsbodenprobe (Jenkinson, 1966). Das Prinzip der CFE-Methode beruht<br />
darauf, dass diese Zunahme proportional zu der <strong>mikrobielle</strong>n Biomasse ist, die im<br />
Boden vorhanden war (Brookes et al., 1985; Vance et al., 1987).<br />
Diese Vorgehensweise wurde an Kotproben in diesem Forschungsprojekt getestet,<br />
war jedoch in ihrer ursprünglichen Form in der Praxis nicht anwendbar, da sie keine<br />
messbaren Ergebnisse erzielte. Vollkommen andere Eigenschaften in der Textur, den<br />
Inhaltsstoffen und der Anzahl lebender bzw. toter Mikroorganismen verlangten einige<br />
Modifikationen der Methode (siehe 4.2.2.). Der Vorteil dieser Methode besteht vor<br />
allem in der ausschließlichen Erfassung intakter Zellen. So kann neben der Bakterien-<br />
und Pilzbiomasse auch die der im Kot vorkommenden Archeen quantifiziert werden.<br />
3.2 Ergosterolbestimmung<br />
Ergosterol ist ein wichtiger Bestandteil pilzlicher Zellmembranen (Weete und<br />
Weber, 1980) und wird daher als Biomarker für die Biomasse <strong>von</strong> Pilzen eingesetzt.<br />
Sterole machen bis zu 1% der Trockensubstanz der Pilze aus, wobei Ergosterol bei der<br />
Mehrzahl der Pilze einen Anteil <strong>von</strong> 90% und mehr einnehmen kann (Djajakirana et al.,<br />
1996).
3. Methodik und Vorversuche 7<br />
Der Einfluss der Fütterung wird auch im Hinblick auf die pilzliche Biomasse (Abb.<br />
1) untersucht und als vergleichende Größe der Ergosterolgehalt bestimmt. Die Methode<br />
<strong>von</strong> Djajakirana et al. (1996) bzw. Joergensen et al. (2000) mit Ethanolextraktion<br />
lieferte keine Messergebnisse an der HPLC. Auch verschiedene Extraktionsverhältnisse<br />
(1:200, 1:100, 1:50) sowie Zentrifugation der Extrakte führten zu keiner Verbesserung.<br />
Durch Verunreinigungen der Extrakte zeigten die Chromatogramme keine<br />
integrierbaren Ergosterolpeaks. Die Extraktion mit Petrolether nach Zelles et al. (1987)<br />
hingegen führte zum Erfolg und wurde für <strong>Rinderkot</strong> adaptiert. (Kapitel 4.2.3.)<br />
Abb. 1a, b Pilzhyphen und -fruchtkörper auf <strong>Rinderkot</strong> nach 14 Tagen bei 25 °C<br />
3.3 Aminozuckerbestimmung<br />
Im Boden gelten Aminozucker als <strong>mikrobielle</strong> Residuen (Amelung, 2001; Amelung<br />
et al., 2008). Muraminsäure ist ein Zellwandbestandteil <strong>von</strong> Bakterien. Glucosamin ist<br />
ebenfalls ein Bestandteil der Bakterienzellwand, daneben kommt es in den Zellwänden<br />
vieler Pilze vor. Aus dem Verhältnis <strong>von</strong> Muraminsäure und Glucosamin lässt sich das<br />
Bakterien-Pilzverhältnis bestimmen (Engelking et al., 2007). Die Herkunft <strong>von</strong> Galacto-<br />
samin ist nicht geklärt, es wird aber angenommen, dass das meiste Galactosamin im<br />
Boden aus Bakterien stammt. Über die Herkunft <strong>von</strong> Mannosamin ist wenig bekannt.<br />
Die Probenaufbereitung für die Aminozuckermessung mittels HPLC erfolgte<br />
zunächst nach Zhang und Amelung (1996) und schließlich nach Appuhn et al. (2004).<br />
Die erste Methode enthielt mehrere Aufreinigungsschritte und sollte für möglichst reine,<br />
leicht messbare Probenextrakte garantieren. Dieser Effekt war im Vergleich zur zweiten<br />
Methode jedoch gering. Zudem ergab Letztere höhere Aminozuckergehalte und erwies<br />
sich als anwenderfreundlicher, deshalb wurde sie für die Kotproben favorisiert (Kapitel<br />
4.2.4).
3. Methodik und Vorversuche 8<br />
3.4 Luminometrische ATP-Bestimmung<br />
Adenosintriphosphat (ATP) ist eine wichtige Energiekomponente im Metabolismus<br />
aller Lebewesen (Wolstrup und Jensen, 2008). Der ATP-Gehalt des Bodens steht in<br />
engem Zusammenhang zu anderen Biomasseindices, wie z.B. <strong>mikrobielle</strong>r Kohlenstoff,<br />
Stickstoff, usw. Er kann als unabhängiger Schätzwert des Biomassegehaltes im Boden<br />
dienen und zeigt einen starken Zusammenhang mit der CFE-Methode (Brookes et al.,<br />
1987). Probleme können bei der ATP-Extraktion auftreten, zum Beispiel eine<br />
unzureichende ATP-Freisetzung aus lebenden Zellen und ATP-Hydrolyse durch<br />
ATPasen. Verschiedene Extraktions-methoden sollen für <strong>Rinderkot</strong> getestet und der<br />
ATP-Gehalt anschließend enzymatisch mit einem Luminometer gemessen werden<br />
(Luciferin-Luciferase-Assay nach Jenkinson und Oades, 1979).<br />
Für die enzymatische Messung der Adenylatgehalte im Kot wurden verschiedene<br />
Extraktionsmethoden (Jenkinson und Oades, 1979; Brookes et al., 1987; Redmile-<br />
Gordon, 2011) und -verhältnisse getestet. Außerdem wurde als Vergleich die Methode<br />
<strong>von</strong> Dyckmans und Raubuch (1997) angewendet und an der HPLC gemessen. Die<br />
Extraktionseffizienz <strong>von</strong> Ultraschallsonde und Ultraschallbad wurde ebenfalls<br />
verglichen. Es ergaben sich keine signifikanten Unterschiede.<br />
Als Extraktionsmittel wurden verwendet:<br />
• Na3PO4/DMSO (Dyckmans und Raubuch, 1997)<br />
• TCA+P (Jenkinson und Oades, 1979; Brookes et al., 1987)<br />
• TCA+P+Imidazol (Redmile-Gordon, 2011)<br />
• PCA (Jensen and Jørgensen, 1994)<br />
Folgende Extraktionsverhältnisse wurden getestet (g Frischmasse:ml Extraktionsmittel):<br />
DMSO: 1:10, 1:40, 1:80, 1:160<br />
TCA: 1:12,5; 1:25, 1:50, 1:100, 1:150, 1:300, 1:400, 1:500, 1:1000, 1:5000<br />
Höhere Extraktionsverhältnisse ergaben zwar höhere ATP-Werte, allerdings waren über<br />
einem Verhältnis <strong>von</strong> 1:50 die Standardabweichungen zu groß.<br />
Um einen Fehler durch die Extraktfärbung der Proben auszuschließen, wurde<br />
schließlich für die Kontrollen (Blanks) und Standards der Puffer mit sterilisiertem Kot<br />
angesetzt, („Braune Matrix“). Stabile Ergebnisse mit geringer Streuung ergaben sich<br />
erst bei einer Vorinkubation der Extrakte nach Enzymzugabe <strong>von</strong> 1-2 Stunden auf Eis
3. Methodik und Vorversuche 9<br />
(Tabelle 1). Ohne Inkubation wurden keine stabilen Messwerte erreicht. Durch die<br />
chemische Lichtreaktion ergaben sich hier starke Variationen.<br />
Tabelle 1 ATP-Gehalt und daraus errechnete Biomasse-C in <strong>Rinderkot</strong><br />
PCA<br />
(1:20)<br />
TCA + Imidazol<br />
(1:50)<br />
(µg ATP g -1 TM)<br />
MW 5.3 2.3 6.2<br />
CV (%) 19 14 33<br />
Wiederfindung Probe (%) 83 68 102<br />
Wiederfindung B-Blank (%) 74 98 105<br />
Biomasse C* (µg g -1 TM) 636 276 744<br />
TCA + Imidazol<br />
(1:100)<br />
MW = Mittelwert, TM = Trockenmasse, Färse 113 (PCA: n = 3, TCA: n = 5),<br />
*berechnet nach Oades und Jenkinson, 1979<br />
Redmile-Gordon et al. (2011) wiesen im Boden ATP-Gehalte <strong>von</strong> 0.6-7.6 µg g -1 TM<br />
nach. Im Dickdarminhalt <strong>von</strong> Schweinen finden Jensen und Jørgensen (1994) 28 und<br />
Lindecrona et al., (2003) 14 µg ATP g -1 TM. Wenn man den Umrechnungsfaktor <strong>von</strong><br />
Oades und Jenkinson (1979) annimmt und die ATP-Gehalte mit 120 multipliziert, so<br />
sind die errechneten Biomassewerte deutlich zu niedrig für <strong>Rinderkot</strong>, denn der<br />
<strong>mikrobielle</strong> Biomassegehalt aus der CFE-Methode beträgt 9.7 mg g -1 TM.<br />
Ein Grund für die niedrigen ATP-Werte kann die Kotkonservierung durch das<br />
Einfrieren der Proben bei -18 °C sein. In Stickstoff eingefrorene Kotproben wurden<br />
noch nicht getestet.<br />
3.5 Probenkonservierung<br />
Im Zusammenhang mit den Experimenten für die dritte Publikation wurden zwei<br />
Methoden der Kotkonservierung verglichen. Die Kotproben wurden in zwei gleich<br />
große Portionen aufgeteilt, die eine Hälfte langsam bei -18 °C einfroren und die andere<br />
in flüssigem Stickstoff bei -210 °C schockgefroren. Die zweite Methode ergab deutlich<br />
geringere Standardabweichungen und einen höheren Gehalt an <strong>mikrobielle</strong>m Biomasse-<br />
C (Abb. 2). Teilweise erwiesen sich C- oder N-Gehalte in den Extrakten der Gefrier-<br />
proben (-18 °C) als nicht messbar. Aufgrund dieser Erkenntnisse wurden für die<br />
folgenden Experimente nur die Stickstoffproben verwendet.
3. Methodik und Vorversuche 10<br />
Abb. 2 Mikrobieller Biomasse-C in <strong>Rinderkot</strong> bei verschiedenen<br />
Konservierungsmethoden und Fütterungen. TM = Trockenmasse,<br />
HL = Hochleistung, LL = Niederleistung, HF = Färsen, N2 =<br />
schockgefroren in Flüssigstickstoff bei -210 °C, Gefriertruhe =<br />
langsam eingefroren bei -18 °C, n = 6<br />
Die Kotkonservierung mit Flüssigstickstoff erfolgt in handelsüblichen Gefrierbeuteln.<br />
Die homogenisierten Proben werden darin eingewogen, offen in eine Styroporkiste<br />
gelegt und der Stickstoff direkt auf die Proben gegossen. Die Kotproben sollten im<br />
Stickstoff verbleiben, bis sie vollständig durchgefroren sind (Abb. 3).<br />
Abb. 3 <strong>Rinderkot</strong>konservierung in Flüssigstickstoff
4. Determination of microbial biomass and fungal and bacterial distribution in cattle faeces 11<br />
4. Determination of microbial biomass and fungal and<br />
bacterial distribution in cattle faeces<br />
Soil Biology and Biochemistry (2011)<br />
Daphne Isabel Jost ab* , Caroline Indorf b , Rainer Georg Joergensen b , Albert Sundrum a<br />
a Department of Animal Nutrition and Animal Health, University of Kassel,<br />
Nordbahnhofstr. 1a, 37213 Witzenhausen, Germany<br />
b Department of Soil Biology and Plant Nutrition, University of Kassel,<br />
Nordbahnhofstr. 1a, 37213 Witzenhausen, Germany<br />
Abstract<br />
As an important component of organic fertilizers, animal faeces require methods for<br />
determining diet effects on their microbial quality to improve nutrient use efficiency in<br />
soil and to decrease gaseous greenhouse emissions to the environment. The objectives<br />
of the present study were (i) to apply the chloroform fumigation extraction (CFE)<br />
method for determining microbial biomass in cattle faeces, (ii) to determine the fungal<br />
cell-membrane component ergosterol, and (iii) to measure the cell-wall components<br />
fungal glucosamine and bacterial muramic acid as indices for the microbial community<br />
structure. Additionally, ergosterol and amino sugar data provide independent control<br />
values for the reliability of the microbial biomass range obtained by the CFE method. A<br />
variety of extractant solutions were tested for the CFE method to obtain stable extracts<br />
and reproducible microbial biomass C and N values, leading to the replacement of the<br />
original 0.5 M K2SO4 extractant for 0.05 M CuSO4. The plausibility of the data was<br />
assessed in a 28-day incubation study at 25 °C with cattle faeces of one heifer, where<br />
microbial biomass C and N were repeatedly measured together with ergosterol. Here,<br />
the microbial biomass indices showed dynamic characteristics and possible shifts in the<br />
microbial community. In faeces of five different heifers, the mean microbial biomass<br />
* Corresponding author. Tel.: + 49 5542 98 1523; e-mail: daphne.jost@arcor.de
4. Determination of microbial biomass and fungal and bacterial distribution in cattle faeces 12<br />
C/N ratio was 5.6, the mean microbial biomass to organic C ratio was 2.2%, and the<br />
mean ergosterol to microbial biomass C ratio was 1.1‰. Ergosterol and amino sugar<br />
analysis revealed a significant contribution of fungi, with a percentage of more than<br />
40% to the microbial community. All three methods are expected to be suitable tools for<br />
analysing the quality of cattle faeces.<br />
Keywords: Microbial biomass C and N, Ergosterol, Glucosamine, Muramic acid<br />
4.1 Introduction<br />
Animal faeces are an important source of nutrients (Lovell and Jarvis, 1996; Ma et<br />
al., 2007; Wachendorf and Joergensen, 2011) and an important component of organic<br />
fertilizers, such as slurry and farmyard manure (FYM). The positive effects of FYM on<br />
activity and biomass of soil microorganisms have been repeatedly evaluated in long-<br />
term experiments on different soil types (Mäder et al., 2002; Böhme et al., 2005;<br />
Elfstrand et al., 2007). Soils fertilized with FYM contain higher contents of soil organic<br />
C and microbial biomass C, but lower contents of saprotrophic fungi and exhibit lower<br />
rates of microbial activity than those receiving similar amounts of C as straw (Scheller<br />
and Joergensen, 2008; Heinze et al., 2010). These data suggest that strong differences in<br />
the quality of organic fertilizers have strong effects on soil microorganisms and<br />
decomposition processes. However, long-term FYM experiments are usually based on<br />
the application of cattle manure without considering the variation of its quality. There is<br />
evidence that the fate of animal faeces in soil, i.e. its degradation and entering into the<br />
nutrient cycles, depends not only on the animal species but to a high degree on the<br />
feeding strategy (van Vliet et al., 2007). The N concentration of ruminant faeces has<br />
been shown to decrease with diet digestibility (Kyvsgaard et al., 2000; Sørensen et al.,<br />
2003). These differences in the concentration of nutrients and organic components also<br />
affect the microbial community of the faeces (van Vliet et al., 2007).<br />
Considerable data is available on pathogenic and coliform bacteria in manure (van<br />
Kessel et al., 2007), but information on naturally occurring microorganisms is limited<br />
(Frostegård et al., 1997; Gattinger et al., 2007; van Vliet et al., 2007). However, it is<br />
well-documented from experiments with other organic substrates that the substrate<br />
colonising microbial community has an important influence on further decomposition<br />
processes (Flessa et al., 2002) and directly adds significant amounts of microorganisms<br />
to the autochthonous soil microbial biomass (Rasul et al., 2008). Cattle faeces contain a
4. Determination of microbial biomass and fungal and bacterial distribution in cattle faeces 13<br />
highly dynamic community of bacteria, archaea and fungi that has yet to be sufficiently<br />
quantified by the methods currently available. Most probable number and plate count<br />
approaches discriminate archaea and other non-cultivable microorganisms, which<br />
contribute more than 80% to the total number of species (Ouwerkerk and Klieve, 2001).<br />
Direct microscopic approaches often severely underestimate fungi (Joergensen and<br />
Wichern, 2008). The extraction of DNA followed by analysis of its composition<br />
provides important information on the microbial community composition of faeces (van<br />
Vliet et al., 2007; Sekhavati et al., 2009). However, DNA data usually provides no<br />
information on the biomass, due to losses during extraction, due to unknown or highly<br />
variable concentrations within different microbial species (Leckie et al., 2004;<br />
Joergensen and Emmerling, 2006) or due to its occurrence in dead microorganisms<br />
(Pisz et al., 2007; Bae and Wuertz, 2009). ATP would be a good candidate for the<br />
differentiation of living and dead microorganisms in faecal samples (Wolstrup and<br />
Jensen, 2008). However, in the anaerobic or micro-aerobic environment of faeces<br />
samples, the AEC and thus the ATP concentration within the microbial biomass is more<br />
variable than in soil (Jenkinson, 1988; Dyckmans et al., 2006).<br />
The chloroform fumigation extraction (CFE) method has been applied in a wide<br />
range of substrates over the past two decades and is able to estimate the biomass of all<br />
microorganisms, surrounded by an intact cell membrane, i.e. bacteria, fungi, and<br />
archaea. The integrity of cell membranes is destroyed by chloroform, and especially the<br />
cytoplasmic part of the microbial constituents is further degraded by enzymatic<br />
autolysis and transformed into extractable components. This enables the CFE method to<br />
differentiate accurately between living and dead microbial tissue. The CFE method has<br />
also been successfully used to determine microbial biomass in a variety of substrates<br />
high in organic matter, such as litter layers (Joergensen and Scheu, 1999), peat (Brake et<br />
al., 1999), compost samples (Gattinger et al., 2004), and also pig manure (Aira et al.,<br />
2006), but not cattle manure. The strong comminution of the diet by cattle, followed by<br />
fermentation processes in the rumen in combination with a high water content and a<br />
highly dispersible crude protein fraction results in a pasty structure of cattle faeces,<br />
which may cause severe problems for the CFE method.<br />
The first objective of the present study was to test the applicability of the CFE<br />
method for determining microbial biomass in cattle faeces. Thus, different extractants<br />
were tested on faeces to obtain stable extracts and reproducible microbial biomass C<br />
and N values. The second objective was to determine ergosterol as an index for fungal
4. Determination of microbial biomass and fungal and bacterial distribution in cattle faeces 14<br />
biomass and as an independent control method for CFE microbial biomass in cattle<br />
faeces. Ergosterol is an important component of fungal cell membranes, responsible for<br />
their stability (Weete and Weber, 1980) and has been successfully determined in a<br />
variety of solid substrates such as soils (Joergensen and Wichern, 2008; Strickland and<br />
Rousk, 2010) and roots (Appuhn and Joergensen, 2006), but not in faeces. Microbial<br />
biomass C and N were repeatedly measured together with ergosterol over a period of 28<br />
days to reflect the behaviour of faecal microbial biomass during cattle faeces ageing.<br />
The third objective was to measure fungal glucosamine and bacterial muramic acid as<br />
further independent control values for both, CFE microbial biomass and ergosterol data.<br />
In soil, most amino sugars are bound to soil organic matter as microbial residues<br />
(Amelung, 2001; Amelung et al., 2008). However, in the freshly and dynamically<br />
decaying content of the gut, a large percentage of glucosamine and muramic acid is still<br />
in the fungal and bacterial biomass and not transferred to the fraction of microbial<br />
residues. In contrast to CFE microbial biomass and ergosterol, glucosamine has<br />
previously been used in rumen fluid of cattle (Sekhavati et al., 2009) and in sheep<br />
faeces for determination of the fungal biomass (Rezaeian et al., 2004a, b), as a basis for<br />
analysing the fungal community structure.<br />
4.2 Materials and methods<br />
4.2.1. Faeces sampling, quality determination, and incubation<br />
Faeces samples were taken from five cattle heifers (Bos primigenius taurus, var.<br />
German Holstein) from a cattle breeding farm, located in Lower Saxony. All heifers<br />
were fed with the same silage mix of grass, maize (Zea mays L.) and sugar beet (Beta<br />
vulgaris L.) leaves for investigating the variation between individuals. The samples<br />
were taken rectally, immediately homogenised and frozen at -18 °C. A sub-sample was<br />
dried for 72 h at 65 °C and finely ground for chemical analyses. Total C and N were<br />
determined using a Vario MAX (Elementar, Hanau, Germany) elemental analyser. Total<br />
P, S, Na, K, Mg, Ca, Mn, Fe, and Al were analysed after HNO3-pressure digestion as<br />
described by Chander et al. (2008) by ICP-AES (Spectro Analytical Instruments, Kleve,<br />
Germany). Faeces pH was measured using a 1/1 water/faeces ratio. Crude lipid was<br />
determined as described by van Soest (1967) in dried faeces (2.5 g), which were<br />
hydrolysed for 1 h with 4 M HCl, before the lipids were extracted from the residue with<br />
hexane in a Soxhlet apparatus. Crude ash, ammonium and the other organic components
4. Determination of microbial biomass and fungal and bacterial distribution in cattle faeces 15<br />
such as acid detergent lignin, acid detergent fibre, neutral detergent fibre, and crude<br />
fibre were determined by near-infrared spectroscopy (FOSS 6500, Rellingen, Germany)<br />
as described by Papke and Sundrum (personal communication) after appropriate<br />
calibration and validation. Table 1 shows mean values derived from five different<br />
heifers, each analysed in triplicate. Mean organic C varied around 428 mg g -1 dry<br />
weight (DW) with a C/N ratio of 16. The coefficient of variation (CV) between the three<br />
analytical replicates and five heifers was usually below 5%. An exception was the NH4 +<br />
content between the five heifers.<br />
Tabelle 2 (Table 1): Variability of pH, elemental composition and organic components in cattle faeces from five identically fed heifers<br />
Table 1 Variability of pH, elemental composition and organic components in<br />
cattle faeces from five identically fed heifers<br />
Mean heifer CV replicate (%) CV heifer (±%)<br />
pH (H2O) 8.3 0.69 2.9<br />
(mg g -1 DW)<br />
C 428 0.75 1.4<br />
N 22 0.19 3.0<br />
NH4 + 1.4 ≤ 0.3 14<br />
C/N 16 0.77 4.2<br />
P 8.5 2.1 2.1<br />
S 3.5 2.5 2.5<br />
Na 1.0 3.6 3.6<br />
K 5.8 2.1 2.1<br />
Ca 22 2.6 2.6<br />
Mg 8.0 2.6 2.6<br />
Mn 0.4 2.3 2.3<br />
Fe 3.6 4.9 4.9<br />
Al 4.5 3.1 3.1<br />
Crude lipid 42 4.4 7.5<br />
Crude fibre 268 ≤ 0.3 3.2<br />
Neutral detergent fibre 430 ≤ 0.3 4.7<br />
Acid detergent fibre 362 ≤ 0.3 1.9<br />
Acid detergent lignin 94 ≤ 0.3 4.9<br />
DW = dry weight, CV = pooled coefficient of variation between replicate<br />
analyses (n = 3 per heifer) and heifers (n = 5)<br />
Freshly thawed faeces sub-samples (0.5 g DW) of heifer 2 were incubated for 28<br />
days at 25°C in the dark in 40 replicates. For the determination of microbial biomass C<br />
and N (final method, see below) and ergosterol four replicate faeces portions for each
4. Determination of microbial biomass and fungal and bacterial distribution in cattle faeces 16<br />
method were removed from the incubator at day 0 and after 7, 14, 21 and 28 days of<br />
incubation, respectively.<br />
4.2.2. Microbial biomass C and N estimation by CFE<br />
Microbial biomass C and N were estimated by the chloroform fumigation<br />
extraction method (Brookes et al., 1985, Vance et al., 1987), testing different<br />
modifications of the extractant, the ratio of extractant to dry weight, and of fumigation<br />
handling. First, the following 7 extractants were tested: (1) 0.05 M K2SO4, (2) 0.5 M<br />
K2SO4, (3) 0.125 M CaCl2, (4) 0.01 M CuSO4, (5) 0.05 M CuSO4, (6) 0.01 M ZnSO4<br />
and (7) 0.05 M ZnSO4. All extractants were tested with faeces sub-samples of heifer 2<br />
in three replicates each. Extractants 4 to 7 were further tested for stability by incubating<br />
extracts of fumigated and non-fumigated sub-samples of heifer 2 at 25°C in the dark in<br />
four replicates each. Organic C and total N were measured in the extracts after 0, 24, 48,<br />
96 and 192 h. The effects of direct CHCl3 application as drops to the sample (Mueller et<br />
al., 1992) and variation of fumigation time (20 h, 24 h and 28 h) were analysed. None of<br />
these variations led to a significant effect. Finally, faeces from the five heifers were<br />
measured with six replicates each. All faeces samples were fumigated, extracted and<br />
measured for C and N as described below.<br />
Two freshly thawed subsamples equivalent to 0.5 g oven-dry faeces were taken for<br />
the analysis. One sub-sample was fumigated at 25°C with ethanol-free CHCl3, which<br />
was removed after 24 h. Fumigated and non-fumigated portions were extracted with 100<br />
ml 0.05 M CuSO4 for 30 min by horizontal shaking at 200 rev min -1 . Following<br />
centrifugation (2000 g for 10 min), the faeces extract was filtered (hw3, Sartorius<br />
Stedim Biotech, Göttingen, Germany). Organic C in the extracts was measured as CO2<br />
by infrared absorption after combustion at 850 °C using a Dimatoc 100 automatic<br />
analyser (Dimatec, Essen, Germany). Microbial biomass C was calculated as follows:<br />
microbial biomass C = EC/kEC, where EC = (organic C extracted from fumigated faeces)<br />
– (organic C extracted from non-fumigated faeces) and kEC = 0.45 (Wu et al., 1990;<br />
Joergensen, 1996). Total N in the extracts was measured by chemoluminescence<br />
detection. Microbial biomass N was calculated as follows: microbial biomass C =<br />
EN/kEN, where EN = (organic N extracted from fumigated faeces) – (organic N extracted<br />
from non-fumigated faeces) and kEN = 0.54 (Brookes et al., 1985; Joergensen and
4. Determination of microbial biomass and fungal and bacterial distribution in cattle faeces 17<br />
Mueller, 1996). C and N standards for calibration of the Dimatoc 100 analyser were<br />
prepared in 0.05 M CuSO4 solution.<br />
4.2.3. Ergosterol analysis<br />
The extraction method of Zelles et al. (1987) was used for determination of the<br />
fungal cell-membrane ergosterol. Freshly thawed faeces (0.5 g DW) were placed into 30<br />
ml test tubes and treated with 10 ml methanol, 2.5 ml ethanol and 1 g KOH. Each<br />
sample was saponified for 90 min at 70 °C under reflux. After cooling, ergosterol was<br />
extracted in two steps with 15 + 10 ml petroleum ether. From the supernatant, 15 ml<br />
were evaporated in a vacuum rotary evaporator at 40 °C. The non-polar fraction was<br />
dissolved in 5 ml methanol and stored at 4 °C until measurement. Ergosterol was<br />
determined by reversed-phase HPLC with 100% methanol as the mobile phase and<br />
detected at a wavelength of 282 nm.<br />
4.2.4. Amino sugar analysis<br />
The amino sugars muramic acid, glucosamine and galactosamine were determined<br />
with modifications according to Appuhn et al. (2004) as described by Indorf et al.<br />
(2011). Moist samples of 2 g fresh faeces were weighed into 20 ml test tubes, mixed<br />
with 10 ml 6 M HCl, and heated for 2 h at 105 °C. After HCl removal from the filtered<br />
hydrolysates in a vacuum rotary evaporator at 40 °C and centrifugation, the samples<br />
were transferred to vials and stored at -18 °C until the HPLC measurements.<br />
Chromatographic separations were performed on a Phenomenex (Aschaffenburg,<br />
Germany) Hyperclone C18 column (125 mm length × 4 mm diameter), protected by a<br />
Phenomenex C18 security guard cartridge (4 mm length × 2 mm diameter) at 35°C. The<br />
HPLC system consisted of a Dionex (Germering, Germany) P 580 gradient pump, a<br />
Dionex Ultimate WPS – 3000TSL analytical autosampler with in-line split-loop<br />
injection and thermostat and a Dionex RF 2000 fluorescence detector set at 445 nm<br />
emission and 330 nm excitation wavelengths. For the automated pre-column<br />
derivatisation, 50 µl OPA and 30 µl sample were mixed in the preparation vial and after<br />
120 sec reaction time15 µl of the indole derivates were injected. The mobile phase<br />
consisted of two eluents and was delivered at a flow rate of 1.5 ml min -1 . Eluent A was<br />
a 97.8/0.7/1.5 (v/v/v) mixture of an aqueous phase, methanol and tetrahydrofuran
4. Determination of microbial biomass and fungal and bacterial distribution in cattle faeces 18<br />
(THF). The aqueous phase contained 52 mmol sodium citrate and 4 mmol sodium<br />
acetate, adjusted to pH 5.3 with HCl. Then methanol and THF were added. Eluent B<br />
consisted of 50% water and 50% methanol (v/v).<br />
Fungal C (mg g -1 dry weight) was calculated by subtracting bacterial glucosamine<br />
from total glucosamine as an index for fungal residues, assuming that muramic acid and<br />
glucosamine occur at a 1 to 2 molar ratio in bacterial cells (Engelking et al., 2007): mg<br />
fungal C g -1 DW = (mmol glucosamine − mmol muramic acid) × 179.2 g mol -1 × 9,<br />
where 179.2 is the molecular weight of glucosamine and 9 the conversion value of<br />
fungal glucosamine to fungal C (Appuhn and Joergensen, 2006). Bacterial C (µg g -1<br />
DW) was calculated as an index for bacterial residues by multiplying the concentration<br />
of muramic acid in µg g -1 DW by 45 (Appuhn and Joergensen, 2006).<br />
4.2.5. Statistical analysis<br />
The results presented in the tables are arithmetic means and expressed on an oven-<br />
dry basis (about 72 h at 60 °C). The significance of difference was tested by one-way<br />
analysis of variance. All statistical analyses were performed using JMP 7.0 (SAS Inst.<br />
Inc.).<br />
4.3 Results<br />
4.3.1. Extractant efficiency, variability, and stability of the CFE method<br />
Mostly no CHCl3-labile N was extractable with 0.05 M K2SO4, 0.5 M K2SO4 or<br />
0.125 M CaCl2. Microbial biomass C using these extractants was 21, 20 and 15 mg g -1<br />
DW, respectively (data not shown), with a mean coefficient of variation (CV) of 50%.<br />
Due to the problems described and the CV values, extractants 1 to 3 were not further<br />
tested. Mean microbial biomass C extracted with ZnSO4 and CuSO4 was 27 mg g -1 DW<br />
for the 0.01 M concentration and 31 mg g -1 for the 0.05 M concentration. Microbial<br />
biomass N varied around 4.5 mg g -1 for all four extractants. The mean CV for all four<br />
extractants ranged from 10 to 12% for microbial biomass C and N.<br />
At the beginning of the incubation, the microbial biomass C ranged from 22 to 31<br />
mg g -1 for all extractants (Fig. 1a) and the microbial biomass N concentration from 3.6<br />
to 4.4 mg g -1 (Fig. 1b). After 192 h, the microbial biomass C decreased to 4.5 and 11 mg<br />
g -1 in the 0.01 and 0.05 M ZnSO4 extracts, respectively. In contrast, the C concentration<br />
of the CuSO4 extracts remained constant. Similar characteristics were found for
4. Determination of microbial biomass and fungal and bacterial distribution in cattle faeces 19<br />
microbial biomass N. The extracts with CuSO4 had CV values of 3.1 and 3.3%, for<br />
microbial biomass C and N, whereas the ZnSO4 extracts had CV values between 26 and<br />
57%. Differences between the 0.01 and 0.05 M CuSO4 extracts were lower, at 4.5 and<br />
2.0% respectively.<br />
Abb. 4 (Fig. 1): (a)<br />
Fig. 1. (a) Concentrations of microbial biomass C and (b) microbial biomass N in subsamples<br />
of heifer 2 using different extractants over a 192 h incubation of extracts at<br />
25°C; bars indicate ± one standard error; n = 4.
4. Determination of microbial biomass and fungal and bacterial distribution in cattle faeces 20<br />
4.3.2. Microbial biomass and ergosterol in incubated faeces<br />
During the 28-day incubation study, the concentrations of microbial biomass C and<br />
N in the faeces of heifer 2 started at 7.4 and 1.9 mg g -1 DW, respectively, but only<br />
microbial biomass C nearly doubled within two days (Fig. 2a), also doubling the<br />
microbial biomass C/N ratio. Microbial biomass C declined to the initial concentrations<br />
and remained more o less stable as microbial biomass N until the end of the incubation.<br />
Fig. 2. (a) Concentrations of microbial biomass C, microbial biomass N, the microbial biomass<br />
C/N ratio; (b) concentrations of ergosterol and the ergosterol to microbial biomass C ratio<br />
during a 28-day incubation using faeces sub-samples of heifer 2 at 25°C; bars indicate ± one<br />
standard error; n = 4.<br />
Abb. 5 (Fig. 2): (a) Concentrations of microbial biomass C, microbial biomass N, the microbial biomass C/N ratio; (b) concentrations<br />
of ergosterol and the ergosterol to microbial biomass C ratio during a 28-day incubation using faeces sub-samples of heifer 2 at 25°C;
4. Determination of microbial biomass and fungal and bacterial distribution in cattle faeces 21<br />
The ergosterol concentration declined by 60% within 3 days, increased roughly to the<br />
initial concentration at day 14 and declined again. The ergosterol to microbial biomass<br />
C ratio varied around a mean of 2.4‰, ranging from 0.8 to 5.0‰, and showed a strong<br />
negative correlation with the microbial biomass C/N ratio (r = -0.81, n = 8, P
4. Determination of microbial biomass and fungal and bacterial distribution in cattle faeces 22<br />
Table 3 Variability of microbial indices in cattle faeces from five identically fed heifers<br />
Heifer MurN GlcN GalN Microbial<br />
C<br />
(mg g -1 DW)<br />
Fungal C/<br />
bacterial C<br />
1 0.28 b 1.7 b 1.1 c 25 b 0.90 100<br />
2 0.47 a 2.2 ab 1.3 bc 35 a 0.64 140<br />
3 0.43 a 2.5 a 1.4 ab 36 a 0.88 250<br />
4 0.46 a 2.4 a 1.6 a 37 a 0.78 290<br />
5 0.42 a 2.1 ab 1.3 bc 33 ab 0.72 150<br />
Mean 0.43 2.2 1.4 33 0.78 190<br />
CV (±%) 16 15 12 15 10 38<br />
Fungal GlcN/<br />
ergosterol<br />
DW = dry weight; MurN = muramic acid; GlcN = glucosamine; GalN = galactosamine;<br />
CV = pooled coefficient of variation between replicate sub-samples (n = 6); different<br />
letters within a column show significant differences (Tukey, P = 0.05)<br />
Tabelle 4 (Table 3): Variability of microbial indices in cattle faeces from five identically fed heifers<br />
4.4 Discussion<br />
4.4.1. Microbial biomass in cattle faeces by the CFE method<br />
The microbial biomass C values of cattle faeces obtained by the CFE method are<br />
within the range of maximum values reported in other substrates high in organic matter,<br />
such as composted straw (7.3 mg C g -1 DW: Joergensen et al., 1997) and cattle manure<br />
compost (12.6 mg C g -1 DW: Gattinger et al., 2004). In non-composted pig slurry, Aira<br />
et al. (2006) and Guerrero et al. (2007) reported microbial biomass contents ranging<br />
between 4.2 and 8.9 mg C g -1 DW, using the kEC values of 0.38 proposed by Vance et al.<br />
(1987) for dichromate oxidation. In this study, the mean microbial biomass C/N ratio<br />
close to 6 in cattle faeces is in the lower range of values reported for soils (Jenkinson,<br />
1988; Joergensen and Mueller, 1996). The mean microbial biomass C to organic C ratio<br />
of 2.2% is within the range of different soils (Anderson and Domsch, 1989; Joergensen,<br />
2010). These similarities give confidence that the results for cattle faeces obtained by<br />
the CFE method are common.<br />
It is also possible to use the kEC and kEN values already applied to soil and other<br />
substrates for converting CHCl3 labile C and N to microbial biomass C and N in faeces,<br />
respectively. These values were mainly calibrated indirectly against the chloroform<br />
fumigation incubation (CFI) method (Jenkinson, 1988; Wu et al., 1990). The large
4. Determination of microbial biomass and fungal and bacterial distribution in cattle faeces 23<br />
range of the kEC and kEN values reported in the literature and summarized by Joergensen<br />
(1996) and Joergensen and Mueller (1996), respectively, are often caused by the<br />
methodological limitations of the CFI method and not by true changes in the conversion<br />
values (Joergensen et al., 2011). However, it cannot be completely ruled out that such<br />
true changes may occur in the dynamic environment of animal faeces. Young cells<br />
contain more easily soluble components in the cytoplasm than older cells (Bremer and<br />
van Kessel, 1990), leading to increased conversion values. More CHCl3 labile material<br />
has been rendered extractable by direct fumigation from large fungal than from small<br />
bacterial cells (Eberhardt et al., 1996), leading to decreased conversion values in<br />
bacteria dominated communities. However, it is certainly more appropriate to use a non-<br />
perfect conversion value, acceptable for several sample types, than not to use one at all,<br />
as fumigation never renders 100% of the microbial biomass extractable (Joergensen et<br />
al., 2011).<br />
In cattle manure, between 300 nmol (Frostegård et al., 1997) and 1500 nmol<br />
(Gattinger et al., 2007) phospholipid fatty acids (PLFA) were detected. These PLFA<br />
contents were converted to microbial biomass C by multiplying them by 5.8 as<br />
suggested by Joergensen and Emmerling (2006), resulting in a range from 1.7 to 8.7 mg<br />
C g -1 DW, similar to the range obtained by the CFE method. However, it should be<br />
noted that this conversion value is based on a limited number of observations, again<br />
solely investigating soil microorganisms (Bailey et al., 2002). It has been shown that<br />
cattle manure contains 240 nmol phospholipid ether lipids (PLEL), which means that<br />
archaea contribute an additional 20% to the phospholipid pool (Gattinger et al., 2007).<br />
No information is available for conversion of PLEL to the biomass of archaea.<br />
The agreement of the microbial biomass data from cattle faeces in this study with<br />
those obtained from soil and related organic components is extraordinary, considering<br />
the absence of any structure in the pasty cattle faeces, combined with a highly<br />
dispersible crude protein fraction. However, the 0.05 M CuSO4 sufficiently flocculates<br />
the protein-rich faeces, which is inevitably necessary to extract CHCl3 labile N<br />
components from the cattle faeces. The divalent Cu 2+ ions have a stronger flocculation<br />
capacity than the monovalent K + ions in K2SO4. In addition, the Cu strongly inhibits<br />
microbial decomposition of the highly decomposable CHCl3 labile organic material<br />
obtained after extraction, as demonstrated in the incubation experiment with extracts at<br />
25ºC. The main reason for the relatively high CV of the cattle faeces samples is, other<br />
than the variability mentioned within the test animals, most likely the small sample size
4. Determination of microbial biomass and fungal and bacterial distribution in cattle faeces 24<br />
with variations in the dry matter concentration, which has to be determined on separate<br />
sub-samples.<br />
4.4.2. Bacterial and fungal distribution in cattle faeces<br />
In situations in which the microbial colonisation of living or freshly decaying<br />
organic material is to be analysed, such as excised roots, glucosamine and muramic acid<br />
can be used as an index for fungal and bacterial biomass (Appuhn and Joergensen,<br />
2006). In this experiment, by combining fumigation extraction and ergosterol data,<br />
Appuhn and Joergensen (2006) estimated an average microbial biomass C content of 11<br />
mg g -1 DW in plant roots. In contrast, the mean microbial C was 23 mg g -1 DW, based<br />
on the concentrations of muramic acid and fungal glucosamine. In cattle faeces, the<br />
corresponding values were 9.3 mg microbial biomass C g -1 DW and 33 mg microbial C<br />
g -1 DW, respectively. This suggests that roughly 28% of the microbial tissue in the cattle<br />
faeces belongs to the living fraction and the other 72% are remains of dead fungi and<br />
bacteria. In the highly dynamic situation of C and N supply in the gut, rapid microbial<br />
growth is probably accompanied by concomitant microbial death similar to that<br />
observed in soil (Chander and Joergensen, 2001). For this reason, these figures seem to<br />
be realistic, but should not be stressed too much, because it is not known (1) whether<br />
the glucosamine and muramic acid concentrations are identical in living and dead<br />
microbial tissue and (2) whether the conversion values may lead to an underestimation<br />
of microbial biomass C.<br />
In this study, an average fungal to bacterial C ratio of 0.78 corresponds to 44%<br />
fungal C and 56% bacterial C. This suggests that the faecal microbial community is less<br />
clearly dominated by bacteria than usually imagined (Frostegård et al., 1997; Griffith et<br />
al., 2009), therefore often disregarding fungi (van Vliet, 2007; Frey et al., 2010).<br />
However, this view neglects the significant contribution of archaea to the microbial<br />
biomass of cattle faeces, as archaea do not contain the amino sugar murein acid. In<br />
contrast to fumigation extraction, chitin, i.e. glucosamine, has been previously used in<br />
rumen fluid of cattle (Sekhavati et al., 2009) and in sheep faeces for the determination<br />
of anaerobic fungi (Rezaeian et al., 2004a, b). The chitin concentration in sheep faeces<br />
was 10.2 mg g -1 DW (Rezaeian et al., 2004a). Compared with the glucosamine<br />
concentration in cattle faeces, this chitin concentration was considerably higher.<br />
However, this technique cannot distinguish between fungal glucosamine, bacterial<br />
glucosamine, and galactosamine (Chen and Johnson, 1983). This certainly leads to
4. Determination of microbial biomass and fungal and bacterial distribution in cattle faeces 25<br />
overestimation of fungal tissue. The negative relationship between galactosamine and<br />
ergosterol suggests that galactosamine was mainly of bacterial origin, in accordance<br />
with the general view in soil science (Amelung et al., 2008), although fungi also<br />
produce galactosamine (Engelking et al., 2007).<br />
The ergosterol to microbial biomass C ratio has been repeatedly used as an index<br />
for the contribution of fungi to the total microbial biomass (Bååth and Anderson, 2003).<br />
Of the anaerobic fungal populations, yeasts such as Candida sp. (Ahmad et al., 2010) or<br />
Saccharomyces cerevisia (Aguilera et al., 2006) contain high concentrations of<br />
ergosterol, also food spoiling Mucor plumbeus (Taniwaki et al., 2009). In contrast, no<br />
ergosterol but high concentrations of cholesterol were measured in chytridiomycetes<br />
(Weete et al., 1989; Kagami et al., 2007). Until now, no information is available on the<br />
ergosterol concentration of anaerobic fungal species found in cattle such Anaeromyces,<br />
Orpinomyces, Caecomyces, or Piromyces (Griffith et al., 2009). The mean ratio of<br />
ergosterol to microbial biomass C of 1.1‰ found in cattle faeces is markedly below that<br />
of soils (Joergensen and Wichern, 2008). Klamer and Bååth (2004) obtained a factor of<br />
190 for converting ergosterol to fungal biomass C in 24 compost fungi, which is within<br />
the range presented by Joergensen and Wichern (2008) and considerably above the<br />
factor of 90 reported by Djajakirana et al. (1996). Using the factor reported by Klamer<br />
and Bååth (2004) would result in a mean fungal biomass C content of 1.8 mg C g -1 DW<br />
in the faeces samples in this study. However, not all faecal fungi may contain ergosterol<br />
as stated above, but all contain glucosamine. The mean ratio of fungal glucosamine to<br />
ergosterol was 190 in cattle faeces and thus somewhat above the mean ratio observed by<br />
Appuhn and Joergensen (2006) in plant roots. During the 4-week incubation of cattle<br />
faeces performed in this study, a decrease in the ergosterol to microbial biomass ratio<br />
was followed by an increase, which may indicate a shift in the microbial community,<br />
especially fungal communities to increasing aerobiosis and decreasing C availability.<br />
This estimation is supported by the inverse changes in the microbial biomass C/N ratio<br />
over the incubation period, i.e. an increase was followed by a decrease. However, in<br />
dynamic systems, ergosterol tends to accumulate for certain periods after fungal death<br />
(Zhao et al., 2005), which should also be considered in the present case.<br />
The majority of microbial data in faeces samples is based on colony forming units<br />
(CFU) or thallus forming units (TFU), counted on plates or as the most probable<br />
number (Griffith et al., 2009). Although the unknown representation of cultivable<br />
microorganisms has raised doubt about converting these counts into microbial biomass
4. Determination of microbial biomass and fungal and bacterial distribution in cattle faeces 26<br />
(Ritz, 2007), the data of this study are also within the huge range produced by these<br />
approaches. Between 1.4 and 14 mg C g -1 DW coliform bacteria, mainly Escherichia<br />
coli have been found in cattle faeces (Avery et al., 2004; van Kessel et al., 2007),<br />
assuming a mass of 6.25 x 10 -10 g per single E. coli bacterium (Siu, 2003) and a C<br />
concentration of 45% in microbial cells (Jenkinson, 1988). In agreement with these<br />
CFU data, van Vliet et al. (2007) observed between 8.6 and 10.9 x 10 -10 g per single<br />
bacterial cell in cattle faeces, i.e. 40 to 70% higher values on the basis of confocal laser<br />
scanning microscopy using europium chelate/fluorescent brightener differential stain in<br />
combination with automated image analysis (Bloem et al., 1994). The bacterial biomass<br />
ranged from 1.2 to 8.0 mg C g -1 DW, depending on the quality of the diet (van Vliet et<br />
al., 2007). Nevertheless, it should be considered that fungal biomass is not included in<br />
this technique.<br />
Roughly 3.3 mg g -1 DW fungal biomass has been found in cattle faeces (Griffith et<br />
al., 2009), assuming a mass of 3.3 ng per single fungal count, using the geometric mean<br />
of a range from 0.4 to 52 ng per fungal count (Schnürer, 1993). According to Frostegård<br />
et al. (1997), cattle manure contains 2.6 mol% 18:2ω6,9 (linoleic acid) and 5.3 mol%<br />
18:1ω9 (oleic acid), which is similar to mean values found in grassland soils on the<br />
basis of 508 and 88 observations, respectively (Joergensen and Wichern, 2008). If<br />
linoleic acid is converted to fungal biomass by multiplying by 107 (Joergensen and<br />
Wichern, 2008), total PLFA contents of 300 nmol (Frostegård et al., 1997) and 1500<br />
nmol (Gattinger et al., 2007) correspond to a fungal biomass C ranging from 0.8 to 4.2<br />
mg g -1 DW. It could be concluded from these values that fungi contribute roughly 48%<br />
to the microbial biomass and bacteria to 52%, again neglecting archaea, i.e. values<br />
nearly identical to those based on the amino sugar analysis.<br />
4.4.3. Conclusions<br />
This study demonstrated the applicability of the CFE method for reliable<br />
determination of microbial biomass C and N in cattle faeces. The replacement of 0.5 M<br />
K2SO4 by 0.05 M CuSO4 as the extractant solved previous difficulties in extracting<br />
CHCl3 labile N components and ensured stable faeces extracts. In combination with the<br />
fungal ergosterol, the CFE method indicated a shift in the microbial community<br />
structure during ageing of cattle faeces. Ergosterol and amino sugar analysis revealed a<br />
significant contribution of fungi, with a biomass percentage of more than 40% to the
4. Determination of microbial biomass and fungal and bacterial distribution in cattle faeces 27<br />
microbial community. The CFE method and amino sugar analysis gave results on a<br />
similar level, although fungal glucosamine and bacterial muramic acid revealed a<br />
considerable presence of dead microbial tissue in faeces. All three methods are expected<br />
to be suitable tools for analysing the effects of diet composition on faeces quality and<br />
the subsequent behaviour of animal manure in soil.<br />
Acknowledgments<br />
The skilful technical assistance of Gabriele Dormann and Christiane Jatsch is<br />
highly appreciated. We also thank Mick Locke for carefully correcting our English. This<br />
project was supported by a grant of the Research Training Group 1397 “Regulation of<br />
soil organic matter and nutrient turnover in organic agriculture” of the German Research<br />
Foundation (DFG).<br />
4.5 References<br />
Aguilera, F., Peinado, R.A., Millán, C., Ortega, J.M., Mauricio, J.C., 2006. Relationship<br />
between ethanol tolerance, H + -ATPase activity and the lipid composition of the<br />
plasma membrane in different wine yeast strains. International Journal of Food<br />
Microbiology 110, 34-42.<br />
Ahmad, A., Khan, A., Manzoor, N., Khan, L.A., 2010. Evolution of ergosterol<br />
biosynthesis inhibitors as fungicidal against Candida. Microbial Pathogenesis 48,<br />
35-41.<br />
Aira, M., Monroy, F., Domínguez, J., 2006. Changes in microbial biomass and<br />
microbial activity of pig slurry after the transit through the gut of the earthworm<br />
Eudrilus eugeniae. Biology and Fertility of Soils 42, 371–376.<br />
Amelung, W., 2001. Methods using amino sugars as markers for microbial residues in<br />
soil. In: Lal, J.M., Follett, R.F., Stewart, B.A. (Eds.), Assessment Methods for Soil<br />
Carbon. Lewis Publishers, Boca Raton, pp. 233-272.<br />
Amelung, W., Brodowski, S., Sandhage-Hofmann, A., Bol, R., 2008. Combining<br />
biomarker with stable isotope analyses for assessing the transformation and<br />
turnover of soil organic matter. Advance in Agronomy 100, 155-250.
4. Determination of microbial biomass and fungal and bacterial distribution in cattle faeces 28<br />
Anderson, T.-H., Domsch, K.H., 1989. Ratios of microbial biomass carbon to total<br />
organic carbon in arable soils. Soil Biology & Biochemistry 21, 471-479.<br />
Appuhn, A., Joergensen, R.G., 2006. Microbial colonisation of roots as a function of<br />
plant species. Soil Biology & Biochemistry 38, 1040-1051.<br />
Appuhn, A., Joergensen, R.G., Raubuch, M., Scheller, E., Wilke, B., 2004. The<br />
automated determination of glucosamine, galactosamine, muramic acid and<br />
mannosamine in soil and root hydrolysates by HPLC. Journal of Plant Nutrition and<br />
Soil Science 167, 17-21.<br />
Avery, S.M., Moore, A., Hutchison, M.L., 2004. Fate of Escherichia coli originating<br />
from livestock faeces deposited directly onto pasture. Letters in Applied<br />
Microbiology 38, 355–359.<br />
Bååth, E., Anderson, T.H., 2003. Comparison of soil fungal/bacterial ratios in a pH<br />
gradient using physiological and PLFA-based techniques. Soil Biology &<br />
Biochemistry 35, 955-963.<br />
Bae, S., Wuertz, S., 2009. Discrimination of viable and dead fecal bacteroidales bacteria<br />
by quantitative PCR with propidium monoazide. Applied and Environmental<br />
Microbiology 75, 2940-2944.<br />
Bailey, V.L., Peacock, A.D., Smith, J.L., Bolton, H. JR., 2002. Relationships between<br />
soil microbial biomass determined by chloroform fumigation–extraction, substrate-<br />
induced respiration, and phospholipid fatty acid analysis. Soil Biology &<br />
Biochemistry 34, 1385–1389.<br />
Bloem, J., Lebbink, G., Zwart, K.B., Bouwman, L.A., Burgers, S.L., de Vos J.A., de<br />
Ruiter, P.C., 1994. Dynamics of microorganisms, microbivores and nitrogen<br />
mineralisation in winter wheat fields under conventional and integrated<br />
management. Agriculture, Ecosystems and Environment 51, 129-143.<br />
Böhme, L., Langer, U., Böhme, F., 2005. Microbial biomass, enzyme activities and<br />
microbial community structure in two European long-term field experiments.<br />
Agriculture Ecosystems and Environment 109, 141-152.<br />
Brake, M., Höper, H., Joergensen, R.G., 1999. Land use-induced changes in activity and<br />
biomass of microorganisms in raised bog peats at different depths. Soil Biology &<br />
Biochemistry 31, 1489-1497.<br />
Bremer, E., van Kessel, C., 1990. Extractability of microbial 15 C and 15 N following<br />
addition of variable rates of labelled glucose and (NH4)2SO4 to soil. Soil Biology &<br />
Biochemistry 22, 707-713.
4. Determination of microbial biomass and fungal and bacterial distribution in cattle faeces 29<br />
Brookes, P.C., Landman, A., Pruden, G., Jenkinson, D.S., 1985. Chloroform fumigation<br />
and the release of soil nitrogen: a rapid direct extraction method for measuring<br />
microbial biomass nitrogen in soil. Soil Biology & Biochemistry 17, 837-842.<br />
Chander, K., Hartmann, G., Joergensen, R.G., Khan, K.S., Lamersdorf, N., 2008.<br />
Comparison of three methods for measuring heavy metals in soils contaminated by<br />
different sources. Archives of Agronomy and Soil Science 54, 413-422.<br />
Chander, K., Joergensen, R.G., 2001. Decomposition of 14 C glucose in two soils with<br />
different levels of heavy metal contamination. Soil Biology & Biochemistry 33,<br />
1811-1816.<br />
Chen, G.C., Johnson, B.R., 1983. Improved colorimetric determination of cell wall<br />
chitin in wood decay fungi. Applied and Environmental Microbiology 46. 13–16.<br />
Djajakirana, G., Joergensen, R., Meyer, B., 1996. Ergosterol and microbial biomass<br />
relationship in soil. Biology and Fertility of Soils 22, 299–304.<br />
Dyckmans, J., Flessa, H., Lipski, A., Potthoff, M., Beese, F., 2006. Microbial biomass<br />
and activity under oxic and anoxic conditions as affected by nitrate additions.<br />
Journal of Plant Nutrition and Soil Science 169, 108-115.<br />
Eberhardt, U., Apel, G., Joergensen, R.G., 1996. Effects of direct chloroform-<br />
fumigation on suspended cells of 14 C and 32 P labelled bacteria and fungi. Soil<br />
Biology & Biochemistry 28, 677-679.<br />
Edwards, J., Huws, S., Kingston-Smith, A., Jimenez, H., Skøt, K., Griffith, G.W.,<br />
McEwan, N.R., Theodorou, M.K., 2008. Dynamics of initial colonisation of non-<br />
conserved perennial ryegrass by anaerobic fungi in the bovine rumen. FEMS<br />
Microbiology Ecology 66, 537–546.<br />
Elfstrand, S., Hedlund, K., Mårtensson, A., 2007. Soil enzyme activities, microbial<br />
community composition and function after 47 years of continuous green manuring.<br />
Applied Soil Ecology 35, 610-621.<br />
Engelking, B., Flessa, H., Joergensen, R.G., 2007. Shifts in amino sugar and ergosterol<br />
contents after addition of sucrose and cellulose to soil. Soil Biology &<br />
Biochemistry 39, 2111-2118.<br />
Flessa, H., Potthoff, M., Loftfield, N., 2002. Laboratory estimates of CO2 and N2O<br />
emissions following surface application of grass mulch: importance of indigenous<br />
microflora of mulch. Soil Biology & Biochemistry 34, 875-879.<br />
Frey, J.C., Pell, A.N., Berthiaume, R., Lapierre, H., Lee, S., Ha, J.K., Mendell, J.E.,<br />
Angert, E.R., 2010. Comparative studies of microbial populations in the rumen,
4. Determination of microbial biomass and fungal and bacterial distribution in cattle faeces 30<br />
duodenum, ileum and faeces of lactating dairy cows. Journal of Applied<br />
Microbiology 108, 1982-1993.<br />
Frostegård, Å, Petersen, S.O., Bååth, E., Nielsen, T.H., 1997. Dynamics of a microbial<br />
community associated with manure hot spots as revealed by phospholipid fatty acid<br />
analyses. Applied and Environmental Microbiology 63, 2224–2231.<br />
Gattinger, A., Bausenwein, U., Bruns, C., 2004. Microbial biomass and activity in<br />
composts of different composition and age. Journal of Plant Nutrition and Soil<br />
Science 167, 556-561.<br />
Gattinger, A., Höfle, M.G., Schloter, M., Embacher, A., Böhme, F., Munch, J.C.,<br />
Labrenz, M., 2007. Traditional cattle manure application determines abundance,<br />
diversity and activity of methanogenic Archaea in arable European soil.<br />
Environmental Microbiology 9, 612–624.<br />
Griffith, G.W., Ozkose, E., Theodorou, M.K., Davies, D.R., 2009. Diversity of<br />
anaerobic fungal populations in cattle revealed by selective enrichment culture<br />
using different carbon sources. Fungal Ecology 2, 87 –97.<br />
Guerrero, C., Moral, R., Gómez, I., Zornoza, R., Arcenegui, V., 2007. Microbial<br />
biomass and activity of an agricultural soil amended with the solid phase of pig<br />
slurries. Bioresource Technology 98, 3259–3264.<br />
Heinze, S., Raupp, J., Joergensen, R.G., 2010. Effects of fertilizer and spatial<br />
heterogeneity in soil pH on microbial biomass indices in a long-term field trial of<br />
organic agriculture. Plant and Soil 328, 203-215.<br />
Jenkinson, D.S., 1988. The determination of microbial biomass carbon and nitrogen in<br />
soil. In: Wilson, J.R., (Ed.), Advances in Nitrogen Cycling in Agricultural<br />
Ecosystems. CABI, Wallingford, pp. 368-386.<br />
Indorf, C., Dyckmans, J., Khan, K.S., Joergensen, R.G., 2011. Optimisation of amino<br />
sugar quantification by HPLC in soil and plant hydrolysates. Biology and Fertility<br />
of Soils 47, 387-396.<br />
Joergensen, R.G., 1996. The fumigation-extraction method to estimate soil microbial<br />
biomass: calibration of the kEC value. Soil Biology & Biochemistry 28, 25-31.<br />
Joergensen, R.G., 2010. Organic matter and micro-organisms in tropical soils. In: Dion,<br />
P. (Ed.), Soil Biology and Agriculture in the Tropics. Springer, Berlin, pp. 17-44.<br />
Joergensen, R.G., Emmerling, C., 2006. Methods for evaluating human impact on soil<br />
microorganisms based on their activity, biomass, and diversity in agricultural soils.<br />
Journal of Plant Nutrition and Soil Science 169, 295-309.
4. Determination of microbial biomass and fungal and bacterial distribution in cattle faeces 31<br />
Joergensen, R.G., Mueller, T., 1996. The fumigation-extraction method to estimate soil<br />
microbial biomass: calibration of the kEN value. Soil Biology & Biochemistry 28,<br />
33-37.<br />
Joergensen, R.G., Scheu, S., 1999. Depth gradients of microbial and chemical properties<br />
in moder soils under beech and spruce. Pedobiologia 43, 134-144.<br />
Joergensen, R.G., Wichern, F., 2008. Quantitative assessment of the fungal contribution<br />
to microbial tissue in soil. Soil Biology & Biochemistry 40, 2977-2991.<br />
Joergensen, R.G., Figge, R.M., Kupsch, L., 1997. Microbial decomposition of fuel oil<br />
after compost addition to soil. Zeitschrift für Pflanzenernährung und Bodenkunde<br />
160, 21-24.<br />
Joergensen, R.G., Wu, J., Brookes P.C., 2011. Measuring soil microbial biomass using<br />
an automated procedure. Soil Biology & Biochemistry 43, 873-876.<br />
Kagami, M., <strong>von</strong> Elert, E., Ibelings, B.W., De Bruin, A., Van Donk, E., 2007. The<br />
parasitic chytrid, Zygorhizidium, facilitates the growth of the cladoceran<br />
zooplankter, Daphnia, in cultures of the inedible alga, Asterionella. Proceedings of<br />
the Royal Society B: Biological Sciences 274, 1561-1566.<br />
Van Kessel, J.S., Pachepsky, Y.A., Shelton, D.R., Karns, J.S., 2007. Survival of<br />
Escherichia coli in cowpats in pasture and in laboratory conditions. Journal of<br />
Applied Microbiology 103, 1122–1127.<br />
Klamer, M., Bååth, E., 2004. Estimation of conversion factors for fungal biomass<br />
determination in compost using ergosterol and PLFA 18:2ω6,9. Soil Biology &<br />
Biochemistry 36, 57-65.<br />
Kyvsgaard, P., Sørensen, P., Møller, E., Magid, J., 2000. Nitrogen mineralization from<br />
sheep faeces can be predicted from the apparent digestibility of the feed. Nutrient<br />
Cycling in Agroecosystems 57, 207–214.<br />
Leckie, S.E., Prescott, C.E., Grayston, S.J., Neufeld, J.D., Mohn, W.W., 2004.<br />
Comparison of chloroform fumigation-extraction, phospholipid fatty acid, and<br />
DNA methods to determine microbial biomass in forest humus. Soil Biology &<br />
Biochemistry 36, 529–532.<br />
Lovell, R.D., Jarvis, S.C., 1996. Effect of cattle faeces on soil microbial biomass C and<br />
N in a permanent pasture soil. Soil Biology & Biochemistry 28, 291-299.<br />
Ma, X., Wang, S., Jiang, G., Haneklaus, S., Schnug, E., Nyren, P., 2007. Short-term<br />
effect of targeted placements of sheep excrement on grassland in Inner Mongolia on
4. Determination of microbial biomass and fungal and bacterial distribution in cattle faeces 32<br />
soil and plant parameters. Communications in Soil Science and Plant Analysis 38,<br />
1589-1604.<br />
Mäder, P., Fließbach, A., Dubois, D., Gunst, L., Fried, P., Niggli, U., 2002. Soil fertility<br />
and biodiversity in organic farming. Science 296, 1694-1697.<br />
Mueller, T., Joergensen, R.G., Meyer, B., 1992. Estimation of soil microbial biomass C<br />
in the presence of living roots by fumigation-extraction. Soil Biology &<br />
Biochemistry 24, 179-181.<br />
Ouwerkerk, D., Klieve, A.V., 2001. Bacterial diversity within feedlot manure. Anaerobe<br />
7, 59–66.<br />
Pisz, J.M., Lawrence, J.R., Schafer, A.N., Siciliano, S.D., 2007. Differentiation of genes<br />
extracted from non-viable versus viable micro-organisms in environmental samples<br />
using ethidium monoazide bromide. Journal of Microbiological Methods 71, 312-<br />
318.<br />
Rasul, G., Khan, K.S., Müller, T., Joergensen, R.G., 2008. Soil-microbial response to<br />
sugarcane filter cake and biogenic waste compost. Journal of Plant Nutrition and<br />
Soil Science 171, 355-360.<br />
Rezaeian, M., Beakes, G.W., Parker, D.S., 2004a. Distribution and estimation of<br />
anaerobic zoosporic fungi along the digestive tracts of sheep. Mycological<br />
Research 34, 1227–1233.<br />
Rezaeian, M., Beakes, G.W., Parker, D.S., 2004b. Methods for the isolation, culture and<br />
assessment of the status of anaerobic rumen chytrids in both in vitro and in vivo<br />
systems Mycological Research 34, 1215–1226.<br />
Rezaeian, M., Beakes, G.W., Chaudhry, A.S., 2006. Effect of feeding chopped and<br />
pelleted lucerne on rumen fungal mass, fermentation profiles and in sacco<br />
degradation of barley straw in sheep. Animal Feed Science and Technology 128,<br />
292–306.<br />
Ritz, K., 2007. The plate debate: cultivable communities have no utility in<br />
contemporary environmental microbial ecology. FEMS Microbiology Ecology 60,<br />
358–362.<br />
Scheller, E., Joergensen, R.G., 2008. Decomposition of wheat straw differing in N<br />
content in soils under conventional and organic farming management. Journal of<br />
Plant Nutrition and Soil Science 171, 886-892.
4. Determination of microbial biomass and fungal and bacterial distribution in cattle faeces 33<br />
Schnürer, J., 1993. Comparison of methods for estimating the biomass of three food-<br />
borne fungi with different growth patterns. Applied and Environmental<br />
Microbiology 59, 552-555.<br />
Sekhavati, M.H., Mesgaran, M.D., Nassiri, M.R., Mohammadabadi, T., Rezaii, F., Fani<br />
Maleki, A., 2009. Development and use of quantitative competitive PCR assays for<br />
relative quantifying rumen anaerobic fungal populations in both in vitro and in vivo<br />
systems. Mycological Research 113, 1146-1153.<br />
Siu, L., 2003. Mass of a bacterium. In: Elert, G. (Ed.), The Physics Factbook.<br />
http://hypertextbook.com/facts/2003/Louis.Siu.shtml<br />
Sørensen, P, Jensen, E.S., 1995. Mineralization-immobilization and plant-uptake of<br />
nitrogen as influenced by the spatial distribution of cattle slurry in soils of different<br />
texture. Plant and Soil 173, 283–291.<br />
Van Soest, P.J., 1967. Development of a comprehensive system of feed analyses and its<br />
application to forages. Journal of Animal Science 26, 119–128.<br />
Strickland, M.S., Rousk, J., 2010. Considering fungal:bacterial dominance in soils –<br />
Methods, controls, and ecosystem implications. Soil Biology & Biochemistry 42,<br />
1385-1395.<br />
Taniwaki, M.H., Hocking, A.D., Pitt, J.I., Fleet, G.H., 2009. Growth and mycotoxin<br />
production by food spoilage fungi under high carbon dioxide and low oxygen<br />
atmospheres. International Journal of Food Microbiology 132, 100-108.<br />
Vance, E.D., Brookes, P.C., Jenkinson, D.S., 1987. An extraction method for measuring<br />
soil microbial biomass C. Soil Biology & Biochemistry 19, 703-707.<br />
Van Vliet, P.C.J., Reijs, J.W., Bloem, J., Dijkstra, J., de Goede, R.G.M., 2007. Effects<br />
of cow diet on the microbial community and organic matter and nitrogen content of<br />
feces. Journal of Dairy Science 90, 5146–5158.<br />
Wachendorf, C., Joergensen, R.G., 2011. Mid-term tracing of 15 N derived from urine<br />
and dung in soil microbial biomass. Biology and Fertility of Soils 47, 147–155.<br />
Weete, J.D., Weber, D.J., 1980. Lipid Biochemistry of Fungi and other Organisms.<br />
Plenum Publishing, New York.<br />
Weete, J.D., Fuller, M.S., Huang, M.Q., Gandhi, S., 1989. Fatty acids and sterols of<br />
selected hyphochytriomycetes and chytridiomycetes. Experimental Mycology 13,<br />
183-195.
4. Determination of microbial biomass and fungal and bacterial distribution in cattle faeces 34<br />
Wolstrup, J., Jensen, K., 2008. Adenosine triphosphate and deoxyribonucleic acid in the<br />
alimentary tract of cattle fed different nitrogen sources. Journal of Applied<br />
Microbiology 45, 49–56.<br />
Wu, J., Joergensen, R.G., Pommerening, B., Chaussod, R., Brookes, P.C., 1990.<br />
Measurement of soil microbial biomass C by fumigation-extraction - an automated<br />
procedure. Soil Biology & Biochemistry 22, 1167-1169.<br />
Zelles, L., Hund, K., Stepper, K., 1987. Methoden zur relativen Quantifizierung der<br />
pilzlichen Biomasse im Boden. Zeitschrift für Pflanzenernährung und Bodenkunde<br />
150, 249–252.<br />
Zhao, X.R., Lin, Q., Brookes, P.C., 2005. Does soil ergosterol concentration provide a<br />
reliable estimate of soil fungal biomass? Soil Biology & Biochemistry 37, 311–317.
5. Microbial biomass in faeces of dairy cows affected by a nitrogen deficient diet 35<br />
5. Microbial biomass in faeces of dairy cows affected by a<br />
nitrogen deficient diet<br />
Daphne Isabel Jost a* , Martina Aschemann b , Peter Lebzien b , Rainer Georg Joergensen c ,<br />
Albert Sundrum a<br />
a Department of Animal Nutrition and Animal Health, University of Kassel,<br />
Nordbahnhofstr. 1a, 37213 Witzenhausen, Germany<br />
b Friedrich-Loeffler-Institute (FLI), Federal Research Institute for Animal Health,<br />
Institute of Animal Nutrition, Bundesallee 50, 38116 Braunschweig<br />
c Department of Soil Biology and Plant Nutrition, University of Kassel,<br />
Abstract<br />
Nordbahnhofstr. 1a, 37213 Witzenhausen, Germany<br />
Faeces of cattle are an important nutrient source for plant growth but<br />
simultaneously the starting point of gaseous emissions and nutrient losses. Strategies to<br />
minimize emissions and nutrient losses into the environment require improved<br />
quantitative information on C and N fractions in faeces and their potential for faecal N<br />
mineralisation for plant uptake and emission, respectively. Since more than half of the<br />
faecal nitrogen originates from microbial N, the objective of the study was to develop a<br />
method for quantitatively detecting microbial biomass and portion of living<br />
microorganisms in dairy cattle faeces, including bacteria, fungi, and archaea. Three<br />
techniques were tested for repeatability. The chloroform fumigation extraction (CFE)<br />
method was applied for determining microbial biomass in cattle faeces. Detection of the<br />
fungal cell-membrane component ergosterol and amino sugar analysis of the cell-wall<br />
components fungal glucosamine and bacterial muramic acid served as indices for the<br />
microbial community structure. They also provided independent control values for the<br />
reliability of the microbial biomass range obtained by the CFE method. In a second<br />
* Corresponding author. Tel.: +49 5542 98 1523; e-mail: daphne.jost@arcor.de
5. Microbial biomass in faeces of dairy cows affected by a nitrogen deficient diet 36<br />
step, an N deficient (ND) and an N balanced diet (NB) were compared with respect to<br />
the impacts on faecal C and N fractions, microbial indices and digestibility.<br />
The CFE method in combination with fungal ergosterol and amino sugar analysis<br />
showed an acceptable reproducibility when applied in the analysis of faeces. The mean<br />
values of microbial biomass C and N concentrations averaged around 37 and 4.9 mg g -1<br />
DM, respectively. Ergosterol, together with fungal glucosamine and bacterial muramic<br />
acid, revealed a percentage of 25% fungal C in relation to the total microbial C content<br />
in dairy cattle faeces. Changes in ruminal N supply showed significant effects on faecal<br />
composition. Faecal concentrations of NDF, hemicelluloses and undigested dietary N<br />
(UDN) as well as the total C/N ratio were significantly higher in ND compared to the<br />
NB treatment. N deficiency was reflected also by a higher microbial biomass C/N ratio.<br />
It is concluded that the assessment of microbial indices provides valuable information<br />
with respect to diet effects on faecal composition and the successive decomposition.<br />
Further studies should be conducted to explore the potentials for minimising nutrient<br />
losses from faeces.<br />
Keywords: cattle faeces, microbial biomass, bacterial and fungal distribution, N<br />
deficiency<br />
5.1 Introduction<br />
Conversion of ingested nutrients by ruminants into saleable products is a<br />
comparably inefficient process, as only an average of 25% of dietary protein is<br />
converted into meat and/or milk (Dewhurst et al., 2000; Calsamiglia et al., 2010).<br />
Nutrients in animal excreta that are not used by plants for growth processes contribute<br />
considerably to soil and ground water pollution (Petersen et al., 2007). Optimisation of<br />
the feeding regime has often been described as a key strategy for decreasing the portion<br />
of nutrients in the manure (Tamminga, 2003; Dijkstra et al., 2007). In the past,<br />
investigations of feeding effects on manure composition have mainly focused on slurry<br />
(Van Vliet et al., 2007), while little is published about the characteristics of solid<br />
manure. Gaseous emissions of N2O and NH3 are affected to a high degree by the<br />
availability of easily soluble faecal N and C fractions and by interactions with local<br />
environmental conditions (James et al., 1999; Arriaga et al., 2010). Organic matter with
5. Microbial biomass in faeces of dairy cows affected by a nitrogen deficient diet 37<br />
a high C/N ratio is expected to have long-term beneficial effects on soil biological<br />
functioning and nutrient use efficiency of plants (Haynes and Naidu, 1998; Mäder et al.,<br />
2002). For plant uptake, faecal N has to be mineralised after manure application.<br />
Mineralisation of faecal N is influenced, among other things, by variation in the fibre<br />
fractions (NDF, ADF, and ADL) and by the C/N ratio (Kyvsgaard et al., 2000). The<br />
organic bound N fraction is mineralised more rapidly in the soil than the fibre bound N<br />
(Sørensen et al., 2003; Powell et al., 2006).<br />
Differences in the concentration of nutrients and organic components in the diet<br />
also affect the microbial community of the faeces (Van Vliet et al., 2007). As more than<br />
half of the faecal nitrogen originates from microbial N (Larsen et al., 2001), knowledge<br />
of the microbial biomass content in faeces is important to assess the efficiency of<br />
nutrient use. However, methods for quantifying microbial biomass and living<br />
microorganisms in fresh faeces are rare. With the exception of pathogens and coliform<br />
bacteria shed in faeces (Van Kessel et al., 2007), microbial populations of the intestinal<br />
tract and their relationship to host diet remain less well characterized (Frostegård et al.,<br />
1997; Gattinger et al., 2007; Van Vliet et al., 2007). The intestinal tract of cattle is<br />
colonized by a highly dynamic community of bacteria, archaea and fungi. Methods that<br />
enable the assessment of the total microbial biomass in faeces provide valuable<br />
information on the dynamics of fermentation processes and microbiological populations<br />
within the large intestine and after defecation.<br />
In general, plate count approaches discriminate archaea and other non-cultivable<br />
microorganisms, which contribute more than 80% to the total number of species<br />
(Ouwerkerk and Klieve, 2001). Direct microscopic approaches often severely<br />
underestimate fungi (Joergensen and Wichern, 2008). New molecular techniques have<br />
made it possible to quantify certain microbial species or genera in different substrates<br />
and also in intestinal contents of cattle (Frey et al., 2010). The extraction of DNA<br />
followed by analysis of its composition provides important information on the microbial<br />
community composition of faeces (Van Vliet et al., 2007; Sekhavati et al., 2009), but<br />
usually reveals no information on the biomass, due to losses during extraction and<br />
unknown or highly variable DNA concentrations within different microorganisms<br />
(Leckie et al., 2004; Joergensen and Emmerling, 2006).<br />
In contrast to the methods listed above, the chloroform fumigation extraction (CFE)<br />
method is able to estimate the biomass of all microorganisms surrounded by an intact<br />
cell-membrane, i.e. bacteria, fungi, and archaea. Additionally, the method has proven to
5. Microbial biomass in faeces of dairy cows affected by a nitrogen deficient diet 38<br />
facilitate the differentiation between living and dead microbial tissue in compost<br />
(Gattinger et al., 2004), pig manure (Aira et al., 2006; Guerrero et al., 2007) and cattle<br />
faeces (Jost et al., 2011). Ergosterol is an important component of fungal cell<br />
membranes, responsible for their stability and an index for fungal biomass (Weete and<br />
Weber, 1980; Djajakirana et al., 1996).<br />
The aim of the present study was to gain quantitative information on faecal<br />
microbial biomass and the proportion of bacteria and fungi in faeces of dairy cows and<br />
to reflect changes in dietary N supply on faecal microbial composition.<br />
5.2 Materials and Methods<br />
5.2.1. Feeding regime<br />
Faeces samples were taken from 10 dairy cows (German Holstein) that were part of<br />
a digestion trial on the experimental station of the Institute of Animal Nutrition of the<br />
Friedrich-Loeffler-Institute, Braunschweig, Germany (Aschemann et al., personal<br />
communication). The experiment comprised two feeding regimes with five cows each<br />
(n = 5). Faecal samples deriving from the same animal and regime were taken as<br />
representative for repeated measure (n = 3). All cows were fed with maize-based silage<br />
(Zea mays L.) and a concentrate consisting of 20% soybean (Glycine max (L.) Merr.),<br />
22.7% barley (Hordeum vulgare L.), 22.7% wheat (Triticum aestivum L.), 18.8% maize,<br />
14.8% sugar beet (Beta vulgaris L.) pulp, and 1% mineral/vitamin mix. Diet<br />
composition and feed intake of silage and concentrate in kg d -1 are presented in Table 1.<br />
The experimental treatment comprised an N deficient diet (ND) and a control feeding<br />
with an optimal amount of rumen available N (NB), adjusted by addition of 3% urea to<br />
the concentrate.<br />
The samples were taken rectally during three sampling days in May to July 2010,<br />
homogenized and immediately frozen in liquid nitrogen. This preservation technique<br />
has been tested, comparing the faeces samples obtained this way with fresh samples,<br />
which were immediately used for analysis and showed no significant differences (data<br />
not shown). A sub-sample was dried for 72 h at 60 °C and finely ground for chemical<br />
analyses.
5. Microbial biomass in faeces of dairy cows affected by a nitrogen deficient diet 39<br />
Table 1. Feed intake of silage and concentrate in kg per day and diet composition<br />
Silage Concentrate<br />
ND NB<br />
Feeding (kg d -1 ) 9.9 ± 0.22 7.9 ± 0.18 7.9 ± 0.18<br />
Dry matter (% FM) 36 88 88<br />
Crude ash (g kg -1 DM) 39 44 42<br />
Crude protein (g kg -1 DM) 74 190 275<br />
Crude lipid (g kg -1 DM) 32 26 26<br />
NDF (g kg -1 DM) 429 197 196<br />
ADF (g kg -1 DM) 221 83 82<br />
Urea (%) 3<br />
ND = N deficient feeding, NB = N balanced feeding; DM = dry matter; FM = fresh<br />
matter; NDF = Neutral detergent fibre, ADF = Acid detergent fibre; cow replicates per<br />
feeding regime n = 5, replicate sub-samples for experiments n = 3; ± standard<br />
deviation.<br />
Tabelle 5 (Table 1): Feed intake of silage and concentrate in kg per day and diet composition<br />
5.2.2. Faecal C and N fractions<br />
Total C and N were determined after dry combustion by gas chromatography using<br />
a Vario MAX (Elementar, Hanau, Germany) elemental analyzer. Total phosphor and<br />
sulphur were analyzed after HNO3-pressure digestion as described by Chander et al.<br />
(2008) by ICP-AES (Spectro Analytical Instruments, Kleve, Germany). Faeces pH was<br />
measured using a 1/1 Aqua dist./faeces ratio. Crude ash was determined by ashing<br />
overnight at 550 °C in a muffle furnace. Ammonium and the organic components such<br />
as acid detergent lignin (ADL), acid detergent fibre (ADF), neutral detergent fibre<br />
(NDF), and undigested dietary N (UDN) were determined by near-infrared spectroscopy<br />
(FOSS 6500, Rellingen, Germany), as described by Althaus and Sundrum (University<br />
of Kassel, Witzenhausen, Germany, personal communication). Hemicellulose was<br />
calculated as the difference between NDF and ADF. All data were the mean of five<br />
cows for each feeding regime. Three replicates were taken from each cow on three<br />
different sampling days.
5. Microbial biomass in faeces of dairy cows affected by a nitrogen deficient diet 40<br />
5.2.3. Microbial biomass C and N<br />
Microbial biomass C and N were estimated by the chloroform fumigation<br />
extraction method (Brookes et al., 1985, Vance et al., 1987), modified by Jost et al.<br />
(2011). Two freshly thawed subsamples equivalent to 0.5 g oven-dry faeces were taken<br />
for the analysis. One sub-sample was fumigated at 25 °C with ethanol-free CHCl3,<br />
which was removed after 24 h. Fumigated and non-fumigated portions were extracted<br />
with 100 ml 0.05 M CuSO4 for 30 min by horizontal shaking at 200 rev min -1 .<br />
Following centrifugation (2000 g for 10 min), the faeces extract was filtered (filter<br />
paper hw3, Sartorius Stedim Biotech, Göttingen, Germany). Organic C in the extracts<br />
was measured as CO2 by infrared absorption after combustion at 850 °C using a<br />
Dimatoc 100 automatic analyzer (Dimatec, Essen, Germany). Microbial biomass C was<br />
calculated as follows: microbial biomass C = EC/kEC, where EC = (organic C extracted<br />
from fumigated faeces) – (organic C extracted from non-fumigated faeces) and kEC =<br />
0.45 (Wu et al., 1990; Joergensen, 1996). Total N in the extracts was measured by<br />
chemoluminescence detection. Microbial biomass N was calculated as follows:<br />
microbial biomass C = EN/kEN, where EN = (organic N extracted from fumigated faeces)<br />
– (organic N extracted from non-fumigated faeces) and kEN = 0.54 (Brookes et al., 1985;<br />
Joergensen and Mueller, 1996).<br />
Together with the detection of microbial biomass by the CFE method, ergosterol<br />
was determined as an index for fungal biomass and as an independent control method.<br />
Determination of fungal glucosamine and bacterial muramic acid served as further<br />
independent control values for both CFE microbial biomass and ergosterol data<br />
(Appuhn and Joergensen, 2006; Jost et al., 2011).<br />
5.2.4. Ergosterol analysis<br />
The extraction method of Zelles et al. (1987) was used for determination of the<br />
fungal cell-membrane ergosterol. Freshly thawed faeces of 0.5 g DM were placed into<br />
30 ml test tubes and treated with 10 ml methanol, 2.5 ml ethanol and 1 g KOH. The<br />
sample was saponified for 90 min at 70 °C under reflux. After cooling, ergosterol was<br />
extracted in two steps with 15 + 10 ml petroleum ether. From the supernatant, 15 ml<br />
were evaporated in a vacuum rotary evaporator at 40 °C. The non-polar fraction was<br />
dissolved in 5 ml methanol and stored at 4 °C until measurement. Ergosterol was
5. Microbial biomass in faeces of dairy cows affected by a nitrogen deficient diet 41<br />
determined by reversed-phase HPLC with 100% methanol as the mobile phase and<br />
detected at a wavelength of 282 nm (Jost et al., 2011).<br />
5.2.5. Amino sugars<br />
The amino sugars muramic acid, mannosamine, glucosamine and galactosamine<br />
were determined according to Indorf et al. (2011). Moist samples of 2 g fresh faeces<br />
were weighed into 20 ml test tubes, mixed with 10 ml 6 M HCl, and heated for 2 h at<br />
105 °C. After HCl removal from the filtered hydrolysates in a vacuum rotary evaporator<br />
at 40 °C and centrifugation, the samples were transferred to vials and stored at -18 °C<br />
until the HPLC measurements. Chromatographic separations were performed on a<br />
Phenomenex (Aschaffenburg, Germany) Hyperclone C18 column (125 mm length × 4<br />
mm diameter), protected by a Phenomenex C18 security guard cartridge (4 mm length ×<br />
2 mm diameter) at 35 °C. The HPLC system consisted of a Dionex (Germering,<br />
Germany) P 580 gradient pump, a Dionex Ultimate WPS – 3000TSL analytical<br />
autosampler, with in-line split-loop injection and thermostat, and a Dionex RF 2000<br />
fluorescence detector set at 445 nm emission and 330 nm excitation wavelengths, with<br />
medium sensitivity. OPA reagent (o-Phthalaldehyde), sample and preparation vials were<br />
stored in the autosampler at 15 °C. For the automated pre-column derivatisation, 50 µl<br />
OPA and 30 µl sample were mixed in the preparation vial, and 15 µl of the indole<br />
derivates were injected after 120 sec reaction time. The mobile phase consisted of two<br />
eluents and was delivered at a flow rate of 1.5 ml min -1 . Eluent A was a 97.8/0.7/1.5<br />
(v/v/v) mixture of an aqueous phase, methanol and tetrahydrofuran (THF). The aqueous<br />
phase contained 52 mmol sodium citrate and 4 mmol sodium acetate, adjusted to pH 5.3<br />
with HCl. Methanol and THF were then added. Eluent B consisted of 50% water and<br />
50% methanol (v/v).<br />
Fungal C (mg g -1 dry weight) was calculated by subtracting bacterial glucosamine<br />
from total glucosamine as an index for fungal residues, assuming that muramic acid and<br />
glucosamine occur at a 1 to 2 molar ratio in bacterial cells (Engelking et al., 2007): mg<br />
fungal C g -1 dry weight = (mmol glucosamine − mmol muramic acid) × 179.2 g mol -1 ×<br />
9, where 179.2 is the molecular weight of glucosamine and 9 the conversion value of<br />
fungal glucosamine to fungal C (Appuhn and Joergensen, 2006). Bacterial C (µg g -1 dry<br />
weight) was calculated as an index for bacterial residues by multiplying the
5. Microbial biomass in faeces of dairy cows affected by a nitrogen deficient diet 42<br />
concentration of muramic acid in µg g -1 dry weight by 45 (Appuhn and Joergensen,<br />
2006).<br />
5.2.6. Statistical analysis<br />
The results presented in the tables are arithmetic means and expressed on an oven-<br />
dry basis (about 72 h at 60°C). The significance of difference was tested by one-way<br />
analysis of variance for repeated measures. All statistical analyses were performed using<br />
JMP 7.0 (SAS Inst. Inc.).<br />
5.3 Results<br />
The dry matter percentage of faeces samples ranged between 13 and 17 % (data not<br />
shown). Mean organic C (data not shown) and N content averaged 604 and 29 mg g -1<br />
DM, respectively, without significant differences between treatments (Table 2). The<br />
mean faecal pH-value was significantly higher in NB (6.7, P
5. Microbial biomass in faeces of dairy cows affected by a nitrogen deficient diet 43<br />
Tabelle 6 (Table 2): Elemental composition and organic components in the faeces of dairy cows fed an N deficient and an N balanced diet<br />
Table 2. Elemental composition and organic components in the faeces of dairy cows fed an N deficient and an N balanced diet<br />
Crude Hemi-<br />
pH (H2O) N C/N NH4 + ash cellulose NDF ADF ADL UDN<br />
(mg g -1 DM) (mg g -1 DM)<br />
Mean 6.4 29 22 0.68 75 322 668 346 58 0.78<br />
ND 6.2 27 23 0.61 64 370 710 337 52 0.83<br />
NB 6.7 30 20 0.74 86 270 630 355 64 0.73<br />
Probability values<br />
Feeding 0.01 ns 0.04 ns
5. Microbial biomass in faeces of dairy cows affected by a nitrogen deficient diet 44<br />
Tabelle 7 (Table 3): Microbial biomass, amino sugar indices and microbial C in faeces of dairy cows fed an N deficient and an N balanced diet<br />
Table 3. Microbial biomass, amino sugar indices and microbial C in faeces of dairy cows fed an N deficient and an N balanced diet<br />
Microbial biomass<br />
C N Ergosterol MurN ManN GlcN GalN Microbial C<br />
(mg g -1 DM) (µg g -1 DM) (mg g -1 DM)<br />
Mean 37 4.9 13.2 0.80 0.22 2.4 2.1 50<br />
ND 35 4.0 12.7 0.76 0.19 2.4 2.1 50<br />
NB 39 5.8 13.7 0.84 0.24 2.4 2.0 49<br />
Day 1 37 4.5 9.3 0.60 0.24 1.9 1.7 36<br />
Day 2 35 5.0 15.2 0.71 0.17 2.1 1.9 42<br />
Day 3 39 5.2 15.2 1.11 0.30 3.2 2.7 65<br />
Probability values<br />
Feeding ns ns ns ns ns ns ns ns<br />
Day ns ns 0.01 0.01
5. Microbial biomass in faeces of dairy cows affected by a nitrogen deficient diet 45<br />
Table 4. Microbial ratios in faeces of dairy cows fed an N deficient and an N<br />
balanced diet<br />
Microbial Ergosterol/ Fungal C/ Fungal<br />
biomass microbial bacterial C glucosamine/<br />
C/N biomass C (‰) ergosterol<br />
Mean 8.0 0.35 0.34 107<br />
ND 9.1 0.36 0.36 119<br />
NB 7.0 0.34 0.31 94<br />
Probability values<br />
Feeding
5. Microbial biomass in faeces of dairy cows affected by a nitrogen deficient diet 46<br />
Abb. 6 (Fig. 1): Linear relationship between crude protein and microbial biomass N in faeces of dairy<br />
cows in relation to the different treatments (r = 0.55, n = 30, P < 0.01).<br />
Fig. 1. Linear relationship between crude protein and microbial biomass N in<br />
faeces of dairy cows in relation to the different treatments (r = 0.55, n = 30, P<br />
< 0.01).<br />
Abb. 7 (Fig. 2): Linear relationship between fungal C and ergosterol in faeces of<br />
dairy cows in relation to the different treatments (r = 0.43, n = 30, P < 0.01).<br />
Fig. 2. Linear relationship between fungal C and ergosterol in faeces of<br />
dairy cows in relation to the different treatments (r = 0.43, n = 30, P < 0.01).
5. Microbial biomass in faeces of dairy cows affected by a nitrogen deficient diet 47<br />
Fig. 3. Linear relationship between bacterial muramic acid and total N in<br />
faeces of dairy cows in relation to the different treatments (r = -0.57, n = 30,<br />
P < 0.01).<br />
Abb. 8 (Fig. 3): Linear relationship between bacterial muramic acid and total N in faeces of dairy cows in<br />
rent treatments (r = -0.57, n = 30, P < 0.01).<br />
5.4 Discussion<br />
5.4.1. Microbial indices<br />
The indicators of microbial biomass showed a low intra-individual variation<br />
between sampling days, indicating a good reproducibility of the data. A low variability<br />
of the parameters within the same treatment has been obtained previously by Jost et al.<br />
(2011) in faeces of heifers. However, the values found in heifers differed considerably<br />
from the values assessed in lactating dairy cows, although analyzed by the same set of<br />
methods. C and N content of microbial biomass determined in the faeces from heifers<br />
were three times lower than in the faeces of dairy cows in the current study, at 9.3 and<br />
1.9 mg g -1 DM, respectively. Additionally, mean microbial biomass C/N ratio showed<br />
lower values in faeces of heifers compared with lactating dairy cows. These differences<br />
are most likely due to differences in diet composition, with dairy cows receiving high<br />
amounts of concentrate, providing a higher substrate source for intestinal microbial<br />
growth and affecting faecal bacterial biomass (Van Vliet et al., 2007).
5. Microbial biomass in faeces of dairy cows affected by a nitrogen deficient diet 48<br />
In the current study, the concentration of microbial C, calculated on the basis of<br />
bacterial muramic acid and fungal glucosamine was approximately 50% higher<br />
compared with those in heifers (Jost et al., 2011). According to Amelung (2001, 2008),<br />
the cell-wall components muramic acid and glucosamine have the tendency to be<br />
accumulated in microbial residues, suggesting that roughly 75% of the faecal microbial<br />
C in the present study belong to the living fraction and the other 25% are within the<br />
remains of dead fungi and bacteria. In the highly dynamic situation of C and N supply<br />
in the gut, rapid microbial growth is probably accompanied by concomitant microbial<br />
death, as observed in soil (Chander and Joergensen, 2001). Although the current figures<br />
seem to be realistic, they should be compared with other methods, because it is not<br />
known (1) whether the glucosamine and muramic acid concentrations are identical in<br />
living and dead microbial tissue and (2) whether the several conversion values for<br />
microbial biomass C by the fumigation extraction method and for microbial C by amino<br />
sugar analysis may lead to an underestimation of microbial biomass C. Furthermore,<br />
this approach neglects the significant contribution of archaea to the faecal microbial<br />
biomass, which contribute approximately 16% of the archaeal phospholipid etherlipid<br />
(PLEL) to the total phospholipid chain content in cattle manure (Gattinger et al., 2007).<br />
Archaea do not contain the amino sugar muramic acid (Kandler and König, 1998), but<br />
most likely add to the CHCl3 labile C fraction obtained by the fumigation extraction<br />
method.<br />
In the context of the urea application in the N balanced diet, a decline was observed<br />
in the microbial biomass C/N ratio and the fungal C to ergosterol ratio. The higher<br />
supply of easily available N is expected to increase the N storage in faecal microbial<br />
biomass, apparently accompanied by a shift within the fungal community. Potential<br />
differences in microbial biomass content between the treatments were most likely<br />
minimized due to higher N use efficiency with lower N availability from the diet (Bach<br />
et al., 2005; Calsamiglia et al., 2010).<br />
5.4.2. Bacterial and fungal contribution to microbial tissue<br />
The average fungal C to bacterial C ratio of 0.34 found in this study is in line with<br />
the assumption of 25% fungal C and 75% bacterial C. This means that the faeces of<br />
dairy cows contained considerably less fungal C than faeces of heifers, where fungi
5. Microbial biomass in faeces of dairy cows affected by a nitrogen deficient diet 49<br />
contributed more than 40% to microbial C (Jost et al., 2011). This difference is due to<br />
the higher content of structural components such as ADF in the heifer diet.<br />
Chitin, the polymer of glucosamine, has previously been used as an indicator of<br />
fungal biomass in rumen fluid of cattle (Sekhavati et al., 2009) and in sheep faeces<br />
(Rezaeian et al., 2004a, b). The chitin concentration in sheep faeces was 10.2 mg g -1<br />
DM (Rezaeian et al., 2004a). In a sheep feeding experiment, the liquid associated<br />
fraction of rumen material contained 12.1 to 15.4 mg chitin g -1 DM and in the<br />
corresponding particle associated fraction 2.6 to 3.9 mg chitin g -1 DM. One reason for<br />
the markedly higher chitin concentration compared with the glucosamine concentration<br />
in the present study might be the differences in rumen and intestine physiology between<br />
sheep and cattle. However, Rezaeian et al. (2004a, 2006) used the colorimetric assay of<br />
Chen and Johnson (1983), which cannot distinguish between fungal glucosamine,<br />
bacterial glucosamine, and galactosamine. This may lead to an overestimation of fungal<br />
tissue. In accordance with the present data, Rezaeian et al. (2004a) have estimated that<br />
anaerobic fungi comprise approximately 20% of the total microbial biomass in the<br />
rumen of sheep.<br />
In the current study, the mean faecal concentration of ergosterol was 13.2 µg g -1<br />
DM. Klamer and Bååth (2004) obtained a factor of 190 when calculating the fungal<br />
biomass C from the ergosterol concentration in 11 compost fungi species. Taking this<br />
factor into account would result in a mean fungal biomass C content of 2.5 mg C g -1<br />
DM in the present faeces samples, suggesting that ergosterol containing fungi contribute<br />
a proportion of 7% to the total microbial biomass in both treatments.<br />
Ergosterol has been repeatedly used as an index for fungal biomass in soil (Bååth<br />
and Anderson, 2003) and other solid substrates (Newell, 1992), but only once in cattle<br />
faeces (Jost et al., 2011). Of the anaerobic fungal populations, yeasts such as Candida<br />
sp. (Ahmad et al., 2010) or Saccharomyces cerevisia (Aguilera et al., 2006) contain<br />
high concentrations of ergosterol, also food spoiling Mucor plumbeus (Taniwaki et al.,<br />
2009). In contrast, no ergosterol but high concentrations of cholesterol were measured<br />
in chytridiomycetes (Weete et al., 1989; Kagami et al., 2007). Until now, no<br />
information has been available on the ergosterol concentration of anaerobic fungal<br />
species found in cattle, such as Anaeromyces, Orpinomyces, Caecomyces, or Piromyces<br />
(Griffith et al., 2009).<br />
The majority of microbial data on faeces samples are based on colony forming units<br />
(CFU) or thallus forming units (TFU), counted on plates or as the most probable
5. Microbial biomass in faeces of dairy cows affected by a nitrogen deficient diet 50<br />
number (Griffith et al., 2009). Edwards et al. (2008) recovered just 11% of the bacterial<br />
taxa present within the rumen in culture. The bacterial biomass ranged from 1.2 to 8.0<br />
mg C g -1 DM, depending on the quality of the diet (Van Vliet et al., 2007). These values<br />
are similar to those of Jost et al. (2011), but markedly below the present data.<br />
Nevertheless, it should be considered that fungal biomass was not included in this<br />
technique, using confocal laser scanning microscopy and europium chelate/fluorescent<br />
brightener differential stain in combination with automated image analysis (Bloem et<br />
al., 1994). According to Frostegård et al. (1997), cattle manure contains about 2.6 mol%<br />
linoleic acid (18:2ω6.9). If linoleic acid is converted to fungal biomass by multiplying<br />
by 107 (Joergensen and Wichern, 2008), total PLFA contents of 300 nmol (Frostegård<br />
et al., 1997) and 1500 nmol (Gattinger et al., 2007) corresponded to a fungal biomass C<br />
ranging from 0.8 to 4.2 mg g -1 DM. The results for fungal biomass C, based on<br />
ergosterol and glucosamine analysis, were within the ranges determined in the present<br />
study.<br />
5.4.3. Digestibility affected by N deficient diet<br />
N deficiency in the diet showed a significant effect on nutrient digestibility.<br />
Concentration of neutral detergent fibre, hemicelluloses, and undigested dietary N in<br />
faeces were significantly higher in ND compared with the NB treatment (P
5. Microbial biomass in faeces of dairy cows affected by a nitrogen deficient diet 51<br />
faeces of the NB treatment is interpreted as a result of the lower concentration of<br />
organic matter in the faeces.<br />
C/N ratio in faeces of the NB treatment was significantly lower than in the ND<br />
treatment, which is primarily due to the differences in N availability in the rumen and<br />
the subsequent differences in microbial biomass in the hindgut. Hristov et al. (2004) did<br />
not find an effect of an increase in CP content in the diet on C/N ratio in faeces when<br />
adding protein to the diet of low producing dairy cows, already supplied with a level of<br />
nitrogen corresponding to microbial requirements. They explained the lack of animal<br />
responses with the lack of available ruminally degradable carbohydrates and the loss of<br />
N by urinary excretion.<br />
The mean faecal pH values found in the NB (6.7) and in the ND treatment (6.2)<br />
were lower than those found in the studies of Ireland-Perry and Stalling (1993). While<br />
they made use of corn silage and orchard grass hay as roughage, only corn silage was<br />
used as roughage in the current study. In the NB treatment, mean faecal pH value (6.7)<br />
was significantly higher than in the ND treatment (6.2). The reason might be due to the<br />
differences in the concentration of hemicelluloses in the hindgut, which in the case of<br />
the ND treatment provided a higher substrate source for microbial fermentation and<br />
production of volatile fatty acids compared with the NB treatment. The buffering<br />
capacity in the hindgut is lower than that in the rumen (Gressley, 2011).<br />
5.5 Conclusions<br />
The selected methods provided insights into the variability of faecal composition,<br />
encompassing all living microorganisms in faeces. Determination of microbial biomass<br />
with the CFE method in combination with fungal ergosterol and amino sugar analysis as<br />
supplemental microbial indicators showed a good reproducibility of the methods.<br />
Consistent data confirm that the applied techniques are expected to be suitable tools for<br />
analysing the effects of diet composition on faeces or on other intestinal contents and<br />
the subsequent behaviour of microorganisms in soil. Especially ergosterol and amino<br />
sugar analysis should be used additionally in the rumen and intestines as indices for<br />
fungal and bacterial contribution to ruminant digestion processes. Dietary N deficiency<br />
is reflected by a higher microbial biomass C/N ratio and lower digestibility of NDF and<br />
hemicelluloses. It is concluded that the assessment of microbial indices provides<br />
valuable information with respect to effects of diets on faecal composition and the
5. Microbial biomass in faeces of dairy cows affected by a nitrogen deficient diet 52<br />
successive decomposition. Further studies including a larger number of cows and diet<br />
variants should be conducted with the aim of minimising nutrient losses and, thus,<br />
achieving better nutrient use efficiency.<br />
Acknowledgments<br />
The skilful technical assistance of Gabriele Dormann and Christiane Jatsch is<br />
highly appreciated. This project was supported by a grant of the Research Training<br />
Group 1397 “Regulation of soil organic matter and nutrient turnover in organic<br />
agriculture” of the German Research Foundation (DFG). The animal trial was carried<br />
out with financial support from EU FP7 REDNEX. Faeces samples were provided by<br />
staff members of the Friedrich-Loeffler-Institute (FLI), Federal Research Institute for<br />
Animal Health, Institute of Animal Nutrition (ITE), Braunschweig, for which we are<br />
very grateful.<br />
5.6 References<br />
Aguilera, F., Peinado, R.A., Millán, C., Ortega, J.M., Mauricio, J.C., 2006. Relationship<br />
between ethanol tolerance, H + -ATPase activity and the lipid composition of the<br />
plasma membrane in different wine yeast strains. Int. J. Food Microbiol. 110, 34–<br />
42.<br />
Ahmad, A., Khan, A., Manzoor, N., Khan, L.A., 2010. Evolution of ergosterol<br />
biosynthesis inhibitors as fungicidal against Candida. Microb. Pathog. 48, 35–41.<br />
Aira, M., Monroy, F., Domínguez, J., 2006. Changes in microbial biomass and<br />
microbial activity of pig slurry after the transit through the gut of the earthworm<br />
Eudrilus eugeniae. Biol. Fertil. Soils 42, 371–376.<br />
Amelung, W., 2001. Methods using amino sugars as markers for microbial residues in<br />
soil. In: Lal, J.M., Follett, R.F., Stewart, B.A. (Eds.), Assessment Methods for Soil<br />
Carbon. Lewis Publishers, Boca Raton, pp. 233–272.<br />
Amelung, W., Brodowski, S., Sandhage-Hofmann, A., Bol, R., 2008. Combining<br />
biomarker with stable isotope analyses for assessing the transformation and<br />
turnover of soil organic matter. Advance in Agronomy 100, 155–250.
5. Microbial biomass in faeces of dairy cows affected by a nitrogen deficient diet 53<br />
Appuhn, A., Joergensen, R.G., 2006. Microbial colonisation of roots as a function of<br />
plant species. Soil Biol. Biochem. 38, 1040–1051.<br />
Arriaga, H., Salcedo, G., Calsamiglia, S., Merino, P., 2010. Effect of diet manipulation<br />
in dairy cow N balance and nitrogen oxides emissions from grasslands in northern<br />
Spain. Agric. Ecosyst. Environ. 135, 132–139.<br />
Bååth, E., Anderson, T.H., 2003. Comparison of soil fungal/bacterial ratios in a pH<br />
gradient using physiological and PLFA-based techniques. Soil Biol. Biochem. 35,<br />
955–963.<br />
Bach, A., Calsamiglia, S., Stern, M.D., 2005. Nitrogen metabolism in the rumen. J.<br />
Dairy Sci. 88, E9-E21.<br />
Bloem, J., Lebbink, G., Zwart, K.B., Bouwman, L.A., Burgers, S.L., De Vos, J.A.,<br />
Ruiter, P.C., 1994. Dynamics of microorganisms, microbivores and nitrogen<br />
mineralisation in winter wheat fields under conventional and integrated<br />
management. Agric. Ecosyst. Environ. 51, 129–143.<br />
Boucher, S.E., Ordway, R.S., Whitehouse, N.L., Lundy, F.P., Kononoff, P.J., Schwab,<br />
G.C., 2007. Effect of incremental urea supplementation of a conventional corn<br />
silage based diet on ruminal ammonia concentration and synthesis of microbial<br />
protein. J. Dairy Sci. 90, 5619–5633.<br />
Brookes, P., Landman, A., Pruden, G., Jenkinson, D.S., 1985. Chloroform fumigation<br />
and the release of soil nitrogen: A rapid direct extraction method to measure<br />
microbial biomass nitrogen in soil. Soil Biol. Biochem. 17, 837–842.<br />
Calsamiglia, S., Ferret, A., Reynolds, C.K., Kristensen, N.B., Van Vuuren, A.M., 2010.<br />
Strategies for optimizing nitrogen use by ruminants. Animal 4, 1184–1196.<br />
Cameron, M.R., Klusmeyer, T.H., Lynch, G.L., Clark, J.H., 1991. Effects of urea and<br />
starch on rumen fermentation, nutrient passage to the duodenum, and performance<br />
of cows. J. Dairy Sci. 74, 1321–1336.<br />
Chander, K., Hartmann, G., Joergensen, R.G., Khan, K.S., Lamersdorf, N., 2008.<br />
Comparison of methods for measuring heavy metals in soils contaminated by<br />
different sources. Archives of Agronomy and Soil Science 54, 413–422.<br />
Chander, K., Joergensen, R.G., 2001. Decomposition of 14C glucose in two soils with<br />
different levels of heavy metal contamination. Soil Biol. Biochem. 33, 1811–1816.<br />
Chen, G.C., Johnson, B.R., 1983. Improved colorimetric determination of cell wall<br />
chitin in wood decay fungi. Appl. Environ. Microbiol. 46, 13–16.
5. Microbial biomass in faeces of dairy cows affected by a nitrogen deficient diet 54<br />
Dewhurst, R.J., Davies, D.R., Merry, R.J., 2000. Microbial protein supply from the<br />
rumen. Anim. Feed Sci. Technol. 85, 1–21.<br />
Dijkstra, J., Kebreab, E., Mills, J.A., Pellikaaan, W.F., Lopez, S., Bannink, A., France,<br />
J., 2007. Predicting the profile of nutrients available for absorption: from nutrient<br />
requirement to animal response and environmental impact. Animal 1, 99–111.<br />
Djajakirana, G., Joergensen, R., Meyer, B., 1996. Ergosterol and microbial biomass<br />
relationship in soil. Biol. Fertil. Soils 22, 299–304.<br />
Edwards, J.E., Huws, S.A., Kim, E.J., Lee, M.R., Kingston-Smith, A.H., Scollan, N.D.,<br />
2008. Advances in microbial ecosystem concepts and their consequences for<br />
ruminant agriculture. Animal 2, 653–660.<br />
Engelking, B., Flessa, H., Joergensen, R.G., 2007. Shifts in amino sugar and ergosterol<br />
contents after addition of sucrose and cellulose to soil. Soil Biol. Biochem. 39,<br />
2111–2118.<br />
Erdman, R.A., Proctor, G.H., Vanadersall, J.H., 1986. Effect of rumen ammonia<br />
concentration on in situ rate and extent of digestion of feedstuffs. J. Dairy Sci. 69,<br />
2312–2320.<br />
Frey, J.C., Pell, A.N., Berthiaume, R., Lapierre, H., Lee, S., Ha, J.K., Mendell, J.E.,<br />
Angert, E.R., 2010. Comparative studies of microbial populations in the rumen,<br />
duodenum, ileum and faeces of lactating dairy cows. J. Appl. Microbiol. 108,<br />
1982–1993.<br />
Frostegård, A., Petersen, S.O., Bååth, E., Nielsen, T.H., 1997. Dynamics of a microbial<br />
community associated with manure hot spots as revealed by phospholipid fatty acid<br />
analyses. Appl. Environ. Microbiol. 63, 2224–2231.<br />
Gattinger, A., Bausenwein, U., Bruns, C., 2004. Microbial biomass and activity in<br />
composts of different composition and age. J Plant Nutr Soil Sci 167, 556–561.<br />
Gattinger, A., Höfle, M.G., Schloter, M., Embacher, A., Böhme, F., Munch, J.C.,<br />
Labrenz, M., 2007. Traditional cattle manure application determines abundance,<br />
diversity and activity of methanogenic Archaea in arable European soil. Environ.<br />
Microbiol. 9, 612–624.<br />
Gressley, T.F., Hall, M.B., Armentano, L.E., 2011. Ruminant nutrition symposium:<br />
productivity, digestion, and health responses to hindgut acidosis in ruminant.<br />
Animal Sci. 1989, 1120–1130.
5. Microbial biomass in faeces of dairy cows affected by a nitrogen deficient diet 55<br />
Griffith, G.W., Ozkose, E., Theodorou, M.K., Davies, D.R., 2009. Diversity of<br />
anaerobic fungal populations in cattle revealed by selective enrichment culture<br />
using different carbon sources. Fungal Ecol 2, 87–97.<br />
Griswold, K.E., Apgar, G.A., Bouton, J., Firkins, J.L., 2003. Effects of urea infusion<br />
and ruminal degradable protein concentration on microbial growth, digestibility,<br />
and fermentation in continuous culture. Animal Sci. 81, 329–336.<br />
Guerrero, C., Morala, R., Gómeza, I., Zornozaa, R., Arceneguia, V., 2007. Microbial<br />
biomass and activity of an agricultural soil amended with the solid phase of pig<br />
slurries. Bioresour Technol 98, 3259–3264.<br />
Haynes, R.J., Naidu, R., 1998. Influence of lime, fertilizer and manure application pm<br />
soil organic matter content and soil physical conditions: a review. Nutr. Cycl.<br />
Agroecosyst. 51, 123–137.<br />
Hristov, A.N., Etter, R.P., Ropp, J.K., Grandeen, K.L., 2004. Effect of dietary crude<br />
protein level and degradability on ruminal fermentation and nitrogen utilization in<br />
lactating dairy cows. J. Anim. Sci. 82, 3219–3229.<br />
Indorf, C., Dyckmans, J., Khan, K.S., Joergensen, R.G., 2011. Optimisation of amino<br />
sugar quantification by HPLC in soil and plant hydrolysates. Biol. Fertil. Soils.<br />
Ireland-Perry, R.L., Stallings, C.C., 1993. Fecal consistency as related to dietary<br />
composition in lactating Holstein cows. J. Dairy Sci. 76, 1074–1082.<br />
James, T., Mexer, D., Esparza, E., Depeters, E.J., Perez-Monti, H., 1999. Effects of<br />
dietary nitrogen manipulation on ammonia volatilization from manure from<br />
Holstein heifers. J. Dairy Sci. 82, 2430–2439.<br />
Joergensen, R.G., 1996. The fumigation-extraction method to estimate soil microbial<br />
biomass: Calibration of the kEC value. Soil Biol. Biochem. 28, 25–31.<br />
Joergensen, R.G., Emmerling, C., 2006. Methods for evaluating human impact on soil<br />
microorganisms based on their activity, biomass, and diversity in agricultural soils.<br />
J Plant Nutr Soil Sci 169, 295–309.<br />
Joergensen, R.G., Mueller, T., 1996. The fumigation-extraction method to estimate soil<br />
microbial biomass: Calibration of the kEN value. Soil Biol. Biochem. 28, 33–37.<br />
Joergensen, R.G., Wichern, F., 2008. Quantitative assessment of the fungal contribution<br />
to microbial tissue in soil. Soil Biol. Biochem. 40, 2977–2991.<br />
Jost, D.I., Indorf, C., Joergensen, R.G., Sundrum, A., 2011. Determination of microbial<br />
biomass and fungal and bacterial distribution in cattle faeces. Soil Biol. Biochem.<br />
doi:10.1016/j.soilbio.2011.02.013,
5. Microbial biomass in faeces of dairy cows affected by a nitrogen deficient diet 56<br />
Kagami, M., <strong>von</strong> Elert, E., Ibelings, B.W., De Bruin, A., Van Donk, E., 2007. The<br />
parasitic chytrid, Zygorhizidium, facilitates the growth of the cladoceran<br />
zooplankter, Daphnia, in cultures of the inedible alga, Asterionella. Proc. Biol. Sci.<br />
274, 1561–1566.<br />
Kandler, O., König, H., 1998. Cell wall polymers in Archaea (Archaebacteria). Cell.<br />
Mol. Life Sci. 54, 305–308.<br />
Van Kessel, J.S., Pachepsky, Y.A., Shelton, D.R., Karns, J.S., 2007. Survival of<br />
Escherichia coli in cowpats in pasture and in laboratory conditions. J. Appl.<br />
Microbiol. 103, 1122–1127.<br />
Klamer, M., Bååth, E., 2004. Estimation of conversion factors for fungal biomass<br />
determination in compost using ergosterol and PLFA 18:2ω6,9. Soil Biol. Biochem.<br />
36, 57–65.<br />
Kyvsgaard, P., Sørensen, P., Møller, E., Magid, J., 2000. Nitrogen mineralization from<br />
sheep faeces can be predicted from the apparent digestibility of the feed. Nutr.<br />
Cycl. Agroecosyst. 57, 207–214.<br />
Larsen, M., Madsen, T.G., Weisbjerg, M.R., Hvelplund, T., Madsen, J., 2001. Small<br />
intestinal digestibility of microbial and endogenous amino acids in dairy cows. J.<br />
Anim. Physiol. Anim. Nutr. 85, 9–21.<br />
Leckie, S.E., Prescott, C.E., Graystonb, S.J., Neufeldc, J.D., Mohnc, W.W., 2004.<br />
Comparison of chloroform fumigation-extraction, phospholipid fatty acid, and<br />
DNA methods to determine microbial biomass in forest humus. Soil Biol. Biochem.<br />
36, 529–532.<br />
Mäder, P., Fließbach, A., Dubois, D., Gunst, L., Fried, P., Niggli, U., 2002. Soil<br />
Fertility and Biodiversity in Organic Farming. Science 296, 1694–1697.<br />
Newell, S.Y., 1992. Estimating fungal biomass and productivity in decomposing litter.<br />
In: G.C. Carol and D.T. Wicklow (Ed.), The Fungal Community: its Organization<br />
and Role in the Ecosystem, 2nd ed. Marcel Dekker, New York, pp. 521–561.<br />
Ouwerkerk, D., Klieve, A.V., 2001. Bacterial Diversity within Feedlot Manure.<br />
Anaerobe 7, 59–66.<br />
Petersen, S.O., Sommer, S.G., Béline, F., Burton, C., Dach, J., Dourmad, J.Y., Leip, A.,<br />
2007. Recycling of livestock manure in a whole-farm perspective. Livest. Sci. 112,<br />
180–191.
5. Microbial biomass in faeces of dairy cows affected by a nitrogen deficient diet 57<br />
Powell, J.M., Broderick, G.A., Grabber, J.H., Hymnes-Fecht, U.C., 2009. Technical<br />
note: Effects of forage protein-binding polyphenols on chemistry of dairy excreta.<br />
J. Dairy Sci. 92, 1765–1769.<br />
Rezaeian, M., Beakes, G.W., Chaudhry, A.S., 2006. Effect of feeding chopped and<br />
pelleted lucerne on rumen fungal mass, fermentation profiles and in sacco<br />
degradation of barley straw in sheep. Anim. Feed Sci. Technol. 128, 292–306.<br />
Rezaeian, M., Beakes, G.W., Parker, D.S., 2004b. Methods for the isolation, culture and<br />
assessment of the status of anaerobic rumen chytrids in both in vitro and in vivo<br />
systems. Mycol. Res. 108, 1215–1226.<br />
Rezaeian, M., Beakes, G.W., Parker, D.S., 2004a. Distribution and estimation of<br />
anaerobic zoosporic fungi along the digestive tracts of sheep. Mycol. Res. 108,<br />
1227–1233.<br />
Ruiz, R., Tedeschi, L.O., Marini, J.C., Fox, D.G., Pell, A.N., Jarvis, G., Russell, J.B.,<br />
2002. The effect of ruminal nitrogen (N) deficiency in dairy cows: Evaluation of<br />
the Cornell Net Carbohydrate and Protein System ruminal N deficiency adjustment.<br />
J. Dairy Sci. 85, 2986–2999.<br />
Sekhavati, M.H., Mesgaran, M.D., Nassiri, M.R., Mohammadabadi, T., Rezaii, F.,<br />
Maleki, A.F., 2009. Development and use of quantitative competitive PCR assays<br />
for relative quantifying rumen anaerobic fungal populations in both in vitro and in<br />
vivo systems. Mycol. Res. 113, 1146–1153.<br />
Sørensen, P., Weisbjerg, M.R., Lund, P., 2003. Dietary effects on the composition and<br />
plant utilization of nitrogen in dairy cattle manure. J Agric Sci 141, 79–91.<br />
Van Soest, P.J., 1994. Nutritional ecology of the ruminant, 2nd ed. Cornell University<br />
Press, New York.<br />
Tamminga, S., 2003. Pollution due to nutrient losses and its control in European animal<br />
production. Livest. Prod. Sci. 84, 101–111.<br />
Taniwaki, M.H., Hocking, A.D., Pitt, J.I., Fleet, G.H., 2009. Growth and mycotoxin<br />
production by food spoilage fungi under high carbon dioxide and low oxygen<br />
atmospheres. Int. J. Food Microbiol. 132, 100–108.<br />
Vance, E., Brookes, P., Jenkinson, D., 1987. An extraction method for measuring soil<br />
microbial biomass C. Soil Biol. Biochem. 19, 703–707.<br />
Weete, J.D., Fuller, M.S., Huang, M.Q., Gandhi, S., 1989. Fatty acids and sterols of<br />
selected hyphochytriomycetes and chytridiomycetes. Exp. Mycol. 13, 183–195.
5. Microbial biomass in faeces of dairy cows affected by a nitrogen deficient diet 58<br />
Weete, J.D., Weber, D.J., 1980. Lipid Biochemistry of Fungi and other Organisms.<br />
Plenum Press, New York.<br />
Van Vliet, P.C.J., Reijs, J.W., Bloem, J., Dijkstra, J., de Goede, R.G.M., 2007. Effects<br />
of Cow Diet on the Microbial Community and Organic Matter and Nitrogen<br />
Content of Feces. J. Dairy Sci. 90, 5146–5158.<br />
Wu, J., Joergensen, R.G., Pommerening, B., Chaussod, R., Brookes, P.C., 1990.<br />
Measurement of soil microbial biomass C by fumigation-extraction - an automated<br />
procedure. Soil Biol. Biochem. 22, 1167–1169.<br />
Zelles, L., Hund, K., Stepper, K., 1987. Methoden zur relativen Quantifizierung der<br />
pilzlichen Biomasse im Boden. J Plant Nutr Soil Sci 150, 249–252.
6. Effect of cattle faeces with different microbial biomass content on soil properties, gaseous<br />
emissions and plant growth 59<br />
6. Effect of cattle faeces with different microbial biomass<br />
content on soil properties, gaseous emissions and plant<br />
growth<br />
Daphne Isabel Jost ab* , Rainer Georg Joergensen b , Albert Sundrum a<br />
a Department of Animal Nutrition and Animal Health, University of Kassel,<br />
Nordbahnhofstr. 1a, 37213 Witzenhausen, Germany<br />
b Department of Soil Biology and Plant Nutrition, University of Kassel,<br />
Nordbahnhofstr. 1a, 37213 Witzenhausen, Germany<br />
Abstract<br />
A study was carried out to investigate the effects of different diets for heifers, low<br />
and high yielding cows on the microbial composition of their faeces and subsequently<br />
the impacts of these faeces on CO2 and N2O emissions, N mineralisation and plant N<br />
uptake.<br />
A diet low in N and high in ADF offered to heifers resulted in faeces dominated by<br />
fungi. These faeces were characterised by a low content in microbial biomass C and N<br />
and a high ergosterol concentration in comparison to the faeces of high yielding cows.<br />
Added to soil, faeces of heifers led to lower emission and stronger N immobilisation<br />
during a 14-day incubation in comparison to the faeces of high yielding cows. Total<br />
N2O emission was significantly correlated with faecal microbial biomass N. Rye grass<br />
yield and N uptake were lowest in the soil supplemented with faeces from heifers in a<br />
62-day pot experiment. Plant N uptake was influenced by the faecal microbial biomass<br />
C/N ratio and the fungal C to bacterial C ratio.<br />
* Corresponding author. Tel.: + 49 5542 98 1523; e-mail: daphne.jost@arcor.de
6. Effect of cattle faeces with different microbial biomass content on soil properties, gaseous<br />
emissions and plant growth 60<br />
In conclusion, the faecal microbial biomass was affected to a high degree by the<br />
feeding regime and faecal microbial characteristics revealed higher impacts on plant N<br />
uptake than soil microbial properties.<br />
Keywords: Cattle faeces; Microbial biomass C and N; Ergosterol, Amino sugar;<br />
Gaseous emission; N mineralisation<br />
6.1. Introduction<br />
Solid manure from farm animals differs considerably in total N concentration and N<br />
availability to soil microorganisms and plants, due to differences in diet digestibility,<br />
diet conversion by different animal species, age of the animal, and water intake<br />
(Chadwick et al., 2000). In faeces, more than 90% of total N is present in organic forms<br />
(Jost et al., 2011), bound mainly in amino acids, but also in heterocyclic components<br />
(Bosshard et al., 2011) or amino sugars (Rezaeian et al., 2004a, b, 2006; Jost et al.,<br />
2011). Mineralisation of these organic forms is a prerequisite for plant uptake. Solid<br />
manure low in total N content and high in plant cell wall components has shown to<br />
result in lower net N mineralisation rates in laboratory incubation (Cusick et al., 2006;<br />
Morvan and Nicolardot, 2009; Peters and Jensen, 2011), greenhouse pot (Ikpe et al.,<br />
2003; Wu and Powell, 2007), and field experiments (Sørensen et al., 2003; Reijs et al.,<br />
2007; Powell and Grabber, 2009). The feeding regime also has significant impacts on<br />
the faeces-derived emissions of NH3 (Merino et al., 2008; van der Stelt et al., 2008) and<br />
N2O (Flessa et al., 2002a; Arriaga et al., 2010), causing serious N losses and<br />
atmospheric pollution.<br />
Furthermore, differences in the chemical composition of the organic components<br />
affect the microbial community of faeces (van Vliet et al., 2007). Size and community<br />
structure of faecal microorganisms may control the decomposition of the faeces and the<br />
release of inorganic N after entering the soil (Chadwick et al., 2000). It is well-<br />
documented in various experiments with other organic material that the substrate<br />
colonising microbial community has an important influence on further decomposition<br />
processes (Flessa et al., 2002b) and directly adds significant amounts of microorganisms<br />
to the autochthonous soil microbial biomass (Rasul et al., 2008). Cattle faeces contain a<br />
highly dynamic community of bacteria, archaea and fungi which have not yet been
6. Effect of cattle faeces with different microbial biomass content on soil properties, gaseous<br />
emissions and plant growth 61<br />
qualified or quantified (Frostegård et al., 1997; Gattinger et al., 2007). Increased<br />
knowledge of the interactions between faecal composition and its behaviour in soil can<br />
lead to various strategies for livestock management and optimal utilisation, including<br />
method and time of application (Handayanta et al., 1997; Delve et al., 2001). As cattle<br />
diet and feed intake vary considerably between feeding regimes, influencing intestinal<br />
microbial parameters, direct measurements of the microbial community in faeces are an<br />
important source of information.<br />
The objectives of this study were to assess the effects of different feeding regimes<br />
for heifers, low and high yielding cows on faecal composition in the first place and<br />
subsequently the impacts of the faeces on N2O emissions, N mineralisation and plant N<br />
uptake. Faeces quality has previously been characterized microbially by determining<br />
microbial biomass C and N using the chloroform fumigation extraction (CFE) method,<br />
fungal ergosterol and the cell-wall components muramic acid and glucosamine (Jost et<br />
al., 2011). The CFE method is suited to differentiate accurately between living and dead<br />
microbial tissue (Brookes et al., 1985, Vance et al., 1987). Fungal ergosterol is an<br />
important component of fungal cell membranes (Weete and Weber, 1980). It has been<br />
repeatedly used as an index for fungal biomass in soil (Bååth and Anderson, 2003),<br />
other solid substrates (Newell, 1992), and in batch cultures of yeasts (Park et al., 1990).<br />
Fungal glucosamine and bacterial muramic acid were measured as independent control<br />
values for both CFE microbial biomass and ergosterol data (Appuhn and Joergensen,<br />
2006; Indorf et al., 2011; Jost et al, 2011).<br />
6.2. Material and methods<br />
6.2.1. Soil<br />
Soil samples were collected in March 2011 at 0-15 cm depth from the site<br />
“Saurasen”, located in the north of Hesse, Germany. The site is at 280 m above sea<br />
level, with an average annual precipitation of 625 mm and temperature of 6.5 °C.<br />
Developed from eroded loess overlying clayey sandstone, the soil is classified<br />
according to the WRB classification system as Stagnic Luvisol (Quintern et al., 2006).<br />
The particle size distribution was 6 % sand, 72% silt and 22% clay. Soil organic C and<br />
total N content were 8.2 mg g -1 and 0.89 mg g -1 , respectively. The soil had a pH (CaCl2)
6. Effect of cattle faeces with different microbial biomass content on soil properties, gaseous<br />
emissions and plant growth 62<br />
of 6.4, and a water holding capacity of 50%. After sampling, the soil was homogenized,<br />
sieved (
6. Effect of cattle faeces with different microbial biomass content on soil properties, gaseous<br />
emissions and plant growth 63<br />
6.2.3. Incubation experiment<br />
The experiment comprised three soil treatments and one control: (1) faeces from<br />
heifers, (2) faeces from low yielding dairy cows, (3) faeces from high yielding dairy<br />
cows, and (4) control without faeces. Each treatment was replicated six times; faeces<br />
treatments comprised six individual faecal samples. The experiment was carried out in<br />
1 l preserving jars. Each jar was filled with 50 g soil (on an oven-dry basis) at a bulk<br />
density of 1.0 g cm -3 . In the treatments with faeces addition, freshly thawed faeces were<br />
thoroughly mixed with the soil before filling into the jars. The application rate was 20<br />
mg freshly thawed faeces g -1 soil dry weight (DW). This amount was equivalent to<br />
0.4% of the soil DW and comprised an addition of 73 to 86 mg C per jar (18 – 21%) and<br />
2.7 to 5.3 mg N per jar (6 – 12%).<br />
The jars were incubated for 14 days at 22 °C and kept in the dark. At day 0, soil<br />
samples were removed from each jar to determine inorganic N. Soil respiration was<br />
measured as CO2 and N2O emissions. When starting the incubation, 10 ml 0.5 M NaOH<br />
were placed at the jar bottom and the lid was closed immediately. The NaOH solution<br />
was changed at day 3, 7 and 14. Evolved CO2 was determined by back-titration to pH<br />
8.3 of the excess NaOH with 0.5 M HCl after addition of 0.5 M BaCl2 solution. N2O<br />
emissions were measured at day 0, 1, 2, 3, 7, and 14. A 10 ml gas sample was taken out<br />
of the jar through a 3-layer silicone septum (Hamilton Company, Nevada, USA) with a<br />
plastic syringe. The samples were analysed immediately using a gas chromatograph<br />
GC-14B (Shimadzu Corporation, Kyoto, Japan). After 14 days, inorganic N and<br />
microbial biomass C and N were determined.<br />
6.2.4. Pot experiment<br />
The experiment had three soil treatments and one control: (1) faeces from heifers,<br />
(2) faeces from low-level dairy cows, (3) faeces from high-level dairy cows, and (4)<br />
control without faeces. Each treatment was replicated six times; faeces treatments<br />
comprised six individual faecal samples. The experiment was carried out in plastic pots<br />
(2.7 l, 13 × 13 cm). Each pot was filled with 2.4 kg soil (on an oven-dry basis) at a bulk<br />
density of 1.0 g cm -3 . In the three soil treatments, faeces were thoroughly mixed with<br />
the soil before filling into the pots. The application rate was 20 g freshly thawed faeces<br />
kg -1 soil. This amount was equivalent to 0.4% of the soil DW and comprised an addition
6. Effect of cattle faeces with different microbial biomass content on soil properties, gaseous<br />
emissions and plant growth 64<br />
of 3.5 to 4.1 g C per pot (1.4-1.7 g C kg -1 soil) and 130 to 252 mg N per pot (54-105 mg<br />
N kg -1 soil).<br />
Italian ryegrass (Lolium multiflorum, breed Ligrande, from Deutsche<br />
Saatveredelung AG) was sown in a density of 250 seeds per pot (1.5 seeds cm -2 ). The<br />
pots were arranged in a randomised complete block design and placed in a climate<br />
chamber with a 16-8 h light-dark cycle and peak temperatures of 20 °C (day) and 12 °C<br />
(night). Air humidity changed between 40% (day) and 90% (night). Soil moisture was<br />
kept at 50 % of the water-holding capacity by weighing and adding the water lost<br />
regularly three times a week. After germination, the first cut was conducted 5 cm<br />
aboveground at day 30 with a mean plant height of 15 cm. Total aboveground plants<br />
were harvested 62 days after germination. Samples were dried for 72 h at 40 °C for<br />
plant dry weight and finely ground to determine total C and N by combustion in a CNS<br />
Analyser (Elementar Vario EL, Elementar Analysensysteme GmbH Hanau, Germany).<br />
Mineral N was determined in soil sub-samples after harvesting.<br />
6.2.5. Microbial biomass C and N<br />
Microbial biomass C and N were estimated by the chloroform fumigation<br />
extraction method (Brookes et al., 1985, Vance et al., 1987). All soil samples were<br />
fumigated, extracted and measured for total C and N as described below. Two<br />
subsamples of 10 g fresh soil were taken for the analysis. One subsample was fumigated<br />
at 25 °C with ethanol-free CHCl3, which was removed after 24 h. Fumigated and non-<br />
fumigated portions were extracted with 40 ml 0.05 M K2SO4 for 30 min by horizontal<br />
shaking at 200 rev min -1 . Soil extracts were filtered (folded filter paper, hw3, Sartorius<br />
Stedim Biotech, Göttingen, Germany). Organic C in the extracts was measured as CO2<br />
by infrared absorption after combustion at 850 °C using a Dimatoc 100 automatic<br />
analyser (Dimatec, Essen, Germany). Microbial biomass C was calculated as follows:<br />
microbial biomass C = EC/kEC, where EC = (organic C extracted from fumigated faeces)<br />
– (organic C extracted from non-fumigated faeces) and kEC = 0.45 (Wu et al., 1990;<br />
Joergensen, 1996). Total N in the extracts was measured by chemoluminescence<br />
detection. Microbial biomass N was calculated as follows: microbial biomass C =<br />
EN/kEN, where EN = (organic N extracted from fumigated faeces) – (organic N extracted<br />
from non-fumigated faeces) and kEN = 0.54 (Brookes et al., 1985; Joergensen and<br />
Mueller, 1996).
6. Effect of cattle faeces with different microbial biomass content on soil properties, gaseous<br />
emissions and plant growth 65<br />
Faeces samples were fumigated and measured for C and N as described above,<br />
while the extraction was carried out according to the methodology described by Jost et<br />
al. (2011). Two freshly thawed subsamples equivalent to 0.5 g oven-dry faeces were<br />
taken for the analysis. Fumigated and non-fumigated portions were extracted with 100<br />
ml 0.05 M CuSO4 for 30 min by horizontal shaking at 200 rev min -1 . Following<br />
centrifugation (2000 g for 10 min), faeces extracts were filtered (hw3, Sartorius Stedim<br />
Biotech, Göttingen, Germany). C and N standards for calibration of the Dimatoc 100<br />
analyser were prepared in 0.05 M CuSO4 solution.<br />
6.2.6. Ergosterol analysis<br />
The fungal cell-membrane ergosterol was extracted and measured in soil according<br />
to Djajakirana et al. (1996). Moist soil samples of 0.5 g were extracted with 100 ml<br />
ethanol for 30 min by oscillating shaking at 250 rev min -1 . After filtering, the soil<br />
extract was evaporated in a vacuum rotary evaporator at 40 °C. The non-polar fraction<br />
was dissolved in 5 ml methanol and stored at 4 °C until measurement. For determination<br />
of ergosterol in faeces, the extraction method of Zelles et al. (1987) was used. Freshly<br />
thawed faeces equivalent to 0.5 g DW were placed into 30 ml test tubes and treated with<br />
10 ml methanol, 2.5 ml ethanol and 1 g KOH. The sample was saponified for 90 min at<br />
70 °C under reflux. After cooling, ergosterol was extracted in two steps with 15 + 10 ml<br />
petroleum ether. From the supernatant, 15 ml were evaporated in a vacuum rotary<br />
evaporator at 40 °C. The non-polar fraction was dissolved in 5 ml methanol and stored<br />
at 4 °C until measurement (Jost et al., 2011). Ergosterol was determined by reversed-<br />
phase HPLC with 100% methanol as the mobile phase and detected at a wavelength of<br />
282 nm.<br />
6.2.7. Amino sugar analysis<br />
The amino sugars muramic acid, glucosamine and galactosamine were determined<br />
in faeces samples according to Indorf et al. (2011). Moist samples of 2 g fresh faeces<br />
were weighed into 20 ml test tubes, mixed with 10 ml 6 M HCl, and heated for 2 h at<br />
105 °C. After HCl removal from the filtered hydrolysates in a vacuum rotary evaporator<br />
at 40 °C and centrifugation, the samples were transferred to vials and stored at -18 °C<br />
until the HPLC measurements. Chromatographic separations were performed on a
6. Effect of cattle faeces with different microbial biomass content on soil properties, gaseous<br />
emissions and plant growth 66<br />
Phenomenex (Aschaffenburg, Germany) Hyperclone C18 column (125 mm length × 4<br />
mm diameter), protected by a Phenomenex C18 security guard cartridge (4 mm length ×<br />
2 mm diameter) at 35 °C. The HPLC system consisted of a Dionex (Germering,<br />
Germany) P 580 gradient pump, a Dionex Ultimate WPS – 3000TSL analytical<br />
autosampler with in-line split-loop injection and thermostat and a Dionex RF 2000<br />
fluorescence detector set at 445 nm emission and 330 nm excitation wavelengths with<br />
medium sensitivity. OPA reagent (Merck Darmstadt), sample and preparation vials<br />
were stored in the autosampler at 15 °C. For the automated pre-column derivatisation,<br />
50 µl OPA and 30 µl sample were mixed in the preparation vial and after 120 sec<br />
reaction time 15 µl of the indole derivates were injected. The mobile phase consisted of<br />
two eluents and was delivered at a flow rate of 1.5 ml min -1 . Eluent A was a<br />
97.8/0.7/1.5 (v/v/v) mixture of an aqueous phase, methanol and tetrahydrofuran (THF).<br />
The aqueous phase contained 52 mmol sodium citrate and 4 mmol sodium acetate,<br />
adjusted to pH 5.3 with HCl. Then methanol and THF were added. Eluent B consisted<br />
of 50% water and 50% methanol (v/v).<br />
Fungal C (mg g -1 dry weight) was calculated by subtracting bacterial glucosamine<br />
from total glucosamine as an index for fungal residues, assuming that muramic acid and<br />
glucosamine occur at a 1 to 2 molar ratio in bacterial cells (Engelking et al., 2007): mg<br />
fungal C g -1 dry weight = (mmol glucosamine − mmol muramic acid) × 179.2 g mol -1 ×<br />
9, where 179.2 is the molecular weight of glucosamine and 9 the conversion value of<br />
fungal glucosamine to fungal C (Appuhn and Joergensen, 2006). Bacterial C (µg g -1 dry<br />
weight) was calculated as an index for bacterial residues by multiplying the<br />
concentration of muramic acid in µg g -1 dry weight by 45 (Appuhn and Joergensen,<br />
2006).<br />
6.2.8. Inorganic N<br />
Non-fumigated K2SO4 soil extracts were analysed for NH 4+ –N and NO3–N by<br />
colorimetric analysis with a Continuous Flow Analyser (Evolution2, Alliance<br />
Instruments, Friedrichsdorf) at 540 nm. Net mineralised N from soil organic N in each<br />
treatment was calculated as the sum of the inorganic N forms at the end of the<br />
incubation time minus the initial inorganic N in soil.
6. Effect of cattle faeces with different microbial biomass content on soil properties, gaseous<br />
emissions and plant growth 67<br />
6.2.9. Statistical analysis<br />
The results presented in the tables are arithmetic means and expressed on an oven-<br />
dry basis (about 72 h at 60 °C). The significance of difference was tested by one-way<br />
analysis of variance. Statistical analyses were performed using JMP 7.0 (SAS Inst. Inc.).<br />
6.3. Results<br />
6.3.1. Differences in faeces characteristics<br />
Differences in the feeding regime between the three treatments resulted in clear<br />
differences in the composition of their faeces (Table 1). The concentration of total N,<br />
the C/N ratio, NE and hemicellulose content differed significantly between the faeces<br />
treatments. In contrast, the concentration of UDN, ADF and cellulose showed no<br />
significant differences between treatments. CE was higher in the faeces of heifers than in<br />
the other groups. In faeces of high yielding cows, the faecal C/N ratio was lower with a<br />
higher dietary N concentration compared to the other treatments. Concerning faecal<br />
chemical properties, negative correlation coefficients were found between total N and<br />
ADF (r = -0.72, P < 0.001) and between NE and ADL (r = -0.80, P < 0.0001).<br />
Microbial biomass C, microbial biomass N, and bacterial muramic acid were<br />
highest in the faeces of high yielding cows in comparison to the faeces of heifers (P <<br />
0.05) (Table 2). Microbial indices revealed no significant differences between the faeces<br />
of low and high yielding cows, except for ergosterol. This fungal biomarker was<br />
significantly lower in the faeces of low yielding cows than in the other faeces. The<br />
concentration of glucosamine, galactosamine and microbial C did not differ between<br />
faeces of the three treatments. Faecal microbial biomass C/N ratio and the ratio of<br />
fungal C to bacterial C showed a strong positive correlation with r = 0.79 (P < 0.001).<br />
Both ratios significantly declined with increasing N content (Table 3). The correlation<br />
coefficients were r = -0.76 and r = -0.74, respectively (P < 0.001). The ratio ergosterol<br />
to microbial biomass C was lowest in the faeces of heifers, which in contrast revealed<br />
the highest ratio of fungal glucosamine to ergosterol. Faecal UDC correlated negatively<br />
with the microbial C to N ratio (r = -0.74, P = 0.0004) and with the fungal C to bacterial<br />
C ratio (r = -0.88, P < 0.0001). Similarly, an increase in NE went along with a lower<br />
portion of fungi in relation to bacteria, while higher CE values correlated positively with<br />
a higher fungal portion, but also with muramic acid (r = 0.73, P = 0.0007).
6. Effect of cattle faeces with different microbial biomass content on soil properties, gaseous emissions and plant growth 68<br />
Table 1. Elemental composition and organic components in different cattle feeding regimes and in cattle faeces<br />
N NH4 + C/N NE UDN UDC NDF ADF Cellulose Hemic. Crude ash<br />
(mg g -1 DW) (mg g -1 DW)<br />
Feeding (TMR)<br />
Heifer 21 491 342 267 149 185<br />
Low yielding 21 478 246 240 232 106<br />
High yielding 25 445 214 234 231 92<br />
Faeces<br />
Heifer 16 a 1.7 ab 28 a 0.93 a 6.3 a 25 a 472 a 383 a 281 a 89 a 196 a<br />
Low yielding 22 b 1.5 a 20 b 1.52 b 7.1 a 29 a 512 ab 379 a 288 a 133 b 158 b<br />
High yielding 28 c 2.1 b 16 c 2.17 c 6.8 a 30 b 522 b 353 a 281 a 169 c 150 b<br />
CV (±%) 12 19 10 17 9.3 3.4 6.0 5.8 5.4 16 6.5<br />
NE = easily decomposable nitrogen, UDN = undigested dietary nitrogen, UDC = undigested dietary carbon, NDF = neutral detergent fibre,<br />
ADF = acid detergent fibre, Hemic. = hemicellulose; DW = dry weight, TMR = total mixed ration, CV = pooled coefficient of variation<br />
between feeding regimes (cow replicates n = 6); different letters indicate a significant difference (Tukey/Kramer, P < 0.05).<br />
Tabelle 9 (Table 1): Elemental composition and organic components in different cattle feeding regimes and in cattle faeces
6. Effect of cattle faeces with different microbial biomass content on soil properties, gaseous<br />
emissions and plant growth 69<br />
Table 2. Microbial biomass indices, amino sugar indices and microbial C in cattle<br />
faeces from different feeding regimes<br />
Microbial biomass Microbial<br />
C N Ergosterol MurN ManN GlcN GalN C<br />
Faeces type (mg g -1 DW) (µg g -1 DW) (mg g -1 DW)<br />
Heifer 10 a 1.3 a 4.4 a 0.22 a 0.07 a 1.5 a 0.79 a 21 a<br />
Low yielding 14 ab 2.0 ab 2.2 b 0.41 b 0.15 b 2.0 a 1.15 a 31 a<br />
High yielding 18 b 3.1 b 3.8 a 0.45 b 0.09 ab 2.0 a 0.83 a 32 a<br />
CV (±%) 22 25 23 23 49 26 29 14<br />
DW = dry weight; MurN = muramic acid; ManN = mannosamine; GlcN = glucosamine;<br />
GalN = galactosamine; CV = pooled coefficient of variation between feeding regimes<br />
(cow replicates n = 6); different letters indicate a significant difference (Tukey/Kramer,<br />
P < 0.05)<br />
Tabelle 10 (Table 2): Microbial biomass indices, amino sugar indices and microbial C in cattle faeces from different feeding regimes<br />
Table 3. Microbial indices in cattle faeces from different feeding regimes<br />
Microbial Ergosterol/ Fungal C/ Fungal<br />
biomass microbial bacterial C glucosamine/<br />
Faeces type C/N biomass C(‰) ergosterol<br />
Heifer 7.9 a 0.45 a 1.10 a 296 a<br />
Low yielding 6.8 b 0.15 b 0.66 b 672 b<br />
High yielding 5.6 c 0.27 ab 0.60 b 385 ab<br />
CV (±%) 12 11 11 12<br />
CV = pooled coefficient of variation between feeding regimes (cow replicates n = 6);<br />
different letters indicate a significant difference (Tukey/Kramer, P < 0.05).<br />
Tabelle 11 (Table 3): Microbial indices in cattle faeces from different feeding regimes<br />
6.3.2. Effects of faeces types on soil microorganisms and grass growth<br />
The addition of the cattle faeces to the soil significantly increased the contents of<br />
soil microbial biomass N and fungal ergosterol (Table 4). However, increase in soil<br />
microbial biomass C was only significant in the case of faeces from the low yielding<br />
cows. Faeces addition increased the amounts of CO2 evolved. CO2 emission was highest<br />
when faeces of the high yielding cows were added in comparison with the other two<br />
faeces types (P < 0.05). The release of CO2-C from faeces was negatively correlated<br />
with the faecal microbial biomass C/N ratio (r = -0.69; P = 0.002) and positively with<br />
soil ergosterol (r = 0.78, P < 0.002). Addition of faeces to soil generally led to<br />
immobilisation of inorganic N, i.e. negative net N mineralisation. N immobilisation in
6. Effect of cattle faeces with different microbial biomass content on soil properties, gaseous<br />
emissions and plant growth 70<br />
soil was significantly highest when faeces of heifers were supplemented, compared with<br />
the faeces of the other two treatments. Faeces addition generally increased N2O<br />
emission rates. A clear increase of N2O emission occurred especially in the treatment<br />
with faeces of high yielding cows (Fig. 1). Total N2O emission was significantly<br />
correlated with faecal microbial biomass N (r = 0.58; P < 0.05, n = 24).<br />
Tabelle 12 (Table 4): Microbial indices, CO2 emissions and mineral nitrogen in different soil treatments after 14 days of incubation<br />
Table 4. Microbial indices, CO2 emissions and mineral nitrogen in different soil<br />
treatments after 14 days of incubation<br />
Microbial biomass Respiration<br />
C N Ergosterol CO2-C Nmin<br />
Soil treatment (µg g -1 soil)<br />
Heifer 227 ab 62 a 0.64 a 246 a -8.6 a<br />
Low yielding 261 a 71 a 0.71 a 262 a -5.5 b<br />
High yielding 234 ab 64 a 0.67 a 330 b -4.3 b<br />
Control 187 b 36 b 0.38 b 52 c 3.2 c<br />
CV (±%) 14 24 18 10 26<br />
CV = pooled coefficient of variation between feeding regimes (n = 6); different<br />
letters indicate a significant difference (Tukey/Kramer, P < 0.05).<br />
Abb. 9 (Fig. 1): N2O emissions from different soil treatments during 14 days of incubation at 22°C; bars indicate ± one standard error; n = 6.<br />
Fig. 1. N2O emissions from different soil treatments during 14 days of incubation at<br />
22°C; bars indicate ± one standard error; n = 6.
6. Effect of cattle faeces with different microbial biomass content on soil properties, gaseous<br />
emissions and plant growth 71<br />
In the pot experiment, inorganic N was immobilised in all treatments, lowest in the<br />
control and highest in the treatment with faeces of heifers. Consequently, highest rye<br />
grass yield and N uptake was found in the control treatment without addition of faeces,<br />
lowest in the treatment with faeces of heifers (Fig. 2). However, the differences in<br />
faecal composition revealed no significant differences in N immobilisation. Plant N<br />
uptake showed the closest linear relationship with the faecal NE and total N content (r =<br />
0.84 and 0.81, P < 0.001), followed by a negative relationship with the faecal microbial<br />
biomass C/N ratio (r = -0.76, P < 0.001). Also the faecal fungal C to bacterial C ratio<br />
showed a significant negative relationship with the plant N uptake.<br />
Fig. 2. Harvest of Italian ryegrass after growing for 62 days on different soil<br />
treatments. Plant dry weight per pot, plant nitrogen content and mineral<br />
nitrogen immobilised from the soil per pot; bars indicate ± one standard error;<br />
different letters indicate a significant difference (Tukey/Kramer, P < 0.05); n<br />
= 6.<br />
Abb. 10 (Fig. 2): Harvest of Italian ryegrass after growing for 62 days on different soil treatments. Plant dry weight<br />
er pot, plant nitrogen content and mineral nitrogen immobilised from the soil per pot; bars indicate ± one standard<br />
error; different letters indicate a significant difference (Tukey/Kramer, P < 0.05); n = 6.
6. Effect of cattle faeces with different microbial biomass content on soil properties, gaseous<br />
emissions and plant growth 72<br />
6.4. Discussion<br />
6.4.1. Microbial indices<br />
The concentrations of all microbial indices were in the middle of the range<br />
described by Jost et al. (2011) in differently fed dairy cows and heifers. The range of the<br />
data for microbial biomass C, N, and ergosterol obtained by these two studies was<br />
larger than that for the amino sugars muramic acid, glucosamine, galactosamine, and<br />
mannosamine. These differences between the studies are most likely due to differences<br />
in diet composition. An N balanced or protein rich diet, low in crude fibre, NDF and<br />
ADF generally supports faecal microbial and especially faecal bacterial biomass (van<br />
Vliet et al., 2007). This might also be the reason for the different contribution of<br />
microbial biomass C obtained by fumigation extraction to total microbial C, calculated<br />
on the basis of bacterial muramic acid and fungal glucosamine. According to Amelung<br />
(2001, 2008), as cell-wall components, amino sugars have the tendency to be<br />
accumulated in microbial residues, suggesting that roughly 50% of the faecal microbial<br />
C in the present study belong to the living fraction and the other 50% are within the<br />
remains of dead fungi and bacteria. Jost et al. (2011) reported that the living fraction<br />
contributed roughly 30%. It cannot be completely excluded that the low percentage was<br />
caused by the different sample treatments, shock-freezing in liquid N2 in the present<br />
study and slow freezing at -18 °C by Jost et al. (2011).<br />
In the highly dynamic situation of C and N supply in the gut, rapid microbial<br />
growth is probably similarly accompanied by concomitant microbial death. However,<br />
the differences between the microbial indices estimates by fumigation extraction and<br />
amino sugar analysis should not be stressed too much, because it is not known (1)<br />
whether the glucosamine and muramic acid concentrations are identical in living and<br />
dead microbial tissue or (2) whether the several conversion values for microbial<br />
biomass C by the fumigation extraction method and for microbial C by amino sugar<br />
analysis may lead to an underestimation of microbial biomass C (Jost et al., 2011). The<br />
comparison is even more complex as archaea contribute a significant percentage to the<br />
microbial biomass of cattle faeces. Gattinger et al. (2007) estimated that the archaeal<br />
phospholipid etherlipids added approximately 16% to the total phospholipid chain<br />
content in dairy cow manure. Archaea most likely add to the fraction of CHCl3 labile C.<br />
However, they do not contain muramic acid, but galactosamine, glucosamine, and a
6. Effect of cattle faeces with different microbial biomass content on soil properties, gaseous<br />
emissions and plant growth 73<br />
variety of other rare amino sugars such as N-acetyl-L-talosaminuronic acid (Kandler<br />
and König, 1998).<br />
6.4.2. Bacterial and fungal contribution to microbial tissue<br />
In the current study, the mean faecal concentration of ergosterol was 3.5 µg g -1<br />
DW. Klamer and Bååth (2004) obtained a factor of 190 when calculating the fungal<br />
biomass C from the ergosterol concentration in 11 compost fungi species. Taking this<br />
factor into account would result in a mean fungal biomass C content of 0.67 mg C g -1<br />
DM in the present faeces samples, leading to the suggestion that ergosterol containing<br />
fungi contributed a portion of 5% to total microbial biomass C, which is in the range<br />
obtained by Jost et al. (2011). However, this value is considerably below the value<br />
obtained by amino sugar analysis. Of the anaerobic fungal populations, yeasts contain<br />
high concentrations of ergosterol (Aguilera et al., 2006; Ahmad et al., 2010). In<br />
contrast, no ergosterol but high concentrations of cholesterol were measured in<br />
chytridiomycetes (Weete et al., 1989; Kagami et al., 2007). Information is still lacking<br />
on the ergosterol concentration of anaerobic fungal species found in the cattle rumen<br />
such as Anaeromyces, Orpinomyces, Caecomyces, or Piromyces (Griffith et al., 2009).<br />
On the other hand, amino sugar analysis, comprising all fungi, revealed a higher<br />
proportion of fungi in the current study. The fungal C to bacterial C ratio of 0.60 to 1.1<br />
observed corresponds to a fungal contribution of between 37% and 52% to microbial C.<br />
These percentages are similar or slightly above the values obtained by Jost et al. (2011)<br />
for heifers from the same farm. Chitin, the polymer of glucosamine, has been previously<br />
used as an indicator for fungal biomass in rumen fluid of cattle (Sekhavati et al., 2009)<br />
and in sheep faeces (Rezaeian et al., 2004a, b). The chitin concentration in sheep faeces<br />
was 10.2 mg g -1 DW (Rezaeian et al., 2004a). One reason for the markedly higher chitin<br />
concentration in comparison to the glucosamine concentration in the present study<br />
might be the differences in rumen and intestine physiology between sheep and cattle.<br />
However, Rezaeian et al. (2004a, 2006) used the colorimetric assay of Chen and<br />
Johnson (1983), which cannot distinguish between fungal glucosamine, bacterial<br />
glucosamine, and galactosamine. This may have led to an overestimation of fungal<br />
tissue.
6. Effect of cattle faeces with different microbial biomass content on soil properties, gaseous<br />
emissions and plant growth 74<br />
6.4.3. Effects of feeding regime and faeces composition<br />
Feeding regimes affected not only the chemical but also the microbial composition<br />
of cattle faeces. A diet low in N and high in ADF diet which was offered to heifers<br />
resulted in faeces dominated by fungi (calculated from fungal glucosamine). The faeces<br />
were low in microbial biomass C and N in combination with a wide microbial biomass<br />
C/N ratio and a high ergosterol concentration, especially in comparison with the diet of<br />
high lactating cows. This effect is common as a higher proportion of roughage in the<br />
feed promote fungal growth (Rezaeian et al., 2006) because fungi prefer C-rich cell wall<br />
material and need less N concentration in the substrate.<br />
Gaseous emissions from faeces added to soil were significantly influenced by the<br />
composition and characteristics of faeces. Release of CO2-C and N2O was highest in the<br />
soil amendment with faeces of high yielding cows, providing a higher amount of easy<br />
available C and N substrates than the other faeces. This is known to increase gaseous<br />
emissions (Flessa et al., 2002a; Arriaga et al., 2010).<br />
Added to soil, the faeces of heifers, characterised by low N and high fibre content,<br />
led to a stronger N-immobilisation than the other treatments. An increased microbial<br />
biomass C/N ratio in combination with an increased fungal C to bacterial C ratio<br />
indicates that the shift in the microbial community structure towards fungi had a<br />
depressive effect on the N storage of faecal microorganisms, i.e. less N is incorporated<br />
into microbial components. In soil, an increasing microbial biomass C/N ratio together<br />
with an increasing fungal biomass has not often been found (Heinze et al., 2010;<br />
Joergensen et al., 2010).<br />
The N immobilisation found in this study has been repeatedly observed after direct<br />
application of cattle faeces to soil (Griffin et al., 2005; Cusick et al., 2006; Peters and<br />
Jensen, 2011). This was to be expected, as its C/N ratio of 28 was somewhat above the<br />
threshold of 25, indicating restricted N availability to soil microorganisms (Powlson et<br />
al., 2001). However, the strong N immobilisation in the faeces of high yielding cows is<br />
surprising, considering the fact that the C/N ratio was far below 20, where an N release<br />
to the soil solution usually occurrs (Janssen, 1996; Seneviratne, 2000; Peters and<br />
Jensen, 2011). In contrast to the N-free faecal organic C fraction, the faecal organic N<br />
fractions seem hardly to be available to soil microorganisms, caused by the strong<br />
microbial decomposition during gut passage. Nevertheless, solid-state cross polarisation<br />
15 N nuclear magnetic resonance spectroscopy and Curie-point pyrolysis–gas
6. Effect of cattle faeces with different microbial biomass content on soil properties, gaseous<br />
emissions and plant growth 75<br />
chromatography/mass spectrometry also failed to give clear further information on the<br />
chemical reasons for the poor availability of faecal organic N to soil microorganisms<br />
and consequently to plants (Bosshard et al., 2011). The authors assumed that some N<br />
compounds present in plants were not digested in the gut, and that also some excreted<br />
recalcitrant N compounds were de novo synthesized by gut microorganisms. An N<br />
fixation capacity like in the present cattle faeces has been observed for highly<br />
decomposed sugarcane filter pressmud, which led to N immobilisation even at an initial<br />
C/N ratio of 12 (Rasul et al., 2008). In the long-term, N from immobilising faeces was<br />
also released by the microbial decomposition processes into the soil solution (Morvan<br />
and Nicolardot, 2009; Peters and Jensen, 2011) and taken up by plants (Chadwick et al.,<br />
2000).<br />
N uptake by rye grass increased with faecal N concentration and decreased with<br />
higher faecal crude fibre content. Plant N uptake decreased also with a higher fungal C<br />
to bacterial C ratio and a higher microbial biomass C/N ratio. A negative relationship<br />
between diet composition, faecal N concentration and N mineralisation has been<br />
repeatedly observed for sheep faeces (Kyvsgaard et al., 2000), but also cattle faeces<br />
(Sørensen et al., 2003; Wu and Powell, 2007; Morvan and Nicolardot, 2009). However,<br />
none of these investigations considered the microbial quality of faeces. A rare and<br />
interesting exception was the study of van Vliet et al. (2007), which was focussed on<br />
faecal bacteria. Nevertheless, closer relationships have been observed between plant N<br />
uptake and faecal microbial properties than of plant N uptake and soil microbial<br />
properties. The microbial biomass C/N ratio and the fungal C to bacterial C ratio in<br />
cattle faeces had a strong negative impact on plant N uptake. Highest CO2 evolution and<br />
lowest N immobilisation suggest a stronger turnover of the microbial biomass in the<br />
faeces treatment with high N and NE concentration and low ADF concentration. The<br />
increased microbial turnover might be the reason why the increase in microbial biomass<br />
did not consistently differ between the three faeces types. The relationships between<br />
faecal and soil processes might be masked by the autochthonous microbial community.<br />
The use of 13 C and 15 N labelled cattle faeces would make it possible to test these<br />
assumptions using an identical approach to that presented in this study (Sørensen and<br />
Jensen, 1998; Jensen et al., 1999; Bosshard et al, 2011; Wachendorf and Joergensen,<br />
2011). Hence, it would be possible to investigate wether microbially incorporated C or<br />
N derive from faeces or soil.
6. Effect of cattle faeces with different microbial biomass content on soil properties, gaseous<br />
emissions and plant growth 76<br />
6.4.4. Conclusions<br />
This study showed that a feeding regime low in protein and high in fibre content<br />
resulted in less microbial, but higher fungal biomass. Gaseous emissions from faeces<br />
added to soil were significantly influenced by the composition and characteristics of<br />
faeces, but also by the faecal microbial indices. Composition of faeces showed a clear<br />
impact on N-mineralisation in soil and consequently the N supply to plants, faecal<br />
microbial properties revealing closer relationships to plant N uptake than soil microbial<br />
properties. This is a factor which is not taken into account frequently. The considerable<br />
impact of faeces derived microorganisms on emission potential and plant growth in this<br />
study requires further investigations. Besides, the addition of faeces from heifers with a<br />
high C/N ratio and a microbial community dominated by fungi may contribute to the<br />
soil N supply in the longer run, which should also be considered. Continuative studies<br />
will help to identify the best management practices to reduce gaseous emissions and<br />
will also allow farmers to develop good practices for efficient nutrient use.<br />
Acknowledgments<br />
The skilful technical assistance of Gabriele Dormann and Christiane Jatsch is<br />
highly appreciated. This project was supported by a grant of the Research Training<br />
Group 1397 “Regulation of soil organic matter and nutrient turnover in organic<br />
agriculture” of the German Research Foundation (DFG).<br />
6.5. References<br />
Aguilera, F., Peinado, R.A., Millán, C., Ortega, J.M., Mauricio, J.C., 2006. Relationship<br />
between ethanol tolerance, H + -ATPase activity and the lipid composition of the<br />
plasma membrane in different wine yeast strains. Int. J. Food Microbiol. 110, 34–<br />
42.<br />
Ahmad, A., Khan, A., Manzoor, N., Khan, L.A., 2010. Evolution of ergosterol<br />
biosynthesis inhibitors as fungicidal against Candida. Microb. Pathog. 48, 35–41.<br />
Amelung, W., 2001. Methods using amino sugars as markers for microbial residues in<br />
soil. In: Lal, J.M., Follett, R.F., Stewart, B.A. (Eds.), Assessment Methods for Soil<br />
Carbon. Lewis Publishers, Boca Raton, pp. 233-272.
6. Effect of cattle faeces with different microbial biomass content on soil properties, gaseous<br />
emissions and plant growth 77<br />
Amelung, W., Brodowski, S., Sandhage-Hofmann, A., Bol, R., 2008. Combining<br />
biomarker with stable isotope analyses for assessing the transformation and turnover<br />
of soil organic matter. Adv. Agron. 100, 155-250.<br />
Appuhn, A., Joergensen, R.G., 2006. Microbial colonisation of roots as a function of<br />
plant species. Soil Biol. Biochem. 38, 1040–1051.<br />
Arriaga, H., Salcedo, G., Calsamiglia, S., Merino, P., 2010. Effect of diet manipulation<br />
in dairy cow N balance and nitrogen oxides emissions from grasslands in northern<br />
Spain. Agric. Ecosyst. Environ. 135, 132-139.<br />
Bååth, E., Anderson, T.H., 2003. Comparison of soil fungal/bacterial ratios in a pH<br />
gradient using physiological and PLFA-based techniques. Soil Biol. Biochem. 35,<br />
955-963.<br />
Bosshard, C., Oberson, A., Leinweber, P., Jandl, G., Knicker, H., Wettstein, H.-R.,<br />
Kreuzer, M., Frossard, E., 2011. Characterization of fecal nitrogen forms produced<br />
by a sheep fed with 15 N labeled ryegrass. Nutr. Cycl. Agroecosyst. 90, 355-368.<br />
Brookes, P.C., Landman, A., Pruden, G., Jenkinson, D.S., 1985. Chloroform fumigation<br />
and the release of soil nitrogen: a rapid direct extraction method for measuring<br />
microbial biomass nitrogen in soil. Soil Biol. Biochem. 17, 837-842.<br />
Chadwick, D.R., John, F., Pain, B.F., Chambers, B., Williams, J., 2000. Plant uptake of<br />
nitrogen from the organic nitrogen fraction of animal manures: a laboratory<br />
experiment. J. Agr. Sci. 134, 159–168.<br />
Chen, G.C., Johnson, B.R., 1983. Improved colorimetric determination of cell wall<br />
chitin in wood decay fungi. Appl. Environ. Microbiol. 46, 13–16.<br />
Cusick, P.R., Powell, J.M., Kelling, K.A., Hensler, R.F., Muňoz, G.R., 2006. Dairy<br />
manure N mineralization estimates from incubations and litterbags. Biol. Fertil.<br />
Soils 43, 145–152.<br />
Delve, R.J., Cadisch, G., Tanner, J.C., Thorpe, W., Thorne, P.J., Giller, K.E., 2001.<br />
Implications of livestock feeding management on soil fertility in the smallholder<br />
farming systems of sub-Saharan Africa. Agric. Ecosyst. Environ. 84, 227–243.<br />
Djajakirana, G., Joergensen, R., Meyer, B., 1996. Ergosterol and microbial biomass<br />
relationship in soil. Biol. Fertil. Soils 22, 299–304.<br />
Engelking, B., Flessa, H., Joergensen, R.G., 2007. Shifts in amino sugar and ergosterol<br />
contents after addition of sucrose and cellulose to soil. Soil Biol. Biochem. 39,<br />
2111-2118.
6. Effect of cattle faeces with different microbial biomass content on soil properties, gaseous<br />
emissions and plant growth 78<br />
Flessa, H., Ruser, R., Dörsch, P., Kamp, T., Jimenez, M.A., Munch, J.C., Beese, F.,<br />
2002a. Integrated evaluation of greenhouse gas emissions (CO2, CH4, N2O) from<br />
two farming systems in southern Germany. Agric. Ecosyst. Environ. 91, 175-189.<br />
Flessa, H., Potthoff, M., Loftfield, N., 2002b. Laboratory estimates of CO2 and N2O<br />
emissions following surface application of grass mulch: importance of indigenous<br />
microflora of mulch. Soil Biol. Biochem. 34, 875–879.<br />
Frostegård, A., Petersen, S.O., Bååth, E., Nielsen, T.H., 1997. Dynamics of a microbial<br />
community associated with manure hot spots as revealed by phospholipid fatty acid<br />
analyses. Appl. Environ. Microbiol. 63, 2224–2231.<br />
Gattinger, A., Höfle, M.G., Schloter, M., Embacher, A., Böhme, F., Munch, J.C.,<br />
Labrenz, M., 2007. Traditional cattle manure application determines abundance,<br />
diversity and activity of methanogenic archaea in arable European soil. Environ.<br />
Microbiol. 9, 612–624.<br />
Griffin, T.S., He, Z., Honeycutt, C.W., 2005. Manure composition affects net<br />
transformation of nitrogen from dairy manures. Plant Soil 273, 29-38.<br />
Griffith, G.W., Ozkose, E., Theodorou, M.K., Davies, D.R., 2009. Diversity of anaerobic<br />
fungal populations in cattle revealed by selective enrichment culture using different<br />
carbon sources. Fungal Ecol. 2, 87-97.<br />
Handayanta, E., Cadisch, G., Giller, K.E., 1997. Regulating N mineralization from plant<br />
residues by manipulation of quality. In: Cadisch, G., Giller, K.E. (Eds.), Driven by<br />
Nature - Plant Litter Quality and Decomposition. CAB International, Wallingford,<br />
UK, pp. 175–186.<br />
Heinze, S., Raupp, J., Joergensen, R.G., 2010. Effects of fertilizer and spatial<br />
heterogeneity in soil pH on microbial biomass indices in a long-term field trial of<br />
organic agriculture. Plant Soil 328, 203–215.<br />
Ikpe, F.N., Ndegwe, N.A., Gbaraneh, L.D., Torunana, J.M.A., Williams, T.O., Larbi, A.,<br />
2003. Effects of sheep browse diet on fecal matter decomposition and N and P<br />
cycling in the humid lowlands of West Africa. Soil Sci. 168, 646-659.<br />
Indorf, C., Dyckmans, J., Khan, K.S., Joergensen, R.G., 2011. Optimisation of amino<br />
sugar quantification by HPLC in soil and plant hydrolysates. Biol. Fertil. Soils 47,<br />
387–396.<br />
Janssen, B.H., 1996. Nitrogen mineralization in relation to C:N ratio and<br />
decomposability of organic materials. Plant and Soil 181, 39–45.
6. Effect of cattle faeces with different microbial biomass content on soil properties, gaseous<br />
emissions and plant growth 79<br />
Jensen, B., Sørensen, P., Thomsen, I.K., Jensen, E.S., Christensen, B.T., 1999.<br />
Availability of nitrogen in 15 N-labeled ruminant manure components to successively<br />
grown crops. Soil Sci. Soc. Am. J. 63, 416-423.<br />
Joergensen, R.G., 1996. Quantification of the microbial biomass by determining<br />
ninhydrin-reactive N. Soil Biol. Biochem. 28, 301–306.<br />
Joergensen, R.G., Mueller, T., 1996. The fumigation-extraction method to estimate soil<br />
microbial biomass: calibration of the kEN value. Soil Biol. Biochem. 28, 33-37.<br />
Joergensen, R.G., Mäder, P., Fließbach, A., 2010. Long-term effects of organic farming<br />
on fungal and bacterial residues in relation to microbial energy metabolism. Biol.<br />
Fertil. Soils 46, 303-307.<br />
Jost, D.I., Indorf, C., Joergensen, R.G., Sundrum, A., 2011. Determination of microbial<br />
biomass and fungal and bacterial distribution in cattle faeces. Soil Biology and<br />
Biochemistry 43, 1237–1244.<br />
Kagami, M., <strong>von</strong> Elert, E., Ibelings, B.W., De Bruin, A., Van Donk, E., 2007. The<br />
parasitic chytrid, Zygorhizidium, facilitates the growth of the cladoceran<br />
zooplankter, Daphnia, in cultures of the inedible alga, Asterionella. Proc. Royal<br />
Soc. B: Biol. Sci. 274, 1561-1566.<br />
Kandler, O., König, H., 1998. Cell wall polymers in Archaea (Archaebacteria). Cell.<br />
Mol. Life Sci. 54, 305–308.<br />
Klamer, M., Bååth, E., 2004. Estimation of conversion factors for fungal biomass<br />
determination in compost using ergosterol and PLFA 18:2ω6,9. Soil Biol. Biochem.<br />
36, 57–65.<br />
Kyvsgaard, P., Sørensen, P., Møller, E., Magid, J., 2000. Nitrogen mineralization from<br />
sheep faeces can be predicted from the apparent digestibility of the feed. Nutr. Cycl.<br />
Agroecosyst. 57, 207–214.<br />
Merino, P., Arriaga, H., Salcedo, G., Pinto, M., Calsamiglia, S. 2008. Dietary<br />
modification in dairy cattle: field measurements to assess the effect on ammonia<br />
emissions in the Basque country. Agric. Ecosyst. Environ. 123, 88–94.<br />
Morvan, T., Nicolardot, B., 2009. Role of organic fractions on C decomposition and N<br />
mineralization of animal wastes in soil. Biol. Fertil. Soils 45, 477-486.<br />
Newell, S.Y., 1992. Estimating fungal biomass and productivity in decomposing litter.<br />
In: Carroll, G.C., Wicklow, D.T. (Eds.), The Fungal Community. Its Organization<br />
and Role in the Ecosystem, 2nd Edition. Marcel Dekker, New York. pp. 521-561.
6. Effect of cattle faeces with different microbial biomass content on soil properties, gaseous<br />
emissions and plant growth 80<br />
Park, J.-W., Lee, W.-S., Bang, W.-G., 1990. The production of ergosterol by<br />
Saccharomyces sake. KBA No. 6. J. Korean Agric. Chem. Soc. 33, 87-92.<br />
Peters, K., Jensen, L.S., 2011. Biochemical characteristics of solid fractions from animal<br />
slurry separation and their effects on C and N mineralisation in soil. Biol. Fertil.<br />
Soils 47, 447-455.<br />
Powell, J.M., Grabber, J.H., 2009. Dietary forage impacts on dairy slurry nitrogen<br />
availability to corn. Agron. J. 101, 747-753.<br />
Powlson, D.S., Hirsch, P.R., Brookes, P.C., 2001. The role of soil microorganisms in<br />
soil organic matter conservation in the tropics. Nutrient Cycling in Agroecosystems<br />
61, 41–51.<br />
Quintern, M., Lein, M., Joergensen, R.G., 2006. Changes in soil biological quality<br />
indices after long-term addition of shredded shrubs and biogenic waste compost. J.<br />
Plant Nutr. Soil Sci. 169, 488-493<br />
Rasul, G., Khan, K.S., Müller, T., Joergensen, R.G., 2008. Soil-microbial response to<br />
sugarcane filter cake and biogenic waste compost. J. Plant Nutr. Soil Sci. 181, 355–<br />
360.<br />
Reijs, J.W., Sonneveld, M.P.W., Sørensen, P., Schils, R.L.M., Groot, J.C.J., Lantinga,<br />
E.A., 2007. Effects of different diets on utilization of nitrogen from cattle slurry<br />
applied to grassland on a sandy soil in The Netherlands. Agric., Ecosyst. Environ.<br />
118, 65-79.<br />
Rezaeian, M., Beakes, G.W., Parker, D.S., 2004a. Distribution and estimation of<br />
anaerobic zoosporic fungi along the digestive tracts of sheep. Mycol. Res. 108,<br />
1227–1233.<br />
Rezaeian, M., Beakes, G.W., Parker, D.S., 2004b. Methods for the isolation, culture and<br />
assessment of the status of anaerobic rumen chytrids in both in vitro and in vivo<br />
systems. Mycol. Res. 108, 1215–1226.<br />
Rezaeian, M., Beakes, G.W., Chaudhry, A.S., 2006. Effect of feeding chopped and<br />
pelleted lucerne on rumen fungal mass, fermentation profiles and in sacco<br />
degradation of barley straw in sheep. Anim. Feed Sci. Technol. 128, 292–306.<br />
Sekhavati, M.H., Mesgaran, M.D., Nassiri, M.R., Mohammadabadi, T., Rezaii, F.,<br />
Maleki, A.F., 2009. Development and use of quantitative competitive PCR assays<br />
for relative quantifying rumen anaerobic fungal populations in both in vitro and in<br />
vivo systems. Mycol. Res. 113, 1146–1153.
6. Effect of cattle faeces with different microbial biomass content on soil properties, gaseous<br />
emissions and plant growth 81<br />
Seneviratne, G., 2000. Litter quality and nitrogen release in tropical agriculture: a<br />
synthesis. Biol. Fertil. Soils 31, 60–64.<br />
Sørensen, P., Jensen, E.S., 1998. The use of 15 N labelling to study the turnover and<br />
utilization of ruminant manure N. Biol. Fertil. Soils 28, 56–63.<br />
Sørensen, P., Weisbjerg, M.R., Lund, P., 2003. Dietary effects on the composition and<br />
plant utilization of nitrogen in dairy cattle manure. J. Agric. Sci. 141, 79–91.<br />
Sundrum, A., E. Schlecht, R. G. Joergensen (2011): Fractions of nitrogen and carbon in<br />
feces of lactating dairy cows and their variability on dairy farms. J. Dairy Sci.<br />
(accepted).<br />
van der Stelt, B., van Vliet, P.C.J., Reijs, J.W., Temminghoff, E.J.M., Van Riemsdijk,<br />
W.H. 2008. Effects of dietary protein and energy levels on cow manure excretion<br />
and ammonia volatilisation. J. Dairy Sci. 91, 4811-4821.<br />
van Vliet, P.C.J., Reijs, J.W., Bloem, J., Dijkstra, J., de Goede, R.G.M., 2007. Effects of<br />
cow diet on the microbial community and organic matter and nitrogen <strong>von</strong>tent of<br />
feces. J. Dairy Sci. 90, 5146–5158.<br />
Vance, E., Brookes, P., Jenkinson, D., 1987. An extraction method for measuring soil<br />
microbial biomass C. Soil Biol. Biochem. 19, 703–707.<br />
Wachendorf, C., Joergensen, R.G., 2011. Mid-term tracing of 15 N derived from urine<br />
and dung in soil microbial biomass. Biol. Fertil. Soils 47, 147-155.<br />
Weete, J.D., Weber, D.J., 1980. Lipid Biochemistry of Fungi and other Organisms.<br />
Plenum Press, New York.<br />
Weete, J.D., Fuller, M.S., Huang, M.Q., Gandhi, S., 1989. Fatty acids and sterols of<br />
selected hyphochytriomycetes and chytridiomycetes. Exp. Mycol. 13, 183–195.<br />
Wu, J., Joergensen, R.G., Pommerening, B., Chaussod, R., Brookes, P.C., 1990.<br />
Measurement of soil microbial biomass C by fumigation-extraction-an automated<br />
procedure. Soil Biol. Biochem. 22, 1167–1169.<br />
Wu, Z., Powell, J.M., 2007. Dairy manure type, application rate, and frequency impact<br />
plants and soils. Soil Sci. Soc. Am. J. 71, 1306-1313.<br />
Zelles, L., Hund, K., Stepper, K., 1987. Methoden zur relativen Quantifizierung der<br />
pilzlichen Biomasse im Boden. J. Plant Nutr. Soil Sci. 150, 249–252.
7. Zusammenfassung 82<br />
7. Zusammenfassung<br />
Um die Nährstoffeffizienz im Boden zu erhöhen und klimarelevante Gasemissionen<br />
zu minimieren, sind quantitative Informationen zu den C- und N-Fraktionen im Kot<br />
sowie deren Mineralisierungspotential nötig. Da über die Hälfte des fäkalen N<br />
mikrobiell gebunden ist, sind Methoden zur Bestimmung der <strong>mikrobielle</strong>n Kotqualität<br />
hilfreich.<br />
Ziele der ersten Publikation waren die Anwendung der CFE-Methode zur<br />
Bestimmung der <strong>mikrobielle</strong>n Biomasse in <strong>Rinderkot</strong>, Ergosterolbestimmung als<br />
Marker für die pilzliche Biomasse und Aminozuckernachweis zur Analyse der<br />
<strong>mikrobielle</strong>n Gemeinschaftsstruktur (pilzliches Glucosamin und bakterielle Muramin-<br />
säure). Mit Hilfe der CFE-Methode sollten lebende Mikroorganismen im Kot, inklusive<br />
Bakterien, Pilze und Archaeen, erfasst werden. Verschiedene Extraktionsmittel wurden<br />
für diese Methode getestet, um stabile Extrakte und reproduzierbare <strong>mikrobielle</strong><br />
Biomasse-C- und -N-Gehalte zu erhalten. Der Einsatz <strong>von</strong> 0.05 M CuSO4 als<br />
Extraktionsmittel löste vorherige Probleme mit der Extraktion CHCl3-labiler N-<br />
Komponenten und sorgte für stabile Kotextrakte. Die Methoden wurden in einem<br />
Kotinkubationsexperiment bei 25 °C verglichen. Mikrobielle Parameter zeigten<br />
dynamische Charakteristika und mögliche Verschiebungen innerhalb der <strong>mikrobielle</strong>n<br />
Gemeinschaft. Im Kot <strong>von</strong> Färsen betrug das mittlere C/N-Verhältnis 5,6 und der<br />
mittlere Cmik/Corg-Quotient 2,2%, das Verhältnis <strong>von</strong> Ergosterol zum <strong>mikrobielle</strong>n<br />
Biomasse-C war 1,1‰. Ergosterol und Aminozuckeranalyse ergaben einen<br />
signifikanten Pilzanteil <strong>von</strong> über 40% des <strong>mikrobielle</strong>n Gesamt-C. Für die Analyse<br />
<strong>mikrobielle</strong>r Parameter in <strong>Rinderkot</strong> erwiesen sich alle getesteten Methoden als<br />
geeignet. Diese wurden für die folgenden Fütterungsversuche weiter unabhängig<br />
<strong>von</strong>einander angewendet und verglichen.<br />
Die zweite Publikation verglich eine N-defizitäre (ND) und eine ausgeglichene N-<br />
Bilanz (NB) bei der Fütterung <strong>von</strong> Milchkühen unter Berücksichtigung der Kot-<br />
inhaltsstoffe, der <strong>mikrobielle</strong>n Parameter und der Verdaulichkeit. Unterschiede<br />
zwischen Individuen und Probennahmetagen wurden ebenfalls miteinbezogen. Mittlerer<br />
<strong>mikrobielle</strong>r Biomasse-C- und -N-Gehalt war 37 bzw. 4,9 mg g -1 TM. Der Pilzanteil lag<br />
diesmal bei 25% des <strong>mikrobielle</strong>n Gesamt-C. Die Fütterung zeigte signifikante Effekte<br />
auf die Kotzusammensetzung. Das fäkale C/N-Verhältnis der NB-Fütterung war
7. Zusammenfassung 83<br />
signifikant niedriger als bei ND. Gleiches gilt für das C/N-Verhältnis der <strong>mikrobielle</strong>n<br />
Biomasse mit jeweils 9.1 und 7.0 für ND und NB. Auch die Verdaulichkeit wurde durch<br />
die Fütterung beeinflusst. Unverdauter Futterstickstoff, Faserstoffe (NDF) und Hemi-<br />
cellulose waren in der ND-Behandlung signifikant erhöht. Einige Parameter zeigten nur<br />
einen Einfluss der Probennahmetage, mit den angewendeten Methoden gelang jedoch<br />
der eindeutige Nachweis der Fütterungseffekte auf <strong>mikrobielle</strong> Parameter im <strong>Rinderkot</strong>,<br />
wobei sich die Fütterung in nur einer Variable unterschied.<br />
Weitere Fütterungseinflüsse auf die Kotqualität wurden schließlich auch für Rinder<br />
unterschiedlicher Leistungsstufen erforscht. Hier waren die Unterschiede in der<br />
Fütterung wesentlich größer als in den vorhergehenden Experimenten. Der Kot <strong>von</strong><br />
Färsen, Niederleistungs- und Hochleistungskühen sowie dessen Einfluss auf N2O-<br />
Emissionen, N-Mineralisierung und pflanzliche N-Aufnahme wurden untersucht. Die<br />
Färsenfütterung mit geringem N- und hohem ADF-Anteil führte zu pilzdominiertem<br />
Kot. Besonders im Vergleich zum Kot der Hochleistungskühe war der Gehalt an<br />
<strong>mikrobielle</strong>m Biomasse-C niedrig, in Verbindung mit einem breiten <strong>mikrobielle</strong>n C/N-<br />
Verhältnis und hohem Ergosterolgehalt. Eingemischt in Boden zeigte Färsenkot die<br />
niedrigste CO2-Produktion und höchste N-Immobilisierung sowie niedrigste N2O-<br />
Emissionen während einer 14-tägigen Inkubation bei 22 °C.<br />
In einem 62-Tage-Gefäßversuch mit Welschem Weidelgras waren der Trocken-<br />
masseertrag und die pflanzliche Stickstoffaufnahme in den Färsenbehandlungen am<br />
niedrigsten. Die Stickstoffaufnahme durch die Pflanzen korrelierte positiv mit der<br />
Stickstoffkonzentration im Kot und negativ mit dem Rohfasergehalt, aber auch negativ<br />
mit dem C/N-Verhältnis der <strong>mikrobielle</strong>n Biomasse und dem Verhältnis <strong>von</strong> pilzlichem<br />
zu bakteriellem C. Mikrobielle Parameter im Kot zeigten einen größeren Zusammen-<br />
hang mit der pflanzlichen Stickstoffaufnahme als die <strong>mikrobielle</strong>n Bodenparameter.
8. Summary 84<br />
8. Summary<br />
As an important component of organic fertilizers, animal faeces require methods for<br />
determining diet effects on their microbial quality to improve nutrient use efficiency in<br />
soil and to decrease gaseous greenhouse emissions to the environment. Since more than<br />
half of the faecal nitrogen originates from microbial N, a knowledge of the microbial<br />
biomass content in livestock faeces is useful. The objectives of the first study were to<br />
apply the chloroform fumigation extraction (CFE) method for determining microbial<br />
biomass in cattle faeces, to determine the fungal cell-membrane component ergosterol,<br />
and to measure the cell-wall components fungal glucosamine and bacterial muramic<br />
acid as indices for the microbial community structure. The CFE method should detect<br />
living organisms, including bacteria, fungi and achaea. A variety of extractant solutions<br />
were tested for the CFE method to obtain stable extracts and reproducible microbial<br />
biomass C and N values. Application of 0.05 M CuSO4 as extractant solved previous<br />
problems with the extraction of CHCl3 labile N components and provided stable faeces<br />
extracts. The methods were compared in a 28-day cattle faeces incubation study at 25<br />
°C. Here, the microbial biomass indices showed dynamic characteristics and possible<br />
shifts in the microbial community. In faeces of five heifers, the mean microbial biomass<br />
C/N ratio was 5.6, the mean microbial biomass to organic C ratio was 2.2%, and the<br />
mean ergosterol to microbial biomass C ratio was 1.1‰. Ergosterol and amino sugar<br />
analysis revealed a significant contribution of fungi, with a percentage of more than<br />
40% of the total microbial C. All methods applied are expected to be suitable tools for<br />
analysing the microbial quality of cattle faeces. They were adopted independently and<br />
further compared for the following feeding experiments.<br />
In the second publication, an N deficient (ND) and an N balanced diet (NB) were<br />
compared with respect to the impacts on faecal composition, microbial indices and<br />
digestibility. Differences between individuals and sampling days were also considered.<br />
The mean values of microbial biomass C and N concentrations averaged around 37 and<br />
4.9 mg g-1 DM, respectively. Ergosterol, together with fungal glucosamine and<br />
bacterial muramic acid, revealed a contribution of fungi in dairy cattle faeces of 25%<br />
fungal C as a percentage of total microbial C. Changes in ruminal N supply showed<br />
significant effects on faecal composition. Faecal C/N ratio of the NB treatment was<br />
significantly lower than in ND. The same applies for the mean microbial biomass C/N
8. Summary 85<br />
ratio, which differed significantly, at 9.1 and 7.0 for ND and NB, respectively.<br />
Digestibility was also significantly affected by the feeding regime. Undigested dietary<br />
N, fibre fractions (NDF) and hemicellulose were significantly higher in ND compared<br />
with the NB treatment. There were parameters showing only an effect of the sampling<br />
days. However, with the methods applied, clear feeding effects on microbial parameters<br />
in cattle faeces were confirmed.<br />
Further feeding effects on fecal quality were investigated for cattle of different<br />
performance levels. A study was carried out to investigate first the effects of different<br />
diets for heifers, low and high lactation cows on their faeces and subsequently the<br />
effects of these different cattle faeces types on N2O emissions, N mineralisation and<br />
plant N uptake. A low N and high ADF diet given to heifers resulted in a faeces<br />
dominated by fungi, which was low in microbial biomass C in combination with a wide<br />
microbial biomass C/N ratio and a high ergosterol concentration, especially in<br />
comparison with the diet of high lactating cows. Added to soil, heifer faeces led to the<br />
lowest microbial CO2 production and strongest N immobilisation but also to lowest N2O<br />
emissions during a 14-day incubation at 22 °C. Also, the rye grass yield and plant N<br />
uptake was lowest in the soil amend with heifer faeces in a 62-day pot experiment. N<br />
uptake by rye grass correlated positively with the faecal N concentration and negatively<br />
with its crude fibre concentration, but also negatively with the microbial biomass C/N<br />
ratio and the fungal C to bacterial C ratio. Faecal microbial properties revealed closer<br />
relationships to plant N uptake than soil microbial properties.
9. Schlussfolgerung und Ausblick 86<br />
9. Schlussfolgerung und Ausblick<br />
Die CFE-Methode eignet sich zur Bestimmung des <strong>mikrobielle</strong>n Biomasse-C und -<br />
N in <strong>Rinderkot</strong>. Hierbei bietet sie den Vorteil, nur lebende Mikroorganismen<br />
nachzuweisen, wobei neben Bakterien und Pilzen auch die Archeenbiomasse erfasst<br />
wird. In Kombination mit pilzlichem Ergosterol deutet die CFE-Methode auf<br />
Verschiebungen innerhalb der <strong>mikrobielle</strong>n Gemeinschaftsstruktur im <strong>Rinderkot</strong><br />
während des Alterungsprozesses. Ergosterol und Aminozuckeranalyse ergaben einen<br />
Pilzanteil <strong>von</strong> über 40% des <strong>mikrobielle</strong>n Gesamtkohlenstoffs in Färsenkot. Im<br />
Methodenvergleich zeigten die CFE-Methode und Aminozuckeranalyse ähnliche<br />
Ergebnisse, obwohl pilzliches Glucosamin und bakterielle Muraminsäure auf einen<br />
hohen Anteil toter Mikroorganismen im Kot hinwiesen. Der <strong>mikrobielle</strong> Biomasseanteil<br />
konnte jedoch durch Kotkonservierung in flüssigem Stickstoff erhöht werden.<br />
Mit guter Wiederholbarkeit der Methoden auch bei verschiedenen Fütterungen oder<br />
Leistungsstufen eignen sich die angewendeten Methoden auch im Bereich der<br />
Tierernährung und Tiergesundheit, um das <strong>mikrobielle</strong> Verhalten im Kot oder anderem<br />
Darminhalt zu verfolgen. Besonders Ergosterol und Aminozuckeranalyse gaben<br />
Hinweise auf das Bakterien-Pilzverhältnis und damit auf deren möglicher Beteiligung<br />
an der Verdauung. Ein Stickstoffmangel im Futter bewirkte ein höheres <strong>mikrobielle</strong>s<br />
Biomasse-C/N-Verhältnis und eine geringere Verdauung <strong>von</strong> Faseranteilen. Die<br />
Bestimmung <strong>mikrobielle</strong>r Parameter lieferte nützliche Informationen über Fütterungs-<br />
effekte auf die <strong>Rinderkot</strong>beschaffenheit und deren Düngungspotential. Die Variabilität<br />
der Kotzusammensetzung zwischen Individuen und Probennahmetagen muss hierbei<br />
statistisch berücksichtigt werden.<br />
Nährstoffverluste durch Gasemissionen aus dem Boden nach Kotzugabe wurden<br />
stark durch das Futter beeinflusst. Kot <strong>von</strong> Hochleistungsmilchkühen mit einem hohen<br />
Kraftfutteranteil im Futter zeigte die höchsten CO2-C und N2O-Emissionen. <strong>Rinderkot</strong>-<br />
zugabe kann im Boden zu N-Immobilisierung führen, die bei einem hohen Faser- und<br />
niedrigen Stickstoffanteil im Futter der Färsen am stärksten ausgeprägt war. Die fäkale<br />
N-Aufnahme durch Pflanzen wurde besonders durch den N-Gehalt im Futter<br />
beeinflusst. Im Gefäßversuch zeigte sich eine vermehrte Aufnahme bei hoher N-Zufuhr,<br />
während ein höherer fäkaler Faseranteil die N-Aufnahme der Pflanzen erniedrigte. Das<br />
Verhältnis <strong>von</strong> Bakterien und Pilzen sowie das des <strong>mikrobielle</strong>n Biomasse-C und -N
9. Schlussfolgerung und Ausblick 87<br />
zeigte ebenfalls eine negative Korrelation mit Pflanzen-N. Hoher Faser- und niedriger<br />
N-Gehalt im Futter führten zu einem Anstieg des Pilzanteils im Kot. Der Zusammen-<br />
hang zwischen pflanzlicher N-Aufnahme und <strong>mikrobielle</strong>n Parametern im Kot war<br />
größer als mit denen im Boden. Die angewandten Methoden eignen sich deshalb für die<br />
Analyse <strong>von</strong> Fütterungseffekten auf <strong>mikrobielle</strong> Parameter in <strong>Rinderkot</strong> sowie deren<br />
Verhalten im Boden. Das Forschungsprojekt sollte mit 15 N- and 13 C-markiertem Kot<br />
fortgesetzt zu werden, um die genauen Nährstoffquellen für Mikroorganismen und<br />
Pflanzen herauszufinden (Sørensen and Jensen, 1998; Jensen et al., 1999; Bosshard et<br />
al, 2011; Wachendorf and Joergensen, 2011).<br />
Die luminometrische Bestimmung des ATP-Gehaltes bleibt viel versprechend.<br />
Durch Vorinkubation der Extrakte nach Enzymzugabe wurde inzwischen eine<br />
Messwertstabilität erreicht, die nur noch geringe Abweichungen zeigt. Die Methode<br />
sollte mit dem letzten Versuchsansatz nach Redmile-Gordon (2011) und mit in<br />
Stickstoff konservierten Proben fortgesetzt werden. Für weitere Versuche mit <strong>Rinderkot</strong><br />
ist außerdem eine Konservierung in Flüssigstickstoff ratsam.
10. Literatur 88<br />
10. Literatur<br />
Amelung, W., 2001. Methods using amino sugars as markers for microbial residues in<br />
soil. In: Lal, J.M., Follett, R.F., Stewart, B.A. (Eds.), Assessment Methods for Soil<br />
Carbon. Lewis Publishers, Boca Raton, pp. 233-272.<br />
Amelung, W., Brodowski, S., Sandhage-Hofmann, A., Bol, R., 2008. Combining<br />
biomarker with stable isotope analyses for assessing the transformation and<br />
turnover of soil organic matter. Advance in Agronomy 100, 155-250.<br />
Anderson, J.P.E., Domsch, K.H., 1978. A physiological method for quantitative<br />
measurement of microbial biomass in soils. Soil Biol. Biochem. 10, 519-525<br />
Appuhn, A., Joergensen, R.G., Raubuch, M., Scheller, E., Wilke, B., 2004. The<br />
automated determination of glucosamine, galactosamine, muramic acid and<br />
mannosamine in soil and root hydrolysates by HPLC. J Plant Nutr Soil Sci 167, 17-<br />
21.<br />
Bosshard, C., Oberson, A., Leinweber, P., Jandl, G., Knicker, H., Wettstein, H.-R.,<br />
Kreuzer, M., Frossard, E., 2011. Characterization of fecal nitrogen forms produced<br />
by a sheep fed with 15 N labeled ryegrass. Nutr. Cycl. Agroecosyst. 90, 355-368.<br />
Brookes, P.C., Landman, A., Pruden, G., Jenkinson, D.S., 1985. Chloroform fumigation<br />
and the release of soil nitrogen: A rapid direct extraction method for measuring<br />
microbial biomass nitrogen in soil. Soil Biol. Biochem. 17, 837-842<br />
Brookes, P.C., Newcombe, A.D., Jenkinson, D.S., 1987. Adenylate energy charge<br />
measurements in soil. Soil Biol. Biochem. 19, 211-217.<br />
Van Bruchem, J., Verstegen, M. W., Tamminga, S. 2000. From nutrient fluxes in<br />
animals in nutrient dynamics and health in animal production systems. EAAP-Publ.<br />
97, 28-48.<br />
Diez-Gonzales, F., Callaway, T. R., Kizoulis M. G., Russel J., B., 1998. Grain feeding<br />
and the dissemination of acid-resistant Escherichia coli from cattle. Science 281,<br />
1666-1669.<br />
Djajakirana, G., Joergensen, R., Meyer, B., 1996. Ergosterol and microbial biomass<br />
relationship in soil. Biol. Fertil. Soils 22, 299–304.<br />
Dyckmans, J., Raubuch, M., 1997. A modification of a method to determine adenosine<br />
nucleotides in forest organic layers and mineral soils by ion-paired reversed-phase<br />
high-performance liquid chromatography. J. Microbiol. Methods 30, 13-20.
10. Literatur 89<br />
Engelking, B., Flessa, H., Joergensen, R.G., 2007. Shifts in amino sugar and ergosterol<br />
contents after addition of sucrose and cellulose to soil. Soil Biol.Biochem. 39,<br />
2111-2118.<br />
Firestone, M. K., Davidson, E., A., 1989. Microbiological basis of NO and N2O<br />
production and consumption in soil. In: Andreae M.,O., Schimel D., S. (Eds.)<br />
Exchange of Trace Gases Between Terrestrial Ecosystems and the Atmosphere. John<br />
Wiley & Sons Ltd., Chichester, pp. 7-21.<br />
Flessa, H., Dörsch, P., Beese, F., 1995. Seasonal variation of N2O and CH4 fluxes in<br />
differently managed arable soils in Southern Germany. J. Geophys. Res. 100, 23115-<br />
23124.<br />
Gruber, L., 1990. Proteinversorgung <strong>von</strong> Milchkühen. Bericht über die 17. Tierzucht-<br />
tagung „Aktuelle Fragen der Milchvieh- und Schafhaltung“, BAL Gumpenstein, pp.<br />
29-36<br />
Harmon, B.G., Brown, C.A., Tkalcic, S., Mueller, P.O.E., Parks, A., Jain, A.V., Zhao,<br />
T., Doyle, M.P., 1999. Faecal shedding and rumen growth of E. coli O157:H7 in<br />
fasted calves. J. Food Prot. 62, 574-579<br />
Höper, H., Kleefisch, B., 2001. Untersuchung bodenbiologischer Parameter im Rahmen<br />
der Boden-Dauerbeobachtung in Niedersachsen – Bodenbiologische Referenzwerte<br />
und Zeitreihen. Arbeitshefte Boden 2001/4, NLfB, Hannover<br />
IPCC, 1997. Intergovernmental Panel on Climate Change guidelines for national green-<br />
house gas inventories, chapter 4, Agriculture: nitrous oxide from agricultural soils<br />
and manurte management, OECD, Paris, France.<br />
IPCC, 2001. Good practice guidance and uncertainty management in national green-<br />
house gas inventories. Intergovernmental Panel on Climate Change, www.ipcc.ch.<br />
Jenkinson, D.S., 1966. Studies on the decomposition of plant material in soil. II. Partial<br />
sterilization of soil and the soil biomass. J. Soil Sci. 17, 280-302.<br />
Jenkinson, D.S., 1988. The determination of microbial biomass carbon and nitrogen in<br />
soil. In: Wilson, J.R., (Ed.), Advances in Nitrogen Cycling in Agricultural<br />
Ecosystems. CABI, Wallingford, pp. 368-386.<br />
Jenkinson, D.S., Oades, J.M.. 1979. A method for measuring adenosine triphosphate in<br />
soil. Soil Biol. Biochem. 11, 193-199.<br />
Jensen, B.B., Jørgensen, H., 1994. Effect of dietary fiber on microbial activity and<br />
microbial gas production in various regions of the gastrointestinal tract of pigs. Appl.<br />
Envir. Microbiol., 60, 1897-1904.
10. Literatur 90<br />
Jensen, B., Sørensen, P., Thomsen, I.K., Jensen, E.S., Christensen, B.T., 1999.<br />
Availability of nitrogen in 15 N-labeled ruminant manure components to successively<br />
grown crops. Soil Sci. Soc. Am. J. 63, 416-423.<br />
Jörgensen, R.G., 1995. Die quantitative Bestimmung der <strong>mikrobielle</strong>n Biomasse in<br />
Böden mit der Chloroform-Fumigations-Extraktionsmethode. Gött. Bodenkundl.<br />
Ber. 104, 1-229<br />
Joergensen, R.G., 2000. Ergosterol and microbial biomass in the rhizosphere of<br />
grassland soils. Soil Biol. Biochem. 32, 647-652.<br />
Kalk, W. D., Hülsbergen, K. J., 1996. Methodik zur Einbeziehung des indirekten<br />
Energieverbrauchs mit Investitionsgütern in Energiebilanzen <strong>von</strong> Landwirtschafts-<br />
betrieben. Kühn-Archiv 90, 41-56.<br />
Lindecrona, R.H., Jensen, T.K., Jensen, B.B., Leser, T.D., Jiufeng, W., Møller, K.,<br />
2003. The influence of diet on the development of swine dysentery upon<br />
experimental infection. Animal Sci. 76, 81-87<br />
Mäder, P., Fliessbach, A., Dubois, D., Gunst, L., Fried, P., Niggli, U., 2002. Soil<br />
fertility and biodiversity in organic farming. Science 296,1694-1697.<br />
Oades, J.M. and Jenkinson, D.S., 1979. Adenosine triphosphate content of the soil<br />
microbial biomass. Soil Biol. Biochem. 11 , 201–204.<br />
Redmile-Gordon, M., White, R.P., Brookes, P.C., 2011. Evaluation of substitutes for<br />
paraquat in soil microbial ATP determinations using the trichloroacetic acid based<br />
reagent of Jenkinson and Oades 1979. Soil Biol. Biochem. 43, 1098-1100.<br />
Salzgeber, C., Lörcher, M., 1997. Produktökobilanz Brot unter verschiedenen Landbau-<br />
bedingungen. In: Deutsche Bundesstiftung Umwelt (Ed) Umweltverträgliche<br />
Pflanzenproduktion – Indikatoren, Bilanzierungsansätze und ihre Einbindung in<br />
Öko-Bilanzen. Zeller-Verlag, Osnabrück, pp. 249-269.<br />
Sehy U., 2004. N2O-Freisetzung landwirtschaftlich genutzter Böden unter dem Einfluss<br />
<strong>von</strong> Bewirtschaftungs- und Standortfaktoren. Dissertation, TU-München-Weihen-<br />
stephan<br />
Singh, J. S., Raghubanshi, A. S., Singh, R. S., Srivastava, S. C., 1989. Microbial<br />
biomass acts as a source of plant nutrients in dry tropical forest and savanna. Nature<br />
338, 499-500.<br />
Sørensen, P., Jensen, E.S., 1998. The use of 15 N labelling to study the turnover and<br />
utilization of ruminant manure N. Biol. Fertil. Soils 28, 56–63.
10. Literatur 91<br />
Vandermeer, J., 1995. The ecological basis of alternative agriculture. Ann. Re.v Ecol.<br />
Syst. 26, 201-224.<br />
Vance, E., Brookes, P., Jenkinson, D., 1987. An extraction method for measuring soil<br />
microbial biomass C. Soil Biol. Biochem. 19, 703–707.<br />
Verhoeven, F. P. M., van der Made, G. M., van Bruchem, J., 1998. Nitrogen in balance<br />
– results of 100 Friesian dairy farms show the importance of the uptake from the soil.<br />
Veeteelt 15, 496-498.<br />
Wachendorf, C., Joergensen, R.G., 2011. Mid-term tracing of 15 N derived from urine<br />
and dung in soil microbial biomass. Biol. Fertil. Soils 47, 147-155.<br />
Weete, J.D., Weber, D.J., 1980. Lipid Biochemistry of Fungi and other Organisms.<br />
Plenum Publishing, New York.<br />
Wolstrup, J., Jensen, K., 2008. Adenosine triphosphate and deoxyribonucleic acid in the<br />
alimentary tract of cattle fed different nitrogen sources. Journal of Applied<br />
Microbiology 45, 49–56.<br />
Zelles, L., Hund, K., Stepper, K., 1987. Methoden zur relativen Quantifizierung der<br />
pilzlichen Biomasse im Boden. J. Plant Nutr. Soil Sci. 150, 249–252.<br />
Zhang, X., Amelung, W., 1996. Gas chromatographic determination of muramic acid,<br />
glucosamine, mannosamine, and galactosamine in soils. Soil Biol. Biochem. 28,<br />
1201-1206.
11. Danksagung 92<br />
11. Danksagung<br />
Als erstes möchte ich mich für die erstklassige Betreuung meiner Arbeit bedanken:<br />
Herrn Prof. A. Sundrum danke ich für seine Kompetenz, sein Verständnis und seine<br />
fachmännische Beratung in Ernährungsfragen. Er gewährte mir spannende Einblicke in<br />
die Geheimnisse des ruminalen Verdauungstraktes.<br />
Herrn Prof. R. G. Jörgensen danke ich für seinen ausgezeichneten fachkundigen Rat<br />
sowie für seine Geduld und Ruhe mit der er als Fels in der Brandung Doktoranden vor<br />
der Verzweiflung zu bewahren vermag.<br />
Außerdem danke ich Herrn Prof. B. Ludwig und Frau Dr. habil. K. Michel, die mir<br />
nicht nur ein DFG-Stipendium, sondern auch ein faszinierendes Projekt anvertraut<br />
haben.<br />
Ich danke der DFG für die Finanzierung und die Möglichkeit, unter optimalen<br />
Bedingungen zu forschen, zu entdecken und zu publizieren.<br />
Der Abteilung Bodenbiologie danke ich für die besten Arbeitskollegen:<br />
Mein besonderer Dank gilt Gabriele Dormann, unsere technisch geniale Laborfee und<br />
geheime Projektkoordinatorin, die uns in der Not Seelentrost spendete. Liebe Gabi, ich<br />
danke dir für deine Geduld, deine Nerven und deine Person, dir verleihe ich die<br />
Ehrendoktorwürde.<br />
Ein großes Dankeschön an Susanne Beck, unsere Heldin, die in schimmernder Rüstung<br />
den Kampf mit allen widrigen Elementen, welche ein Fortkommen zu behindern<br />
drohen, leidenschaftlich aufnimmt. Dich, liebe Susi, erhebe ich in den Ritterstand.<br />
Allen Mitdoktoranden: Stefanie Heinze, Nicole Heyn, Caroline Indorf, Ramia Jannoura,<br />
Stefan Lukas, Rajasekaran Murugan, Nils Rottmann, André Sradnick, Charlotte<br />
Tönnshoff, Stefanie Wentzel - danke für euer geteiltes Leid, Mitleid, die schönste<br />
Mittagszeit, für eure Freizeit und Fröhlichkeit, danke für die tolle Zeit.<br />
Allen Azubis: Ann-Katrin Becker, Nicole Gaus, Sophie Trümper, Sabine Schröter,<br />
Sabine Werk, Matthias Wollrath - danke für eure Hilfe und euren Fleiß mit all den<br />
leckeren Proben und danke fürs Mitnehmen, fürs Feiern und für eure Ohren - es hat<br />
Spaß gemacht mit euch.<br />
Außerdem: Margit Rode - danke für deinen Rat, deinen Enthusiasmus und deinen<br />
schwarzen Humor.
11. Danksagung 93<br />
Meiner Bürokollegin, Ramia Jannoura, bin ich überaus dankbar für eine perfekte<br />
Symbiose zwischen absoluter Wohlfühl- und angenehmer Arbeitsatmosphäre. Liebe<br />
Ramia, ich würde mir auch heute mit niemand anderem lieber ein Büro teilen als mit<br />
dir.<br />
Ein großes Dankeschön gebührt auch der Abteilung für Tierernährung:<br />
Den Mitarbeitern: Christiane Jatsch, Charlotte Marien, Birgül Althaus, Nicole Gaus,<br />
Ulrich Sünder, Susanne Hoischen-Taubner, Simona Büchel, Uwe Richter - danke für<br />
euren fachlichen Rat, eure Hilfe im Labor, bei der Probennahme und für die Mitnahme.<br />
Einen herzlichen Dank an die Mitarbeiter des Wentrothofes für die gute Zusammenarbeit.<br />
Und danke an die Beteiligten des FLI Braunschweig für ihre Hilfe und ihren Rat.<br />
Natürlich danke ich auch allen Färsen und Milchkühen für ihre großzügige Spende.<br />
Big thanks to Mr Brookes and his advice. He told me that my PhD will be the best time<br />
of my life and, despite all problems and disappointments with certain methods, he was<br />
right.<br />
Schließlich möchte ich meiner Familie danken, die mir diese Arbeit ermöglicht und<br />
immer hinter mir gestanden hat:<br />
Meiner Schwester Johanna - danke fürs Daumendrücken. Meinem Bruder Patrick -<br />
danke für den Kaffee, ohne den hätte ich’s nicht geschafft.<br />
Meinen geliebten Eltern - danke für eure Unterstützung, fürs Essen einpacken, für die<br />
Englischkorrektur in der Not, für euer Verständnis und eure Liebe.<br />
Mein lieber Rudi, meine liebe Walli - danke für ein zweites Zuhause und für den Platz<br />
in eurem Herzen.<br />
Meiner Fu, die mir beim Schreiben zu Hause mit absoluter Gelassenheit zur Seite stand<br />
und mir auch in schwierigen Zeiten Aufmunterung garantierte.<br />
Meinem geliebten Bernd - danke für deine Geduld und den geistigen Beistand, die mich<br />
soweit gebracht haben. Als bärenstarker Kämpfer verdienst du die Lorbeeren. Ich danke<br />
dir <strong>von</strong> ganzem Herzen.