OEM spectro Catalogue - Horiba
OEM spectro Catalogue - Horiba
OEM spectro Catalogue - Horiba

Create successful ePaper yourself
Turn your PDF publications into a flip-book with our unique Google optimized e-Paper software.
10<br />
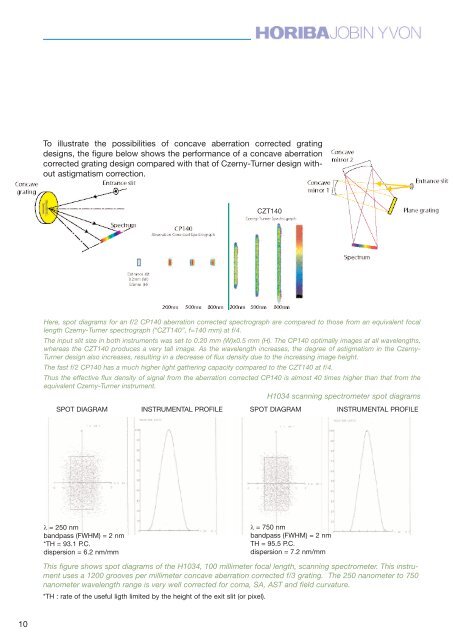
To illustrate the possibilities of concave aberration corrected grating<br />
designs, the figure below shows the performance of a concave aberration<br />
corrected grating design compared with that of Czerny-Turner design without<br />
astigmatism correction.<br />
Here, spot diagrams for an f/2 CP140 aberration corrected <strong>spectro</strong>graph are compared to those from an equivalent focal<br />
length Czerny-Turner <strong>spectro</strong>graph (“CZT140”, f=140 mm) at f/4.<br />
The input slit size in both instruments was set to 0.20 mm (W)x0.5 mm (H). The CP140 optimally images at all wavelengths,<br />
whereas the CZT140 produces a very tall image. As the wavelength increases, the degree of astigmatism in the Czerny-<br />
Turner design also increases, resulting in a decrease of flux density due to the increasing image height.<br />
The fast f/2 CP140 has a much higher light gathering capacity compared to the CZT140 at f/4.<br />
Thus the effective flux density of signal from the aberration corrected CP140 is almost 40 times higher than that from the<br />
equivalent Czerny-Turner instrument.<br />
H1034 scanning <strong>spectro</strong>meter spot diagrams<br />
SPOT DIAGRAM INSTRUMENTAL PROFILE SPOT DIAGRAM INSTRUMENTAL PROFILE<br />
l = 250 nm<br />
bandpass (FWHM) = 2 nm<br />
*TH = 93.1 P.C.<br />
dispersion = 6.2 nm/mm<br />
*TH : rate of the useful ligth limited by the height of the exit slit (or pixel).<br />
CZT140<br />
l = 750 nm<br />
bandpass (FWHM) = 2 nm<br />
TH = 95.5 P.C.<br />
dispersion = 7.2 nm/mm<br />
This figure shows spot diagrams of the H1034, 100 millimeter focal length, scanning <strong>spectro</strong>meter. This instrument<br />
uses a 1200 grooves per millimeter concave aberration corrected f/3 grating. The 250 nanometer to 750<br />
nanometer wavelength range is very well corrected for coma, SA, AST and field curvature.