paper on open plan offices and ISO 3382 - Odeon
paper on open plan offices and ISO 3382 - Odeon
paper on open plan offices and ISO 3382 - Odeon

Create successful ePaper yourself
Turn your PDF publications into a flip-book with our unique Google optimized e-Paper software.
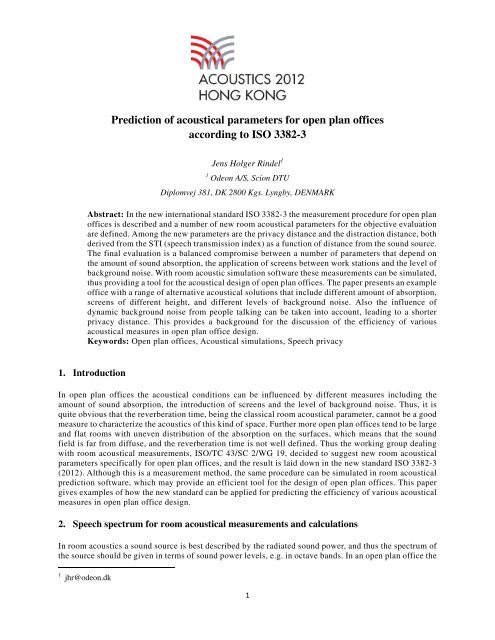
Predicti<strong>on</strong> of acoustical parameters for <strong>open</strong> <strong>plan</strong> <strong>offices</strong><br />
according to <strong>ISO</strong> <strong>3382</strong>-3<br />
Jens Holger Rindel 1<br />
1 Ode<strong>on</strong> A/S, Sci<strong>on</strong> DTU<br />
Diplomvej 381, DK 2800 Kgs. Lyngby, DENMARK<br />
Abstract: In the new internati<strong>on</strong>al st<strong>and</strong>ard <strong>ISO</strong> <strong>3382</strong>-3 the measurement procedure for <strong>open</strong> <strong>plan</strong><br />
<strong>offices</strong> is described <strong>and</strong> a number of new room acoustical parameters for the objective evaluati<strong>on</strong><br />
are defined. Am<strong>on</strong>g the new parameters are the privacy distance <strong>and</strong> the distracti<strong>on</strong> distance, both<br />
derived from the STI (speech transmissi<strong>on</strong> index) as a functi<strong>on</strong> of distance from the sound source.<br />
The final evaluati<strong>on</strong> is a balanced compromise between a number of parameters that depend <strong>on</strong><br />
the amount of sound absorpti<strong>on</strong>, the applicati<strong>on</strong> of screens between work stati<strong>on</strong>s <strong>and</strong> the level of<br />
background noise. With room acoustic simulati<strong>on</strong> software these measurements can be simulated,<br />
thus providing a tool for the acoustical design of <strong>open</strong> <strong>plan</strong> <strong>offices</strong>. The <str<strong>on</strong>g>paper</str<strong>on</strong>g> presents an example<br />
office with a range of alternative acoustical soluti<strong>on</strong>s that include different amount of absorpti<strong>on</strong>,<br />
screens of different height, <strong>and</strong> different levels of background noise. Also the influence of<br />
dynamic background noise from people talking can be taken into account, leading to a shorter<br />
privacy distance. This provides a background for the discussi<strong>on</strong> of the efficiency of various<br />
acoustical measures in <strong>open</strong> <strong>plan</strong> office design.<br />
Keywords: Open <strong>plan</strong> <strong>offices</strong>, Acoustical simulati<strong>on</strong>s, Speech privacy<br />
1. Introducti<strong>on</strong><br />
In <strong>open</strong> <strong>plan</strong> <strong>offices</strong> the acoustical c<strong>on</strong>diti<strong>on</strong>s can be influenced by different measures including the<br />
amount of sound absorpti<strong>on</strong>, the introducti<strong>on</strong> of screens <strong>and</strong> the level of background noise. Thus, it is<br />
quite obvious that the reverberati<strong>on</strong> time, being the classical room acoustical parameter, cannot be a good<br />
measure to characterize the acoustics of this kind of space. Further more <strong>open</strong> <strong>plan</strong> <strong>offices</strong> tend to be large<br />
<strong>and</strong> flat rooms with uneven distributi<strong>on</strong> of the absorpti<strong>on</strong> <strong>on</strong> the surfaces, which means that the sound<br />
field is far from diffuse, <strong>and</strong> the reverberati<strong>on</strong> time is not well defined. Thus the working group dealing<br />
with room acoustical measurements, <strong>ISO</strong>/TC 43/SC 2/WG 19, decided to suggest new room acoustical<br />
parameters specifically for <strong>open</strong> <strong>plan</strong> <strong>offices</strong>, <strong>and</strong> the result is laid down in the new st<strong>and</strong>ard <strong>ISO</strong> <strong>3382</strong>-3<br />
(2012). Although this is a measurement method, the same procedure can be simulated in room acoustical<br />
predicti<strong>on</strong> software, which may provide an efficient tool for the design of <strong>open</strong> <strong>plan</strong> <strong>offices</strong>. This <str<strong>on</strong>g>paper</str<strong>on</strong>g><br />
gives examples of how the new st<strong>and</strong>ard can be applied for predicting the efficiency of various acoustical<br />
measures in <strong>open</strong> <strong>plan</strong> office design.<br />
2. Speech spectrum for room acoustical measurements <strong>and</strong> calculati<strong>on</strong>s<br />
In room acoustics a sound source is best described by the radiated sound power, <strong>and</strong> thus the spectrum of<br />
the source should be given in terms of sound power levels, e.g. in octave b<strong>and</strong>s. In an <strong>open</strong> <strong>plan</strong> office the<br />
1 jhr@ode<strong>on</strong>.dk<br />
1
main source of disturbance is speech, <strong>and</strong> thus the measurements laid down in <strong>ISO</strong> <strong>3382</strong>-3 are based <strong>on</strong> a<br />
source emitting sound with a typical speech spectrum. A good reference for an average speech spectrum is<br />
ANSI 3.5 (1997), which gives the average spectrum of male <strong>and</strong> female speech for various levels of vocal<br />
effort. The normal vocal effort is used here, <strong>and</strong> the octave b<strong>and</strong> SPL (Sound Pressure Level) in a distance<br />
of 1 m in from of the mouth is as given in Table 1, except for the 125 Hz value, which has been estimated<br />
since it is not included in ANSI 3.5. In order to c<strong>on</strong>vert these data to the preferred sound power levels, it<br />
is necessary to know the directi<strong>on</strong>al directivity in each octave b<strong>and</strong> for a human speaker. Fortunately, such<br />
directivity data are available [Chu & Warnock, 2002] <strong>and</strong> have been applied to derive the octave b<strong>and</strong><br />
sound power levels given in Table 1.<br />
Table 1 - Speech spectrum in octave b<strong>and</strong>s for normal speech, SPL in a distance of 1 m <strong>on</strong> axis for<br />
directi<strong>on</strong>al source <strong>and</strong> sound power levels as applied in <strong>ISO</strong> <strong>3382</strong>-3 (2012).<br />
Frequency, Hz 125 250 500 1000 2000 4000 8000 A-weighted<br />
L p,S,1 m dB re 20 μPa 51,2 57,2 59,8 53,5 48,8 43,8 38,6 59,5<br />
L W,S dB re 1 pW 60,9 65,3 69,0 63,0 55,8 49,8 44,5 68,4<br />
In <strong>ISO</strong> <strong>3382</strong>-3 is stated that an omnidirecti<strong>on</strong>al sound source shall be applied, <strong>and</strong> for some good<br />
reas<strong>on</strong>s. One reas<strong>on</strong> is that the orientati<strong>on</strong> of people speaking in an <strong>open</strong> <strong>plan</strong> office may not be well<br />
defined; actually it could be c<strong>on</strong>sidered to take an average of all directi<strong>on</strong>s in a horiz<strong>on</strong>tal <strong>plan</strong>e. Sec<strong>on</strong>dly,<br />
it would be technically complicated to make realistic <strong>and</strong> sufficiently accurate specificati<strong>on</strong>s for the<br />
directivity of a directive sound source, whereas the omnidirecti<strong>on</strong>al sound source is well established in<br />
room acoustical measurements.<br />
3. Acoustical parameters for <strong>open</strong> <strong>plan</strong> <strong>offices</strong><br />
3.1 Source <strong>and</strong> receiver positi<strong>on</strong>s<br />
It is essential that calculati<strong>on</strong>s are made in a furnished office, so the workstati<strong>on</strong>s can be identified, but<br />
also because furnishing has a significant influence <strong>on</strong> the acoustics. Source <strong>and</strong> receiver positi<strong>on</strong>s are in<br />
workstati<strong>on</strong>s in a height of 1.2 m above the floor. The calculati<strong>on</strong>s are made from a source positi<strong>on</strong> to a<br />
number of receiver positi<strong>on</strong>s in different distances, <strong>and</strong> as far as possible located al<strong>on</strong>g a line, although<br />
this is not m<strong>and</strong>atory. The parameters can be divided into two groups, three parameters based <strong>on</strong> the<br />
A-weighted SPL (Sound Pressure Level) <strong>and</strong> three other parameters based <strong>on</strong> STI (Speech Transmissi<strong>on</strong><br />
Index).<br />
3.2 Parameters based <strong>on</strong> A-weighted SPL<br />
When the source is radiating a noise signal with speech spectrum the A-weighted SPL is determined in a<br />
number of positi<strong>on</strong>s with increasing distance from the source. Thus the spatial distributi<strong>on</strong> of the<br />
A-weighted SPL can be displayed as a functi<strong>on</strong> of the distance using a logarithmic axis for the distance.<br />
The spatial decay rate of speech is then determined from the slope of a linear regressi<strong>on</strong> line, <strong>and</strong><br />
expressed in dB per distance doubling, see Figure 2 below. The same regressi<strong>on</strong> line is also used to<br />
determine the A-weighted SPL of speech at a distance of 4 m. The latter is a parameter that tells how much<br />
the source level is influenced by nearby reflecting surfaces, whereas the spatial decay rate is a measure of<br />
the efficiency of sound absorbing materials <strong>and</strong> screens. In additi<strong>on</strong> to these two parameters the average<br />
A-weighted SPL of the background noise is also measured/reported. In Annex A of <strong>ISO</strong> <strong>3382</strong>-3 is<br />
suggested that a spatial decay rate of speech less than 5 dB is typical for poor acoustical c<strong>on</strong>diti<strong>on</strong>s,<br />
whereas a value ≥ 7 dB is suggested as a target value for good acoustical c<strong>on</strong>diti<strong>on</strong>s.<br />
2
3.3 Parameters based <strong>on</strong> STI<br />
The STI is determined in the same positi<strong>on</strong>s as the other measurements, i.e. from each source positi<strong>on</strong><br />
al<strong>on</strong>g a line of receiver positi<strong>on</strong>s, all placed in relevant workstati<strong>on</strong>s. The impulse resp<strong>on</strong>se method is<br />
preferred because it allows freedom in the choice of background noise, <strong>and</strong> in case the background noise<br />
is not the same in all positi<strong>on</strong>s the average over all positi<strong>on</strong>s must be used for the determinati<strong>on</strong> of STI.<br />
For each line the spatial distributi<strong>on</strong> of the STI is displayed using a linear axis for the distance. A linear<br />
regressi<strong>on</strong> line is calculated <strong>and</strong> the crossing of the STI values 0.50 <strong>and</strong> 0.20 are used to define the<br />
‘distracti<strong>on</strong> distance’ <strong>and</strong> the ‘privacy distance’, respectively. See examples in Figure 3 below. In additi<strong>on</strong><br />
to these two distances, the STI in the nearest workstati<strong>on</strong> is reported.<br />
In some cases with little or moderate attenuati<strong>on</strong> the privacy distance can <strong>on</strong>ly be determined by<br />
extrapolati<strong>on</strong>, <strong>and</strong> it may be greater than the l<strong>on</strong>gest dimensi<strong>on</strong> <strong>on</strong> the office, <strong>and</strong> thus the distracti<strong>on</strong><br />
distance is the more relevant parameter. However, in other cases, typically with good attenuati<strong>on</strong> <strong>and</strong> high<br />
background noise, the distracti<strong>on</strong> distance cannot be determined (extrapolati<strong>on</strong> will give a negative<br />
distance) <strong>and</strong> instead the privacy distance is the more relevant parameter.<br />
The interesting feature of these new distance parameters is that they depend <strong>on</strong> a combined effect of<br />
absorpti<strong>on</strong>, screens <strong>and</strong> background noise. In Annex A of <strong>ISO</strong> <strong>3382</strong>-3 is suggested that a distracti<strong>on</strong><br />
distance greater than 10 m is typical for poor acoustical c<strong>on</strong>diti<strong>on</strong>s, whereas a value ≤ 5 m is suggested as<br />
a target value for good acoustical c<strong>on</strong>diti<strong>on</strong>s.<br />
4. Open <strong>plan</strong> office example<br />
The purpose of this <str<strong>on</strong>g>paper</str<strong>on</strong>g> is to show how the measurements in <strong>ISO</strong> <strong>3382</strong>-3 can be simulated with room<br />
acoustical modeling software. ODEON ver. 10 was used for the simulati<strong>on</strong>s whereas the regressi<strong>on</strong> lines<br />
<strong>and</strong> derived parameters were calculated using Microsoft Excel. The example office is the same as<br />
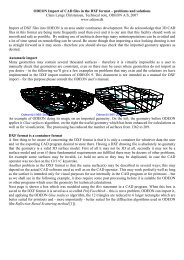
originally measured <strong>and</strong> simulated by Pop & Rindel (2005). A view of the room model is seen in Figure 1.<br />
The office c<strong>on</strong>sists of two parallel wings with an <strong>open</strong> c<strong>on</strong>necti<strong>on</strong>. The total length of the l<strong>on</strong>gest wing is<br />
36.8 m.<br />
Ode<strong>on</strong>©1985-2011 Licensed to: Ode<strong>on</strong> A/S<br />
P2 6<br />
5<br />
4<br />
3<br />
2<br />
1<br />
Figure 1 – A wireframe of the computer model of the office used for the simulati<strong>on</strong>s. Two source<br />
positi<strong>on</strong>s (red) <strong>and</strong> six receiver positi<strong>on</strong>s are shown (blue).<br />
The l<strong>on</strong>gest wing is used for the computer simulati<strong>on</strong>s with two source positi<strong>on</strong>s <strong>and</strong> six receiver<br />
positi<strong>on</strong>s as shown in Figure 1. So, the same line of receivers is used but in opposite directi<strong>on</strong> for the two<br />
series of simulati<strong>on</strong>s, <strong>and</strong> the average result is calculated for all parameters. The results are shown in<br />
Table 2 for office 1, which is the c<strong>on</strong>diti<strong>on</strong> with sound absorbing ceiling as originally measured in the real<br />
office. The background noise is 38 dB A-weighted with a spectrum decreasing approximately by 3 dB per<br />
octave.<br />
3<br />
P1
5. Results<br />
5.1 Influence of absorpti<strong>on</strong><br />
Two modified versi<strong>on</strong>s of the office have also been simulated. Office 2 is much more reverberant because<br />
the ceiling is made highly reflecting c<strong>on</strong>crete. Office 3 is more damped than office 1, having additi<strong>on</strong>al<br />
sound absorbing baffles under the acoustical ceiling, <strong>and</strong> 1.20 m high screens between the work stati<strong>on</strong>s.<br />
The results of the computer simulati<strong>on</strong>s are shown in Table 2.<br />
Table 2 – Results from the simulati<strong>on</strong>s of three office versi<strong>on</strong>s.<br />
Office 1 Office 2 Office 3<br />
T30 (500 - 1000 Hz) in s 0,5 1,0 0,3<br />
STI in nearest workstati<strong>on</strong> 0,66 0,56 0,66<br />
Distracti<strong>on</strong> distance, r D, in m 12,7 8,8 9,4<br />
Privacy distance, r P, in m 32,1 36,9 22,6<br />
Spatial decay rate of A-weighted SPL of speech, D 2,S, in dB 4,2 3,8 6,1<br />
A-weighted SPL of speech at 4 metres, L p ,A,S,4 m, in dB 50,3 56,3 49,5<br />
Average A-weighted background noise, L p ,A,B, in dB 38 38 38<br />
As expected the variati<strong>on</strong> of the absorpti<strong>on</strong> has an influence <strong>on</strong> the spatial decay rate of A-weighted<br />
speech, being more flat in office 2 with the l<strong>on</strong>ger reverberati<strong>on</strong> time <strong>and</strong> steeper in office 3 with the short<br />
reverberati<strong>on</strong> time <strong>and</strong> screens. The A-weighted SPL at 4 m is significantly higher in office 2, but <strong>on</strong>ly<br />
marginally lower in office 3. The spatial decay curves for <strong>on</strong>e of the lines in each of the three versi<strong>on</strong>s of<br />
the office are shown in Figure 2.<br />
Figure 2 – The spatial decay of A-weighted SPL in the three versi<strong>on</strong>s of the office <strong>and</strong> corresp<strong>on</strong>ding<br />
regressi<strong>on</strong> lines (<strong>on</strong>e source-receiver line, <strong>on</strong>ly).<br />
4
Figure 3 – The spatial distributi<strong>on</strong> of STI in the three versi<strong>on</strong>s of the office <strong>and</strong> corresp<strong>on</strong>ding regressi<strong>on</strong><br />
lines (<strong>on</strong>e source-receiver line, <strong>on</strong>ly).<br />
The variati<strong>on</strong> of the distracti<strong>on</strong> distance is interesting, because it is reduced from about 13 m in<br />
office 1 to about 9 m in office 2 as well as in office 3. So, this parameter indicates improvements in both<br />
cases, either with less absorpti<strong>on</strong> or with increased attenuati<strong>on</strong>. The spatial distributi<strong>on</strong> curves in Figure 3<br />
can explain what happens. With the l<strong>on</strong>ger reverberati<strong>on</strong> time in office 2 compared to office 1 the STI goes<br />
down, at least in the positi<strong>on</strong>s close to the sound source, which is a known behavior of STI. However, in<br />
remote positi<strong>on</strong>s STI does not change much because the background noise is more important for the STI<br />
in positi<strong>on</strong>s with a low sound level. So, the distracti<strong>on</strong> distance in office 2 is short because the speech<br />
intelligibility is low in a reverberant room, even if the sound level is much higher. In office 3 the<br />
distracti<strong>on</strong> distance is also short, but for another reas<strong>on</strong>; when the sound level is reduced by screens <strong>and</strong><br />
baffles the background noise becomes more important for STI except in the nearest positi<strong>on</strong>s, <strong>and</strong> the<br />
slope of the spatial distributi<strong>on</strong> of STI becomes steeper.<br />
5.2 Influence of screens<br />
Different screen heights have been simulated in office 3; see the results in Table 3. Mainly the spatial<br />
decay rate of A-weighted SPL is influenced by the screen height. The distracti<strong>on</strong> <strong>and</strong> privacy distances<br />
decrease with increased screen height, but not very much. Other parameters remain unaffected.<br />
Table 3 – Results from the simulati<strong>on</strong>s with different screen height in office 3.<br />
Screen height 1,25 m 1,50 m 1,75 m<br />
STI in nearest workstati<strong>on</strong> 0,66 0,67 0,67<br />
Distracti<strong>on</strong> distance, r D, in m 9,1 8,8 8,5<br />
Privacy distance, r P, in m 22,3 20,3 19,4<br />
Spatial decay rate of A-weighted SPL of speech, D 2,S, in dB 6,2 6,8 7,2<br />
A-weighted SPL of speech at 4 metres, L p ,A,S,4 m, in dB 49,4 49,4 49,3<br />
Average A-weighted background noise, L p ,A,B, in dB 38 38 38<br />
5
5.3 Influence of background noise<br />
Different levels of background noise have been simulated in office 3 (with screen height 1.25 m), see the<br />
results in Table 4. The spectrum of the background noise has not been changed. Only the STI parameters<br />
are shown, since the other parameters are not affected. Increasing the background noise by a few dB has<br />
a beneficial influence <strong>on</strong> distracti<strong>on</strong> distance <strong>and</strong> privacy distance.<br />
Table 4 – Results from the simulati<strong>on</strong>s with different level of background noise in office 3<br />
Average A-weighted background noise, L p ,A,B, in dB 38 40 42 45<br />
STI in nearest workstati<strong>on</strong> 0,66 0,62 0,58 0,52<br />
Distracti<strong>on</strong> distance, r D, in m 9,1 7,2 5,3 1,8<br />
Privacy distance, r P, in m 22,3 19,8 17,4 14,4<br />
In a similar way the dynamic background noise from human activities can be applied in order to<br />
calculate the room acoustical parameters in that c<strong>on</strong>diti<strong>on</strong>. However, when the background noise exceeds<br />
approximately 45 dB the distracti<strong>on</strong> distance is no l<strong>on</strong>ger a meaningful parameter, because it must be<br />
extrapolated from the spatial distributi<strong>on</strong> of STI <strong>and</strong> it can easily take a negative value. Instead the<br />
privacy distance may be a useful parameter when the background noise from human activities is applied.<br />
6. C<strong>on</strong>clusi<strong>on</strong><br />
The new room acoustical parameters in <strong>ISO</strong> <strong>3382</strong>-3 behave differently when the room acoustical<br />
c<strong>on</strong>diti<strong>on</strong>s are changed by absorpti<strong>on</strong>, screens or background noise. N<strong>on</strong>e of the parameters can st<strong>and</strong><br />
al<strong>on</strong>e, but a combinati<strong>on</strong> of parameters is necessary for a sufficient characterizati<strong>on</strong> of the acoustical<br />
c<strong>on</strong>diti<strong>on</strong>s. More research is needed in order to give guidelines for the interpretati<strong>on</strong> of these parameters.<br />
For instance, if looking <strong>on</strong>ly at the distracti<strong>on</strong> distance it may be c<strong>on</strong>cluded that the more reverberant<br />
the better; but this would lead to very noisy c<strong>on</strong>diti<strong>on</strong>s. On the other h<strong>and</strong>, if looking <strong>on</strong>ly at the spatial<br />
decay rate of A-weighted SPL it may be c<strong>on</strong>cluded that the reverberati<strong>on</strong> time should be as short as<br />
possible; but this could easily lead to very high intelligibility even for remote sources, <strong>and</strong> thus a higher<br />
risk of distracti<strong>on</strong> during work.<br />
The three office cases studied here have also been used for laboratory experiments in order to study<br />
the effect of different acoustical c<strong>on</strong>diti<strong>on</strong>s <strong>on</strong> work performance <strong>and</strong> human percepti<strong>on</strong> <strong>and</strong> comfort<br />
[Balazova et al., 2008]. An obvious c<strong>on</strong>tinuati<strong>on</strong> of this work will be to examine possible correlati<strong>on</strong>s<br />
between the new objective parameters <strong>and</strong> the findings from such investigati<strong>on</strong>s <strong>on</strong> percepti<strong>on</strong>, comfort<br />
<strong>and</strong> office work performance.<br />
References<br />
ANSI S3.5 (1997). “American Nati<strong>on</strong>al St<strong>and</strong>ard – Methods for Calculati<strong>on</strong> of the Speech Intelligibility<br />
Index.”<br />
Balazova, I., Clausen, G., Rindel, J.H., Poulsen, T. <strong>and</strong> Wy<strong>on</strong>, D.P. (2008). “Open-<strong>plan</strong> office<br />
envir<strong>on</strong>ments: A laboratory experiment to examine the effect of office noise <strong>on</strong> human percepti<strong>on</strong>,<br />
comfort <strong>and</strong> office work performance.” Proceedings of Indoor Air 2008, Paper ID 703. C<strong>open</strong>hagen,<br />
Denmark.<br />
Chu, W.T. <strong>and</strong> Warnock, A.C.C. (2002), “Detailed Directivity of Sound Fields Around Human Talkers”,<br />
IRC-RR 104, Nati<strong>on</strong>al Research Council, Canada.<br />
<strong>ISO</strong> <strong>3382</strong>-3 (2012). “Acoustics - Measurement of room acoustic parameters — Part 3: Open-<strong>plan</strong> <strong>offices</strong>.”<br />
Pop, C.B. <strong>and</strong> Rindel, J.H. (2005). “Perceived Speech Privacy in Computer Simulated Open-<strong>plan</strong><br />
Offices.” Proceedings of Inter-noise 2005. Rio de Janeiro, Brazil.<br />
6