Managing Marine Protected Areas Managing Marine Protected Areas
Managing Marine Protected Areas Managing Marine Protected Areas
Managing Marine Protected Areas Managing Marine Protected Areas

You also want an ePaper? Increase the reach of your titles
YUMPU automatically turns print PDFs into web optimized ePapers that Google loves.
The following characteristics affect the use of maps:<br />
Scale - The size of the MPA, the scale required and the<br />
size of the printed map (and thus the paper to be used)<br />
must be chosen on the basis of needs and expected uses.<br />
Scale refers to the degree of reduction of the graphic<br />
representation compared to the true size of the feature.<br />
Scale bars are used to indicate the length of miles or<br />
kilometres as represented on the map, or may be given as<br />
a ratio. A scale of 1:50,000 means that a measurement on<br />
the map represents a distance 50,000 times greater on<br />
the land or sea; thus 1cm on the map represents 500m in<br />
reality. Maps of 1:50,000 (used to show buildings, roads,<br />
etc) are considered large-scale compared to those of<br />
1:1,000,000, which are considered small-scale and are<br />
used for whole countries or oceans.<br />
Resolution and Accuracy - This refers to how accurately<br />
a feature can be depicted on a map: the larger the scale,<br />
the higher the resolution. Using a scale of 1:50,000, a<br />
30m long building would be just over 0.5mm on the map.<br />
The choice of line widths used can introduce errors; for<br />
example, on a map with a scale of 1:50,000, a road<br />
represented by a line 0.5mm thick will mean that it is 25m<br />
wide in reality. Similarly, a 1mm error in the location of the<br />
line on the map will mean a 50m deviation from reality.<br />
Factors affecting accuracy can also have cumulative effects.<br />
Coordinates - These are usually marked as intervals along<br />
the margins. They can be in the form of latitude and<br />
longitude (as used on charts) or UTM units (frequently<br />
used by government cartographers). Most GPS and GIS can<br />
convert between these two, and other settings.<br />
GEOGRAPHICAL INFORMATION SYSTEM<br />
(GIS)<br />
GIS is a program that incorporates a database for<br />
positional (geo-referenced) data, allowing manipulation<br />
and analysis. A major benefit is that it allows different<br />
data layers to be overlaid, e.g. data on coral reef status<br />
can be overlain onto data on fishing activity, permitting<br />
analysis of any spatial relationships between the two<br />
parameters. GIS is thus far more than a mapping tool, but<br />
is particularly useful in map production as prints or digital<br />
images can be produced as required, containing the<br />
selection of data layers needed for a particular use.<br />
Setting up and developing a GIS usually requires<br />
considerable experience and MPAs are advised to<br />
collaborate with relevant institutions. MPA staff will be<br />
able to operate the system, once trained, provided there<br />
is expert supervision and appropriate maintenance.<br />
KEY POINTS FOR THE MPA<br />
Sources of further information<br />
Butler, M.J.A. et al. 1987. <strong>Marine</strong> Resource Mapping: an<br />
Introductory Manual. FAO Tech. Paper 274. FAO, Rome. 256pp.<br />
Green, E.P. et al. 1996. A review of remote sensing for the<br />
assessment and management of tropical coastal resources. Coastal<br />
Management 24: 1-40.<br />
Mumby, P.J. et al. 1988. Digital analysis of multispectral airborne<br />
imagery of coral reefs. Coral Reefs 17: 59-69.<br />
Mumby, P. J. et al. 1999. The cost-effectiveness of remote sensing for<br />
tropical coastal resources assessment and management. J. Environ.<br />
Management 55: 157-166.<br />
Roelfsema, C. M., Phinn, S.R. & Dennison, W.C. 2002. Spatial<br />
distribution of benthic microalgae on coral reefs determined by<br />
remote sensing. Coral Reefs 21: 264-274.<br />
www.esri.com – a commercial website providing information and<br />
advice on GIS products, training and support in relation to natural<br />
resources.<br />
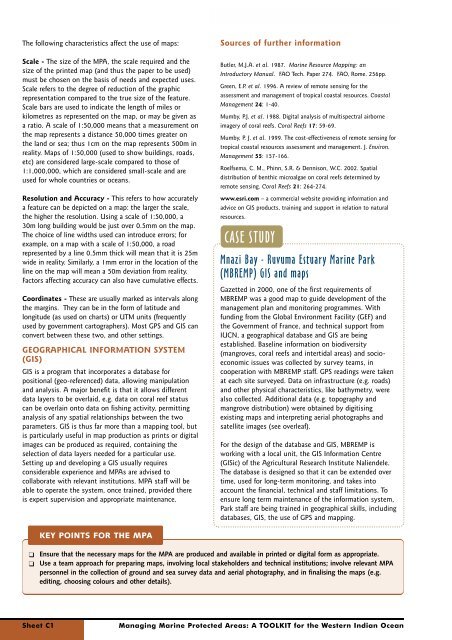
CASE STUDY<br />
Mnazi Bay - Ruvuma Estuary <strong>Marine</strong> Park<br />
(MBREMP) GIS and maps<br />
Gazetted in 2000, one of the first requirements of<br />
MBREMP was a good map to guide development of the<br />
management plan and monitoring programmes. With<br />
funding from the Global Environment Facility (GEF) and<br />
the Government of France, and technical support from<br />
IUCN, a geographical database and GIS are being<br />
established. Baseline information on biodiversity<br />
(mangroves, coral reefs and intertidal areas) and socioeconomic<br />
issues was collected by survey teams, in<br />
cooperation with MBREMP staff. GPS readings were taken<br />
at each site surveyed. Data on infrastructure (e.g. roads)<br />
and other physical characteristics, like bathymetry, were<br />
also collected. Additional data (e.g. topography and<br />
mangrove distribution) were obtained by digitising<br />
existing maps and interpreting aerial photographs and<br />
satellite images (see overleaf).<br />
For the design of the database and GIS, MBREMP is<br />
working with a local unit, the GIS Information Centre<br />
(GISic) of the Agricultural Research Institute Naliendele.<br />
The database is designed so that it can be extended over<br />
time, used for long-term monitoring, and takes into<br />
account the financial, technical and staff limitations. To<br />
ensure long term maintenance of the information system,<br />
Park staff are being trained in geographical skills, including<br />
databases, GIS, the use of GPS and mapping.<br />
❑ Ensure that the necessary maps for the MPA are produced and available in printed or digital form as appropriate.<br />
❑ Use a team approach for preparing maps, involving local stakeholders and technical institutions; involve relevant MPA<br />
personnel in the collection of ground and sea survey data and aerial photography, and in finalising the maps (e.g.<br />
editing, choosing colours and other details).<br />
Sheet C1 <strong>Managing</strong> <strong>Marine</strong> <strong>Protected</strong> <strong>Areas</strong>: A TOOLKIT for the Western Indian Ocean