- Page 1 and 2: The State of Arab Cities 2012 Chall
- Page 3 and 4: The State of Arab Cities 2012 Chall
- Page 5 and 6: Foreword by UN-Habitat It gives me
- Page 7 and 8: Contents Message from the Secretary
- Page 9 and 10: The Arab States Region: Key Finding
- Page 11 and 12: Sana’a, Yemen, is one of the olde
- Page 13 and 14: Regional Subdivision and Sub-Region
- Page 15 and 16: 1.1 Overview Summaries of Sub-regio
- Page 17 and 18: Amman, Jordan. In Jordan, 16 per ce
- Page 19 and 20: Qatar. Housing finance in Gulf coun
- Page 21 and 22: Southern Tier Regional Summary Popu
- Page 23 and 24: 1.2 Historical Perspectives Jerash
- Page 25 and 26: BOX 1: THE SOUL AND IDENTITY OF THE
- Page 27 and 28: Their location often still reflects
- Page 29 and 30: Given the rapidly-increasing gap be
- Page 31 and 32: 1.5 Most of the countries in the re
- Page 33 and 34: FIGURE 5: RENEWABLE WATER AVAILABLE
- Page 35 and 36: 1.7 Regional Corridors and Cooperat
- Page 37 and 38: The impacts of civil unrest made 20
- Page 39 and 40: Statistical Annex TABLE 2: ARAB REG
- Page 41 and 42: TABLE 8: YOUTH UNEMPLOYMENT AS A PE
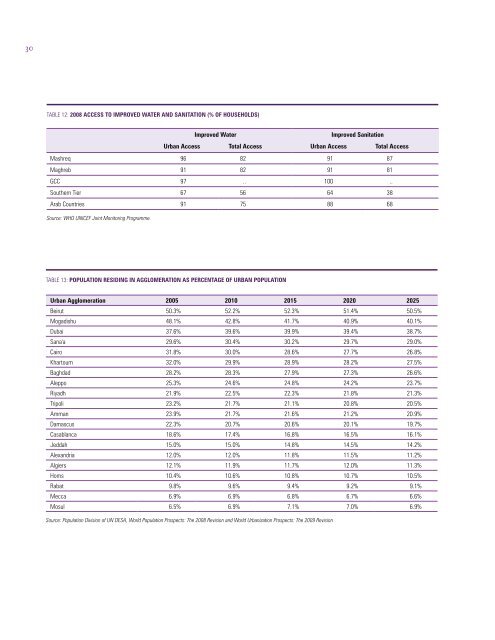
- Page 43: TABLE 11: AVERAGE ANNUAL GROWTH RAT
- Page 47 and 48: 2.1 Total and Urban Population Grow
- Page 49 and 50: FIGURE 10: ALEPPO VISION PLAN Phasi
- Page 51 and 52: FIGURE 12: LEBANON NATIONAL MASTER
- Page 53 and 54: FIGURE 13: ECONOMIC ACTIVITIES IN L
- Page 55 and 56: Najaf, Iraq. Iraqi men survey the d
- Page 57 and 58: BOX 5: IRAQI REFUGEES IN SYRIA Sinc
- Page 59 and 60: FIGURE 14: GEOGRAPHIC INEQUALITIES
- Page 61 and 62: School children walk home after a d
- Page 63 and 64: BOX 6: URBAN BAGHDAD: IMPACT OF CON
- Page 65 and 66: BOX 8: ISLAMIC HOUSING FINANCE Isla
- Page 67 and 68: BOX 9: EGYPT’S INFORMAL SETTLEMEN
- Page 69 and 70: In Greater Cairo, 62 per cent of ho
- Page 71 and 72: Tripoli, Lebanon. Prolonged conflic
- Page 73 and 74: 2.4 Urban Mobility The Challenge of
- Page 75 and 76: 2.5 Urban Environmental Challenges
- Page 77 and 78: The growing cost of energy will als
- Page 79 and 80: TABLE 18: PROPORTION OF POOR IN URB
- Page 81 and 82: Solid Waste Management By 2001, sol
- Page 83 and 84: In Iraq, there is no national urban
- Page 85 and 86: Only the OPT has a truly decentrali
- Page 87 and 88: approximately USD 7.1 billion in 20
- Page 89 and 90: FIGURE 21: URBAN CLUSTERING ALONG T
- Page 91 and 92: Establishing a regional electrical
- Page 93 and 94: Mashreq Statistical Annex TABLE 20:
- Page 95 and 96:
TABLE 25: LEVEL OF MOTORIZATION IN
- Page 97 and 98:
TABLE 31: GOVERNMENT RESPONSIBILITY
- Page 99 and 100:
ENDNOTES 1 World Bank. (2009). Worl
- Page 101 and 102:
ENDNOTES 181 Rishmawi, M. and T. Mo
- Page 103 and 104:
3.1 Population and Urbanization The
- Page 105 and 106:
Fes, Morocco. Morocco has managed t
- Page 107 and 108:
TABLE 35: TUNISIA’S ECONOMY BY SE
- Page 109 and 110:
Madrasah pupils in Mauritania where
- Page 111 and 112:
3.3 Urban Development and Housing C
- Page 113 and 114:
BOX 13: RETURNING TO THE COMPACT CI
- Page 115 and 116:
BOX 14: MAURITANIA’S TWIZÉ PROGR
- Page 117 and 118:
BOX 15: ISLAMIC PRINCIPLES AND LAND
- Page 119 and 120:
3.4 Urban Mobility The Société N
- Page 121 and 122:
Algiers will launch a metro system
- Page 123 and 124:
TABLE 39: DOMESTIC WATER TARIFFS Ca
- Page 125 and 126:
Isofoton photovoltaic micro-plants
- Page 127 and 128:
3.6 Urban Governance Systems Nation
- Page 129 and 130:
Local woman in the medina of the ho
- Page 131 and 132:
29 wishing to emigrate rose from 22
- Page 133 and 134:
FIGURE 33: EURO-MED TRANSPORT PROJE
- Page 135 and 136:
Maghreb Statistical Annex TABLE 41:
- Page 137 and 138:
TABLE 47: LEVEL OF MOTORIZATION IN
- Page 139 and 140:
TABLE 54: DESTINATIONS OF EMIGRANTS
- Page 141 and 142:
ENDNOTES Development, 2010. Also, N
- Page 143 and 144:
4.1 The Gulf Cooperation Council (G
- Page 145 and 146:
FIGURE 38: THE DIYAR AL MUHARRAQ PR
- Page 147 and 148:
4.2 The Growing Economic Role of Ci
- Page 149 and 150:
esearch, while providing a solid in
- Page 151 and 152:
BOX 17: IMPACTS OF THE GLOBAL FINAN
- Page 153 and 154:
FIGURE 40: DEVELOPMENT OF SECONDARY
- Page 155 and 156:
immigrant labourers, the Saudi part
- Page 157 and 158:
The wind tower of Sheikh Isa bin Al
- Page 159 and 160:
multi-story residential buildings,
- Page 161 and 162:
Low cost migrant housing in Deirah,
- Page 163 and 164:
TABLE 59: PERCENTAGE OF URBAN POPUL
- Page 165 and 166:
4.4 Urban Mobility The Challenges o
- Page 167 and 168:
Mass Transportation Unique among Ar
- Page 169 and 170:
BOX 21: RESPONSES TO WATER SHORTAGE
- Page 171 and 172:
FIGURE 45: GCC REGIONAL CLIMATE MOD
- Page 173 and 174:
FIGURE 47: PARTICULATE MATTER (PM10
- Page 175 and 176:
systems, liveability, water, energy
- Page 177 and 178:
local development and infrastructur
- Page 179 and 180:
4.7 Migration and Remittances Cons
- Page 181 and 182:
One of the reasons that the effort
- Page 183 and 184:
FIGURE 49: THE GULF PENINSULA’S E
- Page 185 and 186:
BOX 23: ARAB GULF STATES COOPERATIO
- Page 187 and 188:
FIGURE 51: PLANNED REGIONAL GCC RAI
- Page 189 and 190:
TABLE 62: AVERAGE ANNUAL RATE OF CH
- Page 191 and 192:
TABLE 70: WATER AVAILABILITY AND US
- Page 193 and 194:
TABLE 76: IMMIGRATION DATA BY COUNT
- Page 195 and 196:
ENDNOTES Statistical Abstract: 2009
- Page 197 and 198:
ENDNOTES 276 ITUC CSI IGB (2009), 2
- Page 199 and 200:
5.1 The Southern Tier countries of
- Page 201 and 202:
FIGURE 57: TOTAL POPULATION (IN ‘
- Page 203 and 204:
5.2 The Growing Economic Role of Ci
- Page 205 and 206:
infrastructure development, 71 acce
- Page 207 and 208:
5.3 Urban Development and Housing C
- Page 209 and 210:
In Djibouti, where almost all mater
- Page 211 and 212:
5.4 Urban Mobility The Challenge of
- Page 213 and 214:
5.5 Urban Environmental Challenges
- Page 215 and 216:
Water vendor in Khartoum, Sudan. ©
- Page 217 and 218:
million people in Sudan, particular
- Page 219 and 220:
5.6 Urban Governance System Bab al
- Page 221 and 222:
A blind voter at a Southern Sudan r
- Page 223 and 224:
measures to strengthen institutions
- Page 225 and 226:
International Migration of Refugees
- Page 227 and 228:
Southern Tier Statistical Annex TAB
- Page 229 and 230:
TABLE 86: LEVEL OF MOTORIZATION IN
- Page 231 and 232:
TABLE 93: EMIGRATION AND IMMIGRATIO
- Page 233 and 234:
ENDNOTES Assessment, Issue Brief No
- Page 235 and 236:
Bibliography $500 Million Mortgage
- Page 237 and 238:
Choplin, A., ‘Répondre au défi
- Page 239 and 240:
Ghzala, A., “Regional Cross-Borde
- Page 241 and 242:
__, (ed.), ‘Architecture and the
- Page 243 and 244:
‘Sana’a: a City Development Str
- Page 245 and 246:
__. City Development Strategy for T
- Page 248:
The Arab world has played a very im


