Arab Cities2012 - Cities Alliance
Arab Cities2012 - Cities Alliance
Arab Cities2012 - Cities Alliance

You also want an ePaper? Increase the reach of your titles
YUMPU automatically turns print PDFs into web optimized ePapers that Google loves.
The State of<br />
<strong>Arab</strong> <strong>Cities</strong> 2012<br />
Challenges of<br />
Urban Transition
© United Nations Human Settlements Programme (UN-Habitat) 2012<br />
All rights reserved<br />
P.O. Box 30030 Nairobi 00100, Kenya<br />
Tel: +254 20 7623 120<br />
Fax: +254 20 7623 904<br />
Email: habitat.publications@unhabitat.org<br />
www.unhabitat.org<br />
HS Number: HS/021/12E<br />
ISBN Number (Series): 978-92-1-133397-8<br />
ISBN Number (Volume): 978-92-1-132436-5<br />
Design and Layout by Michael Jones Software, Nairobi, Kenya.<br />
Front cover photo: Kuwait City, Kuwait. ©Nasser Buhamad/Shutterstock<br />
Back cover photos (left to right): 1. Cairo, Egypt. ©Joel Carillet/iStockphoto<br />
2. Temple of Hercules, Amman, Jordan. ©Ahmad A Atwah/Shutterstock<br />
3. Tripoli, Libya. ©Patrick Poendl/Shutterstock<br />
4. Mecca, Saudi <strong>Arab</strong>ia. ©Ahmad Faizal Yahya/iStockphoto<br />
5. Juba, South Sudan. ©Frontpage/Shutterstock<br />
DISCLAIMER<br />
The designations employed and the presentation of the materials in this publication do not imply the expression of any opinion whatsoever<br />
on the part of the Secretariat of the United Nations concerning the legal status of any country, territory, city or area or of its authorities, or<br />
concerning the delimitation of its frontiers or boundaries. References to names of firms and commercial products and processes do not imply<br />
any endorsement by the United Nations. Excerpt of this publication, excluding photographs, may be reproduced without authorization, on<br />
condition that the source is indicated.
The State of<br />
<strong>Arab</strong> <strong>Cities</strong> 2012<br />
Challenges of Urban Transition
ii Message from the Secretary-General<br />
In recent months, <strong>Arab</strong> cities have been the central meeting<br />
ground for courageous calls for better governance, more<br />
effective economic management, greater transparency<br />
and more freedom. Those legitimate aspirations for human<br />
rights and dignity have echoed around the world.<br />
Through the centuries, <strong>Arab</strong> cities have generated many<br />
of humankind’s most enduring achievements and legacies.<br />
Today, we must ensure that these cities are sustainable and<br />
inclusive – able to maintain their cultural and spiritual<br />
heritage while advancing well-being for generations to come.<br />
The State of <strong>Arab</strong> <strong>Cities</strong> 2012 offers a timely account of the<br />
progress and the problems in these rapidly urbanizing centres<br />
of human civilization. It tells us, for example, that urban<br />
slums are decreasing in large parts of the region, and that<br />
urban innovations are being introduced with dazzling speed.<br />
But it also shows how many <strong>Arab</strong> societies continue to suffer<br />
under conflict, extreme poverty and under-development.<br />
Far too often, highly centralized governance structures<br />
undermine local authorities’ efficiency, perpetuate corruption,<br />
obstruct political participation and erode the relationships<br />
between the citizenry and the level of government closest to<br />
them. The <strong>Arab</strong> Awakening has delivered welcome change,<br />
but there is still much work ahead even in those places where<br />
democratic transitions are taking root.<br />
This report also highlights the importance of young people.<br />
In most <strong>Arab</strong> countries, youth make up the majority of the<br />
population, and youth unemployment is very high. These<br />
trends often converge in the region’s cities, where a lack of<br />
opportunities and dim prospects for personal and professional<br />
advancement can have destabilizing impacts.<br />
<strong>Arab</strong> nations and cities are at a pivotal moment. As we<br />
look to the challenges of the future, The State of <strong>Arab</strong> <strong>Cities</strong><br />
2012 offers insight and analysis to inform and enlighten. I<br />
commend it to a wide global audience.<br />
Ban Ki-moon<br />
Secretary-General<br />
United Nations
Foreword by UN-Habitat<br />
It gives me great pleasure to introduce this first The State<br />
of the <strong>Arab</strong> <strong>Cities</strong> report, the latest addition to a rapidly<br />
expanding series of regional publications on the state of<br />
cities which already include the African, the Asia-Pacific, the<br />
East European and the Latin America-Caribbean regions.<br />
The <strong>Arab</strong> States constitute perhaps the most diverse region<br />
so far covered by the state of the cities report series. National<br />
populations for 2010 varied from as little as 691,000 in the<br />
Comoros to well over 84 million in Egypt. IMF data for the<br />
same year showed that GDP per capita ranged from USD<br />
862 in the Comoros to USD 74,901 in Qatar. The region’s<br />
highest literacy rate of 94.5 per cent is found in Kuwait,<br />
while Mauritania scores only 55.8 per cent. Likewise, the<br />
national urbanization rate in Kuwait is 98.4 per cent versus<br />
31.8 in Yemen.<br />
Clearly, the region also has a significant number of shared<br />
characteristics beyond being <strong>Arab</strong> States. The overriding<br />
common feature is the shared Islamic religion and culture, but<br />
there are other common traits, including large demographic<br />
youth bulges, significant youth under- and unemployment<br />
rates. There are also highly centralized governance systems<br />
that are being questioned by the populations at large, acute<br />
stresses on fresh water supplies, and increasingly felt impacts<br />
of climate change, to mention a few.<br />
The year 2011 has been a historic one for the <strong>Arab</strong> States<br />
region. I am referring to what became known as ‘the <strong>Arab</strong><br />
Spring’. As early as 2008, the first State of the African <strong>Cities</strong><br />
report - which covered the <strong>Arab</strong> States on the Africa continent<br />
- issued succinct but accurate advice to the governments of<br />
northern Africa that only major political, social and economic<br />
reform could avert significant urban unrest.<br />
The report warned that the combination of large numbers of<br />
unemployed urban youth, a lack of affordable housing, and the<br />
resultant stress on the ability of societies to cater for urban new<br />
household formation rates constituted an explosive mixture.<br />
The events of 2011 showed the validity of this forecast.<br />
The <strong>Arab</strong> States region is currently at a historic cross road<br />
in its political, social and economic evolution. And so I<br />
would like to repeat here the message carried in our 2008<br />
Africa report, because of its significance for the <strong>Arab</strong> States<br />
region as a whole:<br />
The challenge is to reshape social and urban policies towards<br />
sustainable economic growth and adequate living conditions<br />
for rapidly expanding numbers of young and poor urbanites.<br />
But the confrontation with urbanity and modernity can<br />
only be resolved by the region itself, while the outcomes of<br />
policies to better integrate [the <strong>Arab</strong> States] in the global<br />
economy … and among themselves … will determine its<br />
future.<br />
UN-Habitat is promoting the economic role of cities both<br />
in the <strong>Arab</strong> world and beyond. We also want to ensure that<br />
urban planning is well equipped to deal with current urban<br />
challenges.<br />
Finally, I would like to commend the excellent inter-agency<br />
cooperation in the true spirit of One-UN in the preparation<br />
of this publication. I thank all partners for their vision,<br />
contributions and cooperation.<br />
Dr. Joan Clos<br />
Under-Secretary General of the United Nations<br />
Executive Director UN-Habitat<br />
iii
iv<br />
Acknowledgements<br />
In an effort to review in detail the conditions and trends across the <strong>Arab</strong> States region, this report has drawn on an initial<br />
background report on <strong>Arab</strong> cities prepared by the Kuwait office of UN-Habitat and the knowledge of a wide range of<br />
specialists. This included a first expert group meeting hosted by the <strong>Arab</strong> Fund For Social and Economic Development in<br />
Kuwait City, Kuwait, on 28 and 29 April 2010. A second expert group meeting, hosted by the League of <strong>Arab</strong> States was held<br />
on 1-3 November 2010 in Cairo, Egypt. A peer review of the consolidated draft was reviewed by an Editorial Board meeting<br />
of experts, held on 20 and 21 November 2011 in Amman, Jordan.<br />
This report could not have been realized without the generous financial support by the Government of Kuwait and the<br />
cooperation of <strong>Arab</strong> Towns Organization. UN-Habitat is further grateful to the Government of Norway for its financial<br />
contribution to the editorial board meeting and the graphic design.<br />
The report was coordinated by Tarek El-Sheikh and Dalal Al-Rashed of UN-Habitat’s Kuwait Office. Jos Maseland and Lusungu<br />
Kayani of UN-Habitat’s Regional Office for Africa and the <strong>Arab</strong> States conceptualized the report and designed the drafting<br />
process. An initial background report was prepared by Tarek El-Sheikh and Victoria Wisnewski-Otero of UN-Habitat Kuwait.<br />
Daniel Biau, formerly Director of UN-Habitat’s Regional and Technical Cooperation Division, and Alioune Badiane, Director<br />
of UN-Habitat’s Project Office, provided overall guidance.<br />
Mona Serageldin, the lead author of the report, was supported by a team of experts composed of Kendra Leith, Maria Luisa<br />
Fernandez Mansfield, Linda Shi and François Vigier.<br />
A number of regional experts have contributed by providing specific countries background reports. The UN-Habitat Team<br />
contributed to the drafting of Chapter One. Dr. Abdul Aziz Adidi contributed to Chapter Two (the Maghreb). Dr. Nassr<br />
Yassin and Dania Rifai prepared the Lebanon report. Dr. Rami Nasrallah and Filiep Decorte prepared Occupied Palestinian<br />
Territories background documents. Fiona McCluney prepared a note on Baghdad for Chapter Three (the Mashreq). Dr. Ali A.<br />
Alraouf prepared the Qatar and Bahrain national reports. Dr. Saied Maksoud provided the Saudi <strong>Arab</strong>ia report. Dr. Radhiya<br />
AlHashimi contributed the United <strong>Arab</strong> Emirates and Oman reports, while Tarek El-Sheikh and Sara Al Duwaisan provided<br />
background information on Kuwait. Eng. Eid Al-Khaldi contributed valuable statistics and regional data for Chapter Four (the<br />
Gulf Cooperation Council). Dr. Salah Osman prepared the Sudan country report, while Eng. Yasmin Al-Awadi prepared the<br />
Yemen background report for Chapter Five (the Southern Tier). Chris Horwood prepared reference documents on all countries<br />
covered by this report. Lusungu Kayani compiled the Statistical Annex, based on data from The State of African <strong>Cities</strong> 2010 and<br />
the World Urbanization Prospects: The 2009 Revision, UNDESA.<br />
The expert group meetings in Kuwait City and Cairo benefited from expert guidance provided by:<br />
Abdelaziz Adidi, Adam Abdelmoula, Basiouni Abdelrahman, Ahmed Aladsani, Dhari Al Ajmi, Abdulrahman Alduaij, Sohaib<br />
Allabdi, Ali A. Alraouf, Sateh Arnaout, Yasmine Al Awadhint Dina Al Beheri, Daniel Biau, Rounwah Adly Bseiso, Hussain<br />
Dashti, Sara Al Duwaisan, Assem El Gazzar, Thabit Al Haroun, Radhiya Al Hashimi, Chris Horwood, Lusungu Kayani,<br />
Mohamed Khadim, Eid Al Khaldi, Jos Maseland, Fiona McCluney, Eduardo Moreno, Rami Nasrallah, Trevor Pearson, Gerry<br />
Post, Dania Rifai, Sandra Al Saleh, Ghassan Samman, Mowaffaq Al Saqqar, Mona Serageldin, Ehab Shalaan, Sahar Shawa,<br />
Tarek El-Sheikh, Monica El Shorbagi, David Simms, Ali Shabou, Doaa El Sherif, Ahmed Taha, Maha Yahya and Nasser Yassin.<br />
UN-Habitat appreciates the guidance provided by the following Editorial Board members:<br />
Abdelaziz Adidi, Ali Abdel Raouf, Ali Shabou, Alioune Badiane, H.E. Ammar Gharaibeh, Chairman of Greater Amman<br />
Municipality Committee, Dalal Al-Rashed, Dania Rifai, Daniel Biau, Eduardo Moreno, Ghassan Samman, Hatem Taha, Jan<br />
Meeuwissen, Jos Maseland, Lusungu Kayani, Maha Yahya Mohamed Khadim, Mona Serageldin, Paulius Kulikauskas, Riad<br />
Tabbarah, Riadh Tappuni, Tarek El-Sheikh, Sateh Aranout, Waleed Al <strong>Arab</strong>i and H.E. Yehia Al Kasby.<br />
The following contributed text boxes to the report:<br />
Nadia Alaily-Mattar, Yasmine Al Awadhi, Dorothee von Brentano, Radhiya Al Hashimi, Jos Maseland, Fiona McCluney, Rami<br />
Nasrallah, Salah Osman, Ali A. Raouf, Mowafaq Al Saqqar, Ali Shabou, Tarek El Sheikh, David Simms and Maha Yahya.
Contents<br />
Message from the Secretary-General ............................................................................ii<br />
Foreword by UN-Habitat ................................................................................... iii<br />
Acknowledgements ........................................................................................ iv<br />
The <strong>Arab</strong> States Region: Key Findings and Messages . .............................................................vii<br />
Executive Summary ....................................................................................... viii<br />
1. The State of <strong>Arab</strong> <strong>Cities</strong> 2012 ...........................................................................xii<br />
1.1 Summaries of Sub-Regional Sections . .......................................................................1<br />
Mashreq Regional Summary . .............................................................................2<br />
Maghreb Regional Summary . .............................................................................3<br />
GCC Regional Summary . ...............................................................................4<br />
Southern Tier Regional Summary . .........................................................................7<br />
1.2 Historical Perspectives . ..................................................................................9<br />
1.3 Largest <strong>Arab</strong> <strong>Cities</strong> . ...................................................................................14<br />
1.4 Transnational Migration . ...............................................................................16<br />
1.5 Refugees and IDPs . ...................................................................................17<br />
1.6 Regional Urban Energy, Food and Water Security . ............................................................18<br />
1.7 Regional Corridors and Cooperation . .....................................................................21<br />
1.8 Emerging Governance Issues . ............................................................................22<br />
Statistical Annex . .....................................................................................25<br />
2. The State of Mashreq <strong>Cities</strong> . ...........................................................................32<br />
2.1 Population and Urbanization . ...........................................................................33<br />
2.2 The Growing Economic Role of <strong>Cities</strong> . ....................................................................38<br />
2.3 Urban Development and Housing Conditions . ..............................................................48<br />
2.4 Urban Mobility . ......................................................................................59<br />
2.5 Urban Environmental Challenges . ........................................................................61<br />
2.6 Urban Governance Systems . .............................................................................68<br />
2.7 Migration and Remittances . .............................................................................72<br />
2.8 Regional Corridors and Cooperation . .....................................................................74<br />
Mashreq Statistical Annex . ..............................................................................79<br />
3. The State of Maghreb <strong>Cities</strong> . ...........................................................................88<br />
3.1 Population and Urbanization . ...........................................................................89<br />
3.2 The Growing Economic Role of <strong>Cities</strong> . ....................................................................92<br />
3.3 Urban Development and Housing Conditions . ..............................................................97<br />
3.4 Urban Mobility . .....................................................................................105<br />
3.5 Urban Environmental Challenges . .......................................................................108<br />
3.6 Urban Governance Systems . ............................................................................113<br />
3.7 Migration and Remittances . ............................................................................116<br />
3.8 Regional Corridors and Cooperation . ....................................................................118<br />
Maghreb Statistical Annex . .............................................................................121<br />
4. The State of GCC <strong>Cities</strong> ..............................................................................128<br />
4.1 Population and Urbanization . ..........................................................................129<br />
4.2 The Growing Economic Role of <strong>Cities</strong> . ...................................................................133<br />
4.3 Urban Development and Housing Conditions . .............................................................144<br />
4.4 Urban Mobility . .....................................................................................151<br />
4.5 Urban Environmental Challenges . .......................................................................154<br />
4.6 Urban Governance Systems . ............................................................................160<br />
4.7 Migration and Remittances . ............................................................................165<br />
4.8 Regional Corridors and Cooperation . ....................................................................168<br />
GCC Statistical Annex . ...............................................................................174<br />
5. The State of Southern Tier <strong>Cities</strong> .......................................................................184<br />
5.1 Population and Urbanization . ..........................................................................185<br />
5.2 The Growing Economic Role of <strong>Cities</strong> . ...................................................................189<br />
5.3 Urban Development and Housing Conditions . .............................................................193<br />
5.4 Urban Mobility . .....................................................................................197<br />
5.5 Urban Environmental Challenges . .......................................................................199<br />
5.6 Urban Governance System . ............................................................................205<br />
5.7 Migration and Remittances . ............................................................................210<br />
5.8 Regional Corridors and Cooperation . ....................................................................212<br />
Southern Tier Statistical Annex . .........................................................................213<br />
Bibliography . ............................................................................................221<br />
v
vi<br />
Table of Boxes<br />
Box 1 The Soul and Identity of the <strong>Arab</strong> City . ...................................................................11<br />
Box 2 Preserving the <strong>Arab</strong> Urban Heritage . .....................................................................13<br />
Box 3 Occupied Palestinian Territories: The Impacts of Occupation on the Urban Economy, Urban Form and Urban Mobility . ....40<br />
Box 4 Occupied Palestinian Territories: Displacing the Displaced . ....................................................42<br />
Box 5 Iraqi Refugees in Syria . ...............................................................................43<br />
Box 6 Urban Baghdad: Impact of Conflict on Daily Life . ..........................................................49<br />
Box 7 Gated Communities in Lebanon: Evolution and Development Trends . ...........................................50<br />
Box 8 Islamic Housing Finance . .............................................................................51<br />
Box 9 Egypt’s Informal Settlement Development Facility . ..........................................................53<br />
Box 10 Jordan: Addressing Urban Water Shortages . ................................................................64<br />
Box 11 Syria’s Municipal Administration Modernisation (MAM) Programme . ...........................................70<br />
Box 12 Tunisia and Morocco: Slum Upgrading and Housing Development Experiences ARRU and Al Omran (Models) . ..........98<br />
Box 13 Returning to the Compact City? . .......................................................................99<br />
Box 14 Mauritania’s Twizé Programme . .......................................................................101<br />
Box 15 Islamic Principles and Land . ..........................................................................103<br />
Box 16 Qatar, Saudi <strong>Arab</strong>ia and Bahrain: The Post-oil Knowledge Economy . ...........................................134<br />
Box 17 Impacts of the Global Financial Crisis on Real Estate Development in the United <strong>Arab</strong> Emirates . .....................137<br />
Box 18 Youth, Wealth and Health in the GCC: A light Review of a Heavy Problem . .....................................142<br />
Box 19 Kuwait Expatriate Housing . ..........................................................................148<br />
Box 20 Dubai’s Strategic Transportation Plan . ...................................................................152<br />
Box 21 Responses to Water Shortages in the United <strong>Arab</strong> Emirates . ..................................................155<br />
Box 22 Management of the Holy <strong>Cities</strong> Mecca and Medina . ........................................................162<br />
Box 23 <strong>Arab</strong> Gulf States Cooperation and Regional Integration . .....................................................171<br />
Box 24 The Qatar-Bahrain Causeway: An Emerging Urban Corridor . .................................................172<br />
Box 25 Sudan-Migration to Khartoum and the Dar AlSalam Approach . ..............................................194<br />
Box 26 Yemen-Urban Water Security . .........................................................................200<br />
Box 27 Somalia-Cadastral Development, Property Taxation and Financing Urban Improvements . ...........................208
The <strong>Arab</strong> States Region: Key Findings and Messages<br />
<br />
over the next 40 years.<br />
<br />
be reinforced to prepare them for this growth.<br />
<br />
conflict with the importance of these causes varying by sub-region.<br />
<br />
migrants.<br />
<br />
regional urbanization patterns tend to bring complex issues of region-wide urban governance, authority conflicts and governance<br />
voids. Addressing these governance matters should receive priority attention.<br />
<br />
political participation and erode the relationships between the citizenry and the level of government closest to them.<br />
<br />
of the private sector in urban development.<br />
<br />
countries of the GCC and those of the Southern Tier (Comoros, Djibouti, Somalia, South Sudan, Sudan and Yemen). This should<br />
be addressed as a matter of inter-<strong>Arab</strong> solidarity.<br />
<br />
learned offer important models for other <strong>Arab</strong> countries.<br />
<br />
expensive property registration and limited access to housing finance.<br />
<br />
the capability of generating significant urban social unrest.<br />
<br />
countries is under-utilized while regional physical and policy infrastructures remain uncoordinated.<br />
<br />
vii
viii<br />
Why a State of <strong>Arab</strong> <strong>Cities</strong> Report<br />
The State of <strong>Arab</strong> <strong>Cities</strong> Report 2012 is the first report in<br />
the UN-Habitat series on the state of cities to focus on<br />
the <strong>Arab</strong> world. It presents a collective picture of urban<br />
conditions and trends in each of four <strong>Arab</strong> regions (Maghreb,<br />
Mashreq, Gulf Cooperative Council (GCC) and Southern<br />
Tier), and provides a discussion of the similarities, differences<br />
and linkages between these countries in the context of a larger<br />
<strong>Arab</strong> region.<br />
This report complements the State of the World <strong>Cities</strong><br />
2010/11 report, as well as the chapter on North Africa in the<br />
State of African <strong>Cities</strong> 2008 and 2010 reports. It is particularly<br />
relevant and timely to review urbanization issues in the <strong>Arab</strong><br />
region given the events of 2011.<br />
Home to the oldest urban civilizations in the world, the<br />
<strong>Arab</strong> region is also one of the most urbanized. As of 2010, the<br />
<strong>Arab</strong> countries are home to 357 million residents, 56 per cent<br />
of whom live in cities; by 2050, these countries will be home<br />
to 646 million people, 68 per cent of whom will live in cities.<br />
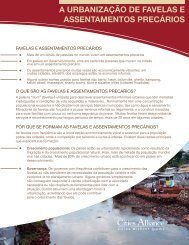
FIGURE I: ARAB SUB-REGIONS AND COUNTRY CLASSIFICATIONS<br />
Mashreq<br />
Maghreb<br />
Gulf Cooperation Council<br />
Southern Tier Countries<br />
Mashreq Maghreb<br />
Executive Summary<br />
Gulf Cooperation<br />
Council<br />
Southern Tier<br />
Countries<br />
Egypt Algeria Bahrain The Comoros<br />
Iraq Libya Kuwait Djibouti<br />
Jordan Morocco Oman Somalia<br />
Lebanon Tunisia Qatar Sudan1 Palestine Mauritania Saudi <strong>Arab</strong>ia Yemen<br />
Syrian <strong>Arab</strong><br />
United <strong>Arab</strong><br />
Republic<br />
Emirates<br />
N<br />
The urban population in <strong>Arab</strong> countries grew by more than<br />
four times from 1970 to 2010 and will more than double<br />
again from 2010 to 2050. Most of the growth to date has<br />
taken place on the peripheries of each country’s primary cities<br />
although, today, secondary cities are experiencing the fastest<br />
rate of growth.<br />
Across the region, around 18 per cent of residents live under<br />
each country’s national poverty line 2 , with significant variation<br />
between the Gulf countries, which have an average per capita<br />
income of USD 29,000, and the Southern Tier countries (not<br />
including Somalia), which have an average per capita income of<br />
USD 1,300. 3 In the Gulf, oil revenues typically represent 40 to<br />
50 per cent of government budgets and as much as 90 per cent<br />
in Sudan. Most oil-rich countries have invested significantly in<br />
infrastructure, housing improvements and subsidies for food,<br />
water and energy. In the oil-poor countries, governments have<br />
been constrained in their ability to dampen the shocks of<br />
rising food and energy prices while simultaneously supporting<br />
the production of affordable housing.<br />
The <strong>Arab</strong> states have made significant strides towards<br />
reaching the MDGs, particularly in health and education,<br />
in spite of limited economic growth in the 1990s and 2000s,<br />
the recent global economic crisis, and continuing sporadic<br />
conflicts in the region. As an aggregate, the region is on track<br />
to halve the proportion of people living below USD 1.25 a<br />
day and has achieved remarkable gains in universal primary<br />
education, the reduction of child and infant mortality and of<br />
the gender gaps in school enrolment.<br />
However, significant disparities continue to exist between<br />
rural and urban areas as well as between the high-income<br />
countries of the Gulf Cooperation Council, which are<br />
expected to meet most Millennium Development Goal targets,<br />
and the countries of the Southern Tier, Mauritania, Iraq and<br />
the Occupied Palestinian Territories, which are expected to<br />
miss most of the Goals’ targets by 2015. The Mashreq and<br />
Maghreb countries face particular challenges in reducing<br />
youth unemployment, child mortality and, in a few countries,<br />
achieving universal primary education. 4<br />
Urbanization has been driven by the region’s economic<br />
development, migration to the oil rich countries, drought<br />
and conflict driven displacement. As of 2010, there were<br />
7.4 million registered refugees in <strong>Arab</strong> countries 5 , most of<br />
them Palestinians and Iraqis living in Jordan and Syria; 9.8<br />
million internally displaced peoples (IDPs), mostly in Sudan,<br />
Iraq, Somalia, Lebanon, Syria and Yemen 6 and 15 million<br />
international migrants in the GCC. Most live in cities and,<br />
together, represent one-third of the sub-region’s population.<br />
All <strong>Arab</strong> governments recognize the importance of the city<br />
as a laboratory for innovation, a magnet for investment and a
Sana’a, Yemen, is one of the oldest continuously inhabited cities in the world. ©Oleg Znamenskiy/Shutterstock<br />
source of job creation as cities have become the main engines<br />
of economic development. Given the relatively low income<br />
disparities in the region, cities are also the key to reducing the<br />
proportion of people living in poverty.<br />
The industrial and service sectors, which are largely<br />
concentrated in cities, contribute over 92 per cent of the<br />
GDP in <strong>Arab</strong> countries. Agriculture, which employs 25 per<br />
cent of the workforce, has been declining as a share of GDP<br />
and was 8 per cent in 2008. 7 Many countries, especially those<br />
that rely heavily on oil revenues, have been diversifying their<br />
economic bases in the manufacturing, service, tourism and<br />
knowledge industries with a particular aim of employing<br />
well-educated youth.<br />
In general, access to services, infrastructure, health,<br />
education attainment is better in cities than in rural areas,<br />
although unemployment and continuing poverty is a growing<br />
urban phenomenon. While a few primary cities have become<br />
the centres of extended metropolitan regions or mega-urban<br />
regions, governments throughout the <strong>Arab</strong> world have<br />
developed policies to channel investments into secondary<br />
cities in an effort to improve rural-urban economic linkages<br />
and foster more equitable development across each country’s<br />
sub-regions.<br />
The high demand for housing, infrastructure and urban<br />
management systems in key cities has stressed the ability of<br />
governments to provide serviced land. In spite of significant<br />
progress in regularising the informal settlements that had proliferated<br />
in the closing decades of the 20 th century, there is still<br />
a significant shortage of affordable housing in most countries.<br />
While the private sector has taken an increasingly active<br />
role in providing housing for households in the upper-income<br />
tiers, there is still a shortage of affordable units for lowerincome<br />
households due to the high rate of family formation.<br />
A lack of housing finance mechanisms, except at the highest<br />
income levels, has hindered the production of formal housing<br />
for lower- and middle-income households. However, the<br />
global economic crisis of 2008 and the ensuing collapse of the<br />
luxury housing market is leading housing developers in the<br />
Mashreq and Maghreb to re-examine opportunities for the<br />
middle-income housing market.<br />
The proportion of sub-standard housing varies from<br />
country to country, with slum dwellings forming isolated,<br />
marginalized pockets in some countries, while in Mauritania<br />
and Southern Tier countries, especially Somalia and Sudan,<br />
67 to 94 per cent of urban residents live in slums with one<br />
or more housing deprivations. In the Maghreb and Mashreq,<br />
middle-to-low-income groups tend to live in informal<br />
settlements that are of decent quality and infrastructure but<br />
lack land title.<br />
Most countries in the Maghreb and the Mashreq have made<br />
significant progress in developing initiatives to increase the<br />
supply of affordable housing through targeted programmes<br />
while the Gulf Cooperation Council countries and Saudi<br />
<strong>Arab</strong>ia have policies to provide their citizens with adequate<br />
housing. In the Gulf countries, the housing conditions of<br />
low-income expatriate workers present a challenge.<br />
Morocco, Tunisia and Egypt have made the most notable<br />
national commitments to slum upgrading and the production<br />
of affordable housing. Although using different models, all<br />
three have developed dedicated national housing agencies<br />
that conduct planning, fund projects with private sector<br />
participation and coordinate implementation on behalf of<br />
local municipalities.<br />
Tunisia was the first <strong>Arab</strong> country to eliminate slums, restore<br />
historic areas, regularize land tenure and ensure basic services<br />
to the urban poor. Morocco, which has the most developed<br />
ix
x<br />
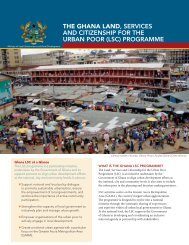
FIGURE II: SLUM PREVALENCE IN ARAB COUNTRIES, 2005-2007 DATA<br />
Source: UN-Habitat Global Urban Observatory.<br />
N<br />
affordable housing programme among <strong>Arab</strong> countries,<br />
reduced the number of slums by 65 per cent between 1990<br />
and 2010. Its national public holding company produces<br />
social housing, resettles slum dwellers and develops new<br />
towns, with market rate units cross-subsidizing the lowerincome<br />
units. Through diverse incentives and subsidies<br />
to promote private sector investment, Egypt’s National<br />
Housing Project aims to build 500,000 affordable housing<br />
units between 2005 and 2011, mostly in new towns. In<br />
2011, Abu Dhabi’s government mandated that all future<br />
housing projects dedicate 20 per cent of units to affordable<br />
housing. These initiatives and lessons learned from their<br />
implementation offer important models for consideration<br />
by other <strong>Arab</strong> countries as they embark on new affordable<br />
housing programmes.<br />
Emerging trends<br />
0 2,500km<br />
The major challenges facing the region are the need to provide<br />
gainful employment to its young people and anticipated<br />
climate change. With 60 per cent of the population below 25<br />
years of age, <strong>Arab</strong> countries face the challenge of providing<br />
employment opportunities for their young people whose<br />
current unemployment rates range from 11 per cent in Kuwait<br />
to 35 per cent in Morocco. Disenchantment and poverty<br />
induced by a lack of mobility has been one of the fuelling<br />
mechanisms for the recent political polarization of the region.<br />
With the exception of Iraq, <strong>Arab</strong> countries have some<br />
of the scarcest water resources per capita in the world<br />
and groundwater reserves are being depleted at alarming<br />
rates. Although 85 per cent of the region’s water is used<br />
for agriculture, most countries in the region import more<br />
than 50 per cent of their caloric intake. Climate changeinduced<br />
temperature increases and precipitation declines<br />
are projected to increase water scarcity and the frequency of<br />
No data<br />
0 - 15%<br />
15.1 - 50%<br />
50.1 - 70%<br />
70.1 - 100%<br />
severe droughts and also decrease agricultural productivity<br />
by 10 to 40 per cent, potentially leading to further povertyinduced<br />
rural to urban migration.<br />
Desertification and the associated threats of future water<br />
and food insecurity for its growing urban populations are<br />
among the key defining problems of the region. In addition,<br />
most of the region’s major cities, economic centres and<br />
transportation hubs activity are in low-lying, coastal areas. A<br />
rise in sea level could be disastrous for many of the region’s<br />
densely populated coastal cities.<br />
Faced with these pressures, most of the region’s governments<br />
have embarked on spatial interventions to guide new urban<br />
developments. Many cities are drafting strategic plans, linking<br />
various development projects and renewal programmes under<br />
the umbrella of a broader vision. New cities are being created<br />
as centres of excellence, innovation, technology and research.<br />
<strong>Cities</strong> are also marketing themselves as international tourism<br />
destinations, putting more emphasis on marketing their<br />
historic and cultural assets than ever before. Whether<br />
through culture, education and research or financial niches,<br />
cities in the <strong>Arab</strong> world are putting their mark on the map.<br />
To implement these plans successfully and manage<br />
increasingly large and complex urban systems, governments<br />
in <strong>Arab</strong> countries will need to better coordinate the<br />
complementary roles of central and local governments<br />
better and increase the participation of the private sector in<br />
urban development. Historically, these countries have been<br />
highly centralized and the devolution of responsibilities<br />
to local authorities has been uneven, with a tendency for<br />
central governments to devolve responsibilities without a<br />
commensurate redistribution of funding or giving local<br />
authorities the power to raise revenue at the local level. At<br />
the time of writing, the repercussions of the 2011 protests<br />
remain unclear, although the widespread debates demonstrate<br />
the need for a new participatory approach to governance.
Regional Subdivision and Sub-Regional Differences<br />
As a result of the ongoing conflicts in Palestine and Iraq<br />
and past conflicts in Lebanon, the Mashreq countries are<br />
home to 50 per cent of the world’s registered refugees. Their<br />
presence, as well as internal rural-urban migration, has placed<br />
immense pressure on cities. Informal settlements, which tend<br />
to lack improved sanitation but otherwise offer decent housing<br />
conditions, have proliferated in Mashreq cities, with as many<br />
as 62 per cent of households in Greater Cairo living in such<br />
settlements. Except for Iraq, the Mashreq countries are oil poor<br />
and have fiscal deficits that constrain their ability to subsidize<br />
costs to the poor significantly as food and energy prices rise.<br />
The Maghreb countries are typically more than 50 per<br />
cent urbanized, and have slowed in their urban growth rates.<br />
Current urban policy focuses on diversifying their economies,<br />
linking major urban areas and planning to redirect growth to<br />
secondary cities in the interior. Agriculture remains a major<br />
employment base for Morocco and saw a 17 per cent growth<br />
in Algeria.<br />
While young people under 25 years of age comprise 48 per<br />
cent of the total population, their unemployment rate reaches<br />
70 per cent among men with only a primary educations and<br />
this represents the bulk of total unemployment. The Maghreb<br />
countries have made the most significant gains in reducing the<br />
number of urban households living with shelter deprivations;<br />
their efforts demonstrate that slum upgrading and service<br />
provision for the poor can be achieved with a strong political<br />
commitment.<br />
Given that 90 per cent of the Gulf Peninsula is desert,<br />
Gulf Cooperation Council countries are among the<br />
most urbanized in the world and several of the emirates<br />
function as city-states. These countries have achieved major<br />
milestones in infrastructure, health and education, and<br />
have reached their Millennium Development Goals. 8 Faced<br />
with declining oil reserves and the rising cost of subsidies in<br />
energy, water and housing, the policy focus now addresses<br />
economic diversification, the absorption of nationals into<br />
the private sector labour force, affordable housing and<br />
environmental sustainability. Highly-ambitious projects in<br />
public transportation planning and urban environmental<br />
sustainability are underway, although urban planning is still<br />
often done as a piecemeal effort.<br />
Following prolonged periods of conflict, governments in the<br />
Southern Tier have been unable to secure basic services for<br />
most of their citizens. With the exception of Djibouti, these<br />
countries are still predominantly rural but are now experiencing<br />
the highest urbanization rates in the region. The ability of these<br />
less-developed <strong>Arab</strong> countries to cope with rapid urbanization<br />
and move from rural to urban-based settlement patterns will<br />
be of critical importance in the coming decades.<br />
Looking forward, climate change will worsen droughts in<br />
the Horn of Africa. The danger of new conflicts over water<br />
and oil rights may complicate the orderly split of Sudan into<br />
North and South.<br />
With intra-regional exports accounting for only 8.5 per<br />
cent of total exports in 2007, the <strong>Arab</strong> region is one of<br />
the least integrated with regards to internal trade, due to a<br />
lack of economic complementarity between countries and<br />
uncoordinated physical and policy infrastructures. 9 New<br />
efforts aiming to establish a network of roads, railways, ports<br />
and streamlined customs points throughout the Mashreq and<br />
Maghreb will help to incentivize trade and transport through<br />
the region.<br />
<strong>Arab</strong> countries have signed a number of bilateral and<br />
multilateral trade agreements with each other, African<br />
countries, the European Union and the United States. They<br />
include the Pan-<strong>Arab</strong> Free Trade Area (PAFTA), the emerging<br />
EURO-MED free trade area and the Agadir Agreement for<br />
a Free Trade Zone between Morocco, Tunisia, Egypt and<br />
Jordan.<br />
To strengthen regional integration, several countries<br />
are undertaking major projects to improve road networks,<br />
railways and electrical grids, as well as streamlined trade<br />
and customs procedures. These include a north-south<br />
corridor that would link the European Union and the Gulf<br />
Cooperation Council (GCC) countries through Turkey,<br />
Syria and Jordan; two east-west corridors that would link<br />
Syrian ports with Iraq and over USD100 billion in rail<br />
improvements in the GCC that connect Jeddah, Riyadh and<br />
Bahrain, as well as Kuwait, Muscat and the Mashreq and<br />
Maghreb. Various planned initiatives to build concentrated<br />
solar and wind power plants throughout the Maghreb, with<br />
a potential to expand into the Mashreq and GCC, could also<br />
transform regional economies.<br />
Perhaps the single most transformative initiative underway<br />
is the planned network of concentrated solar and wind power<br />
plants throughout the Maghreb, with a potential to expand<br />
into the Mashreq and GCC. With the EU target to produce<br />
20 per cent of its energy consumption from renewable<br />
sources by 2020, and visions for a Mediterranean Union,<br />
Europe-North African energy networks are being developed<br />
and expanded. This could bring significant investment and<br />
economic development opportunities to the region and<br />
create an economic base to balance the negative impacts of<br />
climate change and urbanization.<br />
While many daunting challenges continue to face the<br />
region, considerable progress has been made toward the<br />
achievement of a more sustainable and inclusive urbanization.<br />
The benefits that many <strong>Arab</strong> countries have received from oil<br />
revenues in the past 50 years have led to significant progress<br />
in lifting living standards in the region and provide the means<br />
with which to complete the Millennium Development Goals,<br />
particularly in the fields of education, health and disposable<br />
income. Through this discussion of current conditions and<br />
trends, this report aims to promote the good management<br />
and improvements needed to help cities serve as engines of<br />
growth and innovation.<br />
xi
xii<br />
CHAPTER ONE<br />
THE STATE OF ARAB CITIES 2012<br />
For the foreseeable future, Cairo will remain the sole <strong>Arab</strong> megacity. ©Joel Carillet/iStockphoto
1.1<br />
Overview<br />
Summaries of Sub-regional Sections<br />
The <strong>Arab</strong> region, home to 357 million people in 2010,<br />
is one of the most urbanized in the world, with 56<br />
per cent of its residents living in cities. Past and<br />
emerging conflicts and worsening droughts are major drivers<br />
of urbanization. Within the region, the Gulf Cooperation<br />
Council is experiencing the fastest rate of total population<br />
growth, while the Southern Tier is experiencing the fastest<br />
rate of urbanization. Although both rates are slowing, total<br />
population is still projected to double by 2050, by which time<br />
the region will be 68 per cent urbanized. This trend will place<br />
continued pressure on urban infrastructure, housing and<br />
social services.<br />
With 53 per cent of the population under 25 years of age,<br />
the demands of maturing youth for jobs and housing will<br />
add to the pressures on urban systems. Affordable and decent<br />
housing is a major challenge throughout the region, including<br />
in the Gulf States. In countries that have experienced<br />
continued conflict, high rates of poverty and pervasive<br />
political instability - such as Sudan, Somalia, Comoros,<br />
Yemen, Lebanon and Iraq - these demographic trends have<br />
translated into pervasive slums, which comprise 50 to 95 per<br />
cent of total urbanization.<br />
The proliferation of slums and peri-urban informal<br />
settlements is the result of a scarcity of serviced land and<br />
affordable housing options. Slums in the region include<br />
older, deteriorated buildings within the urban fabric and,<br />
particularly in the Southern Tier, newly-constructed housing<br />
that is not durable and lacks most services. In refugee camps,<br />
residents often also face social trauma.<br />
In contrast, informal settlements are mostly constructed of<br />
durable materials, often as multi-storey buildings on former<br />
agricultural land, and their informality is generally the result<br />
of their unplanned nature and lack of registered titles. Their<br />
residents typically lack waterborne sewerage but, on the<br />
whole, have access to potable water, electricity and some form<br />
of sanitation. These settlements attract middle-class families,<br />
with wage earners in professional or managerial occupations<br />
in the public and private sectors.<br />
Unemployment, particularly among the young, is<br />
one of the most notable challenges in the region. In the<br />
Maghreb and Mashreq, total unemployment ranges from<br />
9 per cent to 26 per cent while rates in the Southern Tier<br />
range from 15 to 60 per cent. While the GCC has low rates<br />
of unemployment, ranging from 0.5 per cent in Qatar to<br />
5.1 per cent in Saudi <strong>Arab</strong>ia, because of a strong system<br />
of employing nationals in the public sector. All the same,<br />
young people make up a disproportionate component of the<br />
unemployed. They account for 37 to 82 per cent of total<br />
unemployment depending on the country. Unemployment<br />
rates of youth with secondary and tertiary degrees is<br />
particularly high in the Maghreb, and contributes to youth<br />
disenchantment and despair in the current political systems.<br />
As a result of the events of 2011, countries are engaged<br />
in dialogue to adapt governance systems or in some cases<br />
build new institutions from scratch. These efforts to make<br />
government more transparent and inclusive are mirrored<br />
in economic systems. In order for cities and countries<br />
to reposition themselves as global economies, attract<br />
foreign investment and, particularly in the Maghreb,<br />
make the transition from agriculture-based to services and<br />
industry economies, they are gradually reforming land use<br />
management, banking and finance systems.<br />
FIGURE 1: ARAB REGIONS’ URBAN POPULATION TREND (1970-2050) FIGURE 2: ARAB REGIONS' URBANIZATION TREND (1970-2050)<br />
Population (millions)<br />
450<br />
400<br />
350<br />
300<br />
250<br />
200<br />
150<br />
100<br />
50<br />
0<br />
1970<br />
1990<br />
GCC Maghreb Mashreq<br />
2010<br />
2030<br />
Southern Tier<br />
2050<br />
<strong>Arab</strong> Countries<br />
Source: WUP 2009. Source: World Urbanization Prospects: The 2009 Revision, UNDESA, New York, 2010.<br />
Urbanization %<br />
100<br />
90<br />
80<br />
70<br />
60<br />
50<br />
40<br />
30<br />
20<br />
10<br />
0<br />
1970<br />
1990<br />
GCC Maghreb Mashreq<br />
2010<br />
2030<br />
Southern Tier<br />
2050<br />
<strong>Arab</strong> Countries<br />
1
2<br />
Mashreq Regional Summary<br />
Population and Urbanization. The countries in the<br />
Mashreq region are moderately to highly urbanized with<br />
urban populations varying in total percentage terms from<br />
43 (Egypt) to 87 (Lebanon). Urban and total growth rates<br />
have been relatively low (1 to 3 per cent) and will continue<br />
to decline.<br />
With limited options for expansion in the larger cities,<br />
governments are placing an emphasis on secondary cities<br />
and satellite locations. Lebanon’s draft National Master Plan<br />
proposed to shift the emphasis of investments from Beirut<br />
to Tripoli, Zahle-Chtaura, Saida, Nabatieh and Tyre. It also<br />
plans to re-establish the Beirut-Tripoli rail service. In Egypt,<br />
the government has created new towns to divert growth from<br />
Cairo to parallel satellite locations in the desert. In Jordan,<br />
the government has revitalized the urban cores of Salt,<br />
Ma’daba, Jerash and Karak in an effort to shift growth away<br />
from Amman.<br />
Economic Role of <strong>Cities</strong>. Many of the Mashreq region’s<br />
economic activities and employment opportunities are<br />
concentrated in its primary cities. Across the region, poverty has<br />
declined slightly and has been concentrated in particular parts<br />
of the region, especially in urban areas. Unemployment has<br />
been higher in rural areas; in urban areas, it disproportionately<br />
affects youth and women.<br />
Educational attainment and literacy rates tend to be higher<br />
in urban areas as are health services. For instance, in Jordan,<br />
urban residents are much more likely to achieve a higher<br />
level of education. In Syria, most of the health facilities are<br />
concentrated in Damascus and Aleppo.<br />
Urban Development and Housing. In spite of the Mashreq<br />
countries being on track to achieving the MDGs, housing costs<br />
are high relative to urban incomes and the growth of informal<br />
settlements continues to be a major challenge in the region as<br />
the formal housing and mortgage markets have focused on the<br />
upper-middle and upper-income classes. Mortgage markets<br />
are underdeveloped and provide financing mostly to upper-<br />
and middle-class residents.<br />
Most residents purchase properties with cash, loans from<br />
family members and friends, remittances and informal loans.<br />
Access to housing finance has been complicated by the<br />
cumbersome property registration system, which often does<br />
not provide residents with the collateral they need to secure<br />
a mortgage.<br />
The construction of affordable housing is limited by the<br />
lack of affordable serviced land and access to housing finance<br />
for both developers and homebuyers. In Syria, 38 per cent<br />
of the total population lives in informal settlements and,<br />
in Damascus, informal settlements are growing at 40 to 50<br />
per cent per year. In Jordan, 16 per cent of urban residents<br />
live in informal settlements. In Egypt, it is estimated that in<br />
the Greater Cairo Region 62 per cent of households live in<br />
informal settlements.<br />
Some countries have constructed affordable housing.<br />
Jordan is expected to develop 100,000 affordable housing<br />
units between 2008 and 2013 and has also focused on the<br />
construction of infrastructure and the redevelopment of<br />
slum areas. As part of its policy to develop new towns in the<br />
desert to preserve agricultural land, Egypt has been producing<br />
15,000 to 35,000 housing units per year and has the goal of<br />
creating 500,000 affordable units. In 2011, Iraq announced a<br />
USD 35 billion investment programme to address a housing<br />
backlog estimated at 1.5 million units. Both Syria and<br />
Lebanon have had limited and uncoordinated responses to<br />
informal development.<br />
Environment and Transportation. The Mashreq countries<br />
have an estimated 80 million cubic metres of renewable water<br />
supply but use 88 million cubic metres annually, gradually<br />
depleting their aquifers. In addition, the systems suffer from<br />
significant water losses (35-50 per cent in urban areas), further<br />
contributing to the water scarcity.<br />
Egypt, Jordan and Syria in particular, are using water at<br />
unsustainable levels. Water rationing and tariff structures are<br />
needed to reduce water use, but are difficult to implement. In<br />
an effort to reduce demand of fresh water, governments are<br />
reusing wastewater, particularly in agriculture.<br />
Climate change will affect the Mashreq countries through<br />
higher temperatures, shorter wet seasons, more erratic rain and<br />
rising sea levels. The combined impact of meeting increased<br />
demand, protecting and developing new water resources,<br />
hydropower loss and ecosystem damage could represent<br />
a cost between 1 to 7 per cent of GDP depending on the<br />
country. Adapting to climate change will require better water<br />
conservation, a more optimal allocation of water use rights,<br />
a reduction in fossil fuel reliance, investments in renewable<br />
energy and an increase in international cooperation for<br />
resource sharing.<br />
The reliance of the Mashreq region on rain-fed agriculture<br />
makes it vulnerable to the effects of climate change. Although<br />
governments have provided food subsidies and higher<br />
government wages, the benefits often do not always reach<br />
those most in need.<br />
Car ownership rates are increasing in most countries in<br />
the region and there has been an underinvestment in public<br />
transportation. Only Cairo maintains an extensive public<br />
transport system, which carries 2 million passengers per<br />
day. Damascus plans to create a metro system and Amman<br />
is developing three new light rail lines and a new rapid bus<br />
transit system. Although still heavily dependent on fossil<br />
fuels, some countries are supporting wind and solar energy<br />
alternatives. With increased vehicle efficiency and better<br />
public transportation options, the airborne particulate matter<br />
has decreased in all countries.<br />
Urban Governance Systems. Planning in the Mashreq<br />
region is highly centralized and most local governments do<br />
not have the power to set local taxes and fees and depend on<br />
central government transfers to finance their activities and<br />
services that are typically administered through local offices of<br />
line ministries.
Amman, Jordan. In Jordan, 16 per cent of urban residents live in informal settlements. ©Andy Clarke/Shutterstock<br />
In Egypt, 80 to 90 per cent of local budgets originate from<br />
the central government; only two governorates – Alexandria<br />
and Qina – collect user fees to finance their own development<br />
priorities. In Syria, governance is highly centralized but<br />
there has been an effort to decentralize decision making and<br />
strengthen local councils. Only the Occupied Palestinian<br />
Territories have a truly decentralized financial system where<br />
each city must raise its own revenues.<br />
With local governments providing limited services, civil<br />
society organizations have played an important part in<br />
supplying services to the poor and this is mainly related to<br />
health, education, relief services and cultural fields.<br />
Migration and Remittance. Mashreq countries have been<br />
both receivers and senders of migrant workers. Generally,<br />
well-educated younger professionals travel abroad in search<br />
of better employment opportunities while refugees and less<br />
skilled workers migrate within the region in search of a safe<br />
place to live and job opportunities.<br />
For instance, highly-skilled Egyptians, Jordanians, Lebanese<br />
and Palestinians plus semi-skilled Egyptian workers are working<br />
in the oil-producing countries, while semi-skilled workers from<br />
Egypt, Syria and Asian countries work in the industrial and<br />
service sectors of oil-producing nations. In addition, Jordan<br />
and Syria have also received Palestinian, Lebanese and Iraqi<br />
refugees. Remittances represent a significant per cent of GDP:<br />
16 per cent in Jordan and 22 per cent in Lebanon.<br />
Maghreb Regional Summary<br />
Population Growth and Urbanization. The Maghreb<br />
countries are highly urbanized with all countries in the region<br />
but for Mauritania more than 50 per cent urbanized by 2010.<br />
Recent urban growth rates have been relatively low (1-3 per<br />
cent) and will continue to decline, although the need to<br />
accommodate urban expansion remains.<br />
Most countries in the region are placing an emphasis on<br />
secondary cities and areas outside of the main agglomerations<br />
to alleviate the pressure on primary coastal locations. In<br />
Morocco, the publicly-owned holding company Al Omrane<br />
has created four new towns within 5 to 15 km of existing<br />
agglomerations to provide affordable, adequate housing to<br />
accommodate the growing population.<br />
Economic Role of <strong>Cities</strong>. While Libya and Algeria are<br />
dependent on oil, Tunisia and Morocco are more focused<br />
on industry and services. Many of the countries have been<br />
diversifying their economies with Algeria, for instance,<br />
having placed a greater emphasis on fishing, tourism and<br />
renewable energy. The government recently launched a 15year<br />
tourism development plan to attract investments and<br />
visitors in desert and coastal cities as well as cultural sites in<br />
Algiers, Annaba, Constantine and Oran. In Morocco, the<br />
government has undertaken a regional tourism development<br />
plan that includes investments in infrastructure and the<br />
rehabilitation of the historic medinas and other cultural<br />
sites.<br />
In spite of the historical concentration of economic activities<br />
in coastal cities, there has been a recent trend to develop<br />
secondary cities. Tunisia is attempting to draw activities<br />
inward by creating competitive technopoles in secondary cities<br />
away from the coastal areas and Algeria’s regional economic<br />
development plans will shift some economic activities from<br />
Algiers to secondary cities.<br />
3
4<br />
Unemployment tends to be greater in urban areas, while<br />
poverty rates tend to be lower than in rural areas. Despite<br />
relatively high rates of educational attainment, unemployment<br />
in the Maghreb region is still high for youth, women and<br />
for those with higher degrees, particularly in urban areas.<br />
Whereas inequality is relatively low in the region it is often<br />
higher in urban areas, especially in large cities.<br />
Urban Development and Housing. The supply of<br />
affordable housing has been a serious challenge in the region.<br />
Lower-income residents are often priced out of the market by<br />
rapid increases in land prices and limited access to credit. The<br />
situation is complicated further by cumbersome and costly<br />
property registration processes that hamper acquiring the<br />
legal title necessary to obtain a loan.<br />
As a result, lower-income residents are pushed to informal<br />
settlements on the urban periphery or in illegal and undesirable<br />
locations. In spite of the fact that Maghreb countries have<br />
made great strides to eliminate slums through upgrading and<br />
resettlement programs, often through partnerships between<br />
public agencies and the private sector, there has been a steady<br />
growth in informal settlements.<br />
Environment and Transportation. Although most urban<br />
residents in the Maghreb have access to water and sanitation,<br />
especially in urban areas, water security is an important issue<br />
as all countries in the region are water stressed and have<br />
withdrawn a significant portion of their aquifer resources. To<br />
increase access to water and reduce pollution, countries have<br />
implemented such programs as wastewater reuse in Morocco<br />
and Tunisia and aquifer abstraction and desalination in<br />
Algeria.<br />
The region is a net importer of food and food security is<br />
a major challenge as prices have been increasing due to such<br />
impacts of climate change as greater evaporation and severe<br />
flooding. With reduced levels of precipitation and higher<br />
temperatures, it is estimated that agricultural and pastoral<br />
productivity will decline by as much as 10 per cent in due<br />
course. In an effort to ensure food security, Maghreb countries<br />
are trying to increase agricultural productivity with better<br />
irrigation, wastewater reuse and desalination. They are also<br />
stockpiling food, reducing taxes on grains and providing food<br />
subsidies to ensure affordability.<br />
Energy consumption is relatively low in Morocco and<br />
Tunisia, which are net importers, while Algeria is on par with<br />
the world average and Libya consumes more than twice the<br />
per capita world average. With the increasing demand for<br />
energy and associated higher carbon emissions, countries<br />
are looking for alternative sources such as solar and wind in<br />
Morocco and Tunisia.<br />
The amount of urban solid waste produced has risen and is<br />
often deposited in open dumps rather than sanitary landfills.<br />
Algeria, Morocco and Tunisia all have national strategies for<br />
improving waste management and these include improved<br />
waste collection, constructing additional sanitary landfills and<br />
rehabilitating open dumps.<br />
Many urban dwellers depend on public transit systems<br />
that are obsolete and overcrowded. In recent years Tunisia,<br />
Algeria, Libya and Morocco have been investing in light rail<br />
and subway systems in urban areas. Even though the rate of<br />
private car ownership is still relatively low, it is on the rise due<br />
to subsidized low fuel costs, especially in Libya and Algeria,<br />
and the region’s extensive road networks.<br />
Urban Governance Systems. Maghreb countries have a twotier<br />
local governance structure with provinces or governorates<br />
at the regional level and municipalities and communes at the<br />
local level. De-concentrated offices of central ministries at<br />
the governorate level provide the important public services<br />
including health, education and housing. 10<br />
Governors are appointed and, in some cases, provinces<br />
are further divided into districts where chiefs are appointed.<br />
Local councils are elected and municipal activities focus<br />
mainly on the management of services such as streets, paving,<br />
lighting, open space and solid waste collection. 11 Reform of<br />
intergovernmental fiscal relations to increase local revenue<br />
and enhancement of municipal financial capacity are vital to<br />
meaningful participation, the improvement of residents’ living<br />
conditions and effective accountability in local governance.<br />
Within the region women received the right to vote in<br />
the 1950s and 1960s, but their participation in politics has<br />
been fairly limited. In Algeria, Libya and Morocco, women<br />
comprise only 8 to 11 per cent of the lower parliamentary<br />
houses, as compared to a world average of 15 per cent.<br />
Some governments have been increasing opportunities and<br />
requirements for women’s participation; in Morocco, for<br />
example, there are established parliamentary and local council<br />
quota systems.<br />
Migration and Remittances. With high unemployment<br />
rates, with the exception of Libya and Mauritania, the<br />
Maghreb countries have been net exporters of workers whose<br />
major destinations are Belgium, France, Germany, Italy, the<br />
Netherlands, Spain and the USA.<br />
The Maghreb has also been a transit area for sub-Saharan<br />
migrants. Recently, Europe has restricted the number of<br />
migrant worker quotas and, as a result, migrants from sub-<br />
Saharan countries have settled in Oran, Algiers, Tripoli and<br />
Benghazi.<br />
The Maghreb region also receives labourers from Bangladesh,<br />
China, India and Pakistan as well as refugees from Western<br />
Sahara. Remittance inflows to Algeria, Morocco and Tunisia<br />
contribute significantly to family incomes. In Morocco, it<br />
is estimated that 600,000 households would fall below the<br />
poverty line without support from family members abroad.<br />
GCC Regional Summary<br />
Population and Urbanization. The Gulf Cooperation<br />
Council (GCC) countries have a population of over 39<br />
million, of whom 67 per cent live in Saudi <strong>Arab</strong>ia. With 80<br />
per cent of the population living in urban areas, it is one of<br />
the most urbanized regions in the world.<br />
Nearly 40 per cent of the region’s population is foreign<br />
born, most of whom are migrant labourers from Asia. Total<br />
population growth in the GCC countries has been declining
Qatar. Housing finance in Gulf countries is dictated by Shari’a law. ©Komar/Shutterstock<br />
and is expected fall to an annual growth rate of 1 to 1.5 per<br />
cent by 2030.<br />
GCC countries, with the exception of Qatar, have adopted<br />
growth management spatial development strategies. The plans<br />
share a focus on shifting growth to planned secondary cities<br />
located along transportation corridors served by public transit,<br />
developing affordable housing, and promoting environmental<br />
sustainability. Certain country strategies emphasize particular<br />
aspects, such as land reclamation in Bahrain.<br />
Economic Role of <strong>Cities</strong>. The national income of GCC<br />
countries overwhelmingly relies on oil and gas revenues: Qatar<br />
(45 per cent), Oman (66 per cent), UAE (74 per cent), Bahrain<br />
(76 per cent), Saudi <strong>Arab</strong>ia (82 per cent) and Kuwait (95 per<br />
cent). As a result of oil revenue, they have some of the highest<br />
GDPs per capita in the world. Oil revenues range from 10 and<br />
13 per cent of GDP in the UAE and Bahrain, respectively, to<br />
40 to 50 per cent in Kuwait, Oman, Qatar and Saudi <strong>Arab</strong>ia.<br />
Projected declines in oil supply will significantly limit<br />
governments’ ability to maintain current subsidies in water,<br />
energy, food and housing. All GCC countries are therefore<br />
trying to diversify their economies and become more integrated<br />
into the world economy through the development of<br />
knowledge-based activities and tourism. To attract investment,<br />
countries have opened their economies, provided support for<br />
potential investors, increased infrastructure investments and<br />
improved e-government and e-commerce.<br />
Expatriate males comprise a significant portion of the labour<br />
force employed in the private sector, reaching 94 to 96 per<br />
cent in Qatar and the UAE, while the public sector is the main<br />
employer of their nationals, including 77 per cent in Kuwait.<br />
Youth unemployment is a major challenge to governments<br />
as they try to address the mismatch between a high demand<br />
for low-paid foreign workers and an absence of well-paid<br />
jobs that can be filled by their own nationals. Many GCC<br />
countries are making visas more restrictive, setting caps on<br />
foreign labour participation, and creating institutions to help<br />
build the capacity of citizens. The distribution of wealth is<br />
unequal in all GCC countries, with concentrations of poverty<br />
among both expatriate migrants and urban migrants from<br />
internal desert locations.<br />
Urban Development and Housing. The discovery of oil in<br />
the 1960s transformed the mud-walled towns in the Gulf into<br />
international cities with Western-style urban grids, extensive<br />
highway networks and peripheral suburbs with modern<br />
villas. Wealthy nationals and expatriates tend to live in the<br />
cosmopolitan city centres and suburban compounds, while<br />
low-paid expatriate workers, rural migrants and refugees live in<br />
the remains of historic settlements, in temporary housing on<br />
construction sites and in informal settlements. As part of its<br />
Jeddah without Slums programme, Jeddah plans to redevelop<br />
older areas in the city centre and reduce the total number of<br />
residents living in informal areas to 300,000.<br />
The constitutions of GCC countries require governments<br />
to provide homes, land or zero-interest home construction<br />
loans to their citizens, a benefit limited in some countries<br />
to men or citizens earning less than set income levels. Rising<br />
5
6<br />
populations, escalating land costs due to speculation and a<br />
growing preference for villas instead of flats are making it<br />
harder for the government to provide loans to meet housing<br />
demand among low- and middle-income households. For<br />
instance, the wait list for government housing is 15 years<br />
in Kuwait and the Saudi government has recently frozen<br />
land grants in spite of a large backlog including as many as<br />
200,000 applications in Jeddah.<br />
The sharp market correction of real estate prices in 2008<br />
demonstrated the degree to which property development had<br />
become speculative, particularly in Bahrain, Dubai and Qatar.<br />
Housing finance in the Gulf countries is limited by the<br />
Shari’a’s prescriptions on interest-charging banking services.<br />
Housing finance through Islamic banks remains limited and<br />
is accessible mainly by the wealthy. As housing developers<br />
typically raise their own financing, there is a chronic<br />
undersupply of affordable housing. Saudi <strong>Arab</strong>ia, which has<br />
the least developed housing finance market in the region,<br />
enacted its first mortgage law in 2008. Affordable housing<br />
programmes tend to be poorly capitalized and, given the lack<br />
of fines and fees, many borrowers defer or default on their<br />
payments.<br />
Environment and Transportation. Revenues from oil<br />
have allowed GCC governments to subsidize the cost of<br />
water, electricity, oil, gas and food for decades, resulting<br />
in some of the highest per capita rates of water and energy<br />
consumption and waste generation in the world. Electricity<br />
costs on average USD 0.12 per kWh to produce in the Gulf,<br />
but is sold for USD 0.04 per kWh.<br />
With oil production peaking and predicted to become<br />
depleted in ten to 40 years, depending on the country,<br />
GCC governments are now investing heavily in alternative<br />
solutions, such as renewable and nuclear energy, wastewater<br />
reclamation, and waste recycling. Given the political difficulty<br />
of implementing tariff and management policy reforms, the<br />
focus has been on technological and efficiency improvements.<br />
With its arid climate and rapidly-growing population, the<br />
Gulf is one of the world’s most water-scarce regions. Despite<br />
the high cost of desalinization, water tariffs in the GCC are<br />
among the lowest in the world, and it was free for many<br />
years in Doha. As governments re-evaluate water resource<br />
management, they are focusing on three main strategies:<br />
increasing the capacity of desalination plants; reforming<br />
tariffs and educating consumers and reducing domestic<br />
agriculture and promoting wastewater reuse.<br />
The most prevalent method of waste disposal is in sanitary<br />
landfills, which have become overwhelmed by the increasing<br />
volumes of waste. Composting and recycling is limited by the<br />
lack of a domestic reuse market. The UAE is implementing<br />
multiple initiatives to reduce waste generation, including a<br />
phasing out of plastic shopping bags by 2012, the launch of<br />
a construction and demolition waste recycling plant in Abu<br />
Dhabi and the development of a waste-to-energy incineration<br />
plant in Dubai.<br />
The Gulf has heavily invested in extensive road networks,<br />
with high-capacity highways and arterials encircling<br />
neighbourhoods and cities. The low cost of fuel in the GCC<br />
has been an incentive to motorization, which is now on par<br />
with that of high-income countries and has led to severe<br />
congestion in city centres. Uniquely among <strong>Arab</strong> countries<br />
facing similar challenges, the GCC is implementing ambitious<br />
urban transportation master plans to reduce congestion and<br />
improve public transit and pedestrian networks and the<br />
general quality of urban life.<br />
Urban Governance Systems. All aspects of government<br />
in the GCCs are highly centralized, including planning<br />
and urban administration. Ministries develop national,<br />
regional and local urban policies, while municipal authorities<br />
implement local plans. Despite efforts to delegate more<br />
powers to municipalities, the Saudi <strong>Arab</strong>ian government<br />
retains significant control over local governance, including<br />
the right to dissolve government, remove members of local<br />
councils and set local tax rates.<br />
Larger cities in the kingdom have greater autonomy;<br />
Medina’s Urban Observatory has received wide recognition<br />
throughout the <strong>Arab</strong> world and was awarded the Habitat<br />
Scroll of Honour award in 2009. In the smaller emirates, the<br />
national planning agency prepares national, metropolitan<br />
and local level plans.<br />
GCC cities rely on central government transfers to pay<br />
for both capital investments and operating costs. The lack of<br />
accountability for their development decisions often results<br />
in wasteful land consumption patterns and an increasing<br />
reliance on private cars for transport.<br />
While attitudes towards women are more conservative<br />
in the GCC than in the Mashreq and Maghreb, and their<br />
labour force participation rates far behind that of men, the<br />
number of women with a higher education degree working<br />
as civil servants and gaining senior positions in government<br />
is quickly rising.<br />
Migration and Remittances The GCC is the major<br />
recipient of migrants in the region. In 2010, the foreignborn<br />
percentage of the population was 87 in Qatar, 70 in the<br />
UAE, 69 in Kuwait, 39 in Bahrain and 28 in Oman. About<br />
one-quarter of the 15 million migrant workers in the GCC<br />
are <strong>Arab</strong>s, with the balance including a mix of well-paid<br />
expatriates from developed countries and low-paid sponsored<br />
workers from South and Southeast Asia. The Saudi border is<br />
a major transit point for refugees from the Horn of Africa.<br />
The Gulf has become one of the top remitting regions in the<br />
world, with 2009 remittances equalling 7 per cent of GDP in<br />
Bahrain, Kuwait and Saudi <strong>Arab</strong>ia and 11 per cent in Oman.<br />
Most low-paid migrant workers come to the GCC through<br />
the sponsorship (kafala) system, and immigration and<br />
sponsorship laws give sponsoring employers broad powers<br />
over workers. Poor living conditions, economic exploitation<br />
and the lack of public oversight has drawn international<br />
criticism and growing internal opposition within GCC<br />
governments. A common government response to criticism<br />
over worker living conditions has been to rehouse workers<br />
in new “labour towns” that meet and exceed international<br />
standards but still segregate them from the local population.
Southern Tier Regional Summary<br />
Population and Urbanization. The Southern Tier is<br />
home to around 80 million people, 29 million of whom live<br />
in cities. Except for Djibouti, which is 76 per cent urbanized,<br />
most countries have low to moderate levels of urbanization<br />
(30-40 per cent) but are urbanizing rapidly as a result of<br />
conflict, environmental degradation, severe droughts and<br />
rural poverty.<br />
The highest urban growth rates at present are 5 per cent in<br />
both Sudan and Yemen; in the past 15 years, major Somali<br />
towns grew by 300 to 500 per cent. Those under 25 years of<br />
age comprise from 35 to as much as 45 per cent of the total<br />
population.<br />
Urbanization has typically taken the form of unplanned<br />
expansion on the periphery, making the provision of services<br />
difficult. Although most Southern Tier countries do not have<br />
comprehensive national or urban spatial strategies, they do<br />
have infrastructure improvement plans for roads, ports, and<br />
highways as well as poverty reduction strategies to promote<br />
economic growth and improve governance.<br />
Urban plans are emerging at the local and regional level,<br />
particularly for major cities such as Khartoum, Sana’a,<br />
<br />
Displaced people on the streets of Mogadishu, Somalia. ©Mohamed Amin Jibril/IRIN<br />
Mogadishu and Hargeisa. Djibouti City has developed an<br />
integrated five-year urban strategy to improve infrastructure<br />
and governance. Yemen has launched a project to extend and<br />
improve infrastructure in three port cities and is developing<br />
a programme to upgrade living conditions in Taiz, where the<br />
proportion of informal settlements is particularly high.<br />
Economic Role of <strong>Cities</strong>. Given continued conflicts and<br />
natural disasters, the economies of the Southern Tiers are<br />
underdeveloped with high unemployment and poverty<br />
ratios. In the Comoros and Somalia, the economic base is<br />
agriculture and fisheries; in Djibouti, it is transportation,<br />
communications, trade and services. Oil accounts for over 90<br />
per cent of government revenue in Sudan and is expected to<br />
run out in 20 to 30 years while in Yemen, oil accounts for 70<br />
per cent of government revenue and is projected to run out<br />
in five to 14 years. Sudan’s economy was centred on Greater<br />
Khartoum and the breakup of the country into Sudan, which<br />
has the oil refineries and ports, and South Sudan, which has<br />
oil and water, has the potential to significantly affect the<br />
economies and the major cities in both countries.<br />
Unemployment rates are very high throughout the region,<br />
reaching 19 per cent in Yemen, 7 to 22 per cent on the<br />
different islands of Comoros, 40 to 50 per cent in Djibouti<br />
and 65 per cent in Somalia (80 per cent in some cities).<br />
Unemployment disproportionately affects the youth and<br />
female populations. In the Comoros, youth unemployment<br />
represents nearly 65 per cent of total unemployment while in<br />
Djibouti, 84 per cent of 15 to 19 year olds and 69 per cent of<br />
20 to 24 year olds are unemployed.<br />
Poverty rates are very high, although generally urban<br />
residents are better off economically, have better access to<br />
health services and higher school enrolment and attendance<br />
rates. In Djibouti City, 69 per cent of people are below the<br />
national poverty line; in Sudan, 65 to 75 per cent of the<br />
population live on less than a dollar a day in the North and<br />
90 per cent below that level in South Sudan.<br />
School enrolment rates range from 20 per cent in Somalia<br />
to 85 per cent in Yemen. To combat poverty, Djibouti has<br />
instituted the Urban Poverty Reduction programme to<br />
support improvements to social and economic services in<br />
the poorest neighbourhoods through technical assistance,<br />
community projects, infrastructure development, access to<br />
microfinance and targeted economic development.<br />
Constraints that prevent greater economic development<br />
include cumbersome administrative processes, an unfair and<br />
uncompetitive business environment, a lack of transparency,<br />
corruption, the high cost of credit and the difficulty in<br />
acquiring securely titled, serviced land for development<br />
and investment, as well as degraded infrastructure and<br />
uncertain electricity and water supplies. Although many<br />
of the countries are trying to diversify their economies<br />
and promote the tourism sector, they are constrained by<br />
inadequate infrastructure, a lack of hotels and security<br />
concerns.<br />
7
8<br />
Urban Development and Housing. Many cities that<br />
are the recipients of migratory flows are composed almost<br />
entirely of informal settlements, slums and refugee camps.<br />
The percentage of the migratory population living in slums<br />
is 94 in Sudan, 74 in Somalia, 69 in the Comoros and 67<br />
in Yemen and most dwellings have at least one housing<br />
deprivation. Electricity grids are restricted to major cities and<br />
the poor cannot afford power.<br />
Speculation has driven up land prices and rising<br />
construction costs has made housing more expensive. In<br />
Khartoum, the rise of oil wealth has led to speculative luxury<br />
private developments that cater to expatriates and are financed<br />
by foreign investment from the GCC.<br />
Banking in the Southern Tier is limited, as demonstrated<br />
by the presence of only one bank in Somalia, three banks in<br />
Comoros and the statistic that only four per cent of Yemenis<br />
hold bank accounts. Households incrementally invest in their<br />
homes through savings, loans from friends and family and<br />
remittances.<br />
Djibouti’s estimated housing gap was 140,000 units in<br />
2008; Khartoum’s annual housing construction need is<br />
60,000 units and Yemen’s is 80,000 units. Almost all housing<br />
is informal and built by the private sector. Inadequate land<br />
development legislation and property registration procedures<br />
complicate governments’ ability to intervene in the housing<br />
market.<br />
Environment and Transportation. With the exception of<br />
Yemen, Southern Tier countries face great challenges from<br />
economic water scarcity, meaning they lack the infrastructure<br />
to supply water, rather than experiencing physical water<br />
scarcity. Somalia, Yemen and Sudan are not expected to reach<br />
the Millennium Development Goals targets for water and<br />
sanitation due to ongoing conflicts and lack of investment.<br />
Yemen is projected to deplete its groundwater reserves by 2030<br />
or 2040 and Sana’a and Yemen are consistently projected to<br />
be the first city and country in the world to run out of water.<br />
In the Comoros, where all petroleum products are imported,<br />
energy prices are among the highest in Africa. Wood fuels<br />
meet 90 per cent of energy needs in Sudan, 87 per cent in<br />
Somalia and 78 per cent in the Comoros, with significant<br />
environmental implications. In the Southern Tier countries,<br />
only cities in Sudan have sanitary landfills; other cities dispose<br />
of solid waste in informal dumps or along wadis. Yemen has<br />
led the region in reforms in this area and its 2010 National<br />
Strategy for Solid Waste Management created a framework<br />
for implementation which has affected four million people<br />
so far.<br />
Although roads provide access to major cities there is a<br />
lack of funds to maintain networks. None of the Southern<br />
Tier countries has established national public transportation<br />
policies or operate public transport services. Private transit<br />
services tend to be fragmented and limited in geographic scope<br />
and operating hours. Starting in 2002, Djibouti implemented<br />
important reforms to professionalize the informal sector,<br />
establish fees, licenses and inspections.<br />
Urban Governance Systems. The Southern Tier <strong>Arab</strong><br />
countries share a recent history of civil unrest, violent conflict<br />
and political instability. Much of the unrest is associated with<br />
the efforts to impose centralized government systems on<br />
traditionally-dispersed clans and tribes.<br />
To resolve these conflicts, many of these countries have<br />
tried to implement decentralization reforms. In 2000,<br />
Yemen launched one of the most ambitious decentralization<br />
programs in the <strong>Arab</strong> world that resulted in the country’s first<br />
municipal elections. The ruling party’s continued control of<br />
the governorate and national seats of power, however, led to<br />
mass protests in 2011 and at the time of writing the country<br />
was on the brink of civil war.<br />
Elsewhere in the Southern Tier, traditional power elites<br />
similarly continue to control higher levels of government<br />
with a lack of adequate funding for local authorities. The<br />
development of local capacity and improved service delivery<br />
are key areas requiring international and donor support.<br />
Constitutional laws in Southern Tier countries protect the<br />
rights of women to vote and hold elected offices. In reality,<br />
deeply ingrained traditions govern property transactions,<br />
business dealings and family relations, particularly in rural<br />
areas. Women routinely have fewer opportunities to gain<br />
education, employment and political office, particularly in<br />
Yemen and Somalia. Some countries, mostly notably Djibouti,<br />
are slowly trying to change old laws and establish ministries<br />
on women’s affairs and quotas for female representation in<br />
elected bodies.<br />
Migration and Remittances. Conflict, drought and<br />
poverty have led to a net outmigration from most Southern<br />
Tier countries, with an average annual outmigration of<br />
50,000 people from Somalia.<br />
The more stable countries in the region host significant<br />
numbers of refugees; in 2010, 28 per cent of migrants in<br />
Sudan and 21 per cent of migrants in Yemen were refugees.<br />
The majority lives in peri-urban areas where they often<br />
regroup by tribe or place of origin. Sudan is a net receiver<br />
of migrants as it is both a transit and destination country;<br />
Khartoum hosts approximately 30,000 registered refugees,<br />
mostly from Ethiopia and Eritrea, and 1.7 million internally<br />
displaced peoples (IDPs); 1.3 million IDPs live in informal<br />
squatter camps around the city and the remaining 400,000<br />
reside in official camps.<br />
The importance of remittances in housing construction<br />
varies by country. In the Comoros, recipients of remittances<br />
spend most of the funds on consumption. Somalia<br />
receives an estimated USD 1 billion in remittances each year<br />
from émigrés, who represent 8.7 per cent of the population.<br />
These remittances underpin the country’s financial structures<br />
and are invested in basic services as well as housing and small<br />
enterprises.
1.2<br />
Historical Perspectives<br />
<br />
Jerash, Jordan. Roman colonnaded streets gave order to city layout. ©WitR/Shutterstock<br />
Continuity of Urban Life: Urban Settlements on River Locations<br />
Today, most large cities of the Middle East are located<br />
either on the region’s great rivers such as the Euphrates,<br />
the Tigris and the Nile - the birthplaces of once great<br />
civilizations - or on the shores of the Mediterranean, the Red<br />
Sea or the <strong>Arab</strong>ian Gulf. These Middle Eastern cities have one<br />
of the world’s longest histories of continuous occupation, due<br />
primarily to the presence of an ample water supply in an arid<br />
region, the fertility of the sites and their location along major<br />
trade routes. The ability to manage the area’s rivers through<br />
complex hydraulic works to serve both farmland and urban<br />
centres allowed the production of food surpluses that could<br />
be traded.<br />
The Fertile Crescent, a plain defined by the Tigris and<br />
the Euphrates, made possible the emergence first of ancient<br />
Sumerian, Akkadian, Hellenistic, Roman, Parthian, Sassanian<br />
civilizations and then Christian and <strong>Arab</strong>-Islamic ones. An<br />
extensive net of irrigation canals allowed the development<br />
of agriculture and the emergence of urban centres. Likewise,<br />
the early Nile Valley settlers discovered the benefits of the<br />
fertilizing silt left behind by the floods and gradually learned<br />
how to control the annual inundations and so reclaim<br />
agricultural land.<br />
As agriculture prospered, towns and cities multiplied. In<br />
970 AD the Fatimids founded al-Qahira (Cairo) south of the<br />
ancient city of Heliopolis and north of Memphis near the<br />
convergence point of the two branches of the Nile.<br />
Jerusalem (Yara Shalem) 12 is situated on a ridge west of the<br />
Dead Sea and the Jordan River. The fertility of the soil is due to<br />
the Wadi Farah as well as to the numerous underground springs<br />
and wells inside and outside the Old City. Jerusalem has been<br />
inhabited since about 4000 BC (Bronze Age). Archaeological<br />
evidence has established that the Canaanites, Amorites<br />
and Jebusites successively occupied the site. Subsequently,<br />
Jerusalem was ruled by the Egyptians, before the coming of<br />
the Philistines, Israelites, Persians, Romans, Byzantines, <strong>Arab</strong>s,<br />
Crusaders, Mamluks and the Ottoman Turks.<br />
9
10<br />
Damascus (Dimashqa) lies at the foot of the Anti-Lebanon<br />
Range where the waters of the Barada (the Abana river<br />
of Antiquity) irrigate a vast oasis of about 30 km 2 . The<br />
Barada’s waters have been used for irrigation for thousands<br />
of years and, according to historical tablets from 2500 BC,<br />
Amorites settled in this area at the beginning of the second<br />
millennium BC. The water, the quality of the soil and its<br />
commanding location on the trans-desert routes attracted<br />
numerous civilizations, which include Arameans, Assyrians,<br />
neo-Babylonians, Persians, Greeks, Seleucids, Nabateans,<br />
Romans, Byzantines and <strong>Arab</strong>s.<br />
The Classical Heritage<br />
By the end of the 6 th century BC, Hellenic commercial<br />
power had extended to the Asiatic hinterland and Egypt.<br />
The establishment of the Greek polis (city-state) in its Asian<br />
colonies was the most dramatic representation of the progress<br />
of Hellenic civilization. The conquest of the region by<br />
Alexander the Great of Macedon (356-323 BC) left behind<br />
it the chain of Greek city-states as economic and cultural<br />
outposts as well as garrisons all over Asia and Egypt. These<br />
cells of Hellenism maintained an enduring organizational<br />
influence on the Middle East as they followed the democratic<br />
Athenian urban structure and this ecumenical concept of<br />
government, combined with the local freedom of the polis,<br />
resulted in a powerful and lasting structure, “the roots of the<br />
free municipal system handed down by Alexander’s successors<br />
to Rome and by Rome to Byzantium.” 13<br />
In Egypt, Alexander the Great built the port of Alexandria,<br />
the region’s first orthogonal city. The city became the most<br />
powerful Hellenistic centre of commerce in the ancient<br />
world. After the death of Alexander, the orthogonal gridplan<br />
town became common in Hellenistic Middle East,<br />
setting the tone for an orderly urban prototype that was to be<br />
perfected by Imperial Rome. 14 It became the dominant urban<br />
plan of the Mediterranean Basin for half a millennium and<br />
its remnants are still clearly visible in many historic districts.<br />
Scholars generally agree that the grid pattern in Middle<br />
Eastern cities is of Greek origin, but similar layouts are<br />
also found in Achaemenid (Persian) towns and in other<br />
non-Middle Eastern cities. 15 The Romans added distinctive<br />
features to the Hellenistic grid pattern such as the cardo<br />
and the decumanus, intercrossing main thoroughfares that<br />
connected the major temples in the Roman cities of the<br />
Middle East. Another common urban feature of the Roman<br />
East was the colonnaded street 16 . Its basic function was to<br />
provide shelter from the sun but it also gave a sense of order,<br />
direction and majesty.<br />
By the 4 th century Christianity had become a structured<br />
religion with the First Council of Nicaea (325 AD) and the<br />
Byzantine Emperor Constantine launched an ambitious<br />
building programme to commemorate the Christian holy<br />
sites in the Eastern part of the Empire. Greco-Roman cities<br />
were transformed and redesigned according to the Christian<br />
faith.<br />
The <strong>Arab</strong> Conquest<br />
By the second half of the 7 th century the <strong>Arab</strong> Islamic<br />
conquest had expanded over all Byzantine territories. At the<br />
time Islam was born, the <strong>Arab</strong>ian Peninsula had long been<br />
in contact with Hellenistic, Roman and Byzantine traditions<br />
and, except for those concepts that could undermine their<br />
religion, the Muslims valued this heritage, particularly in the<br />
highly-urbanized areas.<br />
The institutions of the conquered cities underwent major<br />
changes. The principal institutions - the mosques and later the<br />
madrasas (colleges) - played an important part in developing<br />
the new administrative and legal codes. The city’s organization<br />
consisted of a strictly hierarchical structure appointed by<br />
the Caliph or Sultan: walis (governors) assisted by al-shurta<br />
(police), the qadi (judge), the al-muhtasib (supervisor of<br />
markets who was in turn assisted by the controller of various<br />
professions), the heads of city quarters and the supervisors of<br />
the protected communities of Jews and Christians.<br />
The <strong>Arab</strong> Islamic city excelled in the services provided<br />
to its inhabitants: maristans (hospitals), hammams (public<br />
baths), sabils (drinking fountains), sabil-maktabs (public<br />
fountain with an elementary school), dar al-ilm (public<br />
libraries), public kitchens for the poor, suqs (markets), khans<br />
(urban warehouses) and wakalas (urban caravanserais), all of<br />
which made the city liveable and life dynamic. The two most<br />
prestigious universities remain Cairo’s al-Azhar (972 AD) and<br />
Fes’ al-Qarawiyyin (859 AD), the oldest continuously used<br />
university in the world. 17<br />
Spatial Organization of the Traditional<br />
<strong>Arab</strong> City<br />
<strong>Arab</strong> cities have been hierarchically organized around the<br />
Great Mosque while the suqs (markets) and qaysariyyas (covered<br />
markets), interconnected by streets, constituted the main<br />
urban public spaces. This pattern dates back to pre-Islamic<br />
times when pilgrimages to pagan shrines were an occasion for<br />
traders to organize periodic markets.<br />
By the end of the 19 th century, many areas in the Middle<br />
East were transformed from self-sufficiency to import-oriented<br />
economies tied to the industrializing Western countries, 18 a<br />
trend that asserted itself during the 20 th century colonial period.<br />
Yet, despite the pre-eminence of modern imported goods,<br />
new ways of distribution and Western style financial systems,<br />
<strong>Arab</strong> cities are still characterized by the historic concept of<br />
the market and the traditional suq 19 has not disappeared from<br />
them. They have been preserved in cities’ historic centres in<br />
spite of the intrusion of motor vehicles and modern industries.<br />
Straight streets often linked the heart of the market district<br />
to the city gates. Baghdad’s al-Rashid Street is still the city’s<br />
main commercial artery and stretches from the northern to<br />
the southern gate. In 1914 the Ottoman administration<br />
transformed al-Rashid Street into a modern avenue, with its<br />
central part designed for carriages and the pedestrian sidewalks<br />
shaded by arcades. 20 Parallel to al-Rashid Street is the Caliph
BOX 1: THE SOUL AND IDENTITY OF THE ARAB CITY<br />
<br />
The Bab Bou Jeloud gate leads into the old medina in Fes, Morocco. It is also known as The Blue Gate to Fes.<br />
©Bjørn Christian Tørrissen. Licensed under the Creative Commons Attribution-Share Alike 3.0 Unported license.<br />
If one were to look at <strong>Arab</strong> cities by aerial<br />
view, starting from Titwan in Morocco all the<br />
way to Baghdad in Iraq, it should become<br />
clear that they share similar structural form,<br />
functions and urban planning that enables<br />
social, cultural, economic and recreational<br />
activities to thrive. Urban planning follows a<br />
distinct internal hierarchy of social and spatial<br />
order. The layout allows for long horizontal<br />
views, reflecting the nomadic origins of the<br />
residents in these cities and their desire to<br />
view a far horizon without obstructions or<br />
restrictions. The mosque and its minarets<br />
is the sole purely vertical structure in the<br />
traditional <strong>Arab</strong> city, it is the main landmark;<br />
the most important visual focal point for<br />
visitors and residents alike and a guide to the<br />
city centre.<br />
The <strong>Arab</strong> city developed along traditional<br />
planning visions sets the mosque of the<br />
state in the geographical centre and heart<br />
of the often circular city. From there starts<br />
a hierarchically-arranged fabric of buildings<br />
accommodating social strata of residents.<br />
The first concentric ring surrounding the<br />
mosque is reserved for the Emirate House -<br />
the accommodation of the Emir, his entourage<br />
and their guards. A second concentric circle<br />
is for socially high-ranking or otherwise<br />
important city residents, such as those<br />
belonging to the major tribes and the clans<br />
closest to the Emir. People from lesser tribal<br />
importance reside in the following concentric<br />
circles or districts, successively further away<br />
from the Emir’s residence. The city core<br />
(medina) is surrounded by an outer wall with<br />
gates that connect it with the extra-mural<br />
urban areas where trade and other economic<br />
activities take place during in the day.<br />
<strong>Arab</strong> cities initially had their commercial<br />
quarter (suq) within the walls of the city core,<br />
often in close proximity to the gates for ease of<br />
interaction with the extra-mural urban areas.<br />
The suq consists of an urban quarter with<br />
narrow to medium-sized alleys, depending on<br />
the type of trade or craft, spatially arranged by<br />
activity or product produced. Therefore, there<br />
are separate alleys for copper wares, fabrics,<br />
gold and silver, and others for medicinal<br />
herbs, perfumes, spices and so on. Over time,<br />
the expansion of trade typically forced the suq<br />
beyond the city walls and there is little doubt<br />
that the suq with its composition and shape is<br />
the forerunner of what is known today as the<br />
shopping center or mall.<br />
The soul of the <strong>Arab</strong> city is embodied by the<br />
complementarity of the mosque of the state<br />
and the suq. The aromatic smell of different<br />
spices, perfumes, wild flowers, plants and<br />
various herbs extend from the suq’s alleys all<br />
the way to the mosque. There is a clear and<br />
direct route between the mosque and the suq<br />
that accentuates their inter-connectedness<br />
as places of exchange. At the market people<br />
trade merchandise, but also views on current<br />
matters.<br />
Likewise, the functions of the mosque are<br />
not confined to religious rituals but also serve<br />
as a space for public discussion and debate on<br />
the conditions and well-being of the city and its<br />
citizenry. In this manner, the mosque serves as<br />
a parliament and place where the citizenry can<br />
articulate its voice to the Prince of the Emirate.<br />
The notion of ‘place’ has a special and<br />
distinctive sense in the <strong>Arab</strong> city. The Islamic<br />
scholar Abdulqahir Al Girjani (d. 471 AH),<br />
described it as ‘the inner lining of the form’.<br />
That is why arts and decoration do not appear<br />
on the exterior of buildings. In general terms<br />
these are limited to internal spaces only. The<br />
exception is the Mosque, where both the<br />
interior and exterior typically display multiple<br />
flavors of decoration that match architectural<br />
beauty with that of the decorative arts.<br />
The distinct elements of the <strong>Arab</strong> city reveal<br />
the city’s functions and its practical spatial<br />
organization. Nevertheless, for centuries<br />
the interpretation of the <strong>Arab</strong> city’s distinct<br />
spatial organization and the inter-relatedness<br />
of urban elements and functions have<br />
remained for many people a conundrum hard<br />
to fully grasp. That explains why the image of<br />
the traditional <strong>Arab</strong> city has for centuries, as<br />
it does today, been surrounded by a sense of<br />
imagination, magic and mystery. This aspect<br />
reveals why it became a prime illustration of<br />
the Oriental city where the Thousand and One<br />
Nights have flowed, lived and still survive.<br />
11
12<br />
Street, with important religious institutions (mosques and<br />
churches) as well as government agencies.<br />
Monumental pious institutions along the main arteries<br />
of the city became a manifestation of power, wealth and<br />
the expression of the patron’s self-glorification. Great<br />
stone mosques with minarets and portals projecting onto<br />
the street served as landmarks to passersby and attracted<br />
the faithful. They were patronized by sultans and emirs,<br />
who provided pious endowments (waqf). The mosques,<br />
maristans (hospitals), khanaqahs (hospices) and madrasas<br />
(religious schools) sustained a large number of people who<br />
were attached to them as lifelong or temporary personnel.<br />
The sultan sometimes controlled the pious institutions but<br />
not always as the relationship between the state and clergy<br />
(ulama) was marked by mutual dependence.<br />
The most striking feature of Jerusalem is its Roman-<br />
Byzantine street pattern consisting of two north-south roads<br />
and two east-west streets, an adaptation of the Roman cardo<br />
and decumanus. This street pattern has been preserved. Just<br />
as in any Roman city, Jerusalem’s cardo was flanked by a<br />
colonnade. Lined with shops and vendors, it was the focal<br />
point of the city’s economic life.<br />
From the 18 th century to the last quarter of the 19 th century<br />
<strong>Arab</strong> cities experienced a long period of relative stagnation<br />
compared to their Western equivalents. Traditional urban<br />
patterns, dwellings and monuments remained in use. The<br />
height of buildings and their decorated façades on the main<br />
streets still indicated their social and religious importance.<br />
The crucial urban transformations of <strong>Arab</strong> cities started to<br />
take place before the turn of the 20 th century when European<br />
planning principles were introduced creating a dichotomy<br />
between the historic city and its modern counterpart. In<br />
Cairo, for example, the medieval Fatimid city remained a<br />
vibrant place despite the obvious decay of monuments, the<br />
lack of modern amenities, increased traffic congestion and the<br />
density of population in its traditional quarters.<br />
Today in the historic centre of Cairo and, to a lesser extent<br />
Baghdad, there are structures dating back to the Ottoman<br />
period as well as recent ones that have been built adjacent<br />
to or attached to older buildings. Regardless of its modern<br />
look, the area maintains its integrity due to the survival of the<br />
hierarchical organization of the streets, alleys and cul-de-sacs,<br />
all of which create a social spatial order. In spite of the efforts<br />
of the Egyptian Department of Antiquities, this order is now<br />
threatened by new building regulations requiring parking<br />
and the widening of streets to facilitate the flow of vehicular<br />
traffic. In some cases, buildings have been pulled down to<br />
widen streets or their façade visually obstructed by overpasses,<br />
disfiguring the neighbourhood.<br />
In Baghdad the first set of urban changes occurred during<br />
the first half of the 20 th century, 21 when the narrow and<br />
winding street network of the old city fabric was considered<br />
unsuitable for carriages. Despite the modernization trend<br />
during the late Ottoman period, some quarters of the<br />
traditional city had survived into the 20 th century, their<br />
buildings exhibiting a mixture of styles dating back to the<br />
19 th century. The integrity of many quarters was entirely<br />
altered after the Second World War, when a new street system<br />
was introduced with wide avenues and squares in European<br />
style. 22 The consequences of this process were the destruction<br />
of old good buildings, the disruption of the relationship<br />
between private and public spaces and the creation of a new<br />
environment in the streets.<br />
The Destruction of Historical Sites<br />
Historic sites and traditional urban centres are a priceless<br />
legacy for the local population and humanity, besides<br />
attracting tourists and contributing to the economy. Because<br />
of its historical assets and its proximity to Western countries,<br />
Cairo is the city that has attracted the most tourists in the<br />
Middle East. Its wealth of Pharaonic and Islamic monuments<br />
are unique in the world. They were first documented during<br />
Napoleon’s Egyptian Campaign (1798–1801) when the<br />
Rosetta Stone was discovered (1799) and when antiquities<br />
gathered by French archaeologists were seized by the British<br />
and are today part of British Museums’ collections. The<br />
French saved only a small part of the collection, which was<br />
taken to the Louvre.<br />
More importantly, the scientific expedition that<br />
accompanied the army produced the celebrated Description<br />
de L’Egypte, which was published between 1809 and 1821.<br />
Its text and engravings illustrated both Egyptian antiquities<br />
and the Islamic medieval city and stirred the imagination of<br />
archaeologists, historians, artists and collectors. By the end of<br />
the 19 th century, the market for Egyptian artefacts was well<br />
developed and another in Islamic art had started in Europe<br />
and the United States.<br />
Concurrently, Mesopotamian antiquities became of<br />
interest to British and French businessmen and diplomats,<br />
who began to explore Iraq’s Biblical and ancient sites looking<br />
for valuable artefacts. The systematic removal of antiquities<br />
began in 1842. Despite the antiquities law promulgated<br />
by the Ottoman government in the 1870s, archaeologists<br />
from the US and Europe continued digging and collecting<br />
antiquities 23 . From the 19 th century to the present day<br />
the cultural heritage of Mesopotamia has suffered from<br />
indiscriminate illegal digging, which has effaced most of the<br />
layout of ancient cities 24 only their bare walls and foundations<br />
are still standing.<br />
The Need for Preservation<br />
The <strong>Arab</strong> World’s wealth of historic urban sites and the<br />
influence of history in modern cities is very much part of<br />
the “collective memory” of people who have occupied the<br />
land for lengthy periods of time. It is a distinctive factor that<br />
continues to be reflected in the daily life of people, in the<br />
use of traditional motifs in architecture, in the clustering of<br />
competing stores selling similar wares, in the continued use<br />
of traditional industries and markets, of religious buildings<br />
and of the monumental buildings of centralized governments.
Their location often still reflects the urban structures that<br />
emerged from both the Roman-Byzantine grid plan and the<br />
traditional urban fabric, influenced by the Shari’a law that<br />
developed after the <strong>Arab</strong> conquest. They are not only part of<br />
the daily life of the population but also represent an economic<br />
asset, attracting the tourism that is today a significant part of<br />
the region’s economy.<br />
The preservation of the cultural heritage of ancient sites<br />
BOX 2: PRESERVING THE ARAB URBAN HERITAGE<br />
<br />
The Medina of Sousse in Tunisia, a UNESCO World Heritage Site. ©Gelia/Shutterstock<br />
<strong>Arab</strong> countries have a diversified urban<br />
heritage demonstrated in city centres from<br />
different ages. Ancient cities such as Sana’a<br />
(Yemen), Fes and Marrakech (Morocco), Tunis<br />
(Tunisia), Bethlehem (Occupied Palestinian<br />
Territories), Damascus and Aleppo (Syria)<br />
are still inhabited today and are important<br />
regional centers for tourism. UNESCO and<br />
other international organizations have assisted<br />
some of these cities to maintain and preserve<br />
their architectural heritage and monuments<br />
through adaptive reuse to generate economic<br />
opportunities for its citizens and revive its<br />
character.<br />
The Bethlehem preservation project by<br />
UNESCO was very important as, in addition<br />
to its spiritual values for Christians, it has<br />
a wealth of urban heritage demonstrated<br />
in its ancient neighbourhoods, old houses,<br />
shops and traditional artifacts. Most of those<br />
important historic places appear in the World<br />
List of Heritage Sites (The Medina in Fes in<br />
Morocco, Carthage in Tunisia, Sana’a Shebam<br />
and Zabeed in Yemen, Damascus and Aleppo in<br />
Syria, etc.). As a result of preservation efforts<br />
in Yemen, its cities have gained international<br />
reputation for their historical characteristics.<br />
The famous tower dwelling areas of Sana’a<br />
have been preserved, including the carefully<br />
planned architecture, many gardens inside and<br />
outside the ramparts and the water supply from<br />
wells. But the urban explosion has affected<br />
these areas; its inhabitants are deserting it and<br />
it is facing continuous deterioration.<br />
and traditional medieval cities threatened by the high<br />
rate of growth of the urban population and the sprawl is<br />
imperative. The principal reason for safeguarding these<br />
physical manifestations of the past – historic sites, cities,<br />
quarters, monuments, streets, markets, temples and palaces<br />
– lies not only in their harmony and splendour but also<br />
because they form part of the identity of the people of the<br />
<strong>Arab</strong> World.<br />
<strong>Cities</strong> in Syria present a different and<br />
fascinating urban form, varying from towns<br />
dating back to the second and third millennia<br />
BC (Ebla, Mari, and Ugarit) or the Hellenistic<br />
and Roman periods (Apamee, Palmyra) to<br />
cities of the golden age of <strong>Arab</strong> civilization<br />
(Damascus with its Omayyad mosque, its<br />
gates and ramparts, palaces, citadel and old<br />
<strong>Arab</strong>ian houses) and its urban heritage from<br />
the Byzantine era (the sanctuary of Saint<br />
Simeon), the Crusades (Tartus cathedral) and<br />
the Ottoman era (Tekiyeh and Souleymanieh).<br />
Tunisia has an exceptional urban heritage<br />
represented in the recently-renovated medina<br />
at Tunis, and much of its architectural heritage<br />
is now utilized as museums, restaurants,<br />
guest houses and art and crafts shops.<br />
13
14<br />
1.3<br />
Largest <strong>Arab</strong> <strong>Cities</strong><br />
As of 1950, the <strong>Arab</strong> region contained only two cities<br />
with populations greater than one million. By 2010<br />
there were 23 cities of this size, with a total population<br />
of approximately 65 million. By 2025, 31 cities in the region<br />
are expected to have a population greater than one million.<br />
Cumulatively, these cities will then be home to nearly 97<br />
million residents.<br />
In 1950, many of the largest cities in each country were<br />
relatively small such as Sana’a, Dubai, Mogadishu and<br />
Amman with only 46,000; 20,000; 69,000 and 90,000<br />
residents respectively. The largest cities were Cairo, Alexandria,<br />
Casablanca, Baghdad, Algiers, Damascus, Beirut and Aleppo,<br />
each with a population greater than 250,000 residents.<br />
In the early- to mid-1950s, many of the <strong>Arab</strong> cities prepared<br />
development plans. Although there was some rural to urban<br />
migration, most migrants settled in villages surrounding the<br />
cities. It was not until the mid-1960s that informal settlements<br />
started to develop. They became more common in the 1970s<br />
and 1980s, with the lifting of the oil embargo and the increase<br />
in the price of oil in 1974. Economic liberalization also helped<br />
to facilitate the movement of migrants to other countries and<br />
regions, where they often settled in urban locations.<br />
Table 1: Largest Agglomerations 2010-2025 and Half-Decade<br />
Growth Rates, shows that, in the foreseeable future, Cairo<br />
will remain the sole <strong>Arab</strong> megacity. Until 2025, the current<br />
hierarchy of the five largest urban agglomerations in the <strong>Arab</strong><br />
states will remain unchanged. Baghdad with some 8 million<br />
inhabitants in 2025 will stay in second place after Cairo.<br />
Khartoum’s 7.9 million in 2025 assures they remain in third<br />
place, Riyadh will still be fourth and Alexandria fifth in the<br />
foreseeable future.<br />
Some changes are projected for the lower-ranked cities,<br />
starting in 2015, when Jeddah will become the region’s sixthlargest<br />
urban agglomeration with 3.5 million inhabitants<br />
FIGURE 3: ARAB CITIES WITH 1+ MILLION PEOPLE<br />
Combined population (millions)<br />
100<br />
90<br />
80<br />
70<br />
60<br />
50<br />
40<br />
30<br />
20<br />
10<br />
0<br />
3.5<br />
1950<br />
Source: UN-DESA, 2009<br />
4.3<br />
1955<br />
6.2<br />
1960<br />
10.4<br />
1965<br />
12.4<br />
1970<br />
17.2<br />
1975<br />
23<br />
1980<br />
27.7<br />
1985<br />
33.9<br />
1990<br />
<br />
Sana’a, Yemen. The region’s fastest growing city. ©Robert Bremec/iStockphoto<br />
and push Casablanca to seventh place. By 2020, Aleppo and<br />
Jeddah will both also be larger than Casablanca while Sana’a<br />
will rise from the region’s 11 th -largest agglomeration of 2.3<br />
million people in 2010 to seventh position with 4.2 million<br />
inhabitants by 2025.<br />
There are messages embedded in the statistics of these cities’<br />
relative and absolute growth. On average, the region’s largest<br />
agglomerations will grow by 35 per cent between 2010 and<br />
2025, adding an accumulated 15 million people to these large<br />
urban centres. The region’s fastest growing city is Sana’a, which<br />
is projected to experience an 83.4 per cent growth from its<br />
2010 population. This is a worrying prospect as the city is<br />
already in serious trouble in terms of its fresh water supplies.<br />
40.6<br />
1995<br />
48.4<br />
2000<br />
55.6<br />
2005<br />
65.1<br />
2010<br />
75.5<br />
2015<br />
86.5<br />
2020<br />
96.6<br />
2025
Given the rapidly-increasing gap between water demand<br />
and supply, it is unlikely that Sana’a will see the projected<br />
population growth materialize as eco-migration is expected<br />
to set in well before the city actually runs dry.<br />
The sub-region’s second-fastest growing city is Mogadishu,<br />
projected to rise from 1.5 million in 2010 to 2.58 million in<br />
2025, a growth of 72.5 per cent. Here too, external factors<br />
will largely determine whether this will indeed happen.<br />
That is not the case with Khartoum, which is projected to<br />
grow from 5.1 million in 2010 to 7.9 million in 2025 -<br />
or a 53.7 per cent increase. The growth of Khartoum may<br />
actually exceed these already high forecasts, depending on<br />
how the hydrocarbon-driven economy of Sudan will develop<br />
and whether a negotiated agreement with South Sudan<br />
over border delineation and division of the hydrocarbon<br />
endowment can be reached on relatively short notice.<br />
Other <strong>Arab</strong> cities whose populations are predicted to grow<br />
well above the regional average during the 2010-2025 period<br />
are: Sulaimaniya (49.39 per cent); Hama (45.66 per cent);<br />
Mecca (44.58 per cent); (Erbil (43.39 per cent) and Homs<br />
(41.63 per cent), while both Beirut and Tunis are projected<br />
to experience mere negligible urban growth.<br />
TABLE 1: LARGEST AGGLOMERATIONS 2010-2025 AND HALF-DECADE GROWTH RATES<br />
The urban agglomerations of Beirut and Dubai represented<br />
the largest share of a country’s total population at 45.5 and<br />
33.3 per cent in 2010. Other cities represent a much smaller<br />
segment of the total population, varying from 4.6 per cent in<br />
Mosul to 18.7 per cent in Baghdad. Greater Beirut accounts<br />
for 52.2 per cent of Lebanon’s total urban population while<br />
Mogadishu and Dubai represent 42.8 per cent and 39.9 per<br />
cent of their respective countries. Unlike other countries in<br />
the region that have several important secondary cities, in<br />
Lebanon, the United <strong>Arab</strong> Emirates and Somalia there is a<br />
primary city that contains most of both the total and urban<br />
populations.<br />
Average annual growth rates in the largest cities have been<br />
low to moderate at 1 to 3 per cent. Hama, Sana’a, Sharjah,<br />
Dubai and Homs have been expanding most rapidly at<br />
between 4 and 6 per cent. These cities have the ability to<br />
absorb more residents and accommodate additional growth.<br />
Cairo, Tunis, Tripoli, Oran and Casablanca have been<br />
growing most slowly at a rate of less than 1 per cent each<br />
year, demonstrating the limited opportunities for further<br />
expansion. By 2025, most of the cities will be growing<br />
relatively slowly at 1 to 2 per cent.<br />
Urban Agglomeration 2010(000) 2015(000) 2010-15(%) 2020 (000) 2015-20(%) 2025(000) 2020-25(%) 2010-25(%)<br />
Cairo (Al-Qahirah) 11,001 11,663 6.01 12,540 7.52 13,531 7.90 23.00<br />
Baghdad 5,891 6,614 12.28 7,321 10.69 8,043 9.85 36.53<br />
Khartoum (Al-Khartum) 5,172 6,046 16.89 7,005 15.87 7,953 13.53 53.76<br />
Riyadh (Al-Riyadh) 4,848 5,373 10.83 5,809 8.12 6,196 6.65 27.81<br />
Alexandria (Al-Iskandariyah) 4,387 4,791 9.20 5,201 8.55 5,648 8.60 28.73<br />
Casablanca (Dar-el-Beida) 3,284 3,537 7.73 3,816 7.88 4,065 6.52 23.80<br />
Jeddah 3,234 3,569 10.36 3,868 8.38 4,138 6.97 27.95<br />
Aleppo (Halab) 3,087 3,510 13.72 3,864 10.08 4,244 9.83 37.49<br />
Algiers (El Djazaïr) 2,800 3,099 10.71 3,371 8.77 3,595 6.66 28.43<br />
Damascus (Dimashq) 2,597 2,918 12.36 3,213 10.11 3,534 9.98 36.06<br />
Sana’a 2,342 2,934 25.29 3,585 22.19 4,296 19.83 83.44<br />
Kuwait City (Al Kuwayt) 2,305 2,592 12.45 2,790 7.63 2,956 5.95 28.22<br />
Beirut (Bayrut) 1,937 2,033 4.98 2,090 2.78 2,135 2.14 10.21<br />
Rabat 1,802 1,973 9.45 2,139 8.43 2,288 6.96 26.94<br />
Dubai (Dubayy) 1,567 1,772 13.07 1,934 9.18 2,076 7.36 32.52<br />
Mogadishu (Muqdisho) 1,500 1,795 19.64 2,156 20.12 2,588 20.06 72.54<br />
Mecca (Makkah) 1,484 1,642 10.64 1,789 8.96 1,924 7.56 29.67<br />
Mosul (Al-Mawsil) 1,447 1,676 15.84 1,885 12.46 2,092 10.98 44.58<br />
Homs (Hims) 1,328 1,536 15.67 1,702 10.82 1,881 10.48 41.63<br />
Tripoli (Tarabulus) 1,108 1,192 7.67 1,286 7.86 1,364 6.01 23.12<br />
Medina (Al-Madinah) 1,104 1,236 12.02 1,351 9.27 1,456 7.78 31.93<br />
Amman 1,088 1,186 9.00 1,272 9.04 1,364 7.20 25.37<br />
Fes 1,065 1,173 10.09 1,277 8.85 1,371 7.36 28.65<br />
Erbil (Irbil) 1,009 1,158 14.71 1,301 12.37 1,447 11.25 43.39<br />
Marrakech 928 1,023 10.21 1,114 8.96 1,198 7.47 29.06<br />
Basra (Al-Basrah) 923 1,023 10.81 1,139 11.34 1,267 11.27 37.29<br />
Dammam 902 1,013 12.36 1,109 9.44 1,197 7.93 32.72<br />
Hama 897 1,060 18.17 1,180 11.27 1,307 10.78 45.66<br />
Sulaimaniya 836 988 18.20 1,121 13.42 1,249 11.44 49.39<br />
Sharjah 809 926 14.40 1,016 9.77 1,096 7.85 35.43<br />
Oran (Wahran) 770 827 7.43 902 9.05 970 7.64 26.11<br />
Tunis 767 814 6.21 864 6.14 911 5.34 18.76<br />
15
16<br />
1.4<br />
Transnational Migration<br />
<br />
Dubai, UAE. The oil-rich <strong>Arab</strong> countries attract large numbers of migrant workers.<br />
©Philip Lange/Shutterstock<br />
Migration is a key feature affecting all <strong>Arab</strong> countries<br />
since they are either labour-exporting or labourreceiving<br />
countries. Where new entrants in the<br />
labour force exceed the capacity of the economy to absorb<br />
them, governments have little choice but to encourage<br />
working age populations to seek employment elsewhere.<br />
The first oil price spike in 1974 and the subsequent<br />
ambitious development programmes, characterized by large<br />
scale infrastructure and urban projects adopted by the oilexporting<br />
countries, siphoned off surveyors, engineers and<br />
construction labour from the region. Wages and the prices of<br />
building materials escalated.<br />
The attraction of the oil countries lay in the fact that an<br />
employment contract in Saudi <strong>Arab</strong>ia, Libya or the Gulf states<br />
allowed an expatriate to save the amount needed to acquire a<br />
dwelling unit in five to seven years, half the time required<br />
if they found a job in their home country. The resultant<br />
massive infusion of capital into home construction fuelled an<br />
unprecedented increase in the price of land, which doubled<br />
in value every four years in smaller settlements and two years<br />
in the larger cities.<br />
The urbanized area of many cities grew by 50 to 100 per<br />
cent during the decade from 1975 to 1985, as municipal<br />
authorities were unable to manage urban growth and<br />
informal settlements proliferated. In Egypt, Morocco, Tunisia<br />
and Syria thousands of hectares of valuable agricultural land<br />
were lost to urbanization. In the labour-receiving countries,<br />
the proportion of expatriate workers has increased as the<br />
countries developed and diversified their economy and<br />
multiplied ambitious urban projects which now include<br />
impressive infrastructure and tall buildings.<br />
Since the 1990s, the Gulf countries and Saudi <strong>Arab</strong>ia<br />
have increasingly relied on Westerners for skilled labour and<br />
Asians for domestic and unskilled labour. Their numbers now<br />
exceed the number of nationals in all countries, except in<br />
Saudi <strong>Arab</strong>ia, and projections based on the continuation of<br />
current trends indicate serious social and cultural challenges<br />
to the host countries. The oil-rich <strong>Arab</strong> countries will have<br />
to review their labour policies, the status of their migrant<br />
workers and their living conditions as the European countries<br />
are doing today.<br />
The continued unrest in Iraq, the financial crisis of 2007 to<br />
2008 and, more recently, the war in Libya have demonstrated<br />
the extent to which labour-sending countries are vulnerable<br />
to the return of their migrant labour in times of civil strife<br />
and the curtailment or retrenchment of public and private<br />
expenditures in the oil-rich countries.<br />
Over two million Egyptian workers returned due to the<br />
1991 and 2003 wars in Iraq and Kuwait and more than 1.5<br />
million recently returned from Libya. Syrians, Jordanians,<br />
Palestinians, Sudanese and even Moroccans were also affected.<br />
Since the local economies are unable to absorb them and each<br />
migrant supports five or more family members, the economic<br />
and social impacts of disruptions in international migration<br />
patterns can be severe. Decline in remittances is compounded<br />
by the need to provide some assistance to the returnees.<br />
Transnational migration interlinks the different countries<br />
economically, socially, culturally and, to some extent,<br />
ideologically. It binds the <strong>Arab</strong> world as much as trade if not<br />
more so. Migrant workers who spend years in a rich host<br />
country bring back images of wealth and development and<br />
get imbued by aspects of the culture of that country. Often<br />
the images are superficial observations and the understanding<br />
of the culture is skewed by ill-founded interpretations.<br />
Nevertheless, the experience changes their outlook and affects<br />
their lifestyles in their home countries.
1.5<br />
Most of the countries in the region have been affected<br />
by the migration of refugees or internally displaced<br />
persons (IDPs). Many countries in the <strong>Arab</strong> world<br />
have suffered from civil strife and environmental disasters,<br />
which have prompted internal and external population<br />
movements. These shifts have a significant impact on urban<br />
areas as many of the refugees and IDPs settle in cities or on<br />
the urban periphery, generating additional demand on city<br />
services and infrastructure. Integrating them into the urban<br />
fabric and providing them with adequate support poses<br />
significant challenges.<br />
Refugees<br />
Refugees and IDPs<br />
Conflict in Iraq, Lebanon, the Occupied Palestinian<br />
Territories, Somalia and Sudan has prompted residents to<br />
emigrate to safer locations. Since the 1980s, over 2 million<br />
Iraqis have emigrated to escape the insecurity and instability<br />
created by the war with Iran, the First and Second Gulf Wars<br />
and sectarian violence.<br />
Most refugees settle in urban areas or in settlement camps,<br />
initially built on the urban periphery. Jordan hosts refugees<br />
from the Occupied Palestinian Territories, Lebanon and Iraq:<br />
an estimated 25 per cent of Amman’s residents are refugees.<br />
Lebanon is the destination for many Iraqi, Kurdish and<br />
Palestinian refugees and Syria has a large Iraqi population as<br />
well as Palestinian refugees.<br />
In the Southern Tier, refugees comprise a significant<br />
portion of the immigrant population in Sudan, Yemen and<br />
Djibouti, with most coming from Somalia and Ethiopia.<br />
In the Maghreb region, Algeria receives Saharawi refugees<br />
from the conflict in the Western Sahara. In the Gulf<br />
countries, Saudi <strong>Arab</strong>ia and Kuwait have the largest refugee<br />
populations.<br />
Internally Displaced Persons<br />
Many countries, particularly in the Mashreq and the<br />
Southern Tier, have had to deal with internally displaced<br />
populations as a result of conflict, natural disasters or<br />
environmental degradation.<br />
In Iraq, approximately 1.9 million residents have been<br />
displaced internally since the end of the Second Gulf<br />
War. Lebanon’s civil war was accompanied by significant<br />
internal migration, principally centred on Beirut, fuelling<br />
the informal urbanization of its periphery. In the Southern<br />
Tier, Sudanese and Somali residents have experienced<br />
significant internal migration. In Somalia, fighting in the<br />
south, especially in Mogadishu has pushed residents to<br />
Somaliland, Puntland and the Afgooye Corridor northwest<br />
of Mogadishu. Many of the urban settlers tend to stay in the<br />
destination cities rather than return home, which generates<br />
additional pressure on social infrastructure.<br />
In Sudan, with the signing of the Comprehensive Peace<br />
Agreement, approximately 2 million people returned to South<br />
Sudan. With the partition of the country, it is anticipated that<br />
3.5 million migrants and refugees have started to return to<br />
their villages in the south and an estimated 800,000 persons<br />
are moving from the south to the north, many settling in urban<br />
areas, particularly Khartoum. Persons that move within Darfur<br />
tend to settle in urban areas as well due to land occupation and<br />
agricultural crop destruction in the rural localities.<br />
In Syria, rural to urban migration has been spurred by<br />
drought and environmental degradation. In the northeast,<br />
approximately 200,000 to 300,000 residents have migrated to<br />
the cities. In Yemen and Comoros, internally displaced people<br />
have migrated due to natural disasters such as flooding.<br />
<br />
Palestinian children at Shatila refugee camp in Beirut, Lebanon.<br />
©Sadık Güleç/iStockphoto<br />
17
18<br />
1.6<br />
Regional Urban Energy, Food and Water Security<br />
Impact of Climate Change on Water<br />
According to the IPCC’s 4 th Assessment Report, the<br />
Middle East and North Africa will become hotter and<br />
drier by the end of the century. Overall, the region is<br />
projected to warm by 2ºC by 2050 and 4ºC by 2100. Total<br />
water runoff will decline by 20 to 30 per cent by 2050. 25<br />
Within the region, models predict that the Mashreq will be<br />
2.5 to 3.7ºC hotter in the summer and 2.0 to 3.1ºC hotter<br />
in the winter by 2050. In the Maghreb, climate change will<br />
shift the Westerly winds, resulting in as much as a 12 per cent<br />
reduction in median annual precipitation by 2030.<br />
Together, these two trends will increase the frequency<br />
and severity of extreme weather, particularly severe drought.<br />
Models also predict a rise of 0.1 to 0.3 metres in sea level by<br />
2050, which will increase salt water intrusion into important<br />
coastal aquifers, including in Gaza.<br />
These changes will have significant and largely negative<br />
impacts on cities in the <strong>Arab</strong> world by displacing farmers and<br />
increasing urbanization pressures, increasing food imports,<br />
decreasing the availability of water in a region that is already<br />
water stressed, increasing the likelihood of flooding in coastal<br />
areas where most of the <strong>Arab</strong> world lives and increasing energy<br />
demands for cooling and desalination.<br />
For the Mashreq, a study predicted that climate change<br />
would cost countries 1 to 7 per cent of GDP. These pressures<br />
will raise the cost of living in cities and eventually surpass the<br />
ability of governments in the region to subsidize costs. Climate<br />
change therefore has the potential to destabilize the region.<br />
Water and Food Security<br />
FIGURE 4: PERCENTAGE OF NATIONAL URBAN POPULATION LIVING IN LOW-ELEVATION COASTAL ZONES (LECZ)<br />
% of national urban population in urban LECZ<br />
0.0 - 5.0<br />
5.1 - 10.0<br />
10.1 - 15.0<br />
15.1 -20.0<br />
20.1 - 25.0<br />
> 25.0<br />
City size<br />
Small: 100K - 500K<br />
Intermediate: 500K - 1 million<br />
Large: Over 1 million<br />
Source: UN-Habitat Global Urban Observatory 2008.<br />
Casablanca<br />
N<br />
Algiers<br />
0 1,000 2,000Km<br />
The <strong>Arab</strong> world is one of the most water scarce regions in<br />
the world, with an average of 2,000 cubic metres of renewable<br />
freshwater water per capita. Around 8 to 10 per cent of<br />
water is used for domestic consumption, 5 to 7 per cent for<br />
industrial uses, and 85 per cent for agriculture, making it the<br />
most vulnerable sector under climate change. 26<br />
Models project that domestic food production will decline<br />
by 10 to 20 per cent in the region due to climate change and<br />
by as much as 40 per cent in countries like Morocco. 27 It will<br />
have a tremendous impact on countries for which agriculture<br />
is a major employment base such as Algeria, Egypt, Morocco,<br />
Syria and Yemen.<br />
Tunis<br />
Tarabulus<br />
Alexandria<br />
Bur Sudan<br />
Djibouti<br />
Jeddah<br />
Aden<br />
Mogadishu
FIGURE 5: RENEWABLE WATER AVAILABLE AND TOTAL WATER WITHDRAWN PER CAPITA<br />
Water Available per Capita (m3/yr)<br />
Source: FAO Aquastat.<br />
FIGURE 6: VULNERABILITY OF ARAB COUNTRIES BASED ON THEIR CEREAL IMPORT DEPENDENCY AND FISCAL POSITION<br />
High<br />
Cereal Import Dependency<br />
Low<br />
4,000<br />
3,500<br />
3,000<br />
2,500<br />
2,000<br />
1,500<br />
1,000<br />
500<br />
0<br />
Most Vulnerable Dependent, but Fiscally Sound<br />
Jordan<br />
Lebanon Yemen<br />
Tunisia<br />
Syria<br />
Egypt Sudan<br />
Djibouti Bahrain<br />
Morocco<br />
Saudi <strong>Arab</strong>ia<br />
Algeria<br />
Iraq<br />
Less Dependent, but<br />
Fiscally Strained Least Vulnerable<br />
Source: Authors.Adapted from FAO, 2008b; IMF, 2008; World Bank, 2008b.<br />
Note: Cereal import dependancy is measured by net cereal imports/total cereal consumption.<br />
*2007 fiscal balances were drawn from the IMF. The most recent FAOSTAT data on cereal balances is for 2005.<br />
Source: World Bank. “Improving Food Security in <strong>Arab</strong> Countries.” Washington, DC.: World Bank, 2009.<br />
Qatar Oman<br />
Libya<br />
Deficit 0<br />
Fiscal Position<br />
Surplus<br />
Already, most <strong>Arab</strong> countries import over 50 per cent of the<br />
calories they consume, making the region very vulnerable to<br />
shocks in world food prices. The FAO Food Price Index hit<br />
peaks in 2008 at 185 and again in 2011 at 209, up from 100<br />
points in 2002-2004. 28<br />
The Horn of Africa and Yemen currently suffer from<br />
droughts that frequently lead to humanitarian crises. The<br />
urban poor, rural landless and smallholder farmers in other<br />
<strong>Arab</strong> countries are also at high risk. While these shocks were<br />
due to a convergence of unfortunate events, increasingly severe<br />
weather events worldwide and the growing cost of petroleum<br />
Renewable Water Resources (2008)<br />
Total Water Withdrawn (2002 or 2007)<br />
Algeria<br />
Libya<br />
Mauritania<br />
Morocco<br />
Tunisia<br />
Egypt<br />
Iraq<br />
Jordan<br />
Lebanon<br />
Palestine<br />
Syria<br />
Bahrain<br />
Kuwait<br />
Oman<br />
Qatar<br />
Saudi <strong>Arab</strong>ia<br />
UAE<br />
Comoros<br />
Djibouti<br />
Somalia<br />
Sudan<br />
Yemen<br />
UAE<br />
Kuwait<br />
water scarcity<br />
absolute scarcity<br />
Low Price Risk<br />
and Quantity Risk<br />
Low Price Risk<br />
High Quantity Risk<br />
High Price Risk<br />
and Quantity Risk<br />
Low Quantity Risk,<br />
High Price Risk<br />
– a major input in fertilizers and transportation – will make<br />
these shocks more commonplace as the region’s demand for<br />
food is growing as it urbanizes and develops economically.<br />
Common government responses to rising food prices have<br />
been to increase public sector wages and food subsidies,<br />
which now account for as much as 1.8 per cent of GDP in<br />
some countries. These tend to be imprecise and inflationary<br />
measures that often fail to target the poor and are difficult<br />
to retract when food prices drop. The oil-rich countries<br />
with fiscal surpluses may be able to continue to sustain this<br />
support mechanism, while countries with fiscal deficits and<br />
19
20<br />
<br />
In Yemen, smallholder farmers are at high risk due to climate change. ©Robert Paul van Beets/Shutterstock<br />
high dependency on cereal imports will need to respond with<br />
more targeted safety nets.<br />
The Gulf countries are heavily investing in agriculture in<br />
countries that have untapped water supplies, are logistically<br />
proximate and have cultural and political ties to the Gulf,<br />
such as Sudan and Turkey. Significant international and<br />
national efforts are also targeting increased agricultural<br />
efficiency to mitigate the impacts of climate change.<br />
Energy Mitigation and Adaptation<br />
North Africa and the Middle East have some of the highest<br />
potential for renewable energy in the world. Two major<br />
initiatives are underway to build solar and wind facilities that<br />
transmit energy to Europe to allow it to meet its commitment<br />
to reduce its carbon footprint.<br />
The ongoing USD 750 million World Bank Concentrated<br />
Solar Scale-up Programme aims to build 20GW of<br />
concentrated solar power around the Mediterranean by 2020,<br />
most of it in Maghreb and Mashreq countries. The proposed<br />
multi-billion dollar DESERTEC initiative, implemented<br />
by a consortium of European and Algerian companies led<br />
by MÜnich Re, aims to build a network of solar and wind<br />
facilities throughout the Middle East and North Africa<br />
(MENA) region, with large-scale plans to be established by<br />
2012 and pilots beginning in Morocco.<br />
These projects depend on the political cooperation<br />
between countries, some of which have closed their borders<br />
to each other. If successful, they will contribute to the<br />
employment base and economies of their host countries.<br />
The Gulf countries are also beginning to invest in nuclear<br />
power and renewable energy in preparation for declining oil<br />
production.<br />
In addition, one of the region’s most interesting innovations<br />
is Masdar City, located 17 km from Abu Dhabi City. The<br />
USD 15-30 billion project aims to create a zero-waste, zeroimported<br />
energy city that will accommodate 40,000 residents<br />
and 70,000 employees and feature futuristic designs such as<br />
subterranean pod-cars. The technologies and urban design of<br />
the city could be transformative for the region.<br />
Adaptation to Climate Change<br />
International support to <strong>Arab</strong> countries has focused on<br />
agricultural productivity and fisheries as well as coastal<br />
sustainability. Significant investments are also underway<br />
throughout the region to increase wastewater reclamation<br />
and reuse, and reduce water loss in distribution networks.<br />
In the Gulf, the UAE is a leader in efforts to prepare for<br />
climate change given that 85 per cent of the population<br />
and over 90 per cent of the infrastructure are within a few<br />
metres of sea level. According to a 2010 ranking of countries’<br />
vulnerability to climate change based on their ability to adapt<br />
to risks, Comoros, Somalia and Yemen are among the top<br />
five most vulnerable countries in the world. These countries<br />
in particular will need international support on technical<br />
issues as well as institutional capacity building in regards to<br />
climate resilience.
1.7<br />
Regional Corridors and Cooperation<br />
Development corridors are an important feature of <strong>Arab</strong><br />
countries, particularly in the Mashreq and Maghreb,<br />
where urban settlements have historically grown<br />
and flourished along riverbanks and trade routes. Modern<br />
transportation networks extending across national boundaries<br />
have overlaid highways linking key cities across more barren<br />
lands. There are two general models of urbanization: extended<br />
metropolitan regions (EMRs) centred on a single city and mega<br />
urban regions (MURs) based on a group of cities physically<br />
connected by multi-modal transportation networks.<br />
The Greater Cairo Region, with almost 20 million residents,<br />
is the largest EMR in the <strong>Arab</strong> world. Situated at the southern<br />
edge of the Nile Delta, it anchors several strategic corridors<br />
with Port Said, the Suez Canal cities and Alexandria. The<br />
Alexandria-Cairo corridor is 225 kilometres long and the<br />
largest and most important MUR in the <strong>Arab</strong> region.<br />
Other important but smaller-scale corridors in the Mashreq<br />
include the Damascus-Homs MUR in Syria and the Amman-<br />
<br />
Cairo’s ring road links the city to the country’s major urban corridors.<br />
©Ad Meskens/Wikimedia Commons. Licensed under the Creative Commons Attribution-<br />
Share Alike 3.0 Unported license.<br />
Zarqa MUR in Jordan. In the Maghreb, the Southern<br />
Mediterranean coast serves as the major east-west corridor<br />
and the Kenitra-El Jadida MUR serves as the major northsouth<br />
corridor. At their nexus, Tangier and its free trade zone<br />
is emerging as a new major EMR.<br />
A number of projects are underway to improve regional<br />
integration through better road networks, railways and<br />
electrical grids, as well as streamlined trade and customs<br />
procedures. Although these efforts face a number of difficulties<br />
that include border closures and competition for resources,<br />
planned infrastructure networks could lead to the creation of<br />
new MURs in the region.<br />
In the Mashreq, the World Bank has proposed major<br />
transportation investments along three corridors: a northsouth<br />
corridor that would link the European Union and the<br />
Gulf Cooperation Council through Turkey, Syria and Jordan<br />
and two east-west corridors that would link Syrian ports with<br />
Iraq. The GCC is planning over USD 100 billion in rail<br />
improvements, including one project to create a regional rail<br />
system that would stretch from Muscat to Kuwait and connect<br />
with railways in the Mashreq and Maghreb, as well as another<br />
to connect Jeddah, Riyadh and Bahrain.<br />
Managing these regional agglomerations requires complex<br />
planning and greater government coordination, both<br />
horizontally and vertically. Following rapid urban growth,<br />
the emergence of urban corridors and serious environmental<br />
challenges, countries have renewed their focus on national<br />
and regional strategic plans and spatial frameworks. Jordan<br />
launched its first national land use master plan in 2006,<br />
along with comprehensive master plans for eight major<br />
municipalities. Lebanon published its first national physical<br />
plan in 2005, followed by Libya in 2006 and Morocco in<br />
2008.<br />
Though plans vary, they typically stress diverting growth to<br />
secondary cities to alleviate pressures on the primary cities,<br />
improving urban mass transit and promoting economic<br />
diversification. The concept of technopoles or hi-tech<br />
industrial parks is popular in the Maghreb and Egypt, which<br />
have planned a series of differentiated parks in secondary cities<br />
that build on existing educational and industrial resources.<br />
In parallel with regional planning efforts, several countries<br />
are also strengthening national-local collaboration on planning<br />
and development, creating sub-national/governorate-level<br />
planning agencies and empowering local administrations to<br />
draft and implement their own plans. Syria has published<br />
a National Law on Regional Planning and launched a new<br />
Higher Commission for Regional Planning in 2010 to<br />
formulate a national framework on integrated development.<br />
As urban corridors expand beyond national boundaries,<br />
however, there will be an increasing need for coordination at<br />
the international level.<br />
21
22 1.8 Emerging Governance Issues<br />
<br />
Thousands of Egyptians gather at a demonstration in Tahrir Square, Cairo, Egypt. ©MOHPhoto/Shutterstock
The impacts of civil unrest made 2011 a landmark<br />
year in the history of the <strong>Arab</strong> world. The combined<br />
effects of unbalanced economic liberalization and<br />
partial integration in the global system created opportunities<br />
for a select group who had the capacity and the contacts to<br />
accumulate wealth. An upward spiral in the prices of basic<br />
staples over the past decade was exacerbated by a sharp rise<br />
in commodity prices in the past two years. The necessity to<br />
import wheat at double the price of the previous year strained<br />
government budgets and resulted in higher food prices.<br />
Despite significant and unsustainable public subsidies,<br />
the poor suffered serious hardships. Widening income<br />
disparities, very high unemployment rates among the<br />
labour force in the 15 to 25 years age bracket aggravated the<br />
perception of social inequity, ineptitude and corruption in<br />
the system of governance.<br />
The youth rose to protest the prevailing situation and<br />
demand reforms to bring about social justice and political<br />
transparency. Other groups demonstrated to demand<br />
lower food prices, jobs and affordable housing. Social<br />
equity requires the generation of opportunities to earn<br />
living wages, the creation of avenues for advancement and<br />
the empowerment of vulnerable and marginalized groups.<br />
Political transparency requires representative government,<br />
legal guarantees of individual rights and accountability in<br />
governance.<br />
Apart from the oil-exporting countries, demographic and<br />
economic realities hamper the achievement of lofty social<br />
objectives elsewhere in the <strong>Arab</strong> world. However, it is now<br />
clear that employment generation rather than investment<br />
in urban real estate and land development is the strategic<br />
objective that should be given priority by governments. This<br />
requires supporting local entrepreneurship and attracting<br />
domestic and foreign investment.<br />
Governments that managed to deal with the protests<br />
and the new interim governments that replaced discredited<br />
regimes have pledged to undertake reforms to respond to<br />
popular demands including:<br />
<br />
<br />
<br />
capable of expressing divergent views without fear of<br />
retribution;<br />
<br />
public office, irrespective of political affiliation;<br />
<br />
<br />
<br />
arrive at a consensus rather than the imposition of a<br />
platform by the more vocal and politically potent.<br />
The local level is the one that most affects urban governance.<br />
The demands expressed by demonstrators translate into<br />
requests for decentralization of authority and resources not<br />
just administrative deconcentration of centralized services.<br />
This implies greater local control over local affairs by elected<br />
governors and mayors and local councils.<br />
While protests everywhere were not devoid of ethnic<br />
and religious overtones, the demand for greater local<br />
administrative autonomy is genuine and widespread. With<br />
few exceptions, local councils in <strong>Arab</strong> countries are elected<br />
while governors and mayors are appointed. Yet where the<br />
one-party political system endured or the ruling elite party<br />
concentrated political and economic power, elected local<br />
councils lost their legitimacy as true representative of the<br />
people. In Egypt, demonstrators demanded that existing<br />
local councils be disbanded as they were widely viewed as<br />
corrupt extensions of the power structure.<br />
City council members are elected in both Egypt and Syria<br />
but the city mayors are appointed in Egypt while in Syria,<br />
they are elected by the members of the city council from<br />
among themselves. In Morocco, the role is divided between<br />
two officials: an appointed “prefect” who holds the police<br />
powers and an elected president of the city council, who<br />
manages the municipal services, interacts with residents and<br />
controls the budget.<br />
Interestingly, the recent events have underscored the<br />
inherent inefficiency of a lack of unified government in<br />
metropolitan urban regions. The coordination required<br />
among several local entities in a metropolitan region broke<br />
down in a situation of crisis management. Such lifelines<br />
as transport systems, utility networks, public services and<br />
emergency assistance were unable to respond to competing<br />
demands in the face of unpredictable disruptions and<br />
obstructions.<br />
Greater Cairo, which grew to spread over three governorates,<br />
was divided into five governorates in April 2010. It has<br />
now been re-aggregated into the three former governorates.<br />
There are proposals calling for the establishment of one<br />
jurisdictional entity covering the mega-city under a new<br />
appointed governor.<br />
At this time, the final systems of governance that will<br />
emerge in the different countries after the upheaval are<br />
unclear. The outcome will undoubtedly be shaped by political<br />
realities. Different views of efficiency and effectiveness<br />
in urban planning and management are being discussed.<br />
Divergent positions on how to provide safety and security<br />
to all citizens while curbing arbitrariness and corruption in<br />
decision making and the exercise of police powers have been<br />
advanced.<br />
Ongoing debates in the media reflect a mix of idealism and<br />
pragmatism with a dose of opportunistic posturing. They<br />
do, however, herald a welcome healthy effort at initiating a<br />
participatory approach leading to a better understanding of<br />
the challenges and complexity of urban governance before<br />
embarking on shaping its future structure.<br />
From a social viewpoint, their concern with providing<br />
services to the poor is laudable and the model they offer<br />
is efficient although its sustainability at the city scale is in<br />
question. It is doubtful whether such groups, with their<br />
hierarchical structures, can be adapted to perform in the<br />
secular and inclusive organization of a modern day city. From<br />
the economic viewpoint, retrograde convictions have little to<br />
23
24<br />
contribute to fostering the productivity and competitiveness<br />
of cities as engines of growth in the 21 st century in countries<br />
where industrial diversification, tourism and services are<br />
drivers of economic development.<br />
The 2011 events in the Mashreq and Maghreb regions<br />
were urban manifestations. In Tunisia and Egypt, the<br />
protesters who demanded political reforms and change were<br />
concentrated in the large cities. The presence of the best<br />
and largest universities and other educational, research and<br />
cultural institutions in these cities accounted for the bulk of<br />
the educated, ICT and computer-literate young people who<br />
coordinated and led protests. The significant participation of<br />
women in these protests was a striking new development for<br />
many countries.<br />
While ministries and other administrative functions<br />
clustered in the capital, businesses and industries were<br />
spread among the larger cities, which also housed the vast<br />
majority of dwellers in underserviced informal settlements.<br />
This combination generated the crowds of frustrated blue<br />
and white-collar workers whose wages were now insufficient<br />
to provide decent living conditions for their families in the<br />
face of rising food prices and the escalating land prices and<br />
construction costs that progressively squeezed them out of<br />
both the formal and informal housing markets.<br />
In Egypt, they clamoured for higher wages, food subsidies,<br />
affordable housing and stable employment for themselves<br />
and their children. Those among them who echoed the calls<br />
for political reforms reflected their conviction that acquisitive<br />
and corrupt individuals among those who held power abused<br />
the system to amass wealth and caused the hardships that the<br />
poorer segments of the population were enduring.<br />
In the secondary cities and some rapidly urbanizing<br />
settlements around the larger cities, demonstrations were<br />
sparked by local incidents and sustained by long-standing<br />
divisive issues, deeply-engrained ethnic and religious<br />
cleavages and a general feeling of social inequity and<br />
exclusion as happened in Syria and Bahrain, or tribal rivalries<br />
as in Libya and Yemen.<br />
In the sprawling 20 million inhabitant mega urban region<br />
centering around Cairo, the breakdown of law and order<br />
in the last days of January allowed criminals and thugs to<br />
loot stores and threaten and rob peaceful citizens. Alarmed<br />
employees fearing the loss of their jobs banded together with<br />
citizens seeking to protect their families and their properties<br />
to defend their businesses and their houses and drive away<br />
thugs and demonstrators.<br />
In countries where ethnic and religious cleavages or<br />
tribal rivalries are deeply entrenched, they are reflected in<br />
the physical pattern of the urban agglomeration. Incidents<br />
triggered clashes among city neighbourhoods and between<br />
city districts and the security forces as happened in Lebanon,<br />
Syria and Yemen.<br />
While the military and security forces were dealing with civil<br />
unrest, unscrupulous persons took this opportunity to grab<br />
publicly-owned land and to construct or expand buildings<br />
without a permit in violation of existing regulations. Literally<br />
hundreds of thousands of informally-built structures were<br />
started and thousands of hectares of agricultural land lost<br />
to urbanization in Egypt, Syria and Tunisia, a phenomenon<br />
that had already been experienced in Lebanon during the<br />
civil war and its aftermath.<br />
The vast expansion of informal areas is a challenge that<br />
national and local authorities will have to deal with as law<br />
and order are restored. In Libya, the civil war has caused<br />
massive damage in the urban centres.<br />
Within three to four months of the uprisings, people in<br />
Tunisia and Egypt started to understand that regime change<br />
alone would not solve their problems. The sharp economic<br />
downturn created by the civil unrest needed to be reversed.<br />
In the cities, the number of unemployed swelled because of<br />
layoffs, particularly in the tourism industry, and migrant<br />
workers returning from war zones and unstable areas in<br />
Libya. Day labourers were suffering severe hardships through<br />
the lack of gainful jobs.<br />
In Tunisia and Egypt, popular opposition to the continued<br />
demonstrations by hard-core protesters and groups with<br />
particular agendas is mounting and the leadership that is<br />
running the countries and the new cabinets that took office<br />
in the aftermath of the upheaval are facing unprecedented<br />
economic and social challenges that must be addressed.<br />
As stability is restored throughout the <strong>Arab</strong> world, new<br />
pragmatic development strategies, bold urban programmes<br />
and local initiatives are needed for the region to achieve its<br />
economic, social and cultural potential. Urban planning and<br />
management at the national and local levels will be resumed<br />
in order to address the multi-sectoral impediments that<br />
constrain the functional efficiency of large- and middle-sized<br />
cities.<br />
These nodes drive the creation of jobs that can meet the<br />
expectations of the labour force and the aspirations of youth.<br />
Economic development must be reflected in a reduction<br />
of the divergence in the rate of income growth among the<br />
different segments of the population.<br />
The sustainability and liveability of cities in the different<br />
<strong>Arab</strong> countries will require a substantive improvement in<br />
the living conditions of the urban poor. Communities must<br />
be engaged in a meaningful discussion of sustainability and<br />
residents must fully participate in defining the future of their<br />
neighbourhoods.<br />
The public and private sectors and civil society must<br />
partner in shaping the <strong>Arab</strong> cities of the 21 st century. In this<br />
context, a thorough review of the state of the <strong>Arab</strong> cities<br />
today is relevant and timely.
Statistical Annex<br />
TABLE 2: ARAB REGIONS’ URBANIZATION RATES, URBAN AND TOTAL POPULATION AND GROWTH RATES<br />
Percentage Urban<br />
(2010)<br />
Annual<br />
Urban Growth Rate<br />
(2005-2010)<br />
Population (thousands)<br />
Urban (2010) Total (2010)<br />
Average Annual<br />
Total Population<br />
Growth Rate<br />
(2005-2010)<br />
Mashreq 55.6% 2.5% 82,095 147,657 2.2%<br />
Maghreb 63.7% 2.4% 55,886 87,715 1.4%<br />
GCC 75.4% 3.0% 32,781 43,500 5.4%<br />
Southern Tier 37.4% 4.6% 29,406 78,559 2.8%<br />
<strong>Arab</strong> Countries 56.0% 2.8% 200,168 357,431 2.5%<br />
Source: United Nations, Department of Economic and Social Affairs, Population Division (2010). World Urbanization Prospects: The 2009 Revision. CD-ROM Edition - Data in digital form (POP/DB/<br />
WUP/Rev.2009).<br />
Note: because WUP urban population data is quinquennial, the rates of average annual urbanization and total population growth rate are presented here as (2010 data – 2005 data)/(2005 data)/5;<br />
this is less accurate than an average of year on year rates of change.<br />
TABLE 3: ARAB REGIONS’ URBAN POPULATION TREND (1970-2050) IN THOUSANDS<br />
1970 1990 2010 2030 2050<br />
Mashreq 26,467 50,235 82,095 127,631 181,075<br />
Maghreb 14,095 34,027 55,886 79,907 97,553<br />
GCC 4,112 18,112 32,781 47,613 59,468<br />
Southern Tier 4,297 12,291 29,406 60,273 100,511<br />
<strong>Arab</strong> Countries 48,971 114,665 200,168 315,424 438,607<br />
Source: WUP 2009.<br />
TABLE 4: ARAB REGIONS' URBANIZATION TREND 1970-2050<br />
1970 1990 2010 2030 2050<br />
Mashreq 46.0% 52.9% 55.6% 60.3% 67.1%<br />
Maghreb 37.8% 52.7% 63.7% 74.3% 82.5%<br />
GCC 52.7% 79.2% 75.4% 78.0% 82.2%<br />
Southern Tier 17.2% 26.7% 37.4% 47.2% 54.1%<br />
<strong>Arab</strong> Countries 38.4% 50.2% 56.0% 62.1% 67.9%<br />
Source: WUP 2009.<br />
25
26<br />
SIZE OF ARAB CITIES<br />
>10 million 5-10m 1-5m 0.5-1m
TABLE 8: YOUTH UNEMPLOYMENT AS A PERCENTAGE OF TOTAL UNEMPLOYMENT<br />
Region Country Youth Unemployment as a<br />
Percentage of Total<br />
Unemployment<br />
Mashreq<br />
Maghreb<br />
GCC<br />
Source: ILO LABORSTA Database.<br />
Data Source and Year<br />
Egypt 63% 2007 Labour Force Survey<br />
Lebanon 45% 2007 HH survey<br />
Syria 57% 2007 Labour Force Survey<br />
West Bank and Gaza 37% 2008 Labour Force Survey<br />
Algeria 45% 2008 Labour Force Survey<br />
Morocco 82% 2008 Labour Force Survey<br />
Tunisia 42% 2005 Labour Force Survey<br />
Bahrain 22% 2007 Employment Office Records<br />
Kuwait 31% 2008 Administrative reports<br />
Qatar 52% 2008 Labour Force Survey<br />
Saudi <strong>Arab</strong>ia 52% 2008 Labour Force Survey<br />
UAE 33% 2005 Population Census<br />
TABLE 9: POPULATION RESIDING IN AGGLOMERATION AS PERCENTAGE OF TOTAL POPULATION<br />
Urban Agglomeration 2005 2010 2015 2020 2025<br />
Beirut 43.5% 45.5% 45.9% 45.6% 45.1%<br />
Dubai 30.9% 33.3% 34.1% 34.2% 34.0%<br />
Baghdad 18.9% 18.7% 18.4% 18.2% 18.0%<br />
Riyadh 17.8% 18.5% 18.6% 18.4% 18.1%<br />
Amman 18.7% 17.1% 17.1% 16.9% 16.9%<br />
Tripoli 17.9% 16.9% 16.7% 16.7% 16.7%<br />
Mogadishu 16.9% 16.0% 16.7% 17.6% 18.6%<br />
Aleppo 13.6% 13.7% 14.3% 14.6% 14.8%<br />
Cairo 13.7% 13.0% 12.7% 12.7% 12.9%<br />
Jeddah 12.1% 12.3% 12.3% 12.2% 12.1%<br />
Khartoum 11.7% 12.0% 12.7% 13.4% 14.0%<br />
Damascus 12.0% 11.5% 11.9% 12.1% 12.4%<br />
Casablanca 10.3% 10.1% 10.3% 10.5% 10.7%<br />
Sana’a 8.6% 9.7% 10.5% 11.3% 12.1%<br />
Algiers 7.6% 7.9% 8.1% 8.3% 8.4%<br />
Homs 5.6% 5.9% 6.3% 6.4% 6.6%<br />
Mecca 5.6% 5.7% 5.7% 5.7% 5.6%<br />
Rabat 5.4% 5.6% 5.7% 5.9% 6.0%<br />
Alexandria 5.2% 5.2% 5.2% 5.3% 5.4%<br />
Mosul 4.4% 4.6% 4.7% 4.7% 4.7%<br />
Source: Population Division of UN DESA, World Population Prospects: The 2008 Revision and World Urbanization Prospects: The 2009 Revision.<br />
27
28<br />
TABLE 10: GROWTH OF LARGEST CITIES<br />
Urban Area 1950 1955 1960 1965 1970 1975 1980 1985 1990 1995 2000 2005 2010 2015 2020 2025<br />
Cairo 2,494 3,029 3,680 4,738 5,585 6,450 7,349 8,328 9,061 9,707 10,170 10,565 11,001 11,663 12,540 13,531<br />
Baghdad 579 719 1,019 1,614 2,070 2,620 3,145 3,607 4,092 4,598 5,200 5,327 5,891 6,614 7,321 8,043<br />
Khartoum 183 252 347 477 657 886 1,164 1,611 2,360 3,242 3,949 4,518 5,172 6,046 7,005 7,953<br />
Riyadh 111 131 156 227 408 710 1,055 1,566 2,325 3,035 3,567 4,193 4,848 5,373 5,809 6,196<br />
Alexandria 1,037 1,249 1,504 1,752 1,987 2,241 2,519 2,826 3,063 3,277 3,592 3,973 4,387 4,791 5,201 5,648<br />
Casablanca 625 778 967 1,206 1,505 1,793 2,109 2,406 2,682 2,951 3,043 3,138 3,284 3,537 3,816 4,065<br />
Jeddah 119 129 141 197 348 594 851 1,217 1,742 2,200 2,509 2,860 3,234 3,569 3,868 4,138<br />
Aleppo 319 392 480 588 721 879 1,070 1,292 1,554 1,864 2,204 2,605 3,087 3,510 3,864 4,244<br />
Algiers 516 623 872 1,081 1,281 1,507 1,621 1,672 1,815 2,023 2,254 2,512 2,800 3,099 3,371 3,595<br />
Damascus 367 461 579 727 914 1,122 1,376 1,546 1,691 1,854 2,063 2,294 2,597 2,918 3,213 3,534<br />
Sana’a 46 58 72 89 111 141 238 402 653 1,034 1,365 1,801 2,342 2,934 3,585 4,296<br />
Beirut 322 425 561 733 923 1,500 1,623 1,585 1,293 1,268 1,487 1,777 1,937 2,033 2,090 2,135<br />
Rabat 145 184 233 339 494 641 808 986 1,174 1,379 1,507 1,647 1,802 1,973 2,139 2,288<br />
Dubai 20 28 39 50 80 167 254 345 473 650 906 1,264 1,567 1,772 1,934 2,076<br />
Mogadishu 69 73 94 146 272 445 551 747 1,035 1,147 1,201 1,415 1,500 1,795 2,156 2,588<br />
Mecca 148 152 157 190 272 383 501 655 856 1,033 1,168 1,319 1,484 1,642 1,789 1,924<br />
Mosul 145 168 205 261 322 397 489 603 736 889 1,056 1,236 1,447 1,676 1,885 2,092<br />
Homs 101 126 159 200 251 312 387 470 565 684 856 1,072 1,328 1,536 1,702 1,881<br />
Tripoli 106 136 174 235 398 580 662 756 862 984 1,022 1,059 1,108 1,192 1,286 1,364<br />
Amman 90 140 218 299 388 500 636 736 851 973 1,007 1,042 1,105 1,186 1,272 1,364<br />
Source: United Nations, Department of Economic and Social Affairs, Population Division (2010). World Urbanization Prospects: The 2009 Revision. CD-ROM Edition - Data in digital form (POP/DB/WUP/Rev.2009).
TABLE 11: AVERAGE ANNUAL GROWTH RATES FOR THE LARGEST ARAB CITIES<br />
2020<br />
-2025<br />
2015<br />
-2020<br />
2010<br />
-2015<br />
2005<br />
-2010<br />
2000<br />
-2005<br />
1995<br />
-2000<br />
1990<br />
-1995<br />
1985<br />
-1990<br />
1980<br />
-1985<br />
1975<br />
-1980<br />
1970<br />
-1975<br />
1965<br />
-1970<br />
1960<br />
-1965<br />
1955<br />
-1960<br />
1950<br />
-1955<br />
Sana’a 4.5 4.5 4.3 4.3 4.8 10.5 10.5 9.7 9.2 5.6 5.5 5.3 4.5 4.0 3.6<br />
Mogadishu 1.1 5.1 8.8 12.5 9.8 4.3 6.1 6.5 2.0 0.9 3.3 1.2 3.6 3.7 3.7<br />
Sulaimaniya 3.7 5.6 7.3 6.6 6.5 6.5 6.5 5.0 3.7 3.7 3.7 3.7 3.3 2.5 2.2<br />
Hama 2.2 2.2 2.2 2.2 2.3 2.3 2.5 2.5 3.1 6.3 6.3 5.7 3.3 2.1 2.1<br />
Khartoum 6.4 6.4 6.4 6.4 6.0 5.5 6.5 7.6 6.4 4.0 2.7 2.7 3.1 3.0 2.5<br />
Mosul 3.0 4.0 4.8 4.2 4.2 4.2 4.2 4.0 3.8 3.4 3.2 3.2 2.9 2.4 2.1<br />
Homs 4.6 4.6 4.6 4.6 4.4 4.4 3.9 3.7 3.8 4.5 4.5 4.3 2.9 2.1 2.0<br />
Erbil 3.9 7.4 10.3 7.8 7.6 7.6 7.6 5.5 3.7 3.2 2.9 2.9 2.7 2.3 2.1<br />
Sharjah 0.5 0.5 0.5 6.4 13.3 15.3 7.4 6.2 6.1 7.1 7.2 4.8 2.7 1.9 1.5<br />
Aleppo 4.1 4.1 4.1 4.1 4.0 4.0 3.8 3.7 3.6 3.4 3.4 3.4 2.6 1.9 1.9<br />
Dubai 6.7 6.7 5.0 9.4 14.6 8.4 6.1 6.3 6.4 6.6 6.7 4.3 2.5 1.8 1.4<br />
Dammam 5.5 5.6 7.7 9.9 9.5 7.4 7.4 7.4 5.3 3.6 3.6 3.3 2.3 1.8 1.5<br />
Damascus 4.6 4.6 4.6 4.6 4.1 4.1 2.3 1.8 1.9 2.1 2.1 2.5 2.3 1.9 1.9<br />
Baghdad 4.3 7.0 9.2 5.0 4.7 3.7 2.7 2.5 2.3 2.5 0.5 2.0 2.3 2.0 1.9<br />
Medina 1.3 1.3 5.8 10.2 9.6 6.2 6.2 6.2 4.7 3.5 3.5 3.1 2.3 1.8 1.5<br />
Tanger 4.0 3.1 2.5 2.5 4.1 4.6 4.2 3.9 3.7 3.0 3.0 2.8 2.2 1.8 1.5<br />
Agadir 4.5 4.5 11.7 11.7 12.3 12.5 9.0 6.3 5.7 2.6 2.6 2.4 2.1 1.8 1.5<br />
Riyadh 3.4 3.4 7.5 11.7 11.1 7.9 7.9 7.9 5.3 3.2 3.2 2.9 2.1 1.6 1.3<br />
Basra 4.8 6.5 7.9 1.6 1.2 1.2 1.2 3.7 5.7 3.7 2.0 2.0 2.1 2.2 2.1<br />
Algiers 3.8 6.7 4.3 3.4 3.2 1.5 0.6 1.6 2.2 2.2 2.2 2.2 2.0 1.7 1.3<br />
Mecca 0.6 0.6 3.9 7.2 6.9 5.4 5.4 5.4 3.8 2.5 2.5 2.4 2.0 1.7 1.5<br />
Jeddah 1.8 1.8 6.6 11.4 10.7 7.2 7.2 7.2 4.7 2.6 2.6 2.5 2.0 1.6 1.4<br />
Marrakech 1.5 1.5 2.8 2.8 2.6 2.5 3.1 3.5 3.3 2.1 2.1 2.1 2.0 1.7 1.4<br />
Fes 5.3 5.3 2.8 2.8 3.2 3.3 3.1 2.9 2.7 2.0 2.0 2.0 1.9 1.7 1.4<br />
Rabat 4.7 4.7 7.5 7.5 5.2 4.6 4.0 3.5 3.2 1.8 1.8 1.8 1.8 1.6 1.4<br />
Alexandria 3.7 3.7 3.1 2.5 2.4 2.3 2.3 1.6 1.4 1.8 2.0 2.0 1.8 1.6 1.7<br />
Casablanca 4.4 4.4 4.4 4.4 3.5 3.3 2.6 2.2 1.9 0.6 0.6 0.9 1.5 1.5 1.3<br />
Tripoli 5.0 5.0 6.0 10.6 7.5 2.6 2.6 2.6 2.6 0.8 0.7 0.9 1.5 1.5 1.2<br />
Oran 1.3 1.3 1.3 3.4 3.8 2.8 2.4 1.4 0.9 0.9 0.9 0.9 1.4 1.7 1.5<br />
Amman 8.8 8.9 6.3 5.2 5.1 4.8 2.9 2.9 2.7 0.7 0.7 1.2 1.4 1.4 1.4<br />
Tunis 1.2 1.3 1.3 1.7 1.8 0.9 1.0 1.2 1.2 0.8 0.6 0.9 1.2 1.2 1.0<br />
Cairo 3.9 3.9 5.1 3.3 2.9 2.6 2.5 1.7 1.4 0.9 0.8 0.8 1.2 1.5 1.5<br />
Beirut 5.5 5.5 5.4 4.6 9.7 1.6 -0.5 -4.1 -0.4 3.2 3.6 1.7 1.0 0.6 0.4<br />
Source: Population Division of UN DESA, World Population Prospects: The 2008 Revision and World Urbanization Prospects: The 2009 Revision and World Urbanization Prospects<br />
29
30<br />
TABLE 12: 2008 ACCESS TO IMPROVED WATER AND SANITATION (% OF HOUSEHOLDS)<br />
Improved Water Improved Sanitation<br />
Urban Access Total Access Urban Access Total Access<br />
Mashreq 96 82 91 87<br />
Maghreb 91 82 91 81<br />
GCC 97 .. 100 ..<br />
Southern Tier 67 56 64 38<br />
<strong>Arab</strong> Countries 91 75 88 68<br />
Source: WHO UNICEF Joint Monitoring Programme.<br />
TABLE 13: POPULATION RESIDING IN AGGLOMERATION AS PERCENTAGE OF URBAN POPULATION<br />
Urban Agglomeration 2005 2010 2015 2020 2025<br />
Beirut 50.3% 52.2% 52.3% 51.4% 50.5%<br />
Mogadishu 48.1% 42.8% 41.7% 40.9% 40.1%<br />
Dubai 37.6% 39.6% 39.9% 39.4% 38.7%<br />
Sana'a 29.6% 30.4% 30.2% 29.7% 29.0%<br />
Cairo 31.8% 30.0% 28.6% 27.7% 26.8%<br />
Khartoum 32.0% 29.9% 28.9% 28.2% 27.5%<br />
Baghdad 28.2% 28.3% 27.9% 27.3% 26.6%<br />
Aleppo 25.3% 24.6% 24.8% 24.2% 23.7%<br />
Riyadh 21.9% 22.5% 22.3% 21.8% 21.3%<br />
Tripoli 23.2% 21.7% 21.1% 20.8% 20.5%<br />
Amman 23.9% 21.7% 21.6% 21.2% 20.9%<br />
Damascus 22.3% 20.7% 20.6% 20.1% 19.7%<br />
Casablanca 18.6% 17.4% 16.8% 16.5% 16.1%<br />
Jeddah 15.0% 15.0% 14.8% 14.5% 14.2%<br />
Alexandria 12.0% 12.0% 11.8% 11.5% 11.2%<br />
Algiers 12.1% 11.9% 11.7% 12.0% 11.3%<br />
Homs 10.4% 10.6% 10.8% 10.7% 10.5%<br />
Rabat 9.8% 9.6% 9.4% 9.2% 9.1%<br />
Mecca 6.9% 6.9% 6.8% 6.7% 6.6%<br />
Mosul 6.5% 6.9% 7.1% 7.0% 6.9%<br />
Source: Population Division of UN DESA, World Population Prospects: The 2008 Revision and World Urbanization Prospects: The 2009 Revision
ENDNOTES<br />
1 Unless otherwise noted, Sudan refers to the formerly<br />
united country throughout this report due to the lack<br />
of data at the time of writing on a distinct Sudan and<br />
South Sudan.<br />
2 United Nations Development Programme, <strong>Arab</strong><br />
States, Poverty Reduction.<br />
3 World Bank Development Indicators.<br />
4 UNDP. “The Third <strong>Arab</strong> Report on the Millennium<br />
Development Goals 2010 and the Impact of the Global<br />
Economic Crises.” New York: United Nations 2009.<br />
5 Human Development Report 2009 Statistics on<br />
Conflict-Induced Movement.<br />
6 <strong>Arab</strong> Human Development Report, p. 9.<br />
7 World Bank Development Indicators Database, <strong>Arab</strong><br />
Fund for Economic and Social Development, the <strong>Arab</strong><br />
Monetary Fund, the Organization of <strong>Arab</strong> Petroleum<br />
Exporting Countries and the Secretariat of the <strong>Arab</strong><br />
League. “Unified <strong>Arab</strong> Economic Report.” 2009.<br />
8 United Nations Development Programme. Regional<br />
Bureau for <strong>Arab</strong> States United <strong>Arab</strong> Emirates.<br />
Mohammed Bin Rashid Al Maktoum Foundation,<br />
“<strong>Arab</strong> Knowledge Report 2009: Towards Productive<br />
Intercommunication for Knowledge”, Abu Dhabi,<br />
2009, 312 pp. (p. 10)<br />
9 UN COMTRADE Database 2009, as cited in Younes,<br />
H. “The Contribution of Trade to Growth of the <strong>Arab</strong><br />
Countries.” Paper presented at the Conference on<br />
Empirical Investigation in Trade and Investment in<br />
Tokyo, Japan on March 11-13, 2010.<br />
10 Tosun, M.S. and S. Yilmaz. “Centralization,<br />
Decentralization, and Conflict in the Middle East and<br />
North Africa.” Washington, D.C.: World Bank, 2008.<br />
11 Tosun, 2008.<br />
12 Yara Shalem (god of twilight) was the name given by<br />
the Canaanites after their god.<br />
13 Michalopoulos Andre, “Influence of Hellenism in the<br />
Middle East” in Background of the Middle East (editor:<br />
Ernest Jackh), N.Y., Cornell University Press, (1952),<br />
p. 47<br />
14 Butzer Karl W., “Other Perspectives on Urbanism:<br />
Beyond the Disciplinary Boundaries” in ( J.Marcus<br />
and J.A. Sabloff, editors), The Ancient City, New<br />
Perspectives on Urbanism in the Old and New World,<br />
New Mexico, School for Advanced Research Press,<br />
(2008), p. 82<br />
15 Yat Tin Lee Reuben, Romanization in Palestine, Oxford,<br />
BAR International Series 1180, (2003), p. 36-37<br />
16 Dan Bahat believes that there was a colonnaded<br />
street near the west wall of the Temple Mount in<br />
Jerusalem. “The Western Wall Tunnels.” In H. Geva<br />
(ed.) Ancient Jerusalem Revealed, Jerusalem, (1994),<br />
p. 188. Also quoted by Reuben Yat Tin Lee in<br />
Op.cit.p. 36<br />
17 Famous intellectuals like Taha Hussein (1889-1973),<br />
an influential writer and leader of the modernist<br />
movement in the <strong>Arab</strong> world, studied at al-Azhar<br />
University.<br />
18 Costello V.F., Urbanization in the Middle East, London,<br />
Cambridge University Press, 1977, p.22-23<br />
19 The traditional suq – covered or uncovered -<br />
concentrates small shops along one or several streets<br />
which specialize in the same product but each shop<br />
offers the shopper different qualities and prizes.<br />
Often in suqs located in the historic centres, the<br />
retail salesman is also a craftsman. The principle of<br />
specialization is expressed in a division of labour and<br />
creates a hierarchy of professions and products from<br />
the most luxurious (jewelry) to the most basic (food).<br />
20 Noorddin Hoshiar, “Globalization and the Search for<br />
Modern Local Architecture: Learning from Baghdad” in<br />
Planning Middle Eastern <strong>Cities</strong> (Yasser Elsheshtawy,<br />
editor), London, New York, Routledge, 2004), p. 65<br />
21 Most urban transformations took place after 1927<br />
when oil was discovered in Kirkuk. The increase in<br />
oil revenues allowed the government to replace the<br />
old buildings with new ones and to develop plans for<br />
Baghdad.<br />
22 Nooraddin Hoshiar, “Globalization and the Search for<br />
Modern Local Architecture: Learning from Baghdad”<br />
Op.cit., p. 64<br />
23 Gibson McGuire, “Legal and Illegal Acquisition of<br />
Antiquities in Iraq, 19 th century to 2003” in Cultural<br />
Heritage Issues: The Legacy of conquest, Colonization<br />
and Commerce (edited by J.A.R. Nafziger and Ann<br />
M. Nicgorski), Martinus Nijhoff Publishers (2009), p.<br />
185<br />
24 Looting on a scale that involves virtual destruction of<br />
whole cities is still occurring in Southern Iraq. See:<br />
Cultural Heritage Issues: The Legacy of Conquest,<br />
Colonization and Commerce, Op.cit., p. 197<br />
25 World Bank and the Agence Française de<br />
Développement. “Managing the Social Dimensions<br />
of Climate Change in MENA: Climate Change and<br />
Human Mobility Concept Note” developed for the<br />
“First Workshop on Climate Induced Migration and<br />
Displacement in MENA” on June 15-16, 2010 at<br />
Marseille, France.<br />
26 World Bank. “Making the Most of Water Scarcity:<br />
Accountability for Better Water Management Results<br />
in the Middle East and North Africa.” Washington,<br />
D.C.: World Bank, 2007.<br />
27 World Bank and the Agence Française de<br />
Développement, 2010.<br />
28 UN FAO Food Price Index, www.fao.org/<br />
worldfoodsituation/wfs-home/foodpricesindex/en<br />
31
32<br />
CHAPTER TWO<br />
THE STATE OF MASHREQ CITIES<br />
Temple of Hercules, Amman, Jordan. Jordan is one of the most urbanized countries in the world with 78 per cent of the population living in urban areas. ©Ahmad A Atwah/Shutterstock
2.1<br />
Total and Urban Population Growth<br />
The countries of the Mashreq – Egypt, Iraq, Jordan,<br />
Lebanon, the Occupied Palestinian Territories (OPT)<br />
and Syria - have a total population of approximately<br />
146 million people. Egypt is the largest with 83 million people<br />
and the OPT is the smallest, with just over 1.7 million. 1<br />
Recently, with the exception of the OPT, the Mashreq<br />
countries have been growing moderately at annual rates of<br />
1-3 per cent. Population growth rates are now expected to<br />
decline further to between 0.5 and 2.3 per cent by 2030 with<br />
most expanding at an average annual rate only 1 per cent. 2<br />
The sub-region’s rates of urbanization range between 43<br />
per cent in Egypt and 86 per cent in Lebanon. 3 By 2030,<br />
it is estimated that 90 per cent of Lebanon’s population and<br />
70 per cent of Iraq’s total population will live in urban areas<br />
while in Jordan and the OPT approximately 80 per cent of<br />
the population will reside in cities. 4<br />
While the rate of growth of the sub-region’s urban areas<br />
has slowed in recent years and is expected to decline further,<br />
migration will continue to be a major vector of urban<br />
growth. As a result, it will be necessary to develop policies<br />
and programmes to ensure the orderly expansion of urban<br />
areas and curb informal development on valuable arable land.<br />
Ensuring a supply of affordable serviced land will be critical<br />
to the management of urban growth. 5<br />
FIGURE 7: POPULATION GROWTH IN LARGEST CITIES IN THOUSANDS<br />
(POPULATION OVER 750,000)<br />
Population (thousands)<br />
14,000<br />
12,000<br />
10,000<br />
8,000<br />
6,000<br />
4,000<br />
2,000<br />
0<br />
Population and Urbanization<br />
Hama<br />
Homs<br />
Amman<br />
Aleppo<br />
Damascus<br />
Source: United Nations, Department of Economic and Social Affairs, Population Division<br />
(2010). World Urbanization Prospects: The 2009 Revision.<br />
Beirut<br />
Alexandria<br />
1980 1990 2000 2010 2020<br />
Cairo<br />
Urban Concentrations and Growth<br />
With few exceptions, the sub-region’s large cities (those with<br />
an agglomeration population of 750,000 or greater) have been<br />
expanding slowly at an annual rate of 1-2 per cent in the past<br />
decade. Cairo, the largest city in the <strong>Arab</strong> world, has been<br />
expanding at less than 1 per cent per year since 1995, followed<br />
by Amman at around 1 per cent. 6 From 1995 to 2005,<br />
Baghdad (the <strong>Arab</strong> world’s second largest city), Mosul and<br />
Basra grew by 2.5, 3.3 and 3.6 per cent each year respectively. 7<br />
Hama, Syria, has been the fastest growing city with annual<br />
rates between 5 and 6.5 per cent over the past decade. Beirut<br />
is the only large city to experience a negative growth rate from<br />
1980 to 1995 as a result of Lebanon’s 16-year civil war, which<br />
devastated parts of the country, including Beirut.<br />
In Egypt, most cities are concentrated either along the Nile<br />
River Valley or in the Delta Region. Almost all have been<br />
growing relatively slowly at 1-2 per cent and are expected<br />
to maintain that pace. Only Alexandria, Luxor, Qina and<br />
Al’Arish have been expanding at or above 2 per cent. 8 As part<br />
of its Cairo 2050 Plan, the government is channelling growth<br />
to satellite towns in the dessert east and west of the Nile Valley<br />
to limit growth on the urban periphery and mitigate the loss<br />
of valuable agricultural land.<br />
Jordan is one of the more urbanized countries in the world<br />
with 78 per cent of the population living in urban areas and<br />
71.5 per cent of the total population concentrated in only<br />
three urban areas: Amman, Irbid and Zarqa. 9 Much of this<br />
urbanization can be attributed to the relocation of refugees<br />
from the OPT and Iraq as well as to migration from rural<br />
areas generated by a period of rapid industrialization in the<br />
late 1970s and early 1980s. 10 Most of the urban expansion<br />
of the major cities has been occurring as suburbanization,<br />
with the fastest growth occurring in the immediate urban<br />
periphery. 11<br />
The Jordanian cities, Khuraybat as-Suq, Khalda wa-Tila al-<br />
Ali and al-Quwaysimah have been growing the fastest with<br />
average annual rates between 7 and 15 per cent. Salt has<br />
also been expanding rapidly at 9.9 per cent each year, nearly<br />
doubling the population over a ten-year period. 12<br />
Most Jordanian cities including Amman, Salt, Irbid and<br />
Aqaba have developed plans to guide growth and ensure<br />
environmental sustainability. In Amman, the plan includes<br />
a corridor intensification strategy, a downtown revitalization<br />
strategy, the outlying settlements policy and the industrial<br />
lands policy. In addition to these city strategies, there are also<br />
regional development strategies for Shafa, Balqa and Zarqa<br />
which emphasize the important role of urban areas.<br />
In Iraq, it is estimated that some 70 per cent of the population<br />
lives in urban areas. Baghdad has had a relatively steady 2 per<br />
cent growth rate since the 1970s. Accurate growth data is not<br />
33
34<br />
FIGURE 8: CAIRO 2050 PLAN<br />
LIBYAN ARAB<br />
JAMAHIRIYA<br />
Key<br />
0 50 100 150<br />
Existing agricultural land<br />
Proposed extension<br />
to agricultural land<br />
Port cities<br />
Inland cities<br />
Proposed anchor cities<br />
Major highways<br />
Major airport<br />
International boundary<br />
0 50 100<br />
200 km<br />
150 mi<br />
FIGURE 9: JORDANIAN CITIES<br />
Al Solloum<br />
Siwa<br />
Salt Balqa Shafa<br />
Zarqa<br />
Khalda wa-Tila al-Ali<br />
Dead<br />
Sea<br />
Karak<br />
Ajlun<br />
Madaba<br />
Mera Matruh<br />
MEDITERRANEAN SEA<br />
Northern Oasis<br />
Farafra<br />
Dakhla<br />
Al Uwainat<br />
The boundaries and names shown and the designations<br />
used on this map do not imply official endorsement or<br />
acceptance by the United Nations.<br />
Irbid<br />
Jerash<br />
Highway<br />
Desert<br />
Jaber<br />
Amman<br />
Al-Quwaysimah<br />
Khuraybat as-Suq<br />
Alexandria<br />
Cairo<br />
Fayoum<br />
El Kharga<br />
Beni Suef<br />
Assiout<br />
Sohag<br />
Toski<br />
Ras Gharib<br />
SUDAN<br />
Edfu<br />
Aswan<br />
Port Safaga<br />
Administrative<br />
boundary<br />
EGYPT<br />
JORDAN<br />
Marsa Alam<br />
SAUDI ARABIA<br />
RED SEA<br />
Bir Shalata<br />
available on Iraq’s other major cities - Basra, Erbil and Mosul.<br />
Much of Iraq’s population has been in flux since the onset of<br />
war in 2003, after which internal conflict prompted many<br />
to migrate from the countryside to cities as well as moving<br />
within and among cities. There are estimates that ten per cent<br />
of Baghdad’s population left the city or moved within the city<br />
since 2006 13 .<br />
Most of Syria’s cities are located in rain-fed agricultural regions,<br />
including the basin of the Euphrates River, or along<br />
interior trade routes. Recently, there has been some population<br />
spread to smaller cities as a result of migration caused<br />
by environmental degradation in some rural areas. The two<br />
largest cities, Damascus and Aleppo, account for nearly 37<br />
per cent of the urban population and 20 per cent of the total<br />
population. <strong>Cities</strong> ranging in size from 300,000 to 1 million<br />
– including Homs, Lattakia and Hamas – account for 14 per<br />
cent of the urban population.<br />
The highest rate of urbanization is in intermediate size<br />
cities (100,000 to 300,000) located on major transportation<br />
corridors; they are home to 15 per cent of the urban<br />
population and 8 per cent of the total population and include<br />
Deir-ez-Zor, Ar-Raqqah, al-Hasakeh, Tartous, al-Yarmuk, al-<br />
Sayyia Zaynab, Jarmana, Duma and al-Qamishli.
FIGURE 10: ALEPPO VISION PLAN<br />
Phasing & Space Reservation Open Space Network & Proposed Zones for New Centres<br />
Source: http://madinatuna.com/urbanform/vision#vision<br />
Space reservation area<br />
Phase I<br />
Phase II<br />
Existing city<br />
The fastest-growing cities are located along the major<br />
transportation corridors connecting Syria with Iraq, Jordan<br />
or Turkey. For example, the city of Ar-Raqqah grew from<br />
165,000 in 1994 to 344,000 in 2004, at an annual rate of<br />
7.6 per cent. 14 It is located in the corridor to Iraq near the<br />
Euphrates River. Deir-ez-Zor, also situated in this corridor,<br />
grew at a rate at nearly 5.5 per cent per year from 1994 to<br />
2004. Further growth is expected in the next 15 years along<br />
these corridors, particularly in the provinces of Dar’a, Idleb,<br />
Ar-Raqqah, Deir-ez-Zor, Hasakeh and Aleppo. 15 In Homs<br />
and other urban areas, expansion has occurred as a result of<br />
international migration from Iraq, Lebanon and Palestine and<br />
internal displacement from conflict. 16<br />
The 2006-2010 Five-Year Plan in Syria proposed new<br />
planning initiatives to balance development and manage<br />
urban growth. It focused on a longer-term vision for Syria that<br />
decreased existing geographical imbalances of population and<br />
economic activities by linking regional development strategies<br />
with the national development plan. The plan emphasises<br />
decentralization with integrated planning at all levels of<br />
government and an institutional planning framework. It also<br />
includes staff capacity building programmes, partnerships<br />
with non-governmental organizations and the private sector.<br />
Active urban edge<br />
Bab ring<br />
Green fingers<br />
Quweik Park<br />
New Subcentres<br />
River Quweik<br />
Main Roads<br />
Strategic positions for later centres<br />
Graduated open space network<br />
The impacts of the 2011/12 violence could not be evaluated<br />
at the time of writing of this document.<br />
A comprehensive regional strategy is being developed as<br />
part of the Municipal Administration Modernisation (MAM)<br />
project financed by the European Union. MAM is advocating<br />
for more balanced growth between the west and the east and<br />
urban and rural areas. It highlights cross-border development,<br />
investments in corridors and an urban hierarchy of regional<br />
centres. 17 As part of the process, Aleppo has embarked upon<br />
a city development strategy to lessen pressure on the central<br />
area by creating five self-sufficient and accessible sub-centres. 18<br />
Much of Lebanon’s population (45.5 per cent in 2010 19 )<br />
is concentrated in the Greater Beirut Region. Urban sprawl<br />
has spread steadily in the past few decades along the coast<br />
and on the outskirts of Beirut and Tripoli. 20 By 2030, it is<br />
estimated that the total urbanised area will increase by<br />
approximately 30,000 hectares. In Greater Beirut, most of the<br />
population expansion will occur outside the 2,000 hectarecore<br />
in a suburban outer ring that will grow from 8,000 to<br />
12,500 hectares. Peripheral growth will also occur in other<br />
larger urban agglomerations, including Nabatieh, Saida, Tyre,<br />
Baalbek and Jbail (600 to 1,500 hectares each). Growth in<br />
Tripoli will occur in both the core and the suburbs, with most<br />
35
36<br />
<br />
Damascus, Syria. Syria's two largest cities, Damascus and Aleppo, account for nearly 37 per cent of the urban population and 20 per cent of the total population.<br />
©Dudarev Mikhail/Shutterstock<br />
FIGURE 11: NEW CONSTRUCTION IN LEBANON 1963 TO 1998<br />
Sour<br />
Construction in 1963<br />
Beirut<br />
Saida<br />
Tripoli<br />
Nabatieh<br />
Zahle<br />
Baalbek<br />
Sour<br />
Beirut<br />
Saida<br />
Construction in 1998<br />
Tripoli<br />
Nabatieh<br />
Zahle<br />
Baalbek<br />
Source: Government of Lebanon. 2005 National Physical Master Plan of the Lebanese<br />
Territory. Beirut: Government of Lebanon.<br />
of the expansion on the periphery. Tripoli's population<br />
is expected to grow from 102,000 in 2000 to 210,000<br />
in 2030 with an increase in the built-up area from 15 to<br />
27 km². Smaller urban agglomerations and villages will<br />
consume another 12,000 to 15,000 hectares of fringe<br />
land. 21 It will be critical to manage growth to minimize the<br />
negative aspects of urban sprawl on water resources and<br />
agricultural land on the urban periphery.<br />
Lebanon's 2005 National Master Plan proposed an<br />
urban structure that places less emphasis on the central<br />
area of Beirut and focuses on the development of secondary<br />
cities – Nabatieh, Saida, Tripoli, Tyre and Zahle-Chtaura<br />
– to spur a more balanced and integrated growth pattern<br />
that improves the connections between rural and urban<br />
areas. In the South, the government plans to support<br />
the creation of an industrial zone shared by Nabatieh,<br />
Saida and Tyre, which currently account for 44 per cent<br />
of the population of the two southern governorates. 22<br />
The government is also focusing on the development of<br />
ten smaller urban localities in each governorate that will<br />
provide employment opportunities and improved public<br />
and administrative services. 23
FIGURE 12: LEBANON NATIONAL MASTER PLAN URBAN STRUCTURE PRINCIPLE<br />
National level:<br />
Network of Major Agglomerations<br />
Major agglomerations of Beirut Central Area and Tripoli<br />
Gateway cities: Saida and Jbail<br />
Major metropolises: Zahle and Nabatieh<br />
<strong>Cities</strong> of significant cultural importance: Sour and Baalbek<br />
Local level:<br />
Network of Relay-<strong>Cities</strong><br />
Relay-cities capitals of Caza<br />
Relay cities<br />
<br />
<br />
Sour<br />
Naquora<br />
Zaharani<br />
Ghaziyé<br />
Sarafand<br />
Qana<br />
Saida<br />
Insar<br />
Beirut<br />
Jouaya<br />
Tebnine<br />
Bent Jbail<br />
Barja<br />
Jbail<br />
Aaley<br />
Bhamdoun<br />
Aaramoun<br />
Damour<br />
Chimm<br />
Jezzine<br />
Nabatieh<br />
Kfar Kila<br />
Baabda<br />
Tripoli<br />
Deir amar<br />
Beddawi<br />
Source: Government of Lebanon. (2005). National Physical Master Plan of the Lebanese Territory. Beirut: Government of Lebanon<br />
Joune<br />
Jdaide<br />
Baaqline<br />
Beit Meri<br />
Bet ed Dine<br />
Khiam<br />
Saghine<br />
Machghara<br />
Marjayoun<br />
Batroun<br />
Aajaltoun<br />
Bikfaya<br />
Broumana<br />
Hasbaiya<br />
Qartaba<br />
Rachaiya<br />
Amioun<br />
Joub Janine<br />
Zghorta<br />
Tannourine el Tahta<br />
Mairouba<br />
Zahle<br />
el Miné<br />
Eidhen<br />
Rayak<br />
Rayak<br />
Majdel Anjar<br />
Aabde<br />
Syr<br />
Halba<br />
Bcharrè<br />
Chmistar<br />
Beino<br />
Deir el Ahmar<br />
Fnaydek<br />
Baalbek<br />
Britel<br />
High mountain: major physical obsta<br />
Lebanese university, main campus<br />
Zone of major activities<br />
Gas power plants<br />
Hydrocarbon depots<br />
Area of influence of agglomerations<br />
Major<br />
Chadra<br />
Qbaiyat<br />
Sub-sectors<br />
Laboué<br />
Hermel<br />
Cuts of continuous urbanization of the coast<br />
37
38<br />
2.2<br />
The Growing Economic Role of <strong>Cities</strong><br />
<br />
Beirut, Lebanon. The Lebanese Government has invested significantly in urban infrastructure. ©diak/Shutterstock<br />
Most economic activities are concentrated in the<br />
primary cities of the Mashreq. Financial services<br />
and tourism dominate the economic base but all<br />
governments are developing policies to redirect domestic<br />
and foreign investments to industry and secondary cities by<br />
improving their infrastructure and diversifying their economy.<br />
Lebanon. Lebanon is recovering from the political turmoil<br />
of recent years and its economic growth has been strong: 9.3<br />
per cent in 2008, 9.0 per cent in 2009 and an estimated 8.0<br />
per cent in 2010. Most of the growth can be attributed to<br />
the increase in demand for services and increased inflows of<br />
capital transfers. 24 In 2007, most of the active labour force<br />
worked in services (41.6 per cent) and trade (22.6 per cent)<br />
while industrial employment was only 13.8 per cent. 25 By<br />
2009, services and trade represented 73 per cent of the labour<br />
force and 60 per cent of GDP, with tourism and financial<br />
services accounting for approximately 35 per cent of GDP. 26<br />
Most economic activities are concentrated in Beirut, where<br />
government has made significant investments, including<br />
in the modernization of the downtown and port areas,<br />
improving roads, redeveloping the airport and encouraging<br />
development in peripheral agglomerations. Other projects<br />
include the development of the Hadath University campus<br />
and tourist activities along the southern coast. 27<br />
In addition to upgrading the Greater Beirut area, the<br />
government plans infrastructure improvements in other<br />
cities, including Tripoli, Zahle-Chtaura, Nabatieh, Said,<br />
Jbail, Baalbek and Tyre. The government plans to re-establish<br />
the Beirut-Tripoli rail service, improve the road network and<br />
upgrade the port. 28<br />
Tripoli is a centre for trade and services and a prime<br />
tourism destination. However, the city’s infrastructure<br />
must be improved for it to realise its potential and help<br />
kick-start the economic development of the North, which<br />
has primarily focused on agriculture and food processing.<br />
Saida is the administrative centre of South Lebanon; it has<br />
maintained a strong agricultural sector and is also a tourist<br />
destination. Baalbek and Tyre are archaeological sites on the<br />
World Heritage List and major tourist destinations; Baalbek’s<br />
cultural festival attracts an international audience. Tyre is also<br />
a tourist destination with Roman and Phoenician sites and its<br />
sandy beaches. These localities require improved protection<br />
of their archaeological assets, investments in hotels and the<br />
diversification of their economy. 29<br />
The government has looked at ways to redirect economic<br />
activities to inland urban agglomerations, such as Nabatieh,<br />
an active commercial centre that provides medical, social,<br />
cultural and educational services to its region. The government
FIGURE 13: ECONOMIC ACTIVITIES IN LEBANON<br />
<br />
<br />
<br />
<br />
<br />
<br />
<br />
<br />
<br />
<br />
<br />
<br />
<br />
<br />
<br />
<br />
<br />
<br />
<br />
<br />
<br />
<br />
<br />
<br />
<br />
<br />
<br />
<br />
<br />
<br />
<br />
<br />
<br />
<br />
<br />
<br />
<br />
<br />
<br />
<br />
<br />
<br />
<br />
<br />
<br />
<br />
<br />
<br />
<br />
<br />
<br />
<br />
<br />
<br />
<br />
<br />
<br />
<br />
<br />
<br />
<br />
<br />
<br />
<br />
<br />
<br />
<br />
<br />
<br />
<br />
<br />
<br />
<br />
<br />
<br />
<br />
<br />
<br />
<br />
<br />
<br />
<br />
<br />
<br />
<br />
<br />
<br />
<br />
<br />
<br />
<br />
<br />
<br />
<br />
<br />
<br />
<br />
<br />
<br />
<br />
<br />
<br />
<br />
<br />
<br />
<br />
<br />
<br />
<br />
<br />
<br />
<br />
<br />
<br />
<br />
<br />
<br />
<br />
Source: Government of Lebanon. (2005). National Physical Master Plan of the Lebanese Territory. Beirut: Government of Lebanon.<br />
<br />
<br />
<br />
<br />
<br />
<br />
<br />
<br />
<br />
<br />
<br />
<br />
<br />
<br />
<br />
<br />
<br />
<br />
<br />
<br />
<br />
<br />
<br />
<br />
<br />
<br />
<br />
<br />
<br />
<br />
<br />
<br />
<br />
<br />
<br />
<br />
<br />
<br />
<br />
<br />
<br />
<br />
<br />
39
40<br />
BOX 3: OCCUPIED PALESTINIAN TERRITORIES – THE IMPACTS OF OCCUPATION ON THE URBAN ECONOMY, URBAN FORM AND<br />
URBAN MOBILITY<br />
<br />
Israeli soldiers search a Palestinian's car at the Hawera checkpoint outside the town of Nablus in the West Bank<br />
©Kobi Wolf/IRIN<br />
Since 1967, Israel has implemented a<br />
broad range of policies and practices aimed<br />
at controlling the movement of Palestinians<br />
in the West Bank (including East Jerusalem)<br />
and Gaza. The strategies include road blocks,<br />
check points (permanent and ‘flying’), ‘Israelis<br />
Only’ highways, residency requirements,<br />
access permits, restricted expansion and<br />
development possibilities, a rigged building<br />
permit process and the notorious Separation<br />
Wall. Together, these impediments constitute<br />
a major dimension of the occupation and have<br />
a devastating impact on Palestinian freedoms,<br />
economic well-being, quality of life, and the<br />
plans to bring industry to the area through the development<br />
of an industrial zone near Rayak, rehabilitate the roads, and<br />
improve waste management. 30<br />
Iraq. The Iran-Iraq war, the first Gulf War in 1990s and<br />
the economic embargoes that followed, the 2003 invasion and<br />
the exodus of thousands of professionals from the country’s<br />
largest cities in the mid-2000s have had a devastating effect<br />
on Iraq’s economy. Since the 1990s, the annual economic<br />
growth rate has declined by 25 per cent.<br />
While oil comprises 60 per cent of GDP and 95 per cent of<br />
foreign earnings, it employs few people. Most people work in<br />
small- and medium-sized enterprises and efforts to promote<br />
this sector is a key national strategy to reduce unemployment.<br />
State-owned enterprises continue to employ one out of eight<br />
workers and represent 90 per cent of industry in the country.<br />
Over the past decade, the service sector, including public<br />
urban form of their communities.<br />
While the choke-collar effect of these<br />
restrictions occasionally relaxes, it is<br />
more often tightened and over the past<br />
two decades has horrendously degraded<br />
Palestinian life. ‘Closure’, the term commonly<br />
used to encompass many of these strategies,<br />
has severely affected the quality of daily<br />
life for many Palestinians by increasing<br />
unemployment levels, declining wages<br />
and surging poverty, growing dependence<br />
on unreliable welfare, home demolitions,<br />
business failures, restraints on trade, polluted<br />
environments, major declines in GDP, income<br />
averages and consumption of daily necessities<br />
and a fragmentation of the Palestinian urban<br />
fabric. Many of these impacts arise from<br />
seemingly legitimate zoning, planning and land<br />
classification policies selectively enforced by<br />
various Israeli administrative departments,<br />
including the Israeli army.<br />
Two important Israeli occupation phenomena<br />
have received minimal public attention but have<br />
far-reaching consequences: the creation of a<br />
‘seam zone’ adjacent to the Separation Wall, and<br />
the implementation of the Oslo-based division of<br />
Palestinian land into areas A, B, and C.<br />
The seam zone refers to the areas between<br />
the Separation Barrier and the Green Line<br />
of the 1967 Armistice. Once the 700-plus<br />
kilometre barrier is completed, approximately<br />
50,000 Palestinians in 38 villages and towns<br />
will find themselves living in territory walled-off<br />
from the West Bank and, often, without ready<br />
access to their own lands. In addition, 60,000<br />
East Jerusalemites will be separated from<br />
family and community networks and places of<br />
employment by the Jerusalem section of the<br />
barrier.<br />
Areas A (mainly urban centres) and B of the<br />
occupied West Bank are effectively built up or<br />
‘illegally’ over-built to permitted capacity. Area<br />
C - 60 per cent of the West Bank and the natural<br />
expansion area for A and B - has significant<br />
space for potential development but it is under<br />
Israeli authorities who thwart Palestinian<br />
development there, despite Oslo provisions that<br />
supposedly ensured it.<br />
institutions, the military and police, has grown rapidly.<br />
The tourism industry is not yet a significant contributor to<br />
GDP, but there is strong potential. For example, Najaf is an<br />
important pilgrimage city in the Islamic world and attracts<br />
hundreds of thousands of visitors from other countries as well<br />
as other Iraqi cities. Najaf’s International Airport receives four<br />
international airlines in addition to Iraqi Airways. Najaf and<br />
Karbala are important pilgrimage cities and have the potential<br />
to attract as many as ten million pilgrims each year when<br />
security is restored. 31<br />
Jordan. Services make up 70 per cent of the GDP and 75 per<br />
cent of employment. Although manufacturing, construction<br />
and real estate have been growing, there has been a greater<br />
emphasis on the higher value-added knowledge economy<br />
which should provide better employment opportunities for<br />
the highly-educated youth population. 32
Najaf, Iraq. Iraqi men survey the damage to the Iraqi Shiite Tomb of Ali (Imam Ali Mosque), following a massive car bombing that killed at least 70 people. ©EdStock/iStockPhoto<br />
Most economic activities are concentrated in the<br />
Greater Amman Region. 33 While Amman is the kingdom’s<br />
administrative and financial centre, 52 per cent of the<br />
country’s industrial activities are concentrated in the satellite<br />
towns of Zarqa and Russeifa.<br />
Irbid, the second largest city and home to approximately<br />
18 per cent of the total population, is the commercial centre<br />
for the northern part of the country. Although not a tourist<br />
destination, it is centrally located between two ancient sites,<br />
Gadara and Pella, and provides supporting accommodations<br />
for tourists visiting them. 34 The economy of the country’s<br />
secondary cities - Al-Karak, Jerash, Ma’daba and Salt -<br />
depends on trade, services and some manufacturing. In 2006,<br />
the Jordanian government undertook a project to revitalize<br />
urban cores and improve urban management practices in<br />
Jerash, Karak, Ma’daba and Salt. 35<br />
Tourism has been on the rise in Jordan with the number<br />
of visitors to archaeological sites and museums more than<br />
doubling from 2006 (1,439,449) to 2008 (2,943,157). The<br />
greatest attraction in 2008 was the archaeological sites in Petra<br />
(813,300), followed by those in Jerash (351,500) and Mount<br />
Nebo (326,700). Recently, there has also been an emphasis on<br />
tourism in the smaller city of Salt. 36<br />
Syria. Services account for 55.2 per cent of GDP, followed<br />
by industry (26.3 per cent) and agriculture (18.5 per cent). 37<br />
Most economic activities are concentrated in Damascus,<br />
Aleppo and, to a lesser extent, Homs. Aleppo is the country’s<br />
industrial capital, producing 30 to 40 per cent of the<br />
national manufacturing with a heavy emphasis on textiles<br />
and chemicals, including plastics, cosmetics, rubber products<br />
and pharmaceuticals. Thirty firms in Aleppo are responsible<br />
for 60 per cent of the national pharmaceutical production.<br />
Other economic activities in Aleppo include agro-processing,<br />
handicrafts production and limited tourism. 38<br />
The tourism sector has been expanding and the number<br />
of non-<strong>Arab</strong> visitors increased from 385,000 in 2004 to<br />
678,000 in 2008. Although the number of <strong>Arab</strong> tourists<br />
increased from 2004 to 2008, the 2008 figures were lower<br />
than in the previous two years. 39 Damascus is the main tourist<br />
destination, attracting nearly 888,000 visitors, followed by<br />
Aleppo and Lattakia. 40 Both Aleppo and Damascus have the<br />
potential to expand tourism given their significant cultural<br />
heritage. Greater investments should be made to support<br />
and expand cultural activities in both cities. But, obviously,<br />
the country needs to return to pease before tourism can be<br />
expected to pick up again.<br />
Egypt. In 2009, Egypt’s GDP was dominated by services<br />
(48.7 per cent) and industry (37.6 per cent) with agriculture<br />
contributing only 13.7 per cent. 41 Cairo and Alexandria are<br />
the main engines of the economy: 57 per cent of all manufac-<br />
41
42<br />
BOX 4: OCCUPIED PALESTINIAN TERRITORIES - DISPLACING THE DISPLACED<br />
<br />
Al-Walaja, West Bank. Palestinians clash with Israeli soldiers in a protest against the Israeli separation wall.<br />
©Ryan Rodrick Beiler/Shutterstock<br />
At the beginning of the 20 th century,<br />
most Palestinians lived inside the borders of<br />
Palestine, which is now divided into the State<br />
of Israel, the occupied West Bank and the Gaza<br />
Strip. Until 1947, Palestinians owned and used<br />
approximately 90 per cent of Palestine’s land.<br />
Major episodes of forcible displacement have<br />
transformed Palestinians into the largest and<br />
longest-standing unresolved refugee case<br />
and humanitarian crisis in the world today as<br />
approximately 82 per cent of the land has been<br />
confiscated by Israel.<br />
As many as 150,000 Palestinians were<br />
arbitrarily displaced within or expelled from<br />
Palestine during the British Mandate (1922 –<br />
1947). More than 750,000 Palestinians were<br />
displaced during the Nakba (catastrophe),<br />
referring to the ethnic cleansing that<br />
took place in the context of a UN plan to<br />
partition Palestine, armed conflict and the<br />
establishment of the State of Israel. Tens of<br />
thousands of Palestinians were displaced<br />
within and expelled from Israel between 1949<br />
and 1967. Approximately 400,000 to 450,000<br />
Palestinians were displaced from the West<br />
Bank - including East Jerusalem - and the Gaza<br />
Strip during the 1967 Israeli-<strong>Arab</strong> war and<br />
Israel’s subsequent occupation of these areas.<br />
Since 1967, Israel has developed a regime<br />
that combines occupation, apartheid and<br />
colonization which act as the root cause of<br />
contemporary forced displacements. Hundreds<br />
of thousands of additional Palestinians have been<br />
displaced on both sides of the Green Line, and<br />
forcible displacement is ongoing as a result of the<br />
unlawful policies and practices of Israel’s regime.<br />
During the second intifada (uprising) in 2000,<br />
the number of Palestinians displaced or at risk of<br />
displacement rose sharply. Palestinian refugees<br />
also faced a secondary displacement in various<br />
countries of exile, most recently in Iraq and<br />
Lebanon. Denied reparation and durable solutions<br />
based on their right to return, displaced Palestinians<br />
remain vulnerable to the impact of armed conflict<br />
and human rights violations in their host countries.<br />
Some 90,000 people are reported to be at risk of<br />
displacement in 2012 as a result of Israeli policies<br />
such as restrictive and discriminatory planning,<br />
the revocation of residency rights, the expansion<br />
of settlements and the construction of the West<br />
Bank Separation Wall , including more than 60,000<br />
in East Jerusalem alone (OCHA, November 2009:<br />
OCHA March and May 2011). Communities most<br />
at risk include those in East Jerusalem; those in<br />
Area C of the West Bank, particularly Palestinians<br />
in the Jordan Valley, Bedouin communities and<br />
those in ‘seam zones’ between the Green Line and<br />
the Separation Wall and those living in or near the<br />
extended buffer zone separating the Gaza Strip<br />
from Israel (Save the Children, October 2009;<br />
OCHA, January 2008).<br />
Increased awareness of forced displacement of<br />
Palestinians amongst local and international<br />
organizations has led to the identification<br />
of a number of core triggers. These include<br />
excessive and indiscriminate use of force,<br />
home demolition and forced eviction,<br />
violence by Jewish settlers and other nonstate<br />
actors, revocation of residency rights,<br />
closure and segregation, confiscation and<br />
discriminatory distribution of land and settler<br />
implantation. Human rights and humanitarian<br />
organizations have long called for the<br />
addressing of forced displacement in the<br />
Occupied Palestinian Territories and have<br />
warned of the continuing deleterious impacts<br />
of Israeli policies but the international<br />
community has only begun to respond to<br />
such calls in the past few years.<br />
In West Bank C areas - where Israel<br />
retains authority over law enforcement<br />
and control over construction and planning<br />
- more than 70 per cent of the land has<br />
been allocated to Israeli settlements or the<br />
Israeli military, while severe restrictions<br />
apply to its use by Palestinians. A total of<br />
342 Palestinian-owned structures, including<br />
125 residential structures and 20 rainwater<br />
collection cisterns, were demolished by the<br />
Israeli authorities in the first half of 2011.<br />
Consequently 656 people, of whom 351<br />
are children, were left without homes. Onethird<br />
of these people were displaced in June<br />
2011 alone. Over 3,000 demolition orders are<br />
outstanding, including 18 targeting schools.<br />
Located to the North of the Old City in<br />
occupied East Jerusalem, Sheikh Jarrah,<br />
a Palestinian residential neighbourhood is<br />
becoming an extreme case of displacement.<br />
The neighborhood houses around 2,800<br />
Palestinians as it is a centre for many<br />
diplomatic missions and well-known<br />
landmarks such as the Orient House, the<br />
American Colony Hotel and the Palestinian<br />
National Theatre.<br />
Due to its strategic location, Israeli settler<br />
groups have in recent years made persistent<br />
efforts to take over land and property in<br />
Sheikh Jarrah to establish new settlements<br />
in the area. As a result, over 60 Palestinians<br />
have lost their homes and another 500 remain<br />
at risk of forced eviction, dispossession and<br />
displacement in the near future.<br />
Sources: Occupied Palestinian Territory: No end to internal displacement, A profile of the internal displacement situation by NRC and IDMC, 5 July, 2011; Survey of Palestinian Refugees<br />
and Internally Displaced Persons (BADIL) (2008-2009); The Case Of Sheikh Jarrah, Updated Version, OCHA October 2010; Sharp Increase In Demolitions and Displacement in the West<br />
Bank, Update, OCHA JULY 2010; Area C Humanitarian Response Plan Fact Sheet, OCHA AUGUST 2010
BOX 5: IRAQI REFUGEES IN SYRIA<br />
Since the spring of 2003, the Middle East<br />
has seen massive migratory movements from<br />
Iraq into its neighbouring countries. Syria<br />
continues to be the primary destination of Iraqi<br />
refugees due to historical relations between<br />
the two countries and because of easier entry<br />
regulations. Some have since been resettled<br />
to third countries, while some others have<br />
returned to Iraq - most of them spontaneously<br />
and a few with limited assistance from UNHCR.<br />
Most, however, remain in Syria. There is an<br />
estimated 1 million Iraqi refugees and asylumseekers<br />
in Syria, 44.5 per cent of whom sought<br />
refuge there five or more years ago. In August<br />
2010, 151,000 refugees were registered under<br />
the protection of UNHCR but each month some<br />
2,000 additional Iraqis approach the agency for<br />
registration.<br />
66.5 per cent of Iraqis in Syria originate<br />
from urban areas in the Baghdad and Ninewa<br />
governorates and all UNHCR-registered Iraqis<br />
in Syria live in urban areas - mainly Damascus<br />
and its suburbs. Some 41 per cent of these<br />
have special needs and 36.8 per cent of the<br />
34,849 families registered are female-headed<br />
households.<br />
Approximately 40 per cent of all registered<br />
Iraqis in Syria are considered vulnerable and<br />
in need of assistance. About 34,000 suffer<br />
serious medical conditions, while 9 per cent of<br />
the refugee population is classified as ‘women<br />
at risk’. Although many refugees left Iraq with<br />
some savings, these have run out after years<br />
of exile. As a result, refugees rely on food and<br />
financial assistance from UNHCR.<br />
Syria has offered Iraqi refugees care and<br />
assistance and continues to do so despite<br />
limited material resources. The large number<br />
of arrivals has had dramatic impacts on the<br />
economy, infrastructure and public services<br />
delivery in Syria. Water consumption has<br />
increased by 21 per cent. It has also led to<br />
rises in the cost in all areas of life: food and<br />
basic goods have gone up by 30 per cent.<br />
Property prices have gone up by 40 per cent<br />
and rentals by 150 per cent.<br />
Most of the Iraqis surveyed by UNHCR say<br />
that they face financial barriers to accessing<br />
adequate housing and cited paying rent as their<br />
<br />
Iraqi refugees use a WFP food voucher on their mobile phone to purchase food from a shop in Damascus.<br />
©Selly Muzammil/WFP<br />
most significant financial difficulty. The Iraqi<br />
refugees have also become a burden on the<br />
labour market. Only a small number of Iraqis<br />
work as professionals in the formal sector<br />
(such as doctors or university professors) and<br />
hold legal work permits. The great majority of<br />
refugees in Syria take advantage of the gaps in<br />
labour law and poor enforcement mechanisms<br />
to find low-skilled work in the informal sector.<br />
Basic education in Syria is free and the cost<br />
of higher education is nominal. As a result of<br />
the influx of Iraqis, there has been a steady<br />
rise in enrolments, leading to school and<br />
classroom overcrowding. Around 10 per cent<br />
of schools run on a double-shift system to<br />
accommodate the high number of pupils. The<br />
number of Iraqi students enrolled in primary<br />
or secondary schools, however, has fallen<br />
from 30,000 in 2007 to 24,600 in 2009-2010<br />
mainly due to financial constraints and lack of<br />
documentation.<br />
A 2010 UNHCR survey carried out in<br />
July and August at the Al-Waleed border<br />
crossing between Syria and Iraq showed<br />
that most Iraqis are reluctant to return home<br />
on a permanent basis. Of 498 families asked,<br />
representing more than 2,000 individuals, 46<br />
per cent cited political uncertainty for this<br />
while 15 per cent blamed unstable security<br />
conditions. A further 13 per cent said they are<br />
holding back from returning because of poor<br />
educational opportunities, and 6 per cent cited<br />
housing shortages.<br />
Most of those crossing the border – 89 per<br />
cent - said it was for a short trip only. In 42<br />
per cent of cases this was for visiting family<br />
members, 18 per cent said they were checking<br />
conditions on the ground, 15 per cent were<br />
going to obtain documentation and 10 per cent<br />
were checking on property. A similar survey<br />
on the Iraq-Jordan border among 364 families<br />
(about 1,450 people) found that none was<br />
returning to Iraq permanently. Similar reasons<br />
were cited.<br />
The number of refugees who return<br />
permanently to Iraq has been very low, with<br />
UNHCR having supported just 163 to return<br />
from Syria since the beginning of 2010.<br />
According to Iraqi government statistics, only<br />
18,240 Iraqi refugees returned from exile<br />
between January and August. This represents<br />
20 per cent of the total returns of 89,700 in<br />
the same period, including internally displaced<br />
people.<br />
Sources: Iraqi refugees in Syria reluctant to return to home permanently: Survey, UNHCR, 8 October 2010, http://www.unhcr.org/4caf376c6.html; Iraqi refugees in Syria, al-Miqdad, F.,<br />
in FMR Iraq Special Issue, www.fmreview.org/FMRpdfs/Iraq/08.pdf. Sanctuary in the city? Urban displacement and vulnerability in Damascus: A desk study December 2011, Simone<br />
Haysom and Sara Pavanello Humanitarian Policy Group (HPG)<br />
43
44<br />
turing activities are located in Greater Cairo and another 22.5<br />
per cent in Alexandria, the country’s main seaport.<br />
Cairo is also home to 83 per cent of foreign establishments.<br />
Although Cairo benefits from its strategic location at the<br />
southern apex of the Delta, with excellent access to transport<br />
and communication infrastructure as well as opportunities<br />
for expansion on the surrounding dessert lands, it also suffers<br />
from worsening traffic congestion and pollution. 42<br />
Other cities including Port Said, Damietta and Suez produce<br />
textiles, furniture and chemicals, petrochemicals, steel, iron and<br />
non-metallic mineral products. 43 Tourism has been growing in<br />
the past few years, particularly on the Red Sea coast. 44<br />
Urban Poverty and Inequality<br />
Overall, the Mashreq countries are on track to achieving<br />
the Millennium Development Goals, with the exception of<br />
Iraq, Lebanon and the Occupied Palestinian Territories. The<br />
proportion of people living below USD 1.25 per day – the<br />
absolute poverty line established by the MDGs – which was<br />
already very low in Egypt, Jordan, Lebanon and Syria in 1990<br />
has further decreased since then. However, the proportion of<br />
people in urban areas living below each country’s designated<br />
national poverty line is much higher – as much as 30 per cent<br />
in Syria, 29 per cent in Lebanon, 28 per cent in Egypt and 13<br />
per cent in Jordan. 45<br />
<br />
Making ends meet selling fresh fruit juice in Aleppo, Syria. ©Ugurhan Betin/iStockPhoto<br />
The incidence of urban poverty is higher in specific parts<br />
of each country. In Jordan, 57 per cent of citizens living<br />
below the national poverty line reside in Amman, Irbid<br />
and Zarqa, and the number of poverty pockets – defined<br />
as areas where over 25 per cent of residents live below the<br />
national poverty line – increased to 32 in 2008 from 22 in<br />
2006. 46 52 per cent of the population of North Lebanon and<br />
42 per cent of the population of South Lebanon live below<br />
the upper poverty line. 47 Despite the impressive economic<br />
growth in the region in the 1990s and 2000s, overall poverty<br />
ratios have only declined slowly. The recent conflicts in Iraq,<br />
Lebanon and the Occupied Palestinian Territories as well as<br />
the global economic crisis with its resultant reductions in<br />
remittances and employment, have had a disproportionate<br />
impact on the poor.<br />
In each city, poverty is spatially concentrated in specific<br />
zones, as shown in the distribution of overcrowded<br />
traditional dwellings in Amman and the distribution of<br />
informal settlements in Aleppo. In Syria, research has<br />
shown that the family size is a better explanatory variable<br />
for poverty than the urban-rural divide: for every increase of<br />
one family member, poverty deepens by 3 per cent. Urban<br />
inequality has increased slightly across the region, with Gini<br />
coefficients in all Mashreq countries higher today than they<br />
were in 1990, with the exception of Jordan.
FIGURE 14: GEOGRAPHIC INEQUALITIES OF AMMAN 48<br />
HOUSES (DAR) IN AMMAN IN 2004 VILLAS IN AMMAN IN 2004<br />
Source: Department of Statistics and Greater Amman Municipality (Ababsa,IFPO, 2009)<br />
FIGURE 15: INFORMAL SETTLEMENTS IN ALEPPO 49<br />
Unemployment<br />
Unemployment and underemployment in rural areas<br />
and smaller cities has been a vector of urban migration<br />
in the region. In Jordan, Ajloun had the highest urban<br />
unemployment rate at 34.5 per cent, followed by Jerash at<br />
32.7 per cent while it was around 15 per cent in Amman and<br />
Aqaba. 50 In Syria, unemployment rates have been higher in<br />
rural areas, largely as a result of drought and desertification. 51<br />
Al-Hasakeh, Al Sweida, Dar’a and Lattakia have the highest<br />
rates of urban unemployment while Aleppo’s unemployment<br />
rate is just over 7 per cent but the unemployment rate for<br />
women is twice that of men.<br />
CHILDREN UNDER 14 YEARS IN AMMAN AT THE<br />
BLOCK LEVEL IN 2004<br />
Major roads<br />
Approximate administrative city border<br />
Old City of Aleppo<br />
Built-up area<br />
Informal settlements<br />
Profile summary number<br />
Basis: Aleppo Masterplan, Quickbird 2007/2008<br />
In Iraq, the American occupation has undeniably altered the<br />
structure of the labour force, with significant redundancies in<br />
the public sector, military and state-owned enterprises. Nearly<br />
500,000 men were discharged from the army between 2003<br />
and 2005. As of 2009, Iraq’s real unemployment rate was<br />
28 per cent, with 18 per cent of the labour force jobless but<br />
another 10 per cent composed of part-time workers seeking<br />
more work. Youth unemployment stands at 28 per cent, while<br />
only 17 per cent of Iraqi women participate in the labour<br />
force, in part due to various cultural and social mores. 52<br />
As in other parts of the <strong>Arab</strong> world, youths comprise a large<br />
segment of the unemployed, particularly in urban areas. The<br />
unemployment rate among youths in Lebanon is on par with<br />
45
46<br />
<br />
Iraqi female recruits at the Iraqi Police Academy in Karbala, Iraq. Only 17 per cent of Iraqi women participate in the labour force. ©U.S. Navy photo by Mass Communication Specialist 1st<br />
Class Wendy Wyman/Released<br />
the rest of the <strong>Arab</strong> region (around 26 per cent) 53 , which is<br />
the highest rate in the world. Many leave Lebanon to seek<br />
employment opportunities elsewhere. 54 In Jordan, young<br />
people are the largest segment in urban unemployment (45<br />
per cent of total urban unemployed for women and 53 per<br />
cent of total urban unemployed for men), and comprise over<br />
49 per cent of total urban unemployed in Amman. 55 In Egypt,<br />
urban unemployment has also disproportionately affected the<br />
youth. 56<br />
In some of the countries, unemployment is correlated with<br />
lower or higher educational attainment. In Jordan most of<br />
the urban unemployed were either illiterate or held secondary<br />
degrees, rather than tertiary degrees. Residents with tertiary<br />
degrees (18.4 per cent) and vocational training (19.8 per cent)<br />
made up the smallest portions of the urban unemployed. 57<br />
However, in Egypt, those with a tertiary degree tend to<br />
experience higher rates of unemployment. In Lebanon, which<br />
has the highest rate of tertiary enrolment in the region (52 per<br />
cent), holders of university degrees account for 29.7 per cent<br />
of the unemployed population. 58 In Jordan, with a 41 per<br />
cent enrolment rate in tertiary education, university graduates<br />
comprised 19.8 per cent of the urban unemployed. Many of<br />
the protestors in the <strong>Arab</strong> world were highly educated youths<br />
whose skills did not match the demands of the labour market,<br />
further demonstrating the need for policies to create better<br />
employment opportunities for this segment of society.<br />
Education<br />
School enrolment rates are high in all countries of the subregion,<br />
with all children attending primary schools, between<br />
74 and 88 per cent in the secondary level and between 17 and<br />
52 per cent enrolled in university level programmes. Adult<br />
literacy rates are high, ranging from 98.9 per cent in Jordan<br />
to 92.5 per cent in Syria. All countries face the challenge of<br />
ensuring that school curricula better match the evolution of<br />
skills demanded by the changing economy, particularly at the<br />
university level to ensure the full employment of university<br />
graduates.<br />
Educational attainments tend to be higher in urban areas.<br />
As of 2004, in Jordan, 8.4 per cent were illiterate and 3.6<br />
TABLE 14: SCHOOL ENROLMENT (GROSS, %)<br />
Country Primary Secondary Tertiary<br />
Egypt 100 79 28<br />
Iraq 103 51 N/A<br />
Jordan 97 88 41<br />
Lebanon 101 82 52<br />
Syria 124 74 17<br />
Source: World Development Indicators (latest years available)
School children walk home after a day of classes in the hilly Jordanian capital, Amman. School enrollment rates are high in all Mashreq countries. ©Joel Carillet/iStockPhoto<br />
per cent could read and write, while 41.4 per cent of the<br />
population had achieved a level of basic education. Some 1.2<br />
per cent held a vocational degree, 33.8 per cent had achieved<br />
a secondary degree and 11.6 per cent held a tertiary degree or<br />
higher. In Amman, over 50 per cent of the population had a<br />
secondary degree or higher and 42 per cent in Irbid. In rural<br />
areas, residents were more likely to have less than a secondary<br />
degree or be illiterate. 59<br />
Health<br />
Most countries in the region have relatively good access<br />
to health services and improved sanitation facilities in urban<br />
areas, with the exception of Syria. Overall government<br />
spending on health care in the region varies from 8.9 per<br />
cent of GDP in Jordan to 6.3 per cent in Egypt 60 and 3.6<br />
TABLE 15: HEALTH EXPENDITURES<br />
Country Egypt Iraq Jordan Lebanon Syria<br />
Total % of GDP 6.3 8.9 8.8 3.6<br />
Under 5 Mortality Rate per 1,000 Live Births 21 44 25 12 16<br />
Source: % of GDP from World Development Indicators, 2007; Under-Five Mortality Rate from The Henry J. Kaiser Family Foundation, 2009 63<br />
per cent in Syria, an amount generally insufficient to meet<br />
the demand for health services of a growing population. 61<br />
Medical services tend to be concentrated in urban areas. For<br />
instance, in Syria, most of the medical facilities, particularly<br />
specialized medical services, are concentrated in Damascus<br />
and Aleppo. 62<br />
In urban areas, health is often tied to housing conditions. In<br />
Aleppo, families living on the urban periphery have suffered<br />
from poorer health due to inadequate housing and limited<br />
access to health services. 64 In Beirut, residents in informal<br />
settlements had a higher incidence of chronic illnesses. 65<br />
In Jordan, the Ministry of Health, in cooperation with the<br />
World Health Organization, has launched a campaign to<br />
overcome urban health challenges. 66 In Egypt, the private<br />
sector is becoming more prominent in the delivery of health<br />
services in urban areas.<br />
47
48<br />
2.3<br />
The Growth Patterns of Mashreq <strong>Cities</strong><br />
The structure of Mashreq cities typically consist of<br />
successive rings of growth. The oldest, the historic<br />
medina, several of which are on the UNESCO<br />
World Heritage List, is characterized by dense clusters of<br />
buildings with commercial uses on the ground floor. The<br />
awqaf charitable foundations may own as much as 40 per<br />
cent of properties. Governments have implemented a number<br />
of restoration projects to improve public spaces, streets and<br />
facades that recapture the cultural significance and value of<br />
historic centres.<br />
During the colonial era, urban settlements spread to<br />
planned extensions with wide boulevards, larger blocks and<br />
multi-storey buildings that reflected the introduction of<br />
European styles of living for the upper-class. With continued<br />
urban growth, many of these residential areas have been<br />
converted into offices.<br />
At independence, several governments adopted land<br />
reforms that nationalized large land holdings and repossessed<br />
properties owned by foreigners who had left the country,<br />
adding sizeable areas to public land reserves. Nevertheless,<br />
with the accelerated urbanisation of the 1960s to 1980s<br />
during which annual city growth rates ranged from 4 to 8<br />
per cent, then slowed to 2 to 4 per cent in the 1980s, the<br />
existing public land reserves were unable to accommodate<br />
land demand. The land area of the main cities nearly doubled,<br />
fed by massive inflows of private capital and the remittances<br />
of expatriate workers. Urbanized areas spilled over into a third<br />
layer with unplanned subdivisions on fringe agricultural land<br />
that densified rapidly.<br />
Egypt and Jordan have developed national housing<br />
strategies and created public and parastatal agencies to redirect<br />
expansion beyond the urban fringe by developing new towns,<br />
constituting a fourth urban layer. They are reshaping larger<br />
urban centres into structured city-regions, changing the<br />
spatial distribution of land values as they increase in and<br />
around newly developed sites.<br />
For instance, in Egypt, 110 km² of desert lands were<br />
urbanised between 1995 and 2007 while expansion on<br />
agricultural lands was contained to 55 km². In Iraq, a National<br />
Housing Policy was launched in late 2010 with the intent to<br />
improve overall housing delivery, to better anticipate urban<br />
growth and to direct urban expansion. 67<br />
Informal Settlements and the Challenge of<br />
Affordable Housing<br />
Despite the efforts of government agencies, the growth of<br />
informal developments and the unmet demand for affordable<br />
housing will continue to be a major challenge in the<br />
foreseeable future. Given the age structure of the population,<br />
with those under the age of fifteen making up 44 per cent of<br />
the total population in Iraq, 32 to 35 per cent in Syria, Jordan<br />
and Egypt and 25 per cent in Lebanon, 68 the annual rate of<br />
household formation will range from 250,000 in urban areas<br />
in Egypt 69 to 61,000 in Jordan. 70<br />
A significant amount of new housing is required in all cities<br />
of the region to accommodate this demand. From 2007 to<br />
2017, Egypt will need 2.1 to 5.3 million additional housing<br />
units while Syria’s 2006-2010 Five-Year Plan estimated a<br />
national housing shortage of 687,000 units. 71 In Amman,<br />
30,000 housing units need to be built each year to satisfy<br />
demand. In Iraq, the poorest 20 per cent of the population in<br />
the six main cities requires an additional 160,000 new housing<br />
units and it is estimated that there is an overall shortfall of 2<br />
million units throughout the country. 72<br />
Frequent regional and internal conflicts in the region<br />
have caused both internal displacement and the inflow<br />
of international refugees contributing to the demand for<br />
housing. Syria currently hosts 1.1 million refugees, many<br />
of them from Iraq. 73 Since 1948, Jordan has hosted over<br />
1.5 million displaced persons from the OPT and Iraq.<br />
By 1980, half a million Palestinian refugees lived on onequarter<br />
of Amman’s land area. 74 Lebanon currently hosts an<br />
estimated 415,000 Palestinian refugees, 215,000 of whom<br />
Cairo Amman Beirut Damascus<br />
Average Rent (USD /m2 /month) USD 4.50 - 6.65 USD 7 to 8 USD 10 to 12 USD 210<br />
Average Sales Price (USD /m 2 )<br />
Urban Development and Housing Conditions<br />
TABLE 16: FORMAL HOUSING MARKET PERFORMANCE INDICATORS<br />
USD 1,000 to 1,420 in Cairo<br />
(USD 300-880, 6 th of Oct)<br />
USD 1,200<br />
to 2,200<br />
USD 2,800<br />
to 6,000<br />
Vacancy Rate (high-end) 5% 17% .. 10%<br />
Sources: Colliers International 2008, 2010; Global Property Guide 2009<br />
USD 4,160
BOX 6: URBAN BAGHDAD: IMPACT OF CONFLICT ON DAILY LIFE<br />
<br />
A displaced family carries aid material in a sponge bed in an IDP camp in Abu Ghriab area, western Baghdad.<br />
©Contributor/IRIN<br />
During the height of the violence in Iraq,<br />
Baghdad suffered 45 per cent of all casualties<br />
with an estimated 10,463 conflict-related<br />
deaths in 2007 1 alone. Some 68 per cent of<br />
Baghdad residents described local security<br />
as ‘very bad.’ 2 . Over 10 per cent of Baghdad’s<br />
population, almost 700,000 people, have left or<br />
moved within the city since 2006. Most were<br />
displaced in 2006 and 2007 3 . Families cited<br />
direct threats to life and general violence as<br />
the most common reasons for fleeing to areas<br />
where their religion or sect predominated and<br />
where they felt safer 4 . This process has cemented<br />
social divides and created city neighbourhoods<br />
spatially fragmented along religious<br />
and sectarian divisions.<br />
The most vulnerable displaced families<br />
live in public buildings, old military encampments,<br />
crude group squatter settlements or<br />
on publicly or privately owned land. A total of<br />
136 camps have been identified with at least<br />
48,000 families resident 5 .<br />
People living in camps and public buildings<br />
have limited or no access to decent housing,<br />
water, sanitation, electricity or health services.<br />
As a result, children and the elderly are particularly<br />
at risk of serious health problems and<br />
chronic illnesses. They are also at risk of being<br />
evicted at any time, creating constant stress.<br />
Sources: Iraq: Where Things Stand, ABC NEWS BBC/NHK Poll, September 2007<br />
Before 2003, a network of arterial roads<br />
crossed the city, linking neighbourhoods in the<br />
north and south and on the west and east bank<br />
of the Tigris. Cars and buses moved freely allowing<br />
people easy access to places of work,<br />
education and recreation.<br />
After 2003, the establishment of militarycontrolled<br />
zones and bases - including the International<br />
Zone, road-blocks and checkpoints<br />
- interrupted movement along arterial roads<br />
linking the different areas of Baghdad. As a<br />
228,000<br />
Refugee and IDP returnee individuals<br />
366,000<br />
IDP individuals leaving Baghdad<br />
At least 126,000<br />
refugee individuals leaving<br />
Baghdad for other countries<br />
security measure to control movements in and<br />
out of neighbourhoods experiencing sectarian<br />
violence, lengthy runs of T-wall and road blocks<br />
prevent access for vehicles from the secondary<br />
roads onto the main roads.<br />
All these barriers and diversions have created<br />
widespread congestion and made regular<br />
journeys longer in time and distance 6 . Over<br />
time, the congestion and inconvenience has<br />
reduced the number and length of journeys<br />
people take, preferring instead to shop, work<br />
and socialize within their local neighbourhood.<br />
Since 2003, major recreation areas and<br />
facilities have been closed or rendered offlimits.<br />
Open spaces normally used by families<br />
have become dumping sites or now are filled<br />
with sewage and stagnant water. Nearly half<br />
the population of Baghdad cited a poor-quality<br />
environment as one of the key problems they<br />
have faced since 2003 7 . They complain of<br />
leaking sewers, uncollected garbage and foul<br />
odours. Recreation space has a role in urban<br />
life, especially when housing is overcrowded<br />
and lacks outside space, but many local open<br />
spaces such as city parks and the stadium or<br />
walking along or boating on the Tigris have<br />
been either closed or are off limits since 2003.<br />
Four of the centrally located hotels used in the<br />
past for business, weddings and celebrations<br />
are now either closed or used as safe areas for<br />
foreign businesses and media 8 .<br />
50,000<br />
families moving<br />
within Baghdad<br />
66,000<br />
IDP individuals<br />
move to Baghdad<br />
7 Million<br />
Total Baghdad<br />
population<br />
49
50<br />
BOX 7: GATED COMMUNITIES IN LEBANON: EVOLUTION AND DEVELOPMENT TRENDS<br />
<br />
New apartments on Beirut's coast. ©diak/Shutterstock<br />
Gated Communities (GCs) belong to<br />
a residential development typology that<br />
combines residential property rights with the<br />
rights to co-use, co-own and co-manage, in<br />
an exclusive manner, collectively-consumed<br />
local public goods such as roads, parks,<br />
swimming pools, tennis courts, security,<br />
electricity and so on.<br />
By enabling exclusivity of consumption, this<br />
residential typology transforms public goods<br />
into ‘club goods’ (Buchnan, 1965). Some see<br />
GCs as a solution that overcomes the free-rider<br />
problem of local public goods as GCs ensure<br />
that those who actually profit from local public<br />
goods pay fees. Others criticize GCs for their<br />
segregating capacity and for accentuating<br />
social hierarchies.<br />
Termed as Moujamaat Sakaniah in Lebanon,<br />
which translates into ‘residential compounds’,<br />
GCs are governed by real estate contract law<br />
and internal private rules. In Lebanon, GCs<br />
mainly come in two forms. The first is the<br />
condominium that contains apartments and<br />
combines residences to a landscape amenity<br />
No. housing units<br />
2,500<br />
2,000<br />
1,500<br />
1,000<br />
500<br />
0<br />
2009<br />
2010<br />
Serviced housing compound<br />
Luxury housing compound<br />
such as ski slopes, mountain areas, views<br />
or a beach. The second is the single-family<br />
detached house in model towns, usually<br />
marketed along the popular theme of ‘the<br />
authentic Lebanese village community’.<br />
In the 1960s, the early Lebanese GCs<br />
comprised small apartments near beaches<br />
and mountains used as second homes. In the<br />
1970s and 1980s, when the civil war led to<br />
rapid population movements, many of these<br />
became primary homes (Glasze et al, 2002).<br />
During the civil war, delivery of public<br />
services deteriorated because of the<br />
diminished tax base in the divided Lebanese<br />
state. The private sector initiated deliberate<br />
GC construction, targeting those able to afford<br />
‘club’ solutions to lack (or poor quality) of<br />
security, electricity and water supply.<br />
When the civil war was halted in the<br />
1990s, public provision of basic public services<br />
resumed, but post-war urban conditions<br />
continued to drive the demand for GCs. 2002<br />
estimates indicated that GCs represented<br />
approximately one per cent of the Lebanese<br />
housing supply (Glazse et al). By 2009, 3.8<br />
per cent of all units built were GCs, almost<br />
tripling to reach 10 per cent in 2010 (data<br />
compiled from the Order of Engineers and<br />
Architects). 2010 also saw a marked growth<br />
in development of GCs catering for middleincome<br />
groups. (See graph)<br />
The spread of GCs in Lebanon is encouraged<br />
by the fact that zoning exists only for a small<br />
part of the national territory, rendering all<br />
un-zoned lands potential sites for large-<br />
scale developments. Additionally, the grand<br />
ensembles, under which large construction<br />
projects approved by the Higher Council of<br />
Urban Planning can have all existing legislations<br />
waived, encourages these types of projects.<br />
Within these contexts, further proliferation<br />
of GCs in Lebanon is a most likely outcome,<br />
posing several problems.<br />
Since sectarian-based identities and<br />
loyalties remain territorially anchored in<br />
Lebanon, the Lebanese housing market is<br />
spatially segregated and fragmented along<br />
lines of confessional affiliation (Alaily-Mattar,<br />
2010). This means that GCs typically cater for<br />
homogenous religious groups. Consequently, as<br />
GCs in Lebanon increase, they create additional<br />
physical and social barriers, reinforcing further<br />
undesirable urban fragmentation.<br />
Moreover, public provision of basic public<br />
services will continue to deteriorate if more<br />
affluent societal groups increasingly cater<br />
for themselves. The economically weaker<br />
urban strata will increasingly be left to their<br />
own devices. Due to the resulting social<br />
fragmentation, they will lack the political<br />
weight to enforce even minimum levels of<br />
public services delivery adequacy.<br />
Although GCs are now catering for broader<br />
urban population strata, this should not be<br />
taken for a sign of improved sectarian mixing<br />
or the tearing down of sectarian barriers. At<br />
the upper income levels, GCs function mostly<br />
as second homes that facilitate networking<br />
among affluent groups, clientilism and<br />
‘relational rights’ (Joseph, 1994). Hence,<br />
more GCs in Lebanon, particularly the affluent<br />
ones, could generate more elitist power<br />
concentration.<br />
Finally, critique of GCs in Lebanon on<br />
the basis of their segregating capacity<br />
should extend to the segregation in leisure,<br />
transit and other public urban spaces. The<br />
phenomenon of gating clearly extends beyond<br />
the residential domain to create a highly<br />
fragmented urban spatiality that undermines<br />
daily life (Alaily-Mattar, 2010). It obstructs<br />
more appropriate usage of public spaces<br />
throughout cities by establishing highly<br />
undesirable social barriers, over and above<br />
physical hindrances, to the accessibility of<br />
public space. Ultimately, these processes can<br />
only lead to total urban dysfunctionality.
BOX 8: ISLAMIC HOUSING FINANCE<br />
Islamic finance gained attention in the<br />
<strong>Arab</strong> world in the early 1970s when Islamic<br />
jurisprudents started calling for alternative<br />
financial practices to, what - from Shari'a<br />
perspective - is considered usury. Islamic<br />
financing’s basic principles include: a ban<br />
on interest (riba), uncertainty, risk and profit<br />
sharing and a focus on ethical investments<br />
that enhance society and asset backing. These<br />
principles are also applicable to housing finance<br />
and have been used by banks to promote<br />
access to housing finance, especially for<br />
middle- and lower-income groups.<br />
The rise of Islamic finance originated from<br />
within the <strong>Arab</strong> world with the creation of the<br />
Organization of Islamic Countries (OIC) and the<br />
oil boom of 1973-74 with its commensurate<br />
increase in capital that turned several <strong>Arab</strong><br />
countries into financial powerhouses. The<br />
Islamic Development Bank, founded at the OIC<br />
summit in 1974, became the cornerstone for<br />
Islamic finance.<br />
The earliest private Islamic banks were<br />
established in the United <strong>Arab</strong> Emirates,<br />
Egypt and Sudan and were followed by Egypt,<br />
live in United Nations Works and Relief Agency for Palestine<br />
Refugees in the Near East (UNRWA) camps. 75 In Iraq itself,<br />
the ongoing movement of returnees and IDPs has resulted in<br />
informal housing practices in many urban areas throughout<br />
the country. 76<br />
The formal housing market has focused largely on building<br />
housing for upper- and upper-middle income households,<br />
overseas émigrés and second-home investors. Damascus,<br />
ranked the eighth most expensive residential property market<br />
in the world in 2009 with sales prices of flats ranging between<br />
USD 2,000 and USD 10,000 per square metre, compared<br />
to the average annual per capita income of USD 2,450. 77<br />
Following the 2008 Doha Accord that ended internal conflict,<br />
Lebanon experienced a housing boom, with property values<br />
in Beirut growing by 40 per cent a year. 78 Property values in<br />
Amman and Cairo are similarly expensive, ranging from USD<br />
1,200 to USD 2,200 per square metre in Amman and USD<br />
1,000 to USD 1,420 per square metre in Cairo. 79 In the new<br />
communities of New Cairo and Sixth of October, property<br />
values have risen by 75 per cent per year since 2005. 80<br />
While the underdevelopment of housing finance in the<br />
Mashreq shielded these economies from the global financial<br />
crisis, rental and sales prices of high-end property prices<br />
nevertheless fell by 60 per cent in Amman and 37 per cent in<br />
Cairo. Industry experts predict that developers in these two<br />
Sudan, Kuwait, Bahrain and Jordan. Recently,<br />
Lebanon increased its Islamic banking profile<br />
with the Saudi-based Al-Baraka, while Syria<br />
also licensed its first Islamic bank, jointly-owned<br />
with Qatar. In 2010, the Faisal Islamic Bank of<br />
Egypt realized a USD 325 million net return on<br />
its banking investments under the three main<br />
Islamic finance models: Musharaka, Murabaha<br />
and Mudaraba.<br />
The Jordan Islamic bank is now one of the<br />
most active in housing finance. Established in<br />
1979, it focused on housing loans to modestincome<br />
households and soon grew into the<br />
country’s third-largest bank with almost 15 per<br />
cent of its JOD 400 million (USD 565 million)<br />
investment account dedicated to housingrelated<br />
lending. The bank issues Ijara wa Iqtina<br />
contracts (rent to own) for house sales and<br />
leasebacks that also exempt the home buyer<br />
from the large transfer fees. Up to JD 2,000<br />
(USD 2,815) of the annual mortgage interest can<br />
be deducted from borrowers’ taxable income.<br />
The bank further finances home improvements<br />
through bulk purchasing of building materials,<br />
particularly for the home extensions which are<br />
common practice in low-income urban areas.<br />
Islamic financing should be seen as<br />
complementing and augmenting conventional<br />
financial systems through its deep knowledge<br />
and experience. Successful integration of<br />
Islamic instruments with conventional financing<br />
has facilitated the realization of many large<br />
and complex multi-source financing deals.<br />
Whereas only five years ago, Islamic financing<br />
was still regarded as an infant industry striving<br />
to prove its viability and competitiveness,<br />
Islamic financing is now among the fastestgrowing<br />
segments in the international financial<br />
system with an estimated average annual<br />
growth of 15 to 20 per cent. Islamic capital<br />
invested in global financial institutions is now<br />
estimated at USD 2 trillion.<br />
Islamic project financing has offered<br />
opportunities for risk diversification, avenues<br />
for resource mobilization and revenue sharing<br />
and enhanced services between contractual<br />
parties. These financial deals have illustrated<br />
how conventional and Islamic financing can<br />
blend and coexist under common legal and<br />
regulatory arrangements.<br />
countries will shift to the upper-middle, middle and even<br />
lower-income households where demand remains strong; the<br />
unmet demand for middle-income housing in Egypt in 2010<br />
exceeded 200,000 units.<br />
However, the construction of affordable housing by the<br />
private sector faces two major challenges: a) availability of<br />
affordable serviced land; and b) access to housing finance<br />
by both developers and homebuyers. Complementary and<br />
integrated government policies to supply affordable serviced<br />
land, support mortgage markets and microfinance and more<br />
efficient land registration will be critical in leveraging and<br />
encouraging the private sector to invest in affordable housing.<br />
While most Mashreq governments have prioritized the<br />
construction of affordable housing to varying degrees, they<br />
have not been able to meet demand. Furthermore, these<br />
initiatives have rarely been integrated into broader policy<br />
reforms to address the causes of informal development, one of<br />
which is the high price of real estate. Given escalating housing<br />
and land prices, a middle-income family in Lebanon must<br />
save for nine years before it can afford to buy a modest home<br />
in a major city, and across the <strong>Arab</strong> region the poorest income<br />
groups commonly spend 30 to 40 or even 50 per cent of their<br />
monthly income on housing. 81<br />
The high prices of the formal housing market effectively<br />
exclude middle- and lower-income groups. A USAID survey<br />
51
52<br />
<br />
Gilo, Occupied Palestinian Territories. New construction in the Israeli settlement of Gilo covers a hillside between Jerusalem and the West Bank town of Bethlehem.<br />
©Ryan Rodrick Beiler/iStockPhoto<br />
of urban households in Egypt found that housing units were<br />
25 per cent smaller in informal than in formal areas, per<br />
square metre prices were 13 per cent that of formal units and<br />
median purchase prices from 2003 to 2008 were 50 per cent<br />
lower in informal areas. 82 In Egypt and Jordan, as much as 95<br />
per cent of housing construction is done by the private sector,<br />
with most of it in the informal markets.<br />
Lebanon and Syria have yet to develop national housing<br />
strategies, as evident in their limited and uncoordinated<br />
responses to the sprawl of informal housing. Since 1980, seven<br />
per cent of Lebanon’s cultivated land and 15 per cent of its<br />
irrigated land have been taken over by informal settlements. 83<br />
In Greater Beirut, 300,000 people, or 25 per cent of the city’s<br />
population (not including Palestinian refugees) live in 22<br />
informal settlements and own illegally occupied land. 84<br />
Today, 38 per cent of Syria’s total population lives in<br />
informal areas, including an estimated 71 per cent of residents<br />
in Hassakeh, 60 per cent of residents in Damascus, 49 per<br />
cent of residents in Ar-Raqqah and 44 per cent in Aleppo. 85<br />
With an estimated 16 per cent of urban residents in informal<br />
settlements, Jordan is currently implementing a lower-income<br />
housing programme to build 100,000 units from 2008 to<br />
2013.<br />
The occupation of the Palestinian territories has crowded<br />
a growing Palestinian population unto decreasing amounts<br />
of land. Although the construction of Israeli settlements in<br />
the OPT is illegal, the settler population in the West Bank is<br />
increasing by 5.5 per cent each year, with 450,000 living there<br />
as of 2007. 86 Over 38 per cent of the West Bank, including<br />
military zones, Israeli settlements and nature preserves, is<br />
closed to Palestinians. 87 Palestinian communities in the West<br />
Bank have become increasingly fragmented and impoverished<br />
as they become encircled by roads, checkpoints and Israeli<br />
settlements. It is estimated that, in East Jerusalem, there is<br />
an unmet housing need of 10,000 units, with an additional<br />
1,500 units needed each year. 88<br />
Access to health and education for many residents has<br />
worsened in East Jerusalem after the building of the separation<br />
wall, which cut off around a quarter of Palestinian Jerusalemites<br />
from their city. In Gaza, where over 4,000 housing units have<br />
been destroyed and more than 20,000 units damaged since<br />
2008, the ongoing blockade has prevented residents from<br />
reconstructing or building new housing, leading to a housing<br />
shortage of 60,000 units. 89<br />
Egypt stands out among the Mashreq countries with a<br />
steady annual production of affordable housing that had<br />
ranged from 15,000 to 35,000 in past decades and started<br />
to mushroom in 2005 with the adoption of the National<br />
Housing Project that aimed to create 500,000 new affordable<br />
homes by 2011 in the Aswan, Borg Al <strong>Arab</strong>, Sadat City and<br />
Sixth of October. In Alexandria, the World Bank approved a<br />
five-year, USD 100 million loan in 2007 to address the living<br />
conditions in 30 squatter settlements, as well as to improve<br />
accessibility to economic centres and enhance the local<br />
business environment through regulatory changes.<br />
Unplanned urbanization in the Mashreq includes<br />
unauthorized subdivisions, unregistered property, and<br />
construction in environmentally sensitive areas. Consequently<br />
their residents often face social challenges. They typically<br />
possess the four basic components of adequate shelter cited<br />
by UN-Habitat: safe access to water and sanitation, durable<br />
housing and sufficient living area. In 2006, for example, while<br />
the governorate of Alexandria documented 41 per cent of the<br />
population as living in 62 informal areas, UN-Habitat cited<br />
only 7.2 per cent of the city as living in slums, most of which<br />
were only deprived of sanitation. 90
BOX 9: EGYPT’S INFORMAL SETTLEMENT DEVELOPMENT FACILITY<br />
As a result of high rates of population<br />
growth, demand for housing has far outstripped<br />
the capacity of the public and private sector to<br />
provide housing on serviced land affordable to<br />
middle- and lower-income families.<br />
Starting in the mid-1960s, vast unserviced<br />
and underserviced informal settlements<br />
proliferated illegally on agricultural lands on<br />
the urban fringes and on state-owned desert<br />
lands at the edge of the valley. Between<br />
1976 and 1994, the country lost an average<br />
of 8,000 ha of agricultural land yearly to<br />
urbanisation and has only been able to reclaim<br />
4,800 ha of desert land per year and bring it<br />
under cultivation using the available water<br />
resources. To manage the chaotic expansion<br />
of the informal settlements, the government<br />
has committed massive investments since<br />
1976 to draw urbanization into the desert. It<br />
has recently turned to land-based financing to<br />
cover the high cost of extending services to the<br />
desert and attract private developers to invest<br />
in the development of desert sites.<br />
In 2009, the Government of Egypt set up a<br />
dedicated facility to support informal settlement<br />
upgrading. The Facility is run by an executive<br />
director and a board chaired by the Minister<br />
of Local Development with representatives<br />
from six government departments, three civil<br />
society organizations and three specialized<br />
experts. The Facility was capitalized with a<br />
One of the challenges faced by the residents of informal<br />
settlements is the inability to use their unregistered properties<br />
as financial collateral. The lack of cadastral information also<br />
poses problems for local governments that are unable to<br />
collect property taxes beyond those levied from the formal<br />
sector, limiting resources available to defray both operating<br />
expenditures and community improvements.<br />
Land Tenure, Property Rights and Titling<br />
The Mashreq countries share a common history of land<br />
tenure, titling laws and local institutions. Under the Ottoman<br />
Empire, land tenure systems were solidly anchored in Shari'a<br />
law and reflected the evolution of Islamic jurisprudence over<br />
1,500 years. The Ottoman Land Code of 1858 established five<br />
categories of land tenure that still serves as the basis of modern<br />
land laws: privately owned land (mulk); religious endowments<br />
(waqf) that retain such designation in perpetuity; communal<br />
land and pasture (musha); state land (miri) and “dead” or<br />
uncultivated land (mewat). 91<br />
government seed grant of EGP 500 million (or<br />
USD 87.6 million) and an additional EGP 200<br />
million (USD 35 million) budget allocation. It<br />
received an EGP 100 million (USD 17.5 million)<br />
grant from USAID.<br />
The executive director of the Facility has<br />
prepared and is implementing a national action<br />
plan, which includes:<br />
<br />
country for the first time, categorizing the<br />
areas and developing priorities for action.<br />
By prioritizing the projects, the process has<br />
become much more manageable with initial<br />
interventions affecting 850,000 residents in<br />
informal settlements, rather than the total of<br />
20 million;<br />
<br />
capacity-building to be extended to those<br />
local authorities implementing projects;<br />
<br />
including private sector entities;<br />
<br />
the prioritization and the readiness of local<br />
authorities to launch projects; and<br />
<br />
revenue.<br />
The Facility has requested a government<br />
allocation of land in the new towns to be used<br />
as an asset to recapitalize and to speed up<br />
disbursements. In addition, the Facility has<br />
requested the following:<br />
1. About 75,000 subsidized housing units for<br />
priority re-housing of urban dwellers that<br />
have to be relocated, specifically:<br />
<br />
hazardous, life-threatening areas; and<br />
<br />
unsound buildings and alongside healththreatening<br />
activities (dumps, noxious<br />
industries and so on).<br />
2. The use of land-based financing for on-site<br />
re-housing of families living in unsanitary,<br />
dilapidated dwellings on publicly-owned<br />
land<br />
In the first phase, the Facility launched 25<br />
pilot projects testing various approaches in five<br />
cities in Upper Egypt, four cities in the delta,<br />
and the three cities along the Suez Canal. It<br />
provided technical assistance to Alexandria for<br />
its upgrading projects, which the governorate<br />
is funding from its own resources. This first<br />
phase does not include projects in the Greater<br />
Cairo region.<br />
Moving forward, Egypt’s Informal<br />
Settlement Development Facility faces two<br />
major challenges:<br />
1. Creating a legal framework that can<br />
accommodate the complex land<br />
transactions required for land-based<br />
financing of upgrading projects; and<br />
2. Ensuring repayment by borrowing local<br />
authorities. 9<br />
Ottoman practices of land registration entailed either a<br />
court seal on a document demonstrating proof of ownership<br />
or the transfer of property or witnesses (hujja) affirming the<br />
transfer of property. In modern times, the land registration<br />
process has become mired in bureaucracy: across the Middle<br />
East and North Africa, property registration takes on average<br />
six steps over 36 days, at a cost of 5.7 per cent of the property<br />
value – the second most expensive registration process in the<br />
world after sub-Saharan Africa. 92<br />
The difficulty of reconciling complex traditional bundles<br />
of land rights with modern categories, the refusal of the<br />
authorities to recognize developments that challenge their<br />
own zoning regulations and the complexity of property<br />
registration procedures have resulted in a significant<br />
proportion of unregistered properties in the Mashreq. This<br />
includes 90 per cent of all properties in Egypt and 38 per cent<br />
of those in Syria.<br />
In Egypt, formal land registration is a lengthy and<br />
cumbersome process involving no fewer than 71 bureaucratic<br />
procedures with 31 different offices, which can take six to<br />
53
54<br />
14 years to complete. 93 Once equivalent to 12 per cent of<br />
property value, the registration fee has been reduced to a flat<br />
fee of £E 2,000 (USD 350). 94<br />
A practical common alternative is the hujja transfer of<br />
property under which builders of informal settlements revived<br />
the Ottoman traditions of gaining rights to unused land<br />
through improvements. Most property owners rely on the<br />
traditional hujja system, thereby creating a parallel property<br />
system since hujja agreements are upheld in the courts. Efforts<br />
to regularize land titles have been a fundamental component<br />
of settlement upgrading projects.<br />
Jordan’s zoning regulations during the British Mandate set<br />
a minimum parcel size of 250m 2 , which was too large to be<br />
affordable for most households. This resulted in development<br />
of 250m 2 parcels co-owned by several people (musharak). 95<br />
In recent years, the Department of Land and Survey has<br />
taken the important step of permitting subdivided titling and<br />
registration of these parcels, thereby allowing owners to use<br />
their properties as collateral for financing. In the last housing<br />
survey conducted by the Housing and Urban Development<br />
Corporation in 2000, more than half of Amman’s informal<br />
settlements had some form of land tenure, most commonly<br />
in the form of musharak. 96<br />
Syria’s Law No. 33 of 2008 seeks to confirm property<br />
ownership, updates property registers and removes common<br />
ownership; it is being applied first in Aleppo, Damascus and<br />
Homs.<br />
Ongoing conflict in the region has also deterred efforts to<br />
maintain records and update property registers. In Lebanon,<br />
the long civil war destroyed a number of public institutions,<br />
including property registration. The automation and<br />
updating of cadastral information is a priority in the country’s<br />
economic development efforts. 97<br />
In Iraq, land registration and ownership are complex,<br />
muddled issues due to the flight of many Iraqis after 2003;<br />
the informal or illegal occupation of evacuated homes and<br />
land by squatters; conflicts and mutual claims placed by both<br />
returnees and squatters; and the lack of any specific legal<br />
framework for resolving land and property disputes. 98<br />
Urban Land and Fiscal Policies<br />
Governments influence urban land policies by managing<br />
demand through fiscal policies that regulate property taxes,<br />
the availability of subsidies and incentives, and supply of land<br />
through zoning and the construction of infrastructure. The<br />
widespread development of informal settlements is a direct<br />
result of an imbalance between these urban drivers.<br />
Government land ownership, particularly of key areas<br />
surrounding modern cities, restricts land supply, resulting<br />
in shortages, speculation and high land prices. 99 A common<br />
government response has been to increase the provision of<br />
serviced parcels or, more rarely, subsidised low-income housing.<br />
Egypt and Jordan have defined clear public 'initiatives' and<br />
'roles' in urban land markets; Syria’s urban land and housing<br />
market is rapidly opening after years of socialist policies.<br />
Public ownership and price controls have distorted rental<br />
markets. Whereas publicly-subsidised rental housing should<br />
include the cost of maintenance, public housing in the<br />
Mashreq does not and has become synonymous with rundown<br />
housing. Rent control, whether in the form of a frozen rent or<br />
capped rent growth rates, is widespread in the Mashreq.<br />
In Egypt, around 60 per cent of units are leased under the<br />
old rent law, which is capped at 18 per cent of the real value,<br />
while new rent law units are capped at 80 per cent. 100 Rents in<br />
the pre-1960 building stock have not increased and affluent<br />
families living in large five- or six-room apartments pay four<br />
to five times less than poor households renting two rooms<br />
in an informal settlement. Low rents and the difficulty of<br />
evicting errant tenants have led many landlords to keep their<br />
properties vacant, including an estimated 800,000 to one<br />
million apartments in Cairo in 1996. 101<br />
In Lebanon, pre-1990 apartments are subject to rent<br />
control. In Syria, rent control has contributed to as many as<br />
500,000 units being kept vacant today.<br />
Regulations on property taxes have also deterred owners<br />
from registering their properties to avoid not only the high<br />
registration fees but also multiple annual taxes based on<br />
property value. The challenge of levying taxes on unregistered<br />
properties; outdated property records; obsolete assessments<br />
of property value; and centralized tax collection systems have<br />
limited the ability of the governments of the region to collect<br />
property tax collection and, in turn, limited the provision of<br />
public service.<br />
In Egypt, informal settlements have encroached upon<br />
400,000 hectares of peri-urban agricultural lands over the<br />
past 25 years. As of 2007, there were an estimated 8.5 million<br />
informal housing units in Egypt, 55 per cent of which are on<br />
agricultural land, 38 per cent are outside of administrative<br />
village boundaries and 7 per cent on government-owned<br />
desert land within municipal boundaries. 102 In the Greater<br />
Cairo Region, 62 per cent of households live in informal<br />
settlements, 81 per cent of which sit on privately owned<br />
land, 10 per cent on government-owned desert land and the<br />
remainder on government-owned agricultural land. 103<br />
In the 1970s, to reduce development on agricultural land<br />
the government began to promote the development of new<br />
cities in the desert. They have successfully attracted private<br />
investors as land prices doubled every other year with land<br />
development investments growing from EGP 15 million<br />
(USD 2.6 million) in 2005 to EGP 3,000 million (USD 526<br />
million) in 2009. 104 They are becoming middle-class bedroom<br />
communities as high standard of construction and planning<br />
and their distance from central Cairo precludes their socioeconomic<br />
diversity. 105 As seen in the case of Sixth of October,<br />
most investment has been speculative and commercial with<br />
properties lying vacant.<br />
The National Housing Project promotes the development<br />
of 500,000 units of affordable housing. The initiative leverages<br />
an unprecedented level of private sector support, with 126<br />
private real estate companies building 95,000 of the units<br />
and individual homebuyers building another 100,000. 106 The
In Greater Cairo, 62 per cent of households live in informal settlements. ©David Evers. Licensed under the Creative Commons Attribution 2.0 Generic license.<br />
average home cost is EGP 50,000 (USD 8,600), 30 per cent<br />
of which is subsidized by the government, and the remainder<br />
paid for by the buyer in monthly instalments of EGP 160<br />
(USD 28) for 20 years with an interest rate of 7.5 per cent.<br />
In addition, the government provides a per unit subsidy<br />
of EGP 13,000 for infrastructure and public services, a<br />
construction cost supplement of EGP 8,000 and a maximum<br />
subsidy of EGP 15,000 to developers or local governments.<br />
Indirect subsidies per unit include the provision of land at<br />
below market rates, amounting to EGP 12,500, as well as<br />
below market rate mortgage interest rates equalling EGP<br />
5,700, and construction loans of EGP 17,000.<br />
In total, direct and indirect subsidies equalled approximately<br />
EGP 6.7 billion for all the units or 0.4 per cent of Egypt’s<br />
2007 GDP. Despite these subsidies, the target population<br />
of households earning less than EGP 640 (USD 107) per<br />
month was too poor to afford the mortgage, leading to<br />
greater subsidies for those families and a change in the target<br />
population to a higher ceiling.<br />
Egypt embarked on a series of important tax reforms in<br />
2008, including a new Real Estate Tax Law that reduced the<br />
property tax from 60 to 10 per cent of the calculated “rental<br />
value” and encouraged property registrations to create a wider<br />
tax base and mortgage market. According to the tax authority,<br />
this law will effectively tax only the most expensive 10 per<br />
cent of properties in the country, exempting those worth less<br />
than EGP 450,000 (USD 77,000). How property values are<br />
assessed will be a critical component of this tax reform; the<br />
law provides owners with the right to challenge assessments<br />
within 60 days and have properties reassessed every five years.<br />
The law’s impact on housing registrations, however, remains<br />
to be seen.<br />
55
56<br />
Jordan. The government’s role in urban land markets<br />
has focused on the construction of infrastructure and the<br />
redevelopment of slums. The most significant infrastructure<br />
projects include the Amman first ring road and an outer ring<br />
road now being constructed to alleviate inner city congestion<br />
and open up new areas for development.<br />
Under the Social Productivity Program, the government<br />
has upgraded 38 sites since 1980. These programmes have<br />
applied three very different approaches to slum upgrading:<br />
a comprehensive, top-down approach that provided 23,000<br />
people in Amman and Aqaba land title and full infrastructure<br />
services; a comprehensive partnership approach that provided<br />
1,350 households with secure land tenure within fully serviced<br />
communities in Aqaba and a community infrastructure<br />
programme that provided 290,000 people in settlements and<br />
refugee camps with infrastructure but not tenure. 107<br />
In 2001, Jordan’s receipts from the property tax equalled<br />
two per cent of GDP, comparable to OECD levels but had<br />
a collection rate of only 50 per cent to 60 per cent. Under a<br />
UNDP project, the Ministry of Finance adopted a new tax<br />
law that merged land, building, education and sewerage taxes<br />
into one levy set at 10 per cent on 80 per cent of the imputed<br />
rental income and reduced exemptions.<br />
The project created a new tax information system and<br />
training system for municipal staff. As a result, property tax<br />
revenues, which had been stagnant, increased by 14 per cent<br />
from 2006 to 2007 in the Greater Municipality of Irbid and<br />
Al Rusayfa, and by 7 per cent in the Greater Municipality<br />
of Mafraq. 108 From 2008 to 2009, the government waived<br />
property registration tax for the first 120 m 2 of apartments<br />
smaller than 150 m 2 , saving low- and middle-income owners<br />
JOD 4,000 (USD 5,600) per unit.<br />
Lebanon. With a weak national government and prolonged<br />
conflict, the state has been unable to implement national<br />
planning laws or provide clarity in future comprehensive<br />
planning. Development, including all housing initiatives, is<br />
based on the private sector while government initiatives focus<br />
on urban infrastructure. In 2005, the government issued a<br />
new national comprehensive physical master plan, which<br />
provides a new strategy of integrating national development<br />
by improving urban-rural links.<br />
In the 1990s, with World Bank and UNDP support,<br />
Lebanon’s Department of Land Registration and Cadastre<br />
under the Ministry of Finance began to reform its revenue<br />
and fiscal management process and implemented a Cadastre<br />
Operations Modernization and Automation programme.<br />
Launched in 2002 for Beirut with 120,000 land titles, the<br />
new system allows residents to request affidavits and property<br />
information almost immediately. 109 Lebanon’s national<br />
property taxes equalled 1.5 per cent of GDP in 2009, 110 up<br />
from 1.1 per cent in 2003.<br />
However, property transactions account for 13 to 15 per<br />
cent of the state budget and, of the property tax collected,<br />
77 per cent comes from property registration, 12 per cent<br />
from built property and the rest from inheritance transfers<br />
and other fees. 111 The high reliance on a property registration<br />
tax of 5 per cent of the imputed rental value discourages those<br />
with smaller properties from registering.<br />
Adding confusion to tax collection, municipal governments<br />
also administer a property tax. People in the highest quintile<br />
of income pay 74 per cent of the municipal property tax,<br />
most of which is derived from commercial and industrial<br />
properties.<br />
Syria. Centralised planning has had a significant and<br />
not always positive impact on urban development and the<br />
production of housing. In 1979, under Law No. 60, the<br />
Government of Syria seized significant areas of undeveloped<br />
lands around Damascus for social housing, with limited<br />
compensation to the owners, and froze further urban<br />
expansion.<br />
On the eve of the law’s enactment, landowners rushed to<br />
subdivide their land and sell it at market rate. Since the law’s<br />
enactment, two-thirds of informal settlements have taken<br />
place on private land through unauthorized subdivisions.<br />
Given land constraints, informal settlements tend to be very<br />
dense, with an average of 400 people per hectare (with peaks<br />
of 800 people per hectare), as compared with 266 people per<br />
hectare in formal areas. 112 Informal areas are growing at 40 to<br />
50 per cent per year in Damascus, while in Aleppo 160 new<br />
informal dwellings are built each week. 113<br />
Syria is currently undergoing an intense period of structural<br />
and market reforms. The 10 th Five Year Plan introduced a<br />
decentralization of responsibility to municipal government.<br />
Through the Municipal Administration Modernization<br />
programme, funded by the EU, local governments in Aleppo,<br />
Damascus, Deir-ez-Zor, Homs, Lattakia and Tartous have<br />
improved their capacity to plan and implement much needed<br />
urban improvements.<br />
With the establishment of a new regional planning<br />
commission, Syria will also develop a new national<br />
development strategy. In 2008, Syria enacted the Law of<br />
Real Estate Development to promote private investment by<br />
reducing restrictions on foreign investment. The law divides<br />
the country into three zones with minimum investment<br />
criteria for the development of new cities, integrated housing<br />
in the suburbs, and housing for the poor.<br />
In most Mashreq countries rental income is the basis of<br />
property tax rates. Like Lebanon, Syria has a high registration<br />
fee levied upon the sale or inheritance of the property, 10 per<br />
cent of its value, as assessed by the Ministry of Finance. The<br />
high cost of property registration in the face of inadequate<br />
low-income housing provision will likely conflict with<br />
another 2008 law, which punishes the construction of illegal<br />
units by prison time and large fines.<br />
Noticeably, all of these countries lack provisions on taxing<br />
vacant land, a common tool to mitigate speculation. Of the<br />
Mashreq countries, Iraq is the only country to have a vacant<br />
tax law, which dates back to 1962 and is still in effect; the<br />
government levies a 10 per cent tax on the value of built<br />
property and a 2 per cent tax on vacant land.
Tripoli, Lebanon. Prolonged conflict in Lebanon has resulted in housing initiatives being left to the private sector. ©Olga Kolos/Shutterstock<br />
57
58<br />
Housing Finance and Mortgage Markets<br />
Mortgage markets are highly underdeveloped in the<br />
Mashreq countries, accounting for no more than 11 per cent<br />
of GDP. State-owned banks with relatively small borrowing<br />
limits are the main providers of short-term, high-interest<br />
housing loans.<br />
As a result, only middle- and upper-income households<br />
benefit from these financial services and most people purchase<br />
properties with cash up front that draws on savings, loans<br />
from friends and family, informal market loans, remittances<br />
and sales of personal items. In Egypt, for instance, 60 per cent<br />
of households pay for homes with cash.<br />
Several countries, including Iraq, are in the process of<br />
developing new policies on mortgage lending. The degree<br />
to which they can support the shift in developers’ interest<br />
to middle- and lower-income housing is critical to the<br />
formalization of the housing market.<br />
In 1996, Jordan became the first country in the region<br />
to create a secondary mortgage market through the Jordan<br />
Mortgage Refinance Company. Today, it has the most<br />
developed mortgage market in the Mashreq, with mortgages<br />
equalling over 11 per cent of GDP. While traditionally only<br />
catering to developers, the housing mortgage market in<br />
Lebanon has grown to 6 per cent of GDP in recent years<br />
and outstanding loans are more than double that of Egypt. 114<br />
Unlike Egypt or Jordan, where developers are prohibited<br />
from selling properties prior to construction, pre-sales are an<br />
important form of financing for developers, with households<br />
making a down payment upfront and paying instalments<br />
until construction is completed.<br />
For the past few decades, Syria’s Real Estate Bank has<br />
dominated the mortgage market where mortgage loans<br />
represent 5 per cent of GDP. It issues only 10,000 loans per<br />
year, with a maximum of USD 25,000, not enough to buy a<br />
home in most Syrian cities 115 and lower-income households<br />
turn to the informal market where interest rates can be as high<br />
as 30 per cent. 116 In 2008, a medium-sized bank developed a<br />
new mortgage product that would reduce down payments to<br />
20 per cent, down from 35 per cent, extend the repayment<br />
schedule to as much as 17 years, and charge an interest rate of<br />
9 per cent for a minimum loan of USD 16,300. 117<br />
While Egypt initiated mortgage markets in 2001, the<br />
combination of complex bureaucracy and conservative lending<br />
rules prevented its development: mortgages cannot exceed 25<br />
per cent of the down payment, interest rates average 12 per<br />
cent and loan maturities around 12 years. At present, Egypt’s<br />
mortgage market serves 75,000 customers and represents only<br />
0.4 per cent of GDP. 118<br />
Housing financing is also available through:<br />
<br />
middle and high income households at lower interest<br />
rates than commercial banks;<br />
<br />
offers civil servants housing subsidies in the form of<br />
matching grants; and<br />
<br />
of five to six per cent through housing cooperatives,<br />
usually for a housing unit priced at about EGP 15,000<br />
(USD 2,600).<br />
A new mortgage financing law adopted at the end of<br />
2010 seeks to increase the efficiency and transparency of the<br />
lending system, permits the merger of mortgage financing<br />
firms with government approval and allows the eviction of<br />
loan defaulters after six to seven months. If successful, the law<br />
could double the number of recipients by 2012.<br />
Several new developments are helping to strengthen<br />
mortgage markets and extend access by lower income<br />
households. In 2008, King Abdullah II launched a JOD 7<br />
billion (USD 9.8 billion) Royal Initiative – A Decent Home<br />
for a Decent Living – which aims to build 100,000 housing<br />
units over five years. The programme will build affordable<br />
apartments for those with incomes of less than USD 1,400<br />
per month, help beneficiaries obtain free land and a USD<br />
7,000 grant to build their own homes, allow them to buy<br />
existing homes or provide mortgages for those with land<br />
but no funding to build their own home. With USD 250<br />
million provided by the U.S. Overseas Private Investment<br />
Corporation, this initiative will provide mortgages up to<br />
USD 28,000 with a repayment period of up to 25 years, no<br />
down payment and the provision that monthly payments do<br />
not exceed one-third of income.<br />
Similarly, in 2010, a consortium of international and<br />
Palestinian financial institutions provided USD 500<br />
million in funding to create a mortgage lending facility<br />
in the Occupied Palestinian Territory to provide 25-year<br />
mortgages. The programme works with a number of local<br />
and international non-governmental organizations and in<br />
coordination with plans to develop new working- and middleclass<br />
communities. 119<br />
Microfinance is a growing sector in the Mashreq but is almost<br />
entirely focused on microenterprises rather than housing. As<br />
of 2004, there were 700,000 microfinance loans outstanding<br />
in the <strong>Arab</strong> countries, including 256,000 in Egypt. Syria’s<br />
microfinance sector is the youngest in the region; in an effort<br />
to strengthen the sector, the government enacted the General<br />
Microfinance Decree No. 15 (2007), the first of its kind in<br />
the <strong>Arab</strong> world, which allows the Central Monetary Council<br />
to license social financial banking institutions to provide<br />
micro-financing to the poor, with interest rates no higher<br />
than 9 per cent.<br />
The first to receive a license was a branch of the Aga<br />
Khan Development Network, the single largest provider of<br />
microfinance products in the country, including housing<br />
loans. Given the close relationship between housing and<br />
productive activities in low-income households – all earnings<br />
from commercial activities go towards building or improving<br />
a home, which often doubles as the workshop or shop front<br />
– much greater efforts are needed to establish microfinance<br />
products for housing in the Mashreq.
2.4<br />
Urban Mobility<br />
The Challenge of Urban Transportation<br />
Rapid urbanization in the Mashreq has overwhelmed<br />
the public sector’s ability to provide mass transit. The<br />
historic centres of many of the largest cities in the<br />
region, including Aleppo, Cairo, Damascus, Gaza City and<br />
Ma’daba, were not designed to accommodate vehicular traffic.<br />
In Karak, Jordan, for instance, the street network of the old<br />
city is only suitable for one-way traffic, creating difficult<br />
circulation patterns that exacerbate congestion and pollution.<br />
A key challenge to the region lies in promoting public<br />
transportation and reducing the environmental and health<br />
impacts of vehicular traffic. In some cases, a reorganization<br />
of circulation and the creation of off-street parking to<br />
maximize existing rights-of-way can lessen congestion.<br />
Public transportation and sidewalk improvements can also<br />
decrease motorization. Another strategy is the addition of<br />
road infrastructure: both Amman and Cairo are building ring<br />
roads to bypass currently congested roads and facilitate new<br />
peripheral development.<br />
The West Bank has a network of 1,661 km of roads. While<br />
Israelis travel freely on these roads, Palestinian access is<br />
restricted by 85 checkpoints, 460 roadblocks and a permit<br />
system for Palestinian vehicles. 120 This has encouraged<br />
Palestinians to use secondary roads instead, resulting in a twotiered<br />
road system, one for Israelis and one for Palestinians. 121<br />
Lack of free movement has had a profound impact on<br />
Palestine’s economy, as well as residents’ access to hospitals<br />
and schools. Furthermore, newly-created roads are designed<br />
to constrain the growth and connectivity of Palestinian<br />
towns. 122<br />
Although still below the world average, with the exception<br />
of Lebanon, the number of motor vehicles per 1,000 people<br />
is increasing quickly and outpacing the development of new<br />
roads. Lebanon has the highest rate of car ownership, 291<br />
passenger cars per 1,000 people, compared to 137 in Jordan,<br />
52 in Syria and 16 in the OPT. 123 Car ownership rates are<br />
increasing rapidly in Jordan (5.7 per cent a year) and Egypt (2.8<br />
per cent a year). From 2003 to 2007, the number of vehicles<br />
per kilometre of road rose to 101 from 72 in Jordan and to<br />
26 from 19 in Syria. These national averages hide the fact that<br />
most vehicles are concentrated in a few major cities. In Jordan,<br />
77.5 per cent of all vehicles are registered in Amman 124 , while<br />
one-third of Syria’s registered vehicles are in Damascus. 125<br />
The transport sector consumes 16 to 33 per cent of all<br />
energy in most Mashreq countries and over 50 per cent in<br />
the OPT, with almost all fuel being gasoline or diesel. The<br />
growing numbers of diesel vehicles are due in part to the<br />
fuel being either at par or cheaper than gasoline. In Mashreq<br />
countries, diesel vehicles collectively emit 30 to 50 times as<br />
much air pollutants as gasoline. 126<br />
<br />
Squeezing through a narrow street in Tripoli, Lebanon. Lebanon has the highest rate of car<br />
ownership in the region. ©Joel Carillet/iStockPhoto<br />
In Jordan, the transportation sector is estimated to<br />
contribute 50 to 90 per cent of all air pollutant emissions<br />
in the country. 127 The reliance on diesel is particularly high<br />
among public transport vehicles, which consume, in Syria for<br />
instance, 38 per cent of all diesel fuel. Vehicular emissions<br />
impact upon the quality of the urban environment and public<br />
health, as well as long-term energy costs and climate change.<br />
Mass Transportation<br />
Mashreq cities have long under-invested in public<br />
transportation in part due to the availability of cheap fuel,<br />
which was subsidized by the government. The cost of diesel<br />
fuel per litre in 2008 was USD 0.20 in Egypt, USD 0.53 in<br />
Syria, USD 0.61 in Jordan, USD 0.76 in Lebanon and USD<br />
1.25 in the OPT, compared to a world average of USD 1.03.<br />
Similarly, the cost of gasoline was also far below the world<br />
average in most Mashreq countries, except for the OPT. 128<br />
Private motorcars dominate the registration of motor<br />
vehicles in most countries, with the exception of Iraq.<br />
Public transportation is limited in most cities while private<br />
minibuses and shared taxis along designated routes are the<br />
most common form of transportation.<br />
Damascus, like other Syrian cities, relies on privately-run<br />
minibuses with 100 lines currently operational. Two public<br />
transport companies that operate minibuses and buses in Beirut<br />
account for around 90 per cent of all buses and minibuses in<br />
the country. 130 In Karak, Jordan, the predominant form of<br />
public transport is unregulated minibuses. 131<br />
59
60<br />
FIGURE 16: PERCENTAGE OF REGISTERED MOTOR VEHICLES BY CATEGORY 129<br />
Egypt (2008)<br />
Jordan (2007)<br />
Iraq (2006)<br />
Syria (2007)<br />
Palestine (2008)<br />
0% 10% 20% 30% 40% 50% 60% 70% 80% 90% 100%<br />
Motorcars Minibuses/vans Trucks Motorized 2-3-wheelers Buses Other<br />
In Cairo, a series of surveys from 1971 to 2001 on the<br />
mode share of motorized trips found that the use of shared<br />
taxis rose from 0 to 37 per cent, of cars and taxis from 14 to<br />
23 per cent, while use of buses and minivans fell from 70 to<br />
22 per cent while the tram, which used to carry 16 per cent<br />
of motorized trips, was decommissioned. 132 Across Egypt, rail<br />
and metro serve 8 per cent of riders, buses 26 per cent, taxis<br />
41 per cent and private cars 26 per cent. 133<br />
In Amman, 16 per cent of passengers use 500 public<br />
buses, 20 per cent use the 12,000 taxis and white cabs and<br />
64 per cent use private cars. 134 As these figures demonstrate,<br />
ridership preferences have shifted away from buses and<br />
minivans towards passenger cars and public transit fails to<br />
capture a significant share of riders in most cities. Baghdad<br />
has one million public transport vehicles, 750,000 of which<br />
are taxis, and there are nearly two buses and five minibuses<br />
per hundred people. 135<br />
Cairo’s subway system, launched in 1987, was the first in<br />
the <strong>Arab</strong> world and remains the only fully-fledged metro<br />
system in Africa. Currently, the two operational lines carry<br />
on average 2 million passengers per day (17 per cent of the<br />
city’s passenger trips). Two additional lines are to be built:<br />
one 33 km line will link the northwest to the northeast<br />
sections of Greater Cairo, as well as the Cairo International<br />
Airport, and will be fully operational by 2019; another line<br />
will connect Greater Cairo from west to east and will become<br />
fully operational by 2020.<br />
The economic loss caused by congestion and delays is<br />
estimated to be USD 1.2 billion/year in Amman and USD 85<br />
million in Damascus and the rising cost of fuel is prompting<br />
a number of cities to develop new public transportation<br />
systems. In Syria, the government announced in 2008 that<br />
it will develop a metro network in Damascus, with the first<br />
line opening in 2015, and all four planned routes open by<br />
2050. Amman is planning three new light rail lines for the<br />
downtown area, part of which will be underground, as well as<br />
a link to nearby Zarqa, the country’s industrial city.<br />
The city is also developing a new bus rapid transit system<br />
scheduled to open in 2011 with three lines operating on a<br />
combined length of 32 km. The system will cost an estimated<br />
USD 170 million and operate on dedicated lanes.<br />
Road Safety<br />
Ninety per cent of road traffic fatalities take place in low-<br />
and middle-income countries which, together, account for<br />
only 48 per cent of all registered vehicles. The World Health<br />
Organization predicts that such fatalities will be the fifth<br />
leading cause of deaths worldwide by 2030. It is already the<br />
main cause of death among 15 to 29 years-old and second<br />
leading cause of death among those aged 5 to 14. 136<br />
Mashreq roads are among the most dangerous in the<br />
world, with over 23,000 fatalities in 2007, and over 200,000<br />
injuries. Egypt has the second highest rate of annual road<br />
fatalities in the world (behind Eritrea) at 41.6 deaths per<br />
100,000 people, followed by Iraq (38.1), Jordan (34.2), Syria<br />
(32.9), Lebanon (28.5) and the OPT (4.9), compared with<br />
the world average of 20.8 fatalities per 100,000 and 10.3<br />
among high-income countries.<br />
Around 70 to 83 per cent of the victims were male in each<br />
country; in Egypt and Jordan, estimates indicate that 20<br />
to 40 per cent of the victims are pedestrians. 137 The rate of<br />
fatalities in the region is increasing (Jordan witnessed a 50 per<br />
cent increase from 1989 to 2007 while Syria’s rate went up by<br />
the same amount from 2001 to 2007), except for Iraq, where<br />
it has declined from 20 in 1980 to 7.5 in 2005. The <strong>Arab</strong><br />
Mashreq Road Safety Partnership has worked to increase<br />
regional collaboration on identifying best practices in road<br />
safety and achieving selected targets by 2015, including the<br />
reduction of road fatalities by 30 per cent.
2.5<br />
Urban Environmental Challenges<br />
<br />
Egyptians fetching water. Water scarcity has already become a part of daily life for Egyptians. ©Amr Emam/IRIN<br />
The Challenge of Water Scarcity<br />
Primarily arid, the sub-region’s greatest environmental<br />
challenge is water scarcity. Mashreq countries have a<br />
total of around 80 million cubic meters of renewable<br />
water supply (2008 data) but use 88 million cubic meters<br />
annually (data from various years 2000-07).<br />
Egypt, Jordan and Syria are using their water at unsustainable<br />
rates, leaving little to no room for population growth –<br />
currently 0.7 to 2.7 per cent per year in the region. 138 At<br />
the same time, rapid urbanization and rising quality of life<br />
standards are leading to a greater demand for water.<br />
In Amman, government-distributed tap water is limited to a<br />
few hours one day a week; private trucks distribute well water<br />
to households but the depletion of local water resources forces<br />
trucks to queue four to five hours to fill their tanks. While<br />
the old city of Karak receives a continuous supply of water,<br />
the water authority rations water to the surrounding suburbs,<br />
where an estimated 68 per cent have only intermittent<br />
supply. 139 The growing scarcity of water is leading to greater<br />
competition between sectors and between countries and<br />
could become a major cause of future conflict.<br />
61
62<br />
FIGURE 17: SHARE OF WATER AVAILABLE BY SOURCE<br />
per cent<br />
Major reforms in the water sector, including water rationing<br />
and tariff structures, are needed but politically difficult<br />
to implement. More than half of all arable land in Jordan,<br />
Lebanon and Syria relies on rain-fed agriculture, which is<br />
increasingly susceptible to the impact of climate change. 140<br />
In Jordan, agriculture consumes 70 per cent of the water<br />
resources and contributes 3 per cent to the GDP. As countries<br />
urbanize, changing demographics will alter the political<br />
interests behind different water rights. To meet demands,<br />
these countries are increasingly importing “virtual water”, i.e.<br />
food and other products that have been produced with water<br />
in other countries.<br />
Iraq is also facing a serious water shortage problem:<br />
water control structures, including dams and diversion<br />
schemes in neighbouring countries such as Turkey and<br />
Iran, have exacerbated the seasonal natural occurrence of<br />
drought conditions, inflicting harm on Iraq’s economy<br />
FIGURE 18: AVAILABLE AND WITHDRAWN WATER RESOURCES<br />
Water Available per Capita (m3/yr)<br />
100<br />
80<br />
60<br />
40<br />
20<br />
0<br />
Source: World Bank, Making the Most of Scarcity, 2007<br />
3,000<br />
2,500<br />
2,000<br />
1,500<br />
1,000<br />
500<br />
0<br />
Lebanon<br />
Morocco<br />
Tunisia<br />
Algeria<br />
Source: FAO Aquastat 2008<br />
Egypt<br />
Syria<br />
Jordan<br />
Libya<br />
West Bank and Gaza<br />
virtual water non-renewable ground water<br />
external renewable internal renewable<br />
and environment and forcing the Iraqi Ministry of Water<br />
Resources in 2010 to declare that it may not be able to meet<br />
the water requirements for the summer season of that year.<br />
Since Iraq is the most downstream country on both the<br />
Tigris and Euphrates rivers, it is extremely difficult to manage<br />
and allocate its water resources in the absence of any binding<br />
international water-sharing agreements. Rather, the current<br />
state of water management practices in Iraq and neighbouring<br />
countries limits the resource available to meet the critical<br />
needs of the rural economy and urban living. 141<br />
Adapting to Climate Change<br />
Models predict that by 2050 the Mashreq countries will be<br />
2.5 to 3.7ºC hotter in the summer and 2.0 to 3.1ºC hotter in<br />
the winter. 142 Changing temperatures will alter precipitation<br />
patterns, with declines in wet season precipitation slightly<br />
outweighing small precipitation increases in the dry season.<br />
Rainfall will become more erratic. Warmer temperatures and<br />
lower rainfall will reduce aquifer recharge and river flow rates.<br />
A rise of 0.1 to 0.3 metres in sea level is also predicted by<br />
2050, which will increase salt water intrusion into important<br />
coastal aquifers, including in Gaza.<br />
A 2002 study predicted that the combined impacts of<br />
increased demand, water resource declines, flood and water<br />
quality damage, hydropower losses and ecosystems damage<br />
will cost Jordan 1 to 2 per cent of its GDP, Lebanon 2 to 5<br />
per cent, the OPT 2 to 5 per cent and Syria 4 to 7 per cent. 143<br />
Climate change therefore has the potential to destabilize<br />
the region, increasing competition for scarce resources,<br />
intensifying food security concerns, deepening poverty<br />
and social instability through reductions in economic<br />
growth, catalyzing environmental migration and increasing<br />
militarization over natural resources which may pose a<br />
challenge to existing peace agreements. 144 More energy will<br />
be required to pump water from greater depths, to treat and<br />
reuse wastewater and to desalinate saltwater, even as Jordan,<br />
Lebanon, the OPT and Syria reach the limits of existing<br />
energy resources.<br />
Renewable Water Resources (2008)<br />
Total Water Withdrawn (2002 or 2007)<br />
Egypt Iraq Jordan Lebanon Palestine Syria<br />
water scarcity<br />
absolute scarcity
The growing cost of energy will also affect the cost and<br />
allocation of water. While the amount of water consumed to<br />
produce energy is not known for the Mashreq, in the United<br />
States, 40 per cent of total freshwater water consumption is<br />
used to produce energy, and around 5 per cent of total energy<br />
consumption is used to provide water.<br />
As demand for both water and energy increase and supplies<br />
diminish, the costs of both will escalate with the severest<br />
impact on the poor. Adapting to climate change hinges<br />
on the management of water resources – improving water<br />
conservation, a more optimal allocation of water use rights,<br />
reducing fossil fuel energy reliance, investing in renewable<br />
energy and strengthening international cooperation for water<br />
resource sharing.<br />
Water Security<br />
Despite a near doubling of the urban population since<br />
1990, access to improved water and sanitation in the cities<br />
of the Mashreq countries continues to be almost universal,<br />
with most households having direct access to piped water and<br />
water-based sanitation. While the share of urban residents<br />
in Syria and the OPT with access to improved water has<br />
decreased slightly, the absolute number of people with access<br />
is growing. However, inequitable allocation of water resources,<br />
access that favours Israelis and water quality that does not<br />
meet WHO standards continue to be major challenges for<br />
Palestinian communities.<br />
For countries where data is available, per capita water<br />
consumption has decreased from 2002 to 2007. Given the<br />
scarcity of water in the region, further improvements are<br />
needed to increase the efficiency of water use for domestic<br />
consumption, such as through reductions in water losses,<br />
water use efficiency improvements, and the reuse of<br />
wastewater. For instance, one study found that retrofitting 8<br />
per cent of the 360,000 domestic customers in Amman with<br />
a more efficient kitchen faucet could reduce residential water<br />
consumption by 12 per cent each year.<br />
Water tariffs in the Middle East are low compared to other<br />
countries, but raising tariffs – one effective strategy to promote<br />
voluntary improvements in water efficiency and conservation<br />
- is politically difficult.<br />
Non-revenue water, or water loss due to leaks in the<br />
distribution network and illegal water taps, ranges from<br />
35 to 50 per cent, compared to 7 to 20 per cent in Europe<br />
and the United States. Due to the low water tariffs and<br />
limited government subsidies, water utilities do not have<br />
the resources to repair and renovate aging pipe networks.<br />
Reducing leakages, which also introduce new contaminants<br />
to the distribution system, is often more cost-effective than<br />
developing new water supplies.<br />
Domestic and industrial water use account for 10 to 50<br />
per cent of total national water consumption in Mashreq<br />
countries, making treated wastewater a major potential<br />
resource. Wastewater treatment in the region varies widely,<br />
from less than 5 per cent of domestic wastewater in Lebanon,<br />
to 50 per cent in Jordan, and 80 per cent in Egypt. About<br />
50 per cent of treated wastewater in Lebanon, 80 per cent<br />
in Jordan, and 100 per cent in Syria and Egypt is used to<br />
irrigate landscaped areas, fodder crops and even edible crops.<br />
Increasing wastewater treatment for agricultural purposes can<br />
further reduce demands for freshwater. In 2009, the Ministry<br />
of Housing and Construction of Syria announced a plan to<br />
build 180 new sewage treatment plants nationwide. 145<br />
Food Security<br />
The <strong>Arab</strong> region is the largest net importer of food of all<br />
regions in the world and therefore vulnerable to variations in<br />
world food prices. More than half of all arable land in Jordan,<br />
Lebanon and Syria relies on rain-fed agriculture and experts<br />
estimate that future agricultural productivity may decline by<br />
as much as 10 per cent.<br />
At the same time, the region’s demand for food is growing<br />
rapidly: the population is growing at 1.7 per cent, compared<br />
to 1.1 per cent worldwide; purchasing power is growing at 3.4<br />
per cent, compared to 3 per cent worldwide and the urban<br />
population grew by 3 per cent from 1990 to 2006, compared<br />
with 2.2 per cent worldwide. 146 Given the state of conflict<br />
in the Occupied Palestinian Territories, a 2009 WHO report<br />
estimated that 56 per cent of the population living in Gaza<br />
and 25 per cent of those in the West Bank were food insecure,<br />
and that chronic malnutrition in Gaza had risen to 10 per<br />
cent. 147<br />
In 1990, Iraq instituted food rationing under the UN<br />
FAO Oil for Food programme. By 2005, two-thirds of the<br />
population was dependent on food baskets. 148 The government<br />
has essentially ended this system, but rations continue to be<br />
TABLE 17: 2005 TARIFFS ON DOMESTIC WATER AND WASTEWATER (USD/M 3 ) AND WATER LOSS RATE FOR SELECTED CITIES<br />
Cairo Alexandria Amman* Beirut Damascus Ramallah<br />
Water Tariff USD 0.87 USD 0.14 USD 0.25 USD 0.07 USD 1.04<br />
Wastewater Tariff USD 0.04 USD 0.01 USD 0.27<br />
Water Loss Rate 50% 50% 42% 40% 45% (Syria) 35% (OPT)<br />
Sources: Global Water Intelligence, 2005 Water Tariffs Survey (2010 available, for fee); World Bank, Making the Most of Scarcity, 2007 unless noted otherwise.<br />
* Water Uses and Demands, Jordan National Water Master Plan Series, June 2004, page 11<br />
63
64<br />
BOX 10: JORDAN – ADDRESSING URBAN WATER SHORTAGES<br />
<br />
Delivering water in Jordan. ©High Contrast. Licensed under the Creative Commons Attribution 3.0 Germany license.<br />
Jordan’s water scarcity has reached critical<br />
levels with a 2010 demand of 1,564 million m 3<br />
against a supply of only 1,150 million m 3 . With<br />
current population growth, the annual amount<br />
of water available per capita is expected to fall<br />
from 140 m 3 in 2006 to less than 120 m 3 in<br />
2012 - far below the internationally recognized<br />
water scarcity threshold of 500 m 3 .<br />
Jordan’s water stress is well illustrated by<br />
Greater Amman, the capital, which has grown<br />
dramatically from a population of around 2,000<br />
in the 1920s to more than 2 million today.<br />
Greater Amman’s water supply has been<br />
rationed since 1987, with households receiving<br />
water one or two days a week for various<br />
durations. Despite efforts by the Ministry<br />
of Water and Irrigation (MWI) to improve<br />
services, people are still suffering from lack of<br />
water supply.<br />
But Jordan’s water scarcity is not just a<br />
supply problem. The Kingdom needs to improve<br />
its water management strategy. Non-revenue<br />
water is more than 40 per cent of the supplied<br />
water. In addition, groundwater is overpumped<br />
from most of the aquifers in the country.<br />
Moreover, it is estimated that between 65<br />
and 75 per cent of the nation’s water is used<br />
for irrigation. Agriculture only contributes 3.6<br />
per cent to the GDP and therefore provides low<br />
economic water value compared to urban uses.<br />
Measures should be taken to minimize<br />
crops with a large water footprint that could<br />
easily be imported, while hydroponic farming<br />
should also be encouraged to save water.<br />
A major problem in this regard is the lack of<br />
coordination between MWI and the Ministry of<br />
Agriculture. But irrigated agriculture supports<br />
Jordan’s food security and small farmers, so<br />
policymakers continue to examine measures<br />
to produce ’more crop per drop’ in irrigated<br />
agriculture and to meet growing urban food<br />
and water demands.<br />
Whereas more than 95 per cent of the<br />
Jordanian population is served by public piped<br />
water, the unreliable and discontinuous supply<br />
has increased demand for expensive tanker<br />
water that puts pressure on household bills.<br />
In general, the subsidized but interrupted<br />
domestic piped water prices are affordable for<br />
the Jordanian poor but tanked water is 8-10<br />
times the cost of piped water, while bottled<br />
water (used solely for drinking) is more than<br />
100 times as expensive.<br />
The Jordanian Ministry of Water and<br />
Irrigation is attempting to address the<br />
problems through:<br />
<br />
more reliable urban water delivery;<br />
<br />
and operating water and wastewater<br />
facilities;<br />
<br />
monitoring, pollution control and human and<br />
technical capacity building;<br />
<br />
progressive pricing mechanisms to promote<br />
conservation;<br />
<br />
wastewater for irrigation; and<br />
<br />
water conservation.<br />
In addition, the government is now<br />
constructing a 325 km pipeline from the<br />
Disi Aquifer to Amman that could convey<br />
100 million m 3 annually and supply Greater<br />
Amman for the next 50 years. The total cost<br />
of the project is around USD 1 billion and it is<br />
expected to be completed in 2013. However,<br />
the controversy over radiation levels in the Disi<br />
water should be further examined and resolved<br />
to ensure the safety of that water.<br />
The concept of water as a human right and<br />
the criteria stipulated by the United Nations<br />
General Assembly in 2003 should be better<br />
promoted through awareness campaigns,<br />
especially within the international community.<br />
The integration of the water rights concept<br />
could have a positive steering role for Jordan’s<br />
policymaking and consumption behaviour.<br />
Regional cooperation can also be helpful<br />
to solving Jordan’s chronic water shortages.<br />
A comprehensive regional assessment of the<br />
socio-economic dimensions of the right to<br />
water should be conducted and a portfolio<br />
of interventions developed to monitor and<br />
support internationally endorsed water<br />
rights concepts. But regional cooperation<br />
is constrained by the complexity of social,<br />
economic and environmental aspects of water<br />
resource management in a region whose<br />
hydro-politics are far more conducive to<br />
conflict than cooperation.<br />
Sources: Ministry of Water and Irrigation in Jordan, 2011, the Web site. Saqqar, M., Reform of the Water Sector in Jordan, 2011, (in <strong>Arab</strong>ic under publication), Wardam, B., More<br />
politics than water: Water rights in Jordan, IUCN Regional Water Programme in West Asia and North Africa, Jordan; Jordan: 300,000 year old Disi aquifer to quench water shortage,<br />
Wordpress, 05/12/2010, Ramı´reza, O. et al, Efficient water conservation in agriculture for growing urban water demands in Jordan, IWA Publishing 2010.
TABLE 18: PROPORTION OF POOR IN URBAN AND RURAL AREAS<br />
provided for six million Iraqis, with a total of USD 3 billion<br />
spent on rations in 2010. Having exploited 75 per cent of<br />
their renewable water resources, <strong>Arab</strong> countries will not be<br />
able to increase their agricultural production significantly.<br />
Recycled water will not be able to account for more than 20-<br />
25 per cent of total water sources for agriculture.<br />
The dependency on food imports poses a potential threat<br />
to the sub-region’s stability as the most at risk to food<br />
price increases are the urban poor. Jordan and Lebanon<br />
are particularly vulnerable, as they are dependent on cereal<br />
imports. In early 2008, due to the fiscal deficit, Jordan<br />
removed almost all fuel subsidies, causing prices to rise 76 per<br />
cent overnight and the price of basic foods to double or more.<br />
The subsequent world financial crisis, declining oil prices and<br />
the depreciation of the U.S. dollar mitigated the food crisis,<br />
although prices are still above pre-2008 levels.<br />
Governmental responses to rising food prices have been to<br />
increase both the wages of government staff and food subsidies<br />
which now account for 2.1 per cent of GDP in Syria, 1.8<br />
per cent in Jordan, 1.3 per cent in Egypt and 0.03 per cent<br />
in Lebanon. These tend to be imprecise, while inflationary<br />
measures often fail to target the poor and cannot be retracted<br />
when food prices drop. In Egypt, the social assistance program<br />
has a leakage rate of 48 to 60 per cent to the non-poor and<br />
Jordan’s National Aid Fund supports fewer than 20 per cent<br />
Egypt Jordan Syria OPT<br />
% of urban who are poor 10% 12% 8% 21%<br />
% of rural who are poor 27% 19% 15% 55%<br />
% of poor in urban areas 22% 71% 38% 33%<br />
Source: World Bank, Food Security, 2009<br />
of the eligible population, while only 14 per cent of those<br />
who actually received aid were eligible.<br />
To increase domestic productivity, all Mashreq countries<br />
need to increase investment in agricultural research and<br />
development (R&D). Jordan invests 1.2 per cent of<br />
agricultural GDP on R&D, Lebanon and Syria 0.4 per<br />
cent each, and Egypt 0.5 per cent, far below the 2 per<br />
cent recommended to maintain agricultural productivity.<br />
Reducing water and energy subsidies for farmers also increases<br />
efficiency investments and the voluntary switching from lowvalue,<br />
high water-consumption crops to higher-value crops.<br />
Energy Security and Air Pollution<br />
Access to electricity is nearly universal in the Mashreq<br />
countries – 99 per cent in Jordan, Lebanon, and the OPT,<br />
98 per cent in Egypt, and 90 per cent in Syria 149 – and, in<br />
tandem with rapid economic growth, peak energy demand has<br />
increased by 135 per cent from 1990 to 2007. 150 According to<br />
the International Energy Agency, energy demand across the<br />
Middle East is increasing at 3.2 per cent each year, meaning a<br />
quadrupling of future energy demand from 2006 to 2030. 151<br />
Generating capacity has not kept up with demand, and<br />
Syria and Lebanon have had significant load interruptions.<br />
Iraq faces similar issues, as in 2010 only 8,000 megawatts<br />
<br />
Gaza City, Occupied Palestinian Territories. A Palestinian fisherman mends his nets on Gaza City's beach. Israeli restrictions have severely impacted Gaza's fishing industry.<br />
©Ryan Rodrick Beiler/Shutterstock<br />
65
66<br />
of electricity were produced to meet 13,500 megawatts of<br />
demand. Many households and neighbourhoods receive fewer<br />
than 18 hours of power per day, and are running expensive<br />
diesel generators to meet their power needs, contributing to<br />
significant local noise and air pollution. Many private sector<br />
businesses have had to invest in generators as well, cutting<br />
down on the potential for urban job growth. 152 All countries<br />
will need to significantly develop new generation capacity to<br />
keep up with demand.<br />
Mashreq countries are highly dependent on fossil fuels.<br />
With the rise in oil prices, they have been shifting to natural<br />
gas whose share of power generation rose from 24 per cent in<br />
1990 to 51 per cent in 2007.<br />
Due to the prevalence of oil in the Middle East, investment<br />
in renewable energy has lagged far behind other regions of<br />
the world. Recently, however, a number of countries have<br />
created renewable energy policies, incentives and targets.<br />
By 2020, Egypt aims to provide 20 per cent of its energy<br />
through such renewable sources as solar and wind, Lebanon<br />
12 per cent, Jordan 10 per cent and Syria five per cent.<br />
The potential of utility-scale solar and wind power<br />
generation is very high in Egypt and, to a lesser extent,<br />
Jordan. 153 The integration of energy networks for electricity<br />
and natural gas will require significant institutional and<br />
technical resources.<br />
With their arid climates and infrequent precipitation, the<br />
Mashreq countries are susceptible to natural air pollution<br />
<br />
Pollution in the River Nile. ©Mark Henley/Panos Pictures<br />
due to airborne dust. The situation is compounded by<br />
significant anthropogenic air pollution from an ageing motor<br />
vehicle stock, reliance on high sulphur diesel fuel, poor traffic<br />
management resulting in excessive idling, industrial emissions<br />
and inefficient domestic diesel heaters (which account for up<br />
to 33 per cent of Syria’s diesel consumption). 154<br />
In Greater Cairo, industrial areas are a major source of<br />
sulphur dioxide, PM10 and lead as 17 per cent of private<br />
cars and 32 per cent of taxis are over 25 years old. 155 In 2009,<br />
Egypt’s Ministry of Finance announced a project to abolish<br />
the 34,000 taxis older than 30 years and replace them with<br />
new vehicles.<br />
Although the sub-region’s air quality continues to be<br />
the worst in the world, after South Asia, improvements in<br />
vehicle efficiency and public transport have helped to reduce<br />
particulate matter of 10 micrograms or less (PM10) in all<br />
countries. Three per cent of the world’s compressed natural<br />
gas (CNG) vehicles can be found in Greater Cairo, where<br />
there are 65,000 CNG vehicles, 75 per cent of which are<br />
taxis, and 93 CNG fuelling stations. 156 There are drastic<br />
local variations in air quality figures. In Syria, where daily<br />
concentrations of PM10 vary between 115 and 600 mg/<br />
m 3 (micrograms per cubic meter), concentrations of PM10<br />
reached 1,290 in Damascus, a city known for narrow streets<br />
and high congestion. 157 Improving air quality to reach the<br />
WHO standard of 20 micrograms of PM10 per cubic meter<br />
will require a major effort. 158
Solid Waste Management<br />
By 2001, solid waste collection in major cities in Egypt,<br />
Jordan, Lebanon and Syria had reached 80 to 100 per cent.<br />
Due to rising incomes and urbanization, the generation of<br />
municipal solid waste is projected to increase by 2.5 to 7<br />
per cent per year. As a result of widespread scavenging, the<br />
majority of waste is organic, mostly disposed of in open<br />
dumps.<br />
Improper waste management and resulting environmental<br />
damage and foregone economic opportunities are estimated<br />
to equal 0.2 per cent of GDP in Egypt, and 0.1 per cent in<br />
Lebanon and Syria. Due to the conflict, Iraq’s solid waste<br />
management system is overwhelmed by the volume of<br />
rubble in addition to traditional waste streams, particularly<br />
since disposal sites are often inaccessible and public landfills<br />
absent. An estimated 50 per cent of urban households bury<br />
their waste or dump it in open sites. 159<br />
Each country manages solid waste differently. In Lebanon,<br />
the Council of Development and Reconstruction collects<br />
and treats waste on behalf of the municipalities, while it is<br />
the responsibility of municipalities in Jordan, Syria and the<br />
Occupied Palestinian Territories (OPT). Although municipal<br />
governments manage solid waste in Egypt, collection is often<br />
outsourced to private concessions. In the OPT, residents<br />
often organize privatized services for their communities. 160<br />
In 2008, the World Bank signed its first greenhouse gas<br />
emission reduction purchase agreement in Egypt for a<br />
solid waste-composting project. The Cairo Southern Zone<br />
Composting Project will receive 1,100 tons of municipal<br />
waste each day and sort it for recyclable materials and aerobic<br />
composting of organic waste. In turn, the World Bank<br />
will purchase 325,480 tons of carbon dioxide equivalent<br />
greenhouse gas emissions reductions over 10 years on behalf<br />
FIGURE 19: PARTICULATE MATTER (PM10) AS A WEIGHTED AVERAGE OF THE URBAN POPULATION<br />
Micrograms per m3 of PM10<br />
180<br />
160<br />
140<br />
120<br />
100<br />
80<br />
60<br />
40<br />
20<br />
0<br />
Egypt, <strong>Arab</strong> Rep.<br />
Syrian <strong>Arab</strong> Republic<br />
Source: World Bank WDI<br />
MENA (dev.)<br />
Libya<br />
India<br />
Algeria<br />
China<br />
Jordan<br />
of the Carbon Fund for Europe. The compost will be sold to<br />
farmers. Projects such as these have tremendous potential for<br />
replication in other cities.<br />
Urban Liveability and Quality of Life<br />
Environmental factors that affect a city’s overall liveability<br />
and quality of life include noise pollution, access to green<br />
space and public safety. Noise pollution is high in the larger<br />
Mashreq cities. In Damascus and Aleppo, most areas have<br />
an average noise level of 70 to 80 decibels-A (dB (A)), well<br />
above the maximum residential standard of 55 dB (A). 161<br />
In Amman, a study of 28 locations showed that maximum<br />
morning and evening rush hour noise levels were 81 and 71<br />
dB (A) respectively. 162 In Cairo, a 2007 study by the Egyptian<br />
National Research Center found that noise levels average 90<br />
dB (A) and never dropped below 70 dB (A). According to<br />
the WHO, exposure to loud noise for eight hours a day has<br />
the same effect on an individual’s health as exposure to high<br />
stress. 163<br />
Useable open space in cities, including plazas, squares, parks<br />
and greenways, create pockets of reprieve from dense urban<br />
developments, allow children a place to play and provide space<br />
for community gatherings and cultural events. Given the<br />
density of cities in Mashreq, rapid urbanization and limited<br />
water resources, available per capita open space in the region<br />
is not only limited but also often concentrated in city centres<br />
and wealthier neighbourhoods, creating unequal access.<br />
There are significant opportunities, however, to transform<br />
vacant and underutilized lots into public space. In Beirut,<br />
the government purchased 114 plots of land to create 33 new<br />
gardens and enlarge 23 existing parks. The city intends to<br />
construct off-street parking underneath, solving two problems<br />
at once. 164<br />
World<br />
Tunisia<br />
Lebanon<br />
Eur & Central Asia (dev.)<br />
1996<br />
2006<br />
Morocco<br />
United States<br />
67
68<br />
2.6<br />
National Urban Policy<br />
Urban Governance Systems<br />
<br />
Reconstruction work in front of the bomb-scarred former Holiday Inn in Beirut, Lebanon. ©Joel Carillet/iStockPhoto<br />
In the Mashreq, national ministries are responsible for the<br />
planning and implementation of sectoral development<br />
projects. The rapid growth of cities, the emergence of<br />
urban corridors, and serious environmental challenges, have<br />
led to a renewed focus on national and regional strategic plans<br />
and spatial frameworks. In parallel with this effort, several<br />
countries are strengthening national-local collaboration<br />
on planning and development, creating sub-national/<br />
governorate-level planning agencies and empowering local<br />
administrations to draft and implement their own plans.<br />
In Egypt, the Ministry of Planning formulates economic<br />
development strategies and, since 1976, the General<br />
Organization for Physical Planning (GOPP), under the<br />
Ministry of Housing, Utilities and Urban Development<br />
has prepared regional development plans that provide the<br />
framework for the governorate and city level plans and projects.<br />
GOPP also prepares the greater Cairo regional structure plan<br />
and develops key projects. The recently-instituted Informal<br />
Settlement Development Facility provides funding and<br />
technical assistance to local authorities implementing urban<br />
improvement projects.<br />
Lack of coordination among plans and projects in the different<br />
regions led to the elaboration of a national development<br />
strategy to accelerate the spread of urbanization onto desert<br />
land along specific development corridors to the east and west<br />
of the Nile Valley and along Egypt’s Mediterranean and Red<br />
Sea coasts including the Sinai Peninsula.<br />
In Lebanon, the Council for Development and<br />
Reconstruction (CDR), established in 1977 to plan for the<br />
rehabilitation of the country after the civil war, prepares<br />
master plans and finances projects. CDR has absorbed the<br />
responsibilities for the planning and management of major<br />
projects in Beirut and other cities. A relatively independent<br />
organization that reports directly to the Council of Ministers,<br />
CDR prepared Lebanon’s first national physical plan in 2005<br />
(Master Plan of the Lebanese Territory). It is in charge of<br />
coordinating activities with municipal governments and<br />
other ministries, such as the Ministry of Public Works and<br />
Transport.<br />
In Jordan, the Ministry of Municipal Affairs (MOMA) is<br />
responsible for overseeing the activities of municipalities and<br />
joint service councils, the Higher Planning Council and the<br />
<strong>Cities</strong> and Villages Development Bank. In 2006, MOMA<br />
developed the country’s first national land use master plan<br />
and proceeded to develop comprehensive master plans for<br />
eight major municipalities. This was a much-needed step to<br />
arrive at a more balanced urban structure since development<br />
had historically been concentrated in the Amman region. In<br />
general, zoning is the main tool to regulate urban development<br />
in Jordan. 165<br />
In Syria, the Higher Commission for Regional Planning,<br />
established in 2010 under the prime minister, is charged<br />
with the formulation of a national framework for an<br />
integrated multi-sectoral development strategy and its<br />
spatial configuration. This framework will shape the regional<br />
structure plans that the Commission will develop. These plans<br />
will provide the context for governorates and cities to prepare<br />
their own master plans.
In Iraq, there is no national urban policy but the country’s<br />
National Development Plan for 2010-2014 outlined the<br />
importance of spatial policy, providing recommendations<br />
and next steps for what is to ultimately be a unified urban<br />
policy. In the meantime, and in the absence of local planning<br />
capacity, Iraq relies on external consultants to prepare the<br />
Master Plans for most governorates and key cities. 166<br />
Decentralization and Local Government<br />
Systems<br />
After years of nation building and the consolidation of<br />
power in central governments, all Mashreq countries have<br />
since the early 1980s committed to decentralize authority and<br />
empower local bodies. However, central governments retained<br />
their authority through the control of financial resources.<br />
Most local governments may not borrow funds and most<br />
cannot set tax levels or collect certain taxes. 167 Public services<br />
that are usually performed by local governments are delivered<br />
by line ministries, either directly or through de-concentrated<br />
local offices at the governorate level.<br />
In Egypt, there are four sub-national tiers of government,<br />
including 26 governorates (the main provider of public<br />
services), 166 counties (markaz), 200 cities and over 4,300<br />
villages. 168 All the heads of these jurisdictions are appointed.<br />
The governorate and district levels have executive councils<br />
composed of line ministry officials appointed by the central<br />
government and elected popular councils, whose limited<br />
powers were broadened by law 119 introduced in 2009 to<br />
encourage community participation and support greater<br />
autonomy in finance by local governments with continued<br />
central control over major planning decisions and development<br />
projects.<br />
Iraq has 18 governorates, including three in the semiautonomous<br />
Kurdish region. There are 251 municipalities,<br />
each of which has an elected council that is chaired by an<br />
executive officer appointed by the central government. In<br />
effect, municipalities have limited executive power, and are<br />
managed and directed by the Ministry of Municipalities and<br />
Public Works. 169<br />
Jordan has 12 governorates, whose governors are appointed<br />
by the Cabinet. The governorates are divided into districts and<br />
sub-districts. Below the governorates, municipalities are led<br />
by elected councils composed of a mayor and between six and<br />
11 members. The sole exception is the mayor of Amman who<br />
is appointed by the king.<br />
There are 382 village councils, appointed by the Ministry<br />
of Municipal and Rural Affairs and the Environment. The<br />
governorates are responsible for regional planning and the<br />
delivery of services, in coordination with line ministries.<br />
Municipalities conduct master planning, maintain streets,<br />
collect solid waste, issue construction permits, build and<br />
maintain public facilities and set local fees and taxes.<br />
Responsibility for fire protection, primary education, water<br />
supply, gas, electricity, disaster prevention and public assistance<br />
are legally under the municipalities but are implemented by<br />
national authorities. In addition, the central government<br />
has created 41 public enterprises, which have financial and<br />
administrative autonomy to undertake special tasks.<br />
Lebanon is divided into eight governorates. Historically, it<br />
has a strong tradition of local governance and decentralization<br />
that was gradually constrained in the 1960s and 1970s by<br />
laws that granted the central government power over local<br />
authorities, including the right to dissolve them. During<br />
the Civil War and the invasion by Israel, municipalities lost<br />
their autonomy, as well as the human and financial resources<br />
needed to provide services.<br />
The national government has again started to devolve<br />
power to local governments. Decree 118 (1997) stated that<br />
“every work having a public character or utility within the<br />
area of a municipality falls under the jurisdiction of the<br />
Municipal Council.” However, a lack of clarity on the<br />
delegation of responsibilities and inadequate local funds<br />
prevent municipalities from discharging their full mandate<br />
and national ministries continue to provide health, education,<br />
public works, energy, water supply and social services. 170<br />
Local governance in the OPT is particularly strong. Since<br />
the Palestinian National Authority (PNA) was established<br />
in 1994, it has taken steps to strengthen decentralized<br />
governance. There are 119 municipal councils and 251 village<br />
councils. According to the 1997 Law on Local Government,<br />
these elected councils are responsible for town planning,<br />
issuance of construction permits, and providing water and<br />
power.<br />
East Jerusalem remains under the jurisdiction of Jerusalem<br />
Municipality while the West Bank is classified into three<br />
categories (A-C) of governance based on the Oslo Accords.<br />
In Area A, which comprises the West Bank’s major urban<br />
areas and equals 17.7 per cent of the land area, the PNA<br />
has control of civilian and security issues. In Area B, which<br />
comprises most Palestinian rural communities and equals<br />
18.3 per cent of land area, the PNA controls civilian affairs<br />
while Israel controls security. In Area C, the remainder of the<br />
West Bank, Israel retains both civilian and security authority;<br />
almost all Israeli settlements have been built in Area C, where<br />
no Palestinian building permits have been granted. 171<br />
The weakening of the PNA following the split between<br />
Fatah and Hamas has undermined the provision of basic<br />
services. To date, political decentralization has progressed<br />
further in municipalities than villages, where land is often<br />
confiscated by the Israeli occupying forces. 172<br />
Local elections were held for the first time in 30 years in<br />
2004, although they have yet to be repeated. However, there is<br />
widespread support for political decentralisation and strategies<br />
to practically implement this are under development, as well<br />
as to restructure the four administrative levels of region,<br />
province, district and municipality into a two-tier system of<br />
regions (muhafaza) and municipalities (nahiya) 173 .<br />
Syria is divided into 14 provinces headed by governors<br />
appointed by the Ministry of Interior and reporting to the<br />
president; 60 districts (manatiq), 14 counties, (sub-districts)<br />
and 6,432 towns/villages. Districts and sub-districts are led<br />
69
70<br />
BOX 11: SYRIA’S MUNICIPAL ADMINISTRATION MODERNISATION (MAM) PROGRAMME<br />
From 2005 to 2010, the Municipal<br />
Administration Modernisation (MAM)<br />
programme, implemented by the Syrian<br />
government and supported by the European<br />
Union, provided assistance in urban planning,<br />
public services delivery and institutional<br />
capacity building to the Ministry of Local<br />
Administration and six municipalities (Aleppo,<br />
Damascus, Deir-ez-Zor, Homs, Lattakia and<br />
Tartous). MAM has been recognized nationally<br />
and internationally for its achievements<br />
and contributions to the modernisation<br />
of decentralized administration and local<br />
development practices in Syria. 10<br />
MAM has undertaken a variety of activities<br />
which include reviewing and revising<br />
legislation, increasing the capacity of central<br />
and local governments and working jointly with<br />
municipalities to prepare sustainable urban<br />
development plans, developing approaches<br />
to the regularization of informal settlements,<br />
streamlining procedures for the delivery<br />
of urban services and improving financial<br />
management. 11<br />
The programme has addressed the issues<br />
involved in the preservation of cultural<br />
by officials appointed by the provincial governors and have<br />
locally elected councils. Governance is highly centralized<br />
although current policy is to decentralize and strengthen<br />
local councils. As part of its Municipal Administration<br />
Modernization project (see Box 11) the government has<br />
drafted a new National Law on Regional Planning and a<br />
National Law of Local Administration. The first called for the<br />
creation of a new Regional Planning Commission, launched<br />
in 2010, and the second for the Governorates to implement<br />
spatial planning.<br />
Local Government Finance<br />
The Mashreq region inherited a tradition of centralized<br />
taxation from both the Ottoman Empire and the European<br />
colonial states. 174 In most countries, the devolution<br />
of responsibilities to local governments has not been<br />
accompanied by fiscal reforms that either ensure adequate<br />
central transfers or grant local administrations the ability to<br />
collect their own revenues.<br />
Because central government transfers finance most local<br />
expenditures, revenue and expenditure information is<br />
only available in aggregate forms. In Egypt, 94 per cent of<br />
local budgets are provided through central transfer and an<br />
estimated 90 per cent of local budgets are spent on wages. 175<br />
heritage in the Damascus historic centre<br />
and the archaeological site of Palmyra. It has<br />
also underscored the importance of regional<br />
planning to promote economic growth and<br />
sustainable development focusing on the<br />
Eastern region. Through sustained support<br />
of, and cooperation with, different levels of<br />
government, MAM has enabled municipalities<br />
to function more efficiently and effectively,<br />
which is particularly important as planning<br />
responsibilities continue to be devolved to local<br />
levels of governance.<br />
One way in which MAM has helped<br />
municipalities operate more effectively is<br />
through assistance in the preparation of urban<br />
development plans. In an underdeveloped area<br />
on 30 th Street in Damascus, MAM helped<br />
create three development scenarios, which<br />
provided stakeholders with the information<br />
and future visions that participants then<br />
discussed to select a preferred option and<br />
course of action. MAM then helped prepare<br />
a final plan to develop and revitalize this area<br />
in an environmentally responsible manner.<br />
In Lattakia, MAM also developed a regional<br />
tourism strategy analyzing the volume of<br />
tourists attracted, pollution, requirements for<br />
water supply and wastewater treatment and<br />
public transport to create a more sustainable<br />
development plan that integrates the<br />
promotion and management of tourism. 12<br />
In June 2010, following on the success of<br />
MAM, the EU launched the Decentralisation<br />
and Local Development programme. This<br />
programme, in collaboration with the Ministry<br />
of Local Administration, provides support to<br />
Syrian cities in the continued modernisation<br />
of municipal planning and administrative<br />
functions including the management of<br />
public investments. It also facilitates capacity<br />
building for local authorities, fosters economic<br />
and social development and improves access<br />
to urban services. 13<br />
To support the new programme, MAM has<br />
established the Regional Centre for Sustainable<br />
Local Development. The centre supports local<br />
communities and provides local authorities<br />
with access to international networks and<br />
cooperation programmes and opportunities<br />
to participate in study tours and international<br />
conferences. The centre will also facilitate<br />
access to funding. 14<br />
Local government expenditures as a share of total national<br />
expenditures declined from 22 per cent in 1996/97 to 16 per<br />
cent ten years later, due to the importance of central finance of<br />
capital investments. The lack of budget allocated for training<br />
civil servant and the absence of performance-based incentives<br />
constrain improvements in the quality and efficiency of local<br />
administrations. 176<br />
In Egypt, local budgets draw on three major sources of<br />
revenue: taxes on property and vehicles, non-tax current<br />
revenues (user fees, licenses) and current transfers, which<br />
together account for 83 per cent of the budget. 177 In a pilot<br />
project, the Governorates of Alexandria and Qina are testing<br />
different strategies to collect user fees to finance their own<br />
development priorities. 178<br />
In Lebanon, municipalities can theoretically draw on<br />
as many as 35 sources, including locally collected fees and<br />
tariffs, taxes collected by the central government on behalf of<br />
municipalities, central transfers and fees collected by private<br />
institutions and transferred to local governments. In reality,<br />
they are highly dependent on central transfers, which have<br />
become less reliable as the central government focuses on<br />
debt service and infrastructure investments. In Syria, local<br />
government finance is centralized, and all local government<br />
operations are funded through central transfers. Any unspent<br />
funds are returned to the national treasury.
Only the OPT has a truly decentralized budgetary system,<br />
due to the necessity for each city to raise its own revenues. 179<br />
Central transfers comprise only 15 per cent of local revenue,<br />
with 90 per cent of property taxes (collected directly in Gaza<br />
or indirectly through the Palestinian National Authority in<br />
the West Bank) going to the municipalities. Municipalities<br />
undertake the majority of infrastructure programmes, with<br />
funding generally provided (and often overseen) by foreign<br />
donors. 180<br />
The Role of Civil Society<br />
Civil society organizations (CSOs) in the <strong>Arab</strong> region are<br />
active in social services delivery; knowledge-oriented activities;<br />
leisure and social activities and public interests and rights. 181<br />
Due to the rapid growth of cities and the limited resources of<br />
governments, the burden of providing social services to the<br />
poor has increasingly fallen to CSOs.<br />
In Egypt, CSOs must register with the Ministry of Social<br />
Affairs. Lack of funding is a constraint on CSOs, which are<br />
often prevented from or wary of accessing international funds.<br />
They rely on donations from religious institutions or state<br />
funding. This situation was recently reinforced by widespread<br />
perception of foreign interference in the country during the<br />
civil unrest in early 2011.<br />
Islam has a strong tradition of charitable giving (zakat)<br />
that is the root of religious endowments (waqf, plural<br />
awqaf) that dedicate the proceeds of real estate holdings to<br />
specific charitable purposes. Once an important provider of<br />
social welfare, most awqaf are now regulated by dedicated<br />
ministries. 182 Today, a growing number of CSOs are<br />
invoking the zakat model to solicit funds and the revival<br />
of the endowment model has potential to revitalize Islamic<br />
philanthropy.<br />
CSOs in Jordan play a major role as the government’s<br />
privatization of previously public services in the past decade<br />
has also forced civil society to take on new roles in poverty<br />
alleviation, the empowerment of women, community<br />
development and youth services. Today there are an estimated<br />
3,200 civil society organizations in Jordan with a total of over<br />
one million members, 36 per cent of which do charitable<br />
social work. 183<br />
In Egypt, as the state withdrew from certain social<br />
services as part of its decentralization policy, civil society has<br />
blossomed, growing from around 7,600 organizations in<br />
1985 to around 25,000 in 2008, 70 per cent of which are in<br />
urban governorates. Coptic and Muslim civil society groups<br />
are among the oldest in Egypt and provide support for the<br />
needy. 184<br />
In Lebanon, there are 6,032 registered civil society<br />
groups. 185 Following the conflict between Hezbollah and<br />
Israel, a number of CSOs shifted their activities to providing<br />
relief and support to victims of the conflict. While they<br />
have limited impact on the political realm, civil society<br />
groups in Lebanon lead the promotion of good governance,<br />
transparency and accountability. 186<br />
CSOs in Syria are mostly active in the cultural and<br />
environmental fields. One federation of trade unions and a<br />
women’s union exist in the country.<br />
In the OPT, the absence of a national government has<br />
galvanized the development of a diverse array of CSOs that<br />
play a critical role in the provision of social services. They<br />
provide an estimated 60 per cent of primary health services,<br />
managing 42 per cent of hospitals, 90 per cent of rehabilitation<br />
centres and 95 per cent of pre-school education. 187<br />
In Iraq, the Saddam Hussein regime required CSOs to be<br />
registered with the government, fuelling the perception that<br />
such organizations were linked to and worked on the regime’s<br />
behalf. After 2003, the inflow of international NGOs created<br />
a widespread perception that civil society is linked with<br />
foreign occupation and interests. This has created difficulties<br />
for independent and unaffiliated Iraqi NGOs and CSOs,<br />
although in 2010, Iraq passed a new NGO Law that seeks to<br />
strengthen them and CSOs and position both as independent<br />
of the prevailing government. 188<br />
Women in Politics and Governance<br />
Women range from 16 to 25 per cent of the total workforce<br />
in the Mashreq. Their low participation can be attributed<br />
to a variety of factors: high fertility, a prevailing maledominant<br />
culture supported by biases in the legal framework;<br />
the scarcity of jobs; wage and employment discrimination;<br />
weak social support systems for child care; and inadequate<br />
public transportation. 189 However, women’s participation in<br />
the administration of NGOs is significant – 45 per cent in<br />
Lebanon, 42 per cent in the OPT and 18 per cent in Egypt. 190<br />
Their participation is largely concentrated among NGOs<br />
dealing with women-related issues.<br />
In 1952, Lebanon became the first <strong>Arab</strong> country to grant<br />
women both the right to vote and to become members of<br />
parliament, and all Mashreq countries have since followed<br />
suit with Egypt and Jordan having also adopted minimum<br />
quota for women in parliament. Despite these laws, the<br />
participation of women in politics continues to be low, with<br />
women representing only 3 to 12 per cent of the members<br />
of parliament, compared to a world average of 15 per cent.<br />
In many cases, female parliament members and ministers are<br />
educated and often from elite classes.<br />
In Iraq, 25 per cent of central government membership is<br />
reserved for women. Although no quota exist for governorate<br />
or municipal positions, women account for 20 per cent of<br />
councillors in Hilla and 25 per cent in Nassiriya. 191<br />
Female participation in local administration also remains<br />
limited. In the 2004-2005 municipal elections in the OPT,<br />
16 per cent of seats were guaranteed for women and, in 2005<br />
in Ramallah, Janet Mikhail became the West Bank’s first<br />
woman mayor. In 2007, Jordan began requiring municipal<br />
councils to have 20 per cent female representation and, in<br />
the last municipal elections, 20 women were competitively<br />
elected and 195 gained seats through the quota system. Of six<br />
women who ran for mayor, one was elected in Hasa. 192<br />
71
72<br />
2.7<br />
Migration and Remittances<br />
<br />
Palestinian refugees in Beirut, Lebanon. ©Al Jazeera English. Licensed under the Creative Commons Attribution-Share Alike 2.0 Generic license.<br />
Migrants and Refugees in the Mashreq<br />
With the exception of Jordan and Syria, who have<br />
been net receivers of both migrants and refugees,<br />
most of the Mashreq countries have experienced<br />
a net outmigration with residents searching for employment<br />
opportunities safe havens abroad. Not surprisingly, conflict<br />
ridden countries (Iraq, Lebanon and the OPT) have witnessed<br />
large outmigrations.<br />
Many migrants in the Mashreq region travel abroad in<br />
search of better economic opportunities. In addition, many<br />
of the countries are receivers of lower wage workers. In search<br />
of employment opportunities, Egyptians have gone to Jordan,<br />
Libya, Saudi <strong>Arab</strong>ia and the United States and a growing<br />
number have migrated across the Mediterranean to Italy via<br />
Libya. 193 Conversely, 2.2 million to 4 million people from<br />
sub-Saharan Africa, primarily Sudanese, have settled in Egypt<br />
and work in the informal service sector. 194<br />
Many well-educated and highly-skilled Jordanians emigrated<br />
during the 1970s and 1980s in search of employment<br />
opportunities in the oil-producing countries while semiskilled<br />
workers from Egypt, Syria and Asian countries have<br />
come to that country to work in the agricultural, industrial<br />
and service sectors. 195<br />
TABLE 19: EGYPTIAN NATIONALS ABROAD BY HOST COUNTRY<br />
Country 2000<br />
Canada 110,000<br />
Jordan 226,000<br />
Libya 332,000<br />
Saudi <strong>Arab</strong>ia 923,000<br />
United States 318,000<br />
Source: International Labour Organization<br />
The Lebanese diaspora of around 14 million is larger than<br />
the resident population. 196 While the civil war has contributed<br />
to emigration, 197 there has also been an outmigration of the<br />
better educated, higher-skilled population looking for job<br />
opportunities abroad. 198 The departure of higher-skilled<br />
individuals is, in part, due to the low returns on education in<br />
the domestic labour market. 199<br />
Once abroad, migrants begin to remit a portion of their<br />
earnings to their families back home. These infusions can<br />
have a positive impact on household income, especially in<br />
urban areas. With its huge diaspora, Lebanon is the largest<br />
receiver of remittances. Egypt is the second largest, with
approximately USD 7.1 billion in 2009, but the remittances<br />
only represent 3.8 per cent of GDP. 200 Remittances in Jordan,<br />
although more modest in absolute terms, account for 16 per<br />
cent of GDP, one of the highest percentages worldwide. 201<br />
Remittances can have a significant impact on urban<br />
development. When migrants remit a portion of their<br />
earnings, the additional income is often saved, initially to<br />
cover the travel expenses of sending other family members<br />
abroad. Further savings are typically used to purchase land<br />
and the incremental construction of housing, often with<br />
commercial activities. Income generated by these activities<br />
supports the education costs of the next generation.<br />
International Migration of Refugees<br />
Iraq, Lebanon and the OPT have faced civil conflict and,<br />
as a result, many residents have migrated aboard to seek<br />
refuge in other countries. Historically, the OPT is the largest<br />
sender of refugees, many of whom have settled in urban areas.<br />
Approximately 1.4 million live in camps in Jordan, Lebanon<br />
and Syria or in the West Bank or Gaza Strip, often in densely<br />
settled areas with inadequate infrastructure. 202<br />
In Iraq, an average of approximately 115,000 people leave<br />
the country each year. Since the 1980s over 2 million Iraqis<br />
have migrated to other countries in the region, primarily Syria<br />
and Jordan, to escape the insecurity and instability created by<br />
the war with Iran, the First and Second Gulf Wars and the<br />
sectarian violence of the 2000s. 203<br />
Jordan has been the main destination for refugees from<br />
Occupied Palestinian Territories after the wars of 1948 and<br />
1967 and more than 50 per cent of the population is of<br />
Palestinian origin. 204 Lebanese refugees during the civil war<br />
and Iraqis, during both Gulf Wars, contributed significantly<br />
to the 2.5 million refugees residing in Jordan as of 2010. 205 In<br />
2008, approximately 25 per cent of the Amman population<br />
were refugees, the highest ratio in the world. 206<br />
Although many emigrated from Lebanon to escape the<br />
civil war, the country is also home to refugees. 207 As of 2008,<br />
approximately 417,000 refugees - Palestinian (350,000) 208 ,<br />
Iraqi (40,000) 209 , and Kurdish (27,000) - resided in Lebanon,<br />
primarily in Tyre, Beirut, Tripoli and the Beqa’a. 210 They face<br />
restrictions with regards to owning property 211 or securing<br />
a job, 212 forcing them into the informal housing and labour<br />
markets. As of January 2010, approximately 750,000 Iraqis<br />
were residing in Syria but that number is expected to decline<br />
to approximately 512,000 by January 2011 and to 262,000<br />
by December 2011. 213<br />
Internally Displaced Persons<br />
It is estimated that 1.9 million Iraqis have been displaced<br />
internally as a result of conflict, which has led to significant<br />
problems in land claims and ownership, as well as in informal<br />
and illegal housing occupancy. 214 In Lebanon, significant<br />
internal displacement occurred during the civil war, fuelling<br />
Beirut’s informal urbanization. 215 In Syria, 40,000 to 60,000<br />
families have been migrating from rural to urban areas each<br />
year as a result of droughts; rural communities in the northeast<br />
have been hit particularly hard spurring the migration of<br />
200,000 to 300,000 Syrians to urban areas. 216<br />
<br />
A view of Jabalia refugee camp. Jabalia is the largest of the Gaza Strip's eight refugee camps. It is located north of Gaza City, close to a village of the same name. ©Suhair Karam/IRIN<br />
73
74<br />
2.8<br />
Metropolitan Regions and Corridors<br />
Development corridors are an important feature of<br />
the Mashreq countries where urban settlements have<br />
historically grown and flourished along riverbanks,<br />
coastlines and road infrastructures. Modern transportation<br />
networks extending across national boundaries have overlaid<br />
highways linking key cities across more barren lands.<br />
The Greater Cairo Region (GCR), with almost 20 million<br />
residents, is the <strong>Arab</strong> world’s largest extended metropolitan<br />
region. Situated at the southern edge of the Nile Delta,<br />
the GCR anchors several strategic corridors that link it to<br />
FIGURE 20: HISTORICAL DEVELOPMENT AROUND THE CAIRO-ALEXANDRIA CORRIDOR<br />
Source: UN-Habitat, SOAC 2008<br />
Regional Corridors and Cooperation<br />
Alexandria, Egypt’s second city and largest port with 40 per<br />
cent of the country’s industries; to the Suez Canal cities; Port<br />
Said on the Mediterranean coast, the major trading port;<br />
to Ismailiya on the Canal and Suez on the Red Sea a major<br />
industrial city and oil terminal.<br />
The 225 km Cairo-Alexandria Corridor is the largest and<br />
part of the <strong>Arab</strong> State's most important mega urban region.<br />
It comprises 105,000 hectares of land, 75 per cent of which is<br />
agricultural, and 25 per cent of which is desert. The corridor<br />
includes Sadat City, a new urban community that will
FIGURE 21: URBAN CLUSTERING ALONG THE NILE VALLEY AS SEEN FROM SPACE<br />
Source: NASA Marshall Space Flight Center 2010<br />
accommodate 1 million people by 2030. About 40 per cent<br />
of the corridor’s area is devoted to agri-export activities that<br />
account for over 37 per cent of the country’s total output in<br />
this sector.<br />
Major challenges include urban sprawl, a rapid inflation in<br />
land prices, worsening congestion (traffic volumes ballooned<br />
from 6,576 cars per day in 1985 to 26,726 cars per day in<br />
2005), increasing groundwater contamination, aquifer<br />
depletion, and untreated wastewater. Alexandria has approved<br />
a new development plan that seeks to address some of these<br />
challenges, including a new regional ring road and pro-poor<br />
policies.<br />
A special feature of the corridor is the development of high<br />
technology parks referred to as “smart villages.” The success<br />
of the first smart villages in Giza across from 6 th of October<br />
New Town at the beginning of the corridor has led to its<br />
expansion beyond the original three square kilometres and<br />
plans to develop a similar hi-tech park west of Alexandria<br />
close to the end of the corridor. At the end of 2010, 150 hitech<br />
companies had located in the park and were employing<br />
35,000 professionals, most of them young people. With the<br />
expansion, the park is expected to be able to accommodate<br />
500 companies employing a total of 100,000 people.<br />
UN-Habitat is working with the General Organization<br />
for Physical Planning (GOPP) to prepare a strategic urban<br />
development plan for the Greater Cairo Region. Key features<br />
include slum and informal settlement upgrading plans,<br />
moving major public sector functions to a new government<br />
centre on the periphery, relocating polluting land uses from<br />
the inner city, revitalizing the historic centres, and preparing<br />
new strategic plans for transportation, infrastructure and local<br />
economic development. Links to the ring road and the Cairo-<br />
Alexandria corridor have been completed.<br />
Iraq’s largest cities – Baghdad, Mosul, and Basra – are<br />
geographically spread out, but the 490 kilometre transport<br />
corridor from the southern port of Umm Qasr via Basra to<br />
Baghdad is Iraq’s most important trade and shipping artery<br />
(see Figure 22). As Iraq is a largely landlocked country, Umm<br />
Qasr is its only independent means of accessing maritime<br />
shipping. 217<br />
Syria’s Damascus-Homs Corridor is another important<br />
emerging mega urban region and encompasses the country’s<br />
key cities and industries. The corridor includes Hissya, a<br />
new industrial city 47 kilometres south of Homs that has<br />
four major economic sectors: textiles, food, chemicals, and<br />
engineering. The city accommodates 66,000 workers and<br />
their families. In 2009, the Government of Syria adopted a<br />
regional planning law and established the Regional Planning<br />
Commission. In 2010, with funding support from the<br />
government and UNDP, it started to develop the national<br />
framework for regional planning, structure plans for the<br />
regions and to assist governorates in preparing strategic<br />
urban growth plans.<br />
On a smaller scale, the 28 kilometres Amman-Zarqa<br />
corridor is the most important conurbation in Jordan<br />
(see Figure 23). Zarqa is its third largest city and home to<br />
over 440,000 people and over 50 per cent of the country’s<br />
industries. Areas between the two cities are rapidly<br />
developing. Tameer Holdings, a UAE developer, is building<br />
a new township for 50,000 people between Zarqa and<br />
Amman; the project includes 7,000 apartments targeting<br />
low-income residents. With over 150,000 vehicles per day<br />
clogging the corridor, the Government of Jordan intends to<br />
build a light rail connection between Zarqa and Amman that<br />
would transport almost 100,000 passengers per day, largely<br />
constructed in the historic Hejaz Railway right-of-way. 218<br />
Funded by the International Finance Corporation (IFC), this<br />
project is a structured public-private partnership. A separate<br />
programme will develop an efficient rapid bus system to link<br />
into the light rail system. 219<br />
75
76<br />
FIGURE 22: CORRIDORS PROPOSED BY WORLD BANK MASHREQ TRADE FACILITATION AND INFRASTRUCTURE PROJECT 225<br />
<br />
<br />
<br />
<br />
<br />
<br />
<br />
<br />
<br />
1.9m<br />
<br />
<br />
<br />
3.1m<br />
<br />
<br />
2.6m<br />
1.1m<br />
FIGURE 23: AMMAN-ZARQA CORRIDOR<br />
AMMAN<br />
Light rail planned<br />
Rusayfah<br />
Raghadan<br />
Source: Railway Gazette 2009<br />
Hedjaz Railway<br />
Major roads ZARQA<br />
Al Mahatta<br />
<br />
<br />
<br />
New Zarqa<br />
Zarqa<br />
N<br />
<br />
1.4m<br />
Regional Integration<br />
5.8m<br />
<br />
<br />
<br />
<br />
<br />
<br />
<strong>Arab</strong> countries have signed trade agreements with each<br />
other, African countries, the European Union and the United<br />
States. In addition, the Pan-<strong>Arab</strong> Free Trade Area (PAFTA)<br />
has removed tariffs on trade and facilitates customs clearance<br />
while the Agadir Agreement established a Free Trade Zone<br />
between Morocco, Tunisia, Egypt and Jordan and can be<br />
expanded to the remaining Maghreb and Mashreq countries.<br />
Also, bilateral agreements exist between the EU and Jordan,<br />
the West Bank and Gaza, Lebanon and Syria, which represent<br />
a first step for a future EURO-MED free trade area.<br />
In spite of these agreements, intra-MENA trade accounts<br />
for less than 10 per cent of the countries’ total exports. 220<br />
Mashreq countries trade more with the EU than with each<br />
other or the rest of the <strong>Arab</strong> world because they produce<br />
similar products, regulatory facilitation is inadequate, and<br />
investment in an integrated physical infrastructure has<br />
lagged. The 2007 UN Economic and Social Commission<br />
for Western Asia (UN–ESCWA) index of <strong>Arab</strong> regional<br />
integration for 16 <strong>Arab</strong> countries ranked Jordan, Lebanon<br />
and Syria as the lead countries. This is demonstrated in the<br />
relatively strong electrical and transportation networks in the<br />
region.<br />
<br />
<br />
0.9m
Establishing a regional electrical network is one area<br />
where integration is advancing. There is a seven-country<br />
interconnection project between Egypt, Iraq, Jordan,<br />
Lebanon, Libya, Syria and Turkey that began in the 1990s.<br />
Connections have been established between Egypt and<br />
Jordan, Jordan and Syria, Syria and Lebanon, and Syria and<br />
Turkey; the Syria/Iraq connection remains uncertain. Moving<br />
forward, this initiative will increase capacity on existing lines<br />
and eventually extend the network west to the Maghreb<br />
countries. In addition, Egypt and Saudi <strong>Arab</strong>ia are working<br />
on a 3,000 MW-sharing project to be implemented in two<br />
phases and completed by 2015. 221<br />
Emerging Transnational Transportation<br />
Corridors<br />
Transportation accounts for 8 to 13 per cent of the Mashreq<br />
GDP and employs around 10 per cent of the labour force. 222<br />
The quality of transportation infrastructure is an important<br />
determinant of export productivity, as well as individual<br />
mobility and quality of life. According to the World Economic<br />
Forum’s 2010 ranking, most of the Mashreq countries have<br />
stronger infrastructure than others in their class: Egypt’s rail<br />
and air transport are highly competitive and Jordan has high<br />
quality roads and air service. The exception is Lebanon, where<br />
poor infrastructure hampers economic activities.<br />
One of the barriers to intra-regional trade in the region<br />
is the lack of an integrated, high-quality, multi-modal<br />
transportation network. Several transportation agreements<br />
were organized by UN-ESCWA in the early 2000s: the<br />
Agreement on International Railways in the <strong>Arab</strong> Mashreq<br />
(2002), the Agreement on International Roads in the <strong>Arab</strong><br />
Mashreq (2002) and the Memorandum of Understanding<br />
on Maritime Transport Cooperation in the <strong>Arab</strong> Mashreq<br />
(2005). Most have not been implemented as a result of lack<br />
of funding and political conflict in the region, including 60<br />
per cent of the proposed railway networks.<br />
FIGURE 24: MENA TRADE BY COUNTRY SUB-GROUPS, 2007<br />
100<br />
80<br />
60<br />
40<br />
20<br />
0<br />
A. Total Trade (% GDP)<br />
MENA GCC Maghreb Mashreq Other<br />
Sub-region Rest of the World<br />
Source: World Bank, Economic Integration in the Mashreq, 2010<br />
Other MENA<br />
The World Bank has proposed transportation investments<br />
to strengthen cross-border trade along three corridors: a<br />
north-south corridor that links the European Union and the<br />
Gulf Cooperative Council via Turkey, Syria and Jordan (with a<br />
connecting link to Egypt) and two east-west corridors that link<br />
the ports of Lattakia and Tartous (Syria) and Tripoli and Beirut<br />
(Lebanon) to Iraq, giving it access to the Mediterranean. 223<br />
The World Bank estimates that, by 2020, improved<br />
infrastructure and more efficient logistics could increase<br />
daily traffic in the north-south corridor to 2,500 trucks and<br />
15 trains in each direction, and 1,100 trucks and six trains<br />
in each direction in each of the two east-west corridors. The<br />
project is estimated to take 15 years and cost USD 5.2 billion,<br />
which would be financed by governments, the private sector<br />
and international development agencies. 224<br />
A USD 780 million First Phase has been agreed upon by the<br />
World Bank and Iraq, Jordan, Lebanon, Syria and the West<br />
Bank and Gaza. It will finalise institutional arrangements<br />
and a regional trade framework; improve existing road and<br />
rail infrastructure and border crossings and define Phase 2<br />
investments.<br />
The largest infrastructure investments would be made in<br />
Iraq, followed by Syria, Jordan, Lebanon, and the OPT. Four<br />
border crossings will be improved on the Lebanese-Syria border,<br />
one on the Iraqi-Syrian border and one on the Iraqi-Jordanian<br />
border. Road networks will also require improvements, the<br />
most urgent being the upgrading the Jordanian road network<br />
leading to the Saudi <strong>Arab</strong>ia border and the Iraqi roads in the<br />
east-west corridors. The Mashreq countries have also called for<br />
the creation of a corridor management agency to facilitate the<br />
implementation of this project and coordinate trade activities<br />
among countries.<br />
Rail Infrastructure. The Mashreq has over 10,000 km<br />
of railroads, but the international movement of freight and<br />
passengers is limited due to the lack of regional integration.<br />
Following the signing of the Agreement on International<br />
Railways in the <strong>Arab</strong> Mashreq in 2002, the Mashreq countries<br />
50<br />
40<br />
30<br />
20<br />
10<br />
0<br />
B. Total Non-Oil Trade (% GDP)<br />
MENA GCC Maghreb Mashreq Other<br />
Sub-region Rest of the World<br />
Other MENA<br />
77
78<br />
are developing new rail lines to create a more integrated<br />
network. A major challenge lies in integrating the Mashreq<br />
network to Egypt.<br />
Egypt’s 5,085 km of railroads operates only within<br />
the country and, while a connection to Libya is under<br />
construction, defunct links to Israel and Palestine prevent<br />
the direct rail connection to the rest of the Mashreq. Jordan’s<br />
510 km of railroads serve mainly to transport phosphate from<br />
mines to the port of Aqaba and its narrow track gauge prevents<br />
integration with the rest of the region. However, Jordan has<br />
adopted a EUR 2.7 billion (USD 3.58 billion) project that<br />
will convert the system to standard gauge and add another<br />
400-plus kilometres of network linking it to Syria, Iraq and<br />
Saudi <strong>Arab</strong>ia by 2013. Lebanon’s two lines, totalling 408<br />
km, stopped operating in 1975 due to the civil war; a study<br />
is underway to evaluate reopening the Tripoli-Syria segment.<br />
Syria’s 2,495 km network is the most internationalized with<br />
one link to Iraq and two to Turkey; it has been developing a<br />
number of rail projects that will enlarge its network by over<br />
400 km by 2013. The Occupied Palestinian Territories have<br />
no railroads and none are planned.<br />
Transportation links will play a key role in the new<br />
development corridors encompassing economic activity<br />
and will shape future urbanization. The timetable for the<br />
implementation of these projects will have to be revised when<br />
<br />
Cairo, Egypt. The Greater Cairo Region is the <strong>Arab</strong> world's largest extended metropolitan region. ©Baloncici/Shutterstock<br />
stability is restored in the region, following the recent civil<br />
unrest.<br />
Maritime and Airport Infrastructure. The railway network<br />
is closely linked to port facilities, the most important of which<br />
are Alexandria, Aqaba, Beirut, Lattakia, Port Said, Tartous,<br />
Tripoli, and Umm Qasr. Dry ports and intermodal terminals<br />
opened in Homs and Adra in 2009, and one is planned to<br />
open in Aleppo in 2012. All of these are feeder ports and<br />
their performance, as measured by volume of freight, has<br />
consistently improved over the past five years. Lebanon’s port<br />
infrastructure is ranked 55th in the world, followed by Jordan<br />
(64), Egypt (69) and Syria (117). The Mashreq corridor<br />
infrastructure projects will significantly increase the efficiency<br />
of port infrastructure in Lebanon and Syria.<br />
Egypt has 20 civil airports (including ten international),<br />
which carried 6.7 million passengers in 2008; Jordan has<br />
international airports in Amman and Aqaba that serve 2.4<br />
million passengers; Syria has three international airports<br />
in Damascus, Aleppo and Lattakia, serving 1.4 million<br />
passengers and Lebanon, which has one airport in Beirut,<br />
serves just under one million passengers a year. Similarly, air<br />
freight transport in the region was the most significant for<br />
Egypt and Jordan and, to a lesser extent, Lebanon, which have<br />
highly competitive air transport infrastructure. Syria’s freight<br />
transport infrastructure is minimal.
Mashreq Statistical Annex<br />
TABLE 20: TOTAL AND URBAN POPULATION (‘000S) AND PER CENTAGE POPULATION URBAN<br />
1990 1995 2000 2005 2010 2015 2020 2025 2030<br />
Total Population (‘000s)<br />
Egypt 56,843 62,064 67,648 74,203 81,121 88,179 94,810 100,909 106,498<br />
Iraq 17,374 20,288 23,857 27,359 31,672 36,977 42,684 48,885 55,257<br />
Jordan 3,416 4,382 4,827 5,342 6,187 6,797 7,366 7,906 8,415<br />
Lebanon 2,948 3,463 3,742 4,052 4,228 4,385 4,516 4,624 4,701<br />
OPT 2,081 2,596 3,199 3,556 4,039 4,648 5,317 6,027 6,755<br />
Syria<br />
Urban Population (‘000s)<br />
12,324 14,171 15,989 18,484 20,411 22,184 24,079 26,009 27,859<br />
Egypt 25,124 27,340 30,032 33,197 36,664 40,712 45,301 50,506 56,477<br />
Iraq 12,602 14,424 16,722 18,891 20,822 23,700 26,772 30,244 33,930<br />
Jordan 2,350 3,366 3,798 4,359 5,083 5,498 5,998 6,533 7,063<br />
Lebanon 2,472 2,961 3,244 3,535 3,712 3,891 4,065 4,231 4,374<br />
OPT 1,462 1,843 2,267 2,749 3,269 3,834 4,447 5,108 5,810<br />
Syria 6,224 7,320 8,577 10,284 12,545 14,181 15,948 17,938 19,976<br />
Per cent Population Urban (%)<br />
Egypt 43.48 42.81 42.80 43.03 43.40 44.36 45.93 48.12 50.92<br />
Iraq 69.71 68.78 67.83 66.90 66.17 66.05 66.55 67.67 69.37<br />
Jordan 72.23 78.21 78.26 78.31 78.53 79.02 79.78 80.77 81.97<br />
Lebanon 83.12 84.82 86.00 86.60 87.24 87.92 88.63 89.35 90.04<br />
OPT 67.86 70.41 71.97 73.06 74.14 75.32 76.59 77.95 79.37<br />
Syria 48.93 50.10 51.95 53.78 55.74 57.90 60.24 62.74 65.37<br />
Source: UN-DESA, WPP 2008 and WUP 2009<br />
TABLE 21: NATIONAL AND URBAN POPULATION ANNUAL GROWTH RATES<br />
National Population Growth Rates (%)<br />
Source: UN-DESA, WUP 2009<br />
1990-1995 1995-2000 2000-2005 2005-2010 2010-2015 2015-2020 2020-2025 2025-2030<br />
Egypt 2.00 1.89 1.90 1.81 1.66 1.44 1.24 1.10<br />
Iraq 2.97 3.23 2.72 2.17 2.63 2.29 2.10 1.80<br />
Jordan 5.59 2.40 2.74 3.02 1.44 1.55 1.46 1.27<br />
Lebanon 3.20 1.55 1.58 0.83 0.79 0.71 0.64 0.51<br />
OPT 3.89 3.70 3.55 3.18 2.87 2.63 2.42 2.21<br />
Syria<br />
Urban Population Growth Rates (%)<br />
2.77 2.45 2.94 3.26 1.69 1.56 1.54 1.33<br />
Egypt 1.69 1.88 2.00 1.99 2.09 2.14 2.18 2.23<br />
Iraq 2.70 2.96 2.44 1.95 2.59 2.44 2.44 2.30<br />
Jordan 7.18 2.42 2.75 3.07 1.57 1.74 1.71 1.56<br />
Lebanon 3.61 1.83 1.72 0.98 0.94 0.87 0.80 0.67<br />
OPT 4.63 4.14 3.86 3.47 3.19 2.97 2.77 2.58<br />
Syria 3.24 3.17 3.63 3.97 2.45 2.35 2.35 2.15<br />
79
80<br />
TABLE 22: AVERAGE ANNUAL RATE OF CHANGE OF URBAN AGGLOMERATIONS WITH 750K+ PEOPLE IN 2009 (PER CENT)<br />
1990-1995 1995-2000 2000-2005 2005-2010 2010-2015 2015-2020 2020-2025<br />
Alexandria 1.35 1.83 2.02 1.98 1.76 1.64 1.65<br />
Cairo 1.38 0.93 0.76 0.81 1.17 1.45 1.52<br />
Amman 2.67 0.68 0.68 1.19 1.41 1.39 1.40<br />
Beirut -0.39 3.19 3.57 1.72 0.97 0.55 0.42<br />
Damascus 1.85 2.13 2.13 2.48 2.33 1.93 1.90<br />
Aleppo 3.64 3.35 3.35 3.39 2.57 1.92 1.88<br />
Hama 3.12 6.27 6.26 5.65 3.34 2.14 2.05<br />
Homs 3.83 4.49 4.49 4.29 2.91 2.06 1.99<br />
Source: UN-DESA, WPP 2008 Revision and WUP 2009<br />
TABLE 23: CITY POPULATIONS IN THOUSANDS<br />
1985 1990 1995 2000 2005 2009 2010 2015 2020 2025<br />
Alexandria 2,826 3,063 3,277 3,592 3,973 4,304 4,387 4,791 5,201 5,648<br />
Cairo 8,328 9,061 9,707 10,170 10,565 10,902 11,001 11,663 12,540 13,531<br />
Amman 736 851 973 1,007 1,042 1,088 1,105 1,186 1,272 1,364<br />
Beirut 1,585 1,293 1,268 1,487 1,777 1,909 1,937 2,033 2,090 2,135<br />
Damascus 1,546 1,691 1,854 2,063 2,294 2,527 2,597 2,918 3,213 3,534<br />
Aleppo 1,292 1,554 1,864 2,204 2,605 2,985 3,087 3,510 3,864 4,244<br />
Hama 273 309 361 495 676 854 897 1,060 1,180 1,307<br />
Homs 470 565 684 856 1,072 1,276 1,328 1,536 1,702 1,881<br />
Source: UN-DESA, WPP 2008 and WPP 2009<br />
TABLE 24: CHARACTERISTICS OF HOUSING MORTGAGES IN THE MASHREQ<br />
Egypt Jordan Lebanon Syria<br />
Mortgage Loans (million USD) 666-800 1,770<br />
Mortgages as % of GDP 0.4% 10% 6% 5%<br />
Mortgages as % of Bank Loans 0.89%<br />
Average Mortgage Interest Rates 12-13% 8-9% 5.9% 9%<br />
Loan Maturities 12-13.5 yrs Up to 30 years 20-30 yrs 5-17<br />
Borrowing limits 25% of down payment<br />
Sources: NBK Capital 2010, Global Property Guide, 2010; Jordan Mortgage Refinance Company 2009 Annual Report; Egypt Eyes Mortgage Law to Boost Property Sector<br />
Down payment: 20%,<br />
min loan: USD 16,300
TABLE 25: LEVEL OF MOTORIZATION IN MASHREQ COUNTRIES, VARIOUS YEARS<br />
Egypt Jordan Lebanon Syria OPT<br />
Roads (km, 2000-2007) 92,370 7,768 6,970 40,032 5,147<br />
% Roads Paved (2001-2007) 81 84 100 .. ..<br />
Road Density (km of roads per 100 km2 land area) 9 9 67 21 ..<br />
Motor Vehicles (per 1,000 people) .. 137 291 52 16<br />
Passenger Cars (per 1,000 people) 29 94 22 16<br />
Source: World Bank Development Indicators<br />
TABLE 26: 2008 ACCESS TO IMPROVED WATER AND SANITATION (% OF HOUSEHOLDS)<br />
Improved Water Access Improved Sanitation Access<br />
Total Urban Rural Total Urban Rural<br />
Egypt 99 100 98 94 97 92<br />
Iraq 79 91 55 73 76 66<br />
Jordan 96 98 91 98 98 97<br />
Lebanon 100 100 100 .. 100 ..<br />
OPT 91 91 91 89 91 84<br />
Syria 89 94 84 96 96 95<br />
Source: WHO/UNICEF Joint Monitoring Program 2008<br />
TABLE 27: WASTEWATER TREATMENT AND REUSE IN MASHREQ COUNTRIES<br />
Total Wastewater (m 3 /yr) Treated Wastewater (m 3 /yr)<br />
Egypt 3,760 million (2001) 2,971 million (2001)<br />
Jordan<br />
Lebanon 310 million (2001) 165 million (1988)<br />
OPT<br />
Syria 1,364 million (2002)<br />
Source: Wastewater Stats, FAO Water Report 34, 2009<br />
107.4 million (2005)<br />
% treated: 50% of total (nationwide)<br />
245 million by 2020 (NWMP, 04)<br />
4 million (2006)<br />
Potential for reuse: 100 million<br />
% Treated:
82<br />
TABLE 28: ENERGY CONSUMPTION<br />
Egypt Jordan Lebanon OPT Syria MENA (developing)<br />
Electricity Use (1997 kWh per cap) 824 1,261 2,219 905 931<br />
Electricity Use (2007 kWh per cap) 1,384 1,970 2,153 640 (2005) 1,467 1,435<br />
Electricity from fossil fuels (% of total) 88.30% 99.50% 92.50% 89.30% 91.10%<br />
Electricity from hydropower (% of total) 11.20% 0.40% 7.50% 0% 10.70% 16.30%<br />
Electricity from renewables (% of total) 4.20% 1% (2007)<br />
9.9% (solar) 13.7%<br />
(fuel wood)<br />
Renewable energy target (% of total) 20% (2020) 10% (2020) 12% (2020) .. 5% of elect. (2025)<br />
Energy Use (2007 kg of oil equiv. per cap) 843 1,254 1,173 ... 975 1,254<br />
Energy Imports (net, % of total)<br />
TABLE 29: 2005 NATIONAL ANNUAL CARBON DIOXIDE EMISSIONS<br />
Egypt Jordan Lebanon OPT Syria MENA (developing) World<br />
Total (kt of CO ) 2 163,220 21,317 17,532 2,741 72,481 1,082,569 29,205,744<br />
Per Cap (t) 2.4 3.8 4.2 0.77 3.6 3.7 4.5<br />
% Growth (1990-2005) 130 101 86 .. 91 97 29<br />
Source: World Bank Development Indicators<br />
-49 (1997)<br />
-22 (2007)<br />
TABLE 30: MUNICIPAL SOLID WASTE COMPOSITION AND GENERATION<br />
94 (1997)<br />
96 (2007)<br />
Egypt (2000) Jordan (2001) Lebanon (2000) Syria (2001)<br />
MSW Generated (million tons) 14.9 1.46 1.38 3.65 - 5.48<br />
Urban Per Capita MSW 0.6-1.0 kg/day 0.7-0.85 kg/day 0.5-0.7 kg/day 0.6 kg/day (2010)<br />
Urban Collection Coverage 30-95% 95+% 100% 90% (2010)<br />
MSW Generation Growth<br />
Material Composition of MSW<br />
3.2%/yr 3.0%/yr 7%/yr 2.5-3.5%<br />
Food/organic wastes 60% 56% 63% 65%<br />
Paper 10% 16% 18% 10%<br />
Plastic 12% 13% 7% 12%<br />
Glass 3% 7% 5% 4%<br />
Metal 2% 5% 3% 2%<br />
Other<br />
Treatment Method<br />
13% 3% 4% 7%<br />
Composted 8% 8%
TABLE 31: GOVERNMENT RESPONSIBILITY FOR URBAN SERVICES<br />
Macro Policy / Oversight Financing Provision<br />
Function Egypt OPT World Egypt OPT<br />
Social Services<br />
World Egypt OPT World<br />
Social Welfare C C C C C C C C C,P,M<br />
Hospitals C C C C C C,P,M C C C,P,M<br />
Public Health C C C,P C C C,P,M C C C,P,M<br />
Universities C C C,P C C C,P,M C C C,P,M<br />
Secondary Education C C C,P C C C,P,M C C C,P,M<br />
Primary Education C C C,P C C C,P,M C C C,P,M<br />
Housing C C C,P C C<br />
Transportation<br />
C,P,M C C C,P,M<br />
Urban Transport C,P C,P,M C,P,M C,P,M C,P,M C,P,M C,P C,P,M C,P,M<br />
Railroads C n/a C,P C n/a C,P C n/a C,P,M<br />
Airports C n/a C,P C n/a C,P C n/a C,P,M<br />
Ports & Waterways C n/a C C n/a C C n/a C,P,M<br />
Urban Highways C,P C,P,M C,P,M C,P,M C,P,M C,P,M C,P C,P,M C,P,M<br />
Interurban Highways C,P C,P,M C,P C,P C,P,M<br />
Utility Services<br />
C,P C,P C,P,M C,P,M<br />
Electricity C C C,P,M C M C,P,M C C C,P,M<br />
Waste Collection M M M M M M M M M<br />
Water & Sewerage P,M M M P,M M<br />
Other Services<br />
M P,M M M<br />
Fire Protection M C,P,M M M C,P,M M M C,P,M M<br />
Heating n/a n/a M n/a n/a M n/a n/a M<br />
Irrigation C,P C,P M C,P C,P M C,P C,P M<br />
Police C C C,P,M C C C,P,M C C C,P,M<br />
C = Central Government, P = Provincial Government, M = Municipal Government, n/a = Not Applicable; Source: Tosun and Yilmaz, 2008<br />
TABLE 32: PARTICIPATION IN THE WORKFORCE AND NATIONAL POLITICS BY WOMEN/MEN IN THE MASHREQ<br />
Egypt Iraq Jordan Lebanon Palestine Syria<br />
<br />
Literacy rate (% literate aged 15 and above, 2006-08) 58 75 69 86 89 95 86 93 91 97 77 90<br />
Labour Force Participation Rate (% of those aged 15-64<br />
employed, 2008)<br />
24 76 14 72 25 78 24 75 17 72 22 82<br />
% of Unemployment (2008) 19 6 13* 10* 24 10 .. .. 24 26 21^ 8^<br />
% of parliament (single or lower house) female (2009) 2 (quota: 12) 26 6 3 12<br />
% of ministerial positions held by women (2005) 6 19 11 7 6<br />
% of overall legislators, senior officials and managers who<br />
are women (2007/2008)<br />
11 8 10 10<br />
Source: World Bank Gender Statistics, UN Division of Statistics, UN HDR 2009; *2004 data; ^2003 data<br />
83
84<br />
TABLE 33: IMMIGRATION DATA BY COUNTRY<br />
# of International Migrants<br />
in Country (2010)<br />
# of Refugees<br />
in Country (2008)<br />
% Population Foreign<br />
Born (2010)<br />
Average Annual Net Migration<br />
(2005-2010)<br />
Egypt 245,000 97,900 0.3% -68,000<br />
Iraq 83,000 39,500 0.3% -115,400<br />
Jordan 2,973,000 2,452,000 45.9% 50,000<br />
Lebanon 758,000 472,600 17.8% -2,500<br />
OPT 1,924,000 1,836,100 43.6% -2,000<br />
Syria 2,206,000 1,567,600 9.8% 160,000<br />
Source: UN DESA International Migration Wall Chart 2009<br />
TABLE 34: RECEIPT OF REMITTANCES BY COUNTRY<br />
Country<br />
2009 Net ODA and Official Aid<br />
Received (current US$ million)<br />
2009 Remittances<br />
Received (US$ million)<br />
Remittances<br />
(% of GDP- 2009)<br />
Egypt 925 USD 7,150 3.8%<br />
Jordan 761 USD 3,597 15.8%<br />
Lebanon 641 USD 7,558 21.9%<br />
Syria 245 USD 1,050 2.0%<br />
Source: World Bank Development Indicators, 2010
ENDNOTES<br />
1 World Bank. (2009). World Bank Development<br />
Indicators. Washington D.C.: The World Bank.<br />
2 United Nations, Department of Economic and Social<br />
Affairs, Population Division (2010). World Urbanization<br />
Prospects: The 2009 Revision. New York: UN-ECOSOC.<br />
3 United Nations, Department of Economic and Social<br />
Affairs, Population Division (2010).<br />
4 United Nations, Department of Economic and Social<br />
Affairs, Population Division (2010).<br />
5 United Nations, Department of Economic and Social<br />
Affairs, Population Division (2010).<br />
6 United Nations, Department of Economic and Social<br />
Affairs, Population Division (2010).<br />
7 Human Settlements Programme and Global Urban<br />
Research Unit, School of Architecture, Planning and<br />
Landscape, Newcastle University, The State of Iraq<br />
<strong>Cities</strong> Report (2006-2007).<br />
8 CAMPAS and National Information Centre. (1996 &<br />
2006). National Census.<br />
9 Saleh, Bassam and Samih Al Rawashdeh. Study of<br />
Urban Expansion in Jordanian <strong>Cities</strong> Using GIS and<br />
Remoth Sensing. International Journal of Applied<br />
Science and Engineering, 5(1) 2007 41-52.<br />
10 Hamdi, M.R., Ahmed B., and Z. Tarawneh. “Diesel<br />
Quality in Jordan: Impacts of Vehicular and Industrial<br />
Emissions on Urban Air Quality”. Environmental<br />
Engineering Science, 25(9) 2008.<br />
11 Saleh and Al Rawashdeh. 2007.<br />
12 Cultural Heritage, Tourism, and Urban Development<br />
Project: Environmental Impact Assessment and<br />
Environmental Management Plan. Ministry of Tourism<br />
and Antiquities. Jordan. 30 November 2006.<br />
13 International Office of Migration Baghdad Governorate<br />
Profile (November 2010)<br />
14 United Nations Statistics Division and Central Bureau of<br />
Statistics, Syria. (1994 & 2004). National Census.<br />
15 Syrian Commission on Family Affairs. (2008). The State<br />
of the Population in Syria: First National Report 2008.<br />
16 Fernandes, E. (2008), ‘Informal settlements in Syria: a<br />
general framework for understanding and confronting<br />
the phenomenon’, pp.3-4. Municipal Administration<br />
Modernisation paper, September 4, 2008.<br />
17 The Municipal Modernisation Administration (2008),<br />
The Regional Spatial Development Plan for the Eastern<br />
Region. Volume 1: Written Statement, final version,<br />
August 2008. Retrieved November 29, 2010 at:<br />
18 Aleppo City Development Strategy. (2010).<br />
19 Population Division of the Department of Economic and<br />
Social Affairs of the United Nations Secretariat, World<br />
Population Prospects: The 2008 Revision and World<br />
Urbanization Prospects: The 2009 Revision.<br />
20 Government of Lebanon. (2005). National Physical<br />
Master Plan of the Lebanese Territory. Beirut:<br />
Government of Lebanon.<br />
21 Government of Lebanon. (2005).<br />
22 Government of Lebanon. (2005).<br />
23 Government of Lebanon. (2005).<br />
24 World Bank. (2010). Country Partnership Strategy<br />
for Lebanese Republic for the Period FY11-FY14.<br />
Washington D.C.: The World Bank.<br />
25 2007 Living conditions survey. (2007)<br />
26 World Bank. (2010).<br />
27 Government of Lebanon. (2005).<br />
28 Government of Lebanon. (2005).<br />
29 Government of Lebanon. (2005). National Physical<br />
Master Plan of the Lebanese Territory.<br />
30 Government of Lebanon. (2005). National Physical<br />
Master Plan of the Lebanese Territory.<br />
31 United Nations Human Settlements Programme and<br />
Global Urban Research Unit, School of Architecture,<br />
Planning and Landscape, Newcastle University, The<br />
State of Iraq <strong>Cities</strong> Report (2006-2007).<br />
32 United Nations.<br />
33 World Bank. (2006). Hashemite Kingdom of Jordan<br />
for the regional and local development project.<br />
Washington D.C.: The World Bank.<br />
34 World Bank. (2006). Hashemite Kingdom of Jordan for<br />
the regional and local development project.<br />
35 World Bank. (2006). Hashemite Kingdom of Jordan for<br />
the regional and local development project.<br />
36 Luck, T., ‘Municipality, residents prepare for Salt<br />
renaissance’. Jordan Times, August 24, 2009. xx<br />
37 CIA. (2009). CIA World Factbook: Syria. Washington<br />
D.C.: CIA.<br />
38 Aleppo City Development Strategy. http://madinatuna.<br />
com/economy/assessment#manufacturing<br />
39 Central Bureau of Statistics. (2009). Statistical<br />
Abstract. Damascus: Syria Central Bureau of Statistics.<br />
40 Central Bureau of Statistics. (2009). Statistical<br />
Abstract. Damascus: Syria Central Bureau of Statistics.<br />
41 CIA. (2009). CIA World Factbook: Syria. Washington<br />
D.C.: CIA.<br />
42 The World Bank. Egypt Urban Sector Update.<br />
Washington DC: The World Bank, 2008.<br />
43 World Bank. Egypt Urban Sector Update. Washington<br />
DC: The World Bank, 2008.<br />
44 World Bank. Egypt Urban Sector Update. Washington<br />
DC: The World Bank, 2008.<br />
45 United Nations. “The Third <strong>Arab</strong> Report on the<br />
Millennium Development Goals 2010 and the Impact of<br />
the Global Economic Crises.” New York: United Nations<br />
2009.<br />
46 Azzeh, L., “Poverty rises slightly from 2006 to 2008,”<br />
The Jordan Times, July 30, 2010.<br />
47 UNDP. Lebanon Human Development Report: Towards a<br />
Citizen’s State. 2008.<br />
48 Ababsa, 2010.<br />
49 Aleppo Informal Settlements Task Force. “Informal<br />
Settlements in Aleppo: Rapid Profiles of All Informal<br />
Settlements in Aleppo.” Municipality of Aleppo and<br />
GTZ: 2009.<br />
50 Jordan Department of Statistics. (2008). Amman:<br />
Department of Statistics.<br />
51 Dr. Erfan’s thesis.<br />
52 Iraq Labour Force Analysis 2003-2008 (January 2009),<br />
Inter-Agency Information and Analysis Unit (IAU)<br />
53 It is estimated at around 20 per cent by UNDP in 2006-<br />
2009. UNDP. Lebanon Achievements 2006-2009. New<br />
York: UNDP. http://www.undp.org.lb/communication/<br />
publications/downloads/achievements.pdf<br />
54 World Bank, 2010.<br />
55 Jordan Department of Statistics. (2004). Amman:<br />
Department of Statistics.<br />
56 CAPMAS.<br />
57 Jordan Department of Statistics. (2004). Amman:<br />
Department of Statistics.<br />
58 2007 Living conditions survey. (2007)<br />
59 Jordan Department of Statistics. (2008). Amman:<br />
Department of Statistics.<br />
60 World Bank World Development Indicators, 2009.<br />
61 Syrian Commission for Family Affairs, 2008.<br />
62 Syrian Commission for Family Affairs, 2008.<br />
63 The Henry J. Kaiser Family Foundation, 2009, www.<br />
globalhealthfacts.org/data/topic/map.aspx?ind=94<br />
64 Hammal, F. et al. (2005). ‘Settling with danger:<br />
conditions and health problems in peri-urban<br />
neighbourhoods in Aleppo, Syria.’ Environment and<br />
Urbanization, 17 (2):113-125.<br />
65 Habib, R. et al., ‘Housing quality and ill health in a<br />
disadvantaged urban community’, Public Health, 123<br />
(2): 174-181.<br />
66 Luck, T., ‘Year-long campaign to highlight health<br />
challenges posed by increasing urbanisation’. Jordan<br />
Times, April 8, 2010.<br />
67 United Nations Human Settlements Programme, Iraq<br />
National Housing Policy (2010).<br />
68 World Bank Data 2009.<br />
69 NBK Capital. “MENA in Focus.” Issue No. 73, July 6,<br />
2010.<br />
70 Hashemite Kingdom of Jordan, Department of<br />
Statistics. “Registered Marriages by Governorate,<br />
2008.”<br />
71 Fernandes, E. “Informal Settlements in Syria: a General<br />
Framework for Understanding and Confronting the<br />
Phenomenon.” Damascus: Municipal Administration<br />
Modernisation (MAM), 2008.<br />
72 United Nations Human Settlements Programme and<br />
Global Urban Research Unit, School of Architecture,<br />
Planning and Landscape, Newcastle University, The<br />
State of Iraq <strong>Cities</strong> Report (2006-2007).<br />
73 “Forced Migration: Countries with Most Refugees and<br />
the Burden on Their Populations.” The Economist, 17<br />
June, 2009.<br />
74 Ababsa, M. “The Evolution of Upgrading Policies in<br />
Amman.” Paper prepared for the 2 nd International<br />
Conference on Sustainable Architecture and Urban<br />
Development in Amman, July 2010. Amman: Institute<br />
Français du Proche-Orient, 2010.<br />
75 Soliman, A. “Diversity of Ethnicity and State<br />
Involvement on Urban Informality in Beirut”. Theoretical<br />
and Empirical Researches in Urban Management, Year<br />
3, Number 9, 2008.<br />
76 United Nations Human Settlements Programme, Rapid<br />
Land Tenure Assessment of 4 <strong>Cities</strong> in Iraq. April 2011.<br />
77 Husrieh, A.K. “The Housing Crisis: Affordability First.”<br />
Syria Today, September 2010.<br />
78 Global Property Guide. “How Long Can Lebanon’s Real<br />
Estate Boom Last?” Global Property Guide, December<br />
17, 2009.<br />
79 Global Property Guide. “Egypt’s Housing Market<br />
Recovers!” Global Property Guide, September 14, 2010.<br />
80 Global Property Guide, 2010.<br />
81 World Bank, 2005.<br />
82 USAID. “Housing Study for Urban Egypt.” USAID and<br />
TAPR II, Dec. 2008.<br />
83 Soliman, Ahmed. “Diversity of Ethnicity and State<br />
Involvement on Urban Informality in Beirut”. Theoretical<br />
and Empirical Researches in Urban Management, Year<br />
3, Number 9, 2008.<br />
84 Soliman, Ahmed. “Diversity of Ethnicity and State<br />
Involvement on Urban Informality in Beirut”. Theoretical<br />
and Empirical Researches in Urban Management, Year<br />
3, Number 9, 2008.<br />
85 Ababsa, 2010. Also, the Central Bureau of Statistics.<br />
86 UN-OCHA. “The Humanitarian Impact on Palestinians of<br />
Israeli Settlements and Other Infrastructure in the West<br />
Bank.” East Jerusalem: UN OCHA, 2007.<br />
87 UN-OCHA. “The Humanitarian Impact on Palestinians of<br />
Israeli Settlements and Other Infrastructure in the West<br />
Bank.” East Jerusalem: UN OCHA, 2007.<br />
88 Bimkom. “Planning in Jerusalem: the Implications<br />
of the New Ouline Plan of Jerusalem for Palestinian<br />
Neighbour.” December, 2009.<br />
89 UN-Habitat, ‘Gaza goes green’. October 12, 2010. Also,<br />
Palestinian National Authority (2009), The Palestinian<br />
National Early Recovery and Reconstruction Plan for<br />
Gaza 2009-2010, p.29. Also, BBC, ‘Scale of Gaza<br />
destruction emerges’. January 19, 2009.<br />
90 UN-Habitat. State of the African <strong>Cities</strong> 2008.<br />
91 Forni, N. “Land Tenure Policies in the Near East.”<br />
Rome: FAO, 2003.<br />
92 World Bank. “Doing Business 2010.” Washington,<br />
D.C.: World Bank, 2009.<br />
93 De Soto. “Dead Capital and the Poor.” SAIS Review, 21<br />
(1), 2001, 13-43.<br />
94 UN-Habitat. State of the African <strong>Cities</strong> 2010.<br />
95 Ababsa, 2010.<br />
96 Ababsa, 2010.<br />
97 ARD, 2007.<br />
98 UNHCR, UNHCR Iraq Refugee Returnee Monitoring:<br />
2011 Mid Year Report, 2011.<br />
99 World Bank. “From Privilege to Competition: Unlocking<br />
85
86<br />
ENDNOTES<br />
Private-Led Growth in the Middle East and North Africa.”<br />
Washington, D.C.: The World Bank, 2009.<br />
100 USAID, 2008.<br />
101 World Bank. “The Macroeconomic and Sectoral<br />
Performance of Housing Supply Policies in Selected<br />
MENA Countries: a Comparative Analysis of Algeria,<br />
Egypt, Iran, Jordan, Lebanon, Morocco, Tunisia and<br />
Yemen.” Washington, D.C.: The World Bank, 2005.<br />
102 World Bank. “Analysis of Housing Supply Mechanisms.”<br />
Washington, D.C.: The World Bank, 2007.<br />
103 World Bank. “Towards an Urban Sector Strategy.”<br />
Washington, D.C.: The World Bank, 2009.<br />
104 UN-Habitat. “State of African <strong>Cities</strong> 2010.” Nairobi:<br />
UN-Habitat, 2010.<br />
105 World Bank. “<strong>Arab</strong> Republic of Egypt: Towards an Urban<br />
Sector Strategy.” Washington, D.C.: 2008.<br />
106 Information on this project obtained from: Nasr, S.<br />
“Affordable Mortgage Finance in Egypt: Challenges and<br />
Prospects.” Paper presented at the Oxford Business and<br />
Economics Conference Program at Oxford, UK, on June<br />
28-30, 2010.<br />
107 Al Daly, 1999.<br />
108 Al Masri, H.A. “Property Tax Project – Jordan: Project<br />
Performance Evaluation Report.” UNDP, 2007.<br />
109 UNDP Lebanon. “The Cadastre Operations<br />
Modernization and Automation Project (COMAP.”<br />
Available online at www.undp.org.lb/programme/<br />
governance/institutionbuilding/adminreform/<br />
egovernment/comap.cfm.<br />
110 Government of Lebanon, Ministry of Finance. “Public<br />
Review of Finance 2009.” Beirut: Ministry of Finance,<br />
2009.<br />
111 Haughton, J. “An Assessment of the Tax System of<br />
Lebanon.” Boston: Suffolk University and the Beacon Hill<br />
Institute for Public Policy, 2004.<br />
112 Strategy and National Environmental Action Plan for<br />
the Syrian <strong>Arab</strong> Republic. 2003. Ministry of State for<br />
Environmental Affairs, Syrian <strong>Arab</strong> Republic.<br />
113 Fernandes, 2008.<br />
114 “How Long Can Lebanon’s Real Estate Boom Last?”<br />
Global Property Guide, December 17, 2009.<br />
115 Husrieh, A.K. “Realising the Syrian Dream.” Syria Today,<br />
September 2009.<br />
116 Husrieh, A.K. “The Housing Crisis: Affordability First.”<br />
Syria Today, September 2010.<br />
117 “New Loans Broaden Syria’s Credit Lines.” Syria Today,<br />
No. 67, December 2010.<br />
118 Zayed, D. and A. Dziadosz. “Egypt Eyes Mortgage Law<br />
to Boost Property Sector.” The African Report, 15 June,<br />
2010.<br />
119 OPIC. “$500 Million Mortgage Facility Launched in<br />
Palestine.” 2 June 2010.<br />
120 UN OCHA (2007), The Humanitarian Impact on<br />
Palestinians of Israeli Settlements and Other<br />
Infrastructure in the West Bank.<br />
121 UN OCHA (2007), The Humanitarian Impact on<br />
Palestinians of Israeli Settlements and Other<br />
Infrastructure in the West Bank, p.68.<br />
122 Misselwitz, P. & Rieneits, T. (2006), ‘<strong>Cities</strong> of collision’.<br />
The Magazine for Urban Documentation, Opinion and<br />
Theory, 5.<br />
123 World Bank Development Indicators (2007 data).<br />
124 Hamdi, M.R., Ahmed B. and Tarawneh, Z. “Diesel Quality<br />
in Jordan: Impacts of Vehicular and Industrial Emissions<br />
on Urban Air Quality”. Environmental Engineering<br />
Science, 25(9) 2008.<br />
125 Strategy and National Environmental Action Plan for<br />
the Syrian <strong>Arab</strong> Republic. 2003. Ministry of State for<br />
Environmental Affairs, Syrian <strong>Arab</strong> Republic.<br />
126 Strategy and National Environmental Action Plan for the<br />
Syrian <strong>Arab</strong> Republic. 2003.<br />
127 Hamdi, Bdour, and Tarawneh, 2008.<br />
128 World Development Indicators 2009<br />
129 WHO. “Global Status Report on Road Safety: Time for<br />
Action.” Geneva: World Health Organization, 2009.<br />
130 Lebanon Ministry of Transport, Office of Railways &<br />
Collective Transport (2007) data.<br />
131 Cultural Heritage, Tourism, and Urban Development<br />
Project: Environmental Impact Assessment and<br />
Environmental Management Plan. Ministry of Tourism<br />
and Antiquities. Jordan. 30 November 2006.<br />
132 Cairo University. “Research Study on Urban Mobility<br />
in Greater Cairo: Trends and Prospects.” Cairo:<br />
Development Research and Technological Planning<br />
Center, 2009.<br />
133 EuroMed. “Status Report on the Implementation of<br />
RTAP Rail Transport Actions in the MEDA Mashrek<br />
Countries.” 2010.<br />
134 Ghazalah, 2010.<br />
135 United Nations Human Settlements Programme and<br />
Global Urban Research Unit, School of Architecture,<br />
Planning and Landscape, Newcastle University, The<br />
State of Iraq <strong>Cities</strong> Report (2006-2007).<br />
136 World Health Organization, 2009.<br />
137 WHO, 2009; see also Elsenaar, P., and A. Sahlin.<br />
International Sustainability and Capacity Development<br />
within Sida Financed Road Safety Projects. Stockholm:<br />
Sida, 2005.<br />
138 World Bank World Development Indicators (2008).<br />
139 Cultural Heritage, Tourism, and Urban Development<br />
Project: Environmental Impact Assessment and<br />
Environmental Management Plan. Ministry of Tourism<br />
and Antiquities. Jordan. 30 November 2006.<br />
140 World Bank. “Improving Food Security in <strong>Arab</strong><br />
Countries.” Washington, D.C.: World Bank, 2009.<br />
141 Janabi, Dr. Hassan, “Water Security in Iraq,”<br />
Presentation to the UN Food and Agriculture<br />
Organization, Alexandria. 2010<br />
142 Hemming D., Betts R. and D. Ryall. 2007. Environmental<br />
Stresses from Detailed Climate Model Simulations for<br />
the Middle East and Gulf region. Report completed<br />
by the Met Office Hadley Centre for UK Ministry of<br />
Defence project “Defence and Security Implications of<br />
Climate Change.” As cited in, Brown, O. and A. Crawford.<br />
“Rising Temperatures, Rising Tensions: Climate<br />
Change and the Risk of Violent Conflict in the Middle<br />
East.” Winnipeg: International Institute for Sustainable<br />
Development, 2009.<br />
143 Bou-Zeid, E. and M. El-Fadel. 2002. “Climate Change<br />
and Water Resources in the Middle East: a Vulnerability<br />
and Adaptation Assessment.” Journal of Water<br />
Resources Planning and Management 128(5): 343-55.<br />
144 Brown, O. and Crawford A.. “Rising Temperatures,<br />
Rising Tensions: Climate Change and the Risk of Violent<br />
Conflict in the Middle East.” Winnipeg: International<br />
Institute for Sustainable Development, 2009.<br />
145 Global Water Intelligence. “Global Water Intelligence”<br />
Vol.10 Issue 11, November 2009, p.16.<br />
146 World Bank. “Improving Food Security in <strong>Arab</strong><br />
Countries.” Washington, D.C.: World Bank, 2009.<br />
147 WHO (2009), WHO Specialized Health Mission to the<br />
Gaza Strip, p.26. Agence France-Presse, “Iraq Diverts<br />
F-16 Budget for Food Rations.” February 14, 2011.<br />
148 Iraq Institute for Economic Reform. “Monetization of<br />
Food Basket.” November 21, 2004.<br />
149 International Energy Agency. 2006. World Energy<br />
Outlook 2006. Palestinian National Authority. Palestinian<br />
Central Bureau of Statistics. Census 2007. Final Results<br />
Housing Report West Bank. P.74.<br />
150 Beides, H. and H. Razavi. “Potential for Energy<br />
Integration in Mashreq and Neighboring Countries.”<br />
Washington, D.C.: World Bank.<br />
151 International Energy Agency. “World Energy Outlook:<br />
2008.” Paris: International Energy Agency, 2008.<br />
152 IAQ, Electricity in Iraq Factsheet, August 2010<br />
153 Booz and Company. “A New Source of Power: the<br />
Potential for Renewable Energy in the MENA Region.”<br />
Booz & Company, 2009.<br />
154 Strategy and National Environmental Action Plan for<br />
the Syrian <strong>Arab</strong> Republic. 2003. Ministry of State for<br />
Environmental Affairs, Syrian <strong>Arab</strong> Republic.<br />
155 Cairo University. “Research Study on Urban Mobility<br />
in Greater Cairo: Trends and Prospects.” Cairo:<br />
Development Research and Technological Planning<br />
Centre, 2009.<br />
156 Cairo University, 2009.<br />
157 Strategy and National Environmental Action Plan for<br />
the Syrian <strong>Arab</strong> Republic. 2003. Ministry of State for<br />
Environmental Affairs, Syrian <strong>Arab</strong> Republic.<br />
158 WHO. “WHO Air Quality Guidelines for Particulate<br />
Matter, Ozone, Nitrogen Dioxide and Sulfur Dioxide:<br />
Global Update 2005.” Geneva: WHO, 2006.<br />
159 United Nations Human Settlements Programme and<br />
Global Urban Research Unit, School of Architecture,<br />
Planning and Landscape, Newcastle University, The<br />
State of Iraq <strong>Cities</strong> Report (2006-2007).<br />
160 Bimkom. “Making Bricks without Straw: the Jerusalem<br />
Municipality’s New Planning Policy for East Jerusalem.”<br />
October, 2010.<br />
161 Strategy and National Environmental Action Plan for<br />
the Syrian <strong>Arab</strong> Republic. 2003. Ministry of State for<br />
Environmental Affairs, Syrian <strong>Arab</strong> Republic.<br />
162 Jamrah, A., A. Al-Omari, and R. Sharabi. 2006.<br />
“Evaluation of Traffic Noise Pollution in Amman,<br />
Jordan.” Environmental Monitoring and Assessment<br />
120(1-3): 499-525.<br />
163 “In Cairo the Noise Pollution Can Be a Killer.” Daily<br />
News Egypt January 25, 2008.<br />
164 Ghaddar, H. “Beirut’s Public Space (or lack thereof).”<br />
NOW Lebanon, July 31, 2007.<br />
165 World Bank. “Project Appraisal Document on a<br />
Proposed Loan in the Amount of USD20 Million to the<br />
Hashemite Kingdom of Jordan for the Regional and<br />
Local Development Project.” Washington, D.C.: The<br />
World Bank 2006.<br />
166 Iraq National Development Plan for the Years 2010-<br />
2014<br />
167 Belghazi, S. “Local Governance, Development and<br />
Service Delivery.” Paper delivered at the <strong>Arab</strong> States<br />
Local Governance Forum in Sana’a, Yemen, December<br />
6-9, 2003.<br />
168 UNDP. “Decentralized Governance for Development in<br />
the <strong>Arab</strong> States: a Background Paper on Decentralization<br />
and Local Governance Policies, Legal Frameworks,<br />
Programmes, Lessons Learned and Good Practices.”<br />
Dec. 2003.<br />
169 United Nations Human Settlements Programme and<br />
Global Urban Research Unit, School of Architecture,<br />
Planning and Landscape, Newcastle University, The<br />
State of Iraq <strong>Cities</strong> Report (2006-2007).<br />
170 UNDP, 2003.<br />
171 Office for the Coordination of Humanitarian Affairs.<br />
“The Humanitarian Impact on Palestinians of Israeli<br />
Settlements and Other Infrastructure in the West<br />
Bank.” East Jerusalem: UN OCHA, 2007.<br />
172 UNDP, 2003.<br />
173 UNDP-POGAR.<br />
174 Tosun and Yilmaz, 2008.<br />
175 Amin and Ebel, 2006.<br />
176 International Company for Training and Development,<br />
and Transparency International. National Integrity<br />
System Study: Egypt 2009.<br />
177 Amin, K. and Ebel R. “Egyptian Intergovernmental<br />
Relations and Fiscal Decentralization: Diagnostics and<br />
an Agenda for Reform.” Washington, D.C.: The World<br />
Bank, 2006.<br />
178 Amin and Ebel, 2006.<br />
179 Tosun and Yilmaz, 2008.<br />
180 UNDP-POGAR.
ENDNOTES<br />
181 Rishmawi, M. and T. Morris. “Overview of Civil Society<br />
in the <strong>Arab</strong> World.” Oxford: INTRAC, 2007.<br />
182 UN-Habitat. “Paper 7: Waqf (Endowment) and Islamic<br />
Philanthropy.” Islam, Land and Property Research Series,<br />
2005.<br />
183 Al-Hourani, H. “Civil Society in Jordan: a Literature<br />
Review.” Bellevue, Washington: Foundation for the<br />
Future, 2010.<br />
184 Khallaf, M. “Civil Society in Egypt: a Literature Review.”<br />
Bellevue, Washington: Foundation for the Future, 2010.<br />
185 UNDP. Lebanon Human Development Report: Towards a<br />
Citizen’s State, 2008.<br />
186 Lebanese Transparency Association. National Integrity<br />
System Study: Lebanon, 2009.<br />
187 Rishmawi and Morris, 2007.<br />
188 Government of Iraq, Law of Non-Governmental<br />
Organizations Number 12 of 2010.<br />
189 United Nations Development Programme. “The <strong>Arab</strong><br />
Human Development Report: Towards the Rise of<br />
Women in the <strong>Arab</strong> World.” New York: United Nations<br />
Development Programme, 2006.<br />
190 UNIFEM 2004 as quoted in UNDP, 2006.<br />
191 United Nations Human Settlements Programme and<br />
Global Urban Research Unit, School of Architecture,<br />
Planning and Landscape, Newcastle University, The<br />
State of Iraq <strong>Cities</strong> Report (2006-2007).<br />
192 UNDP/UNIFEM. “TOR for an International Expert on<br />
Evaluation and Women Political Participation.” February<br />
2010.<br />
193 International Labour Organization.<br />
194 De Haas, H., 2006.<br />
BOX ENDNOTES<br />
1 UNAMI SSI and various information sources in Iraq<br />
2 ABC NEWS/BBC/NHK Poll – Iraq: Where Things<br />
Stand, September 2007<br />
3 UNHCR Monthly statistical updates on return<br />
4 IOM, Baghdad Governorate Profile (November 2010)<br />
5 UNHCR monthly statistical updates<br />
6 UN-Habitat/IAU research and observation<br />
195 International Organization for Migration.<br />
196 UK Government, Foreign and Commonwealth Office.<br />
197 Committee for Development and Reconstruction.<br />
(2005). National Physical Master Plan of the Lebanese<br />
Territory, Final Report: Chapter2.<br />
198 UNDP. (2008). Millennium Development Goals:<br />
Lebanon Report 2008, p. 14.<br />
199 World Bank. 2010.<br />
200 World Bank World Development Indicators, 2010.<br />
201 World Bank World Development Indicators, 2010.<br />
202 UN-RWA. (2011). Palestinian Refugees. Gaza: UN-<br />
RWA.<br />
203 International Organization for Migration.<br />
204 UN-DESA. (2008). Trends in international migration<br />
stock: The 2008 revision.<br />
205 UN-DESA. (2008).<br />
206 UN-DESA. (2008).<br />
207 International Organization for Migration.<br />
208 Freedom House. (2010). Country Report: Lebanon.<br />
209 United States Government, Department of State.<br />
(2009). 2009 Human Rights Report: Lebanon.<br />
210 UNRWA. http://unrwa-lebanon.org/Refugees.aspx<br />
211 Freedom House. (2010). Country Report: Lebanon.<br />
212 United States Government, Department of State.<br />
(2009).<br />
213 UNHCR. http://www.unhcr.org/pages/49e486a76.html<br />
214 International Organization for Migration.<br />
215 Fawaz, M. & I. Peillen (2003). ‘The Case of Beirut,<br />
Lebanon.’ P. 16. Understanding Slums: Case Studies for<br />
the Global Report on Human Settlements 2003.<br />
216 United States Government, Department of State.<br />
7 Iraq Household Socio-Economic Survey, World Bank<br />
2007<br />
8 UN-Habitat/IAU research and observation<br />
9 Faramaoui, A. Meeting with the Director General of<br />
the Facility for Upgrading Informal Settlements, 2009.<br />
10 Municipal Administration Modernisation.<br />
(2010). Closure of the Municipal Administration<br />
(2010). 2009 Human Rights Report: Syria.<br />
217 Consultancy Within Engineering, Environmental Science,<br />
and Economics (COWI), Iraq Transport Corridor Study<br />
(ICTS), 2011.<br />
218 Roy, M.A. “Amman-Zarqa Light Rail Project Derailed.”<br />
CPCS Metro Report International, June 2009.<br />
219 ESMAP. “ESMAP Launches Program to Support<br />
Development of Energy-Efficient City Transport Plan in<br />
Jordan.” Washington, D.C.: Energy Sector Management<br />
Assistance Program (ESMAP), 2010.<br />
220 World Bank. “Economic Integration in the Mashreq.”<br />
Washington, D.C.: The World Bank, 2010.<br />
221 United Nations Economic and Social Commission<br />
for Western Asia. “Annual Review of Developments<br />
in Globalization and Regional Integration in the <strong>Arab</strong><br />
Countries, 2008.” New York City: United Nations, 2008.<br />
222 World Bank. “Sector Brief: Transportation in MENA.”<br />
Washington, D.C.: World Bank, 2008.<br />
223 World Bank. “Project Information Document (PID)<br />
Concept Stage: MNA – Mashreq Trade Facilitation<br />
and Infrastructure – Phase I.” Report No.: AB5684,<br />
Washington, D.C.: The World Bank, 2010.<br />
224 Ghzala, A. “Regional Cross-Border Trade Facilitation<br />
and Infrastructure Project for Mashreq Countries.”<br />
Presentation at the Euromed Transport Forum in<br />
Brussels, October 1, 2010.<br />
225 Contact Abdelmoula M. Ghzala, Lead Infrastructure<br />
Specialist, for update on progress; Aghzala@worldbank.org<br />
Modernisation Programme-Launching the<br />
Decentralisation and Local Development Programme.<br />
Damascus: MAM.<br />
11 Municipal Administration Modernisation. (2010).<br />
12 Municipal Administration Modernisation. (2010).<br />
13 Municipal Administration Modernisation. (2010).<br />
14 Municipal Administration Modernisation. (2010).<br />
87
88<br />
CHAPTER THREE<br />
THE STATE OF MAGHREB CITIES<br />
Tripoli, Libya. Libya is the most urbanized country in the Maghreb with nearly 78 per cent of the population living in urban areas. ©Patrick Poendl/Shutterstock
3.1<br />
Population and Urbanization<br />
The countries of the Maghreb – Algeria, Libya,<br />
Mauritania, Morocco and Tunisia – had a total<br />
2009 population of 87.9 million. 1 They are all<br />
highly urbanized. By 2030, it is estimated that Libya’s urban<br />
population will represent nearly 83 per cent of the total, while<br />
Morocco will have the lowest at 69.18 per cent. Algeria will<br />
have the largest total urban population with just over 34<br />
million residents.<br />
Total population growth rates are expected to decline to<br />
between 0.5 per cent and 1 per cent by 2030. Although the<br />
percentage of the population living in urban areas increased<br />
in the 2005 - 2010 period, urban growth rates slowed to 2.48<br />
per cent in Algeria, 2.23 per cent in Libya, 2.27 per cent in<br />
Morocco and 1.56 per cent in Tunisia. Urban growth rates<br />
will likely decline further over the next two decades. 2<br />
Despite the decreasing rate of demand for urban land,<br />
policies to channel growth and limit informal development<br />
on the urban periphery will be critical to manage the<br />
region’s cities. Only Morocco has instituted effective growth<br />
management policies by creating new towns near existing<br />
agglomerations.<br />
Urban Concentrations and Growth<br />
Most urban settlements are coastal cities. With the<br />
exception of Morocco, whose principal city is Casablanca and<br />
not the political capital Rabat, the region’s capital cities are<br />
demographically and economically dominant.<br />
However, the relative importance of primary cities has<br />
been declining as smaller cities have been expanding, with<br />
the exception of Mauritania where Nouakchott (0.8 million)<br />
FIGURE 25: URBAN SETTLEMENT AND GEOGRAPHY IN THE MAGHREB<br />
N<br />
MOROCCO<br />
MAURITANIA<br />
ALGERIA<br />
TUNISIA<br />
accounts for 25 per cent of the total population and 42 per<br />
cent of its urban population. Algeria’s two largest cities, Algiers<br />
(2.8 million) and Oran (0.8 million) contain 10 per cent of<br />
its urban population. In Morocco, Casablanca (3.2 million),<br />
Rabat/Salé (1.8 million), Fes (1 million) and Marrakech (0.9<br />
million) account for 38 per cent of the urban population. In<br />
Tunisia, Tunis and Sfax had a combined population of 1.1<br />
million residents or 16 per cent of the urban population. 3<br />
Libya is the most urbanized country with nearly 78 per<br />
cent of the population living in urban areas. Thirty-seven per<br />
cent of the urban residents are concentrated in the two largest<br />
cities of Tripoli (1.1 million) 4 and Benghazi (approximately<br />
750,000). 5 Over time, Tripoli’s share of the urban population<br />
is expected to decline to approximately 20 per cent with<br />
Benghazi and Misurata likely to grow. 6<br />
In Morocco, most of the urban areas have been expanding<br />
relatively slowly at 1 to 3 per cent from 1994 to 2004,<br />
with the most rapid growth occurring near existing urban<br />
agglomerations and along the coast. The urbanized area around<br />
Casablanca has been growing rapidly at an average annual rate<br />
of over 15 per cent from 1994 to 2004. Other urban areas in<br />
the provinces of Assa-Zag, Skhirat-Temara and Nador along<br />
the coast and in Agadir and its suburbs (Ida Ou Tanan and<br />
Inezgane-Aït Melloul) have been expanding at an average<br />
annual rate of 4-5 per cent. 7 Many of the rapidly expanding<br />
areas are located along prominent highway corridors.<br />
In Tunisia, the fastest growing areas have been on the coast<br />
near Tunis and Sousse. The governorates of Ariana and Ben<br />
Arous have been expanding most rapidly at an average annual<br />
rate of 3 to 4 per cent and they are essentially suburbs of<br />
Tunis. 8<br />
LIBYA<br />
Source: UN-DESA. 2009. World Urbanization Prospects: The 2009 revision population database. New York: United Nations.<br />
0<br />
Legend<br />
Urban Settlements over 50,000<br />
2000 Population<br />
50,000 - 500,000<br />
500,000 - 2,000,000<br />
2,000,000 - 4,500,000<br />
4,500,000 - 10,000,000<br />
1,250<br />
1,875<br />
2,500<br />
Kilometres<br />
89
90<br />
In Algeria, much of the urban expansion has occurred<br />
as sprawl around Algiers, with many of the more affluent<br />
residents migrating to the periphery with increasing car<br />
ownership. From 1987 to 2008, the land area of the city<br />
increased by almost 4 per cent per year, while the population<br />
only grew by 1.5 per cent. 9<br />
Planned Urban Expansion<br />
Urban management policies in Algeria, Morocco and<br />
Tunisia have emphasised the development of secondary cities<br />
to alleviate pressure on the primary agglomerations. As part of<br />
its 2011 National Plan, Algeria is placing a greater emphasis<br />
on the development of its secondary cities, extending,<br />
restructuring, improving and redeveloping the shanty towns<br />
created during the 1990s. In Algiers, the Grand Plan Urbain<br />
sought to create improved public transportation and new<br />
growth nodes to counterbalance the effects of sprawl. 10<br />
The General Planning Council in Libya has been developing<br />
national, regional, sub-regional and urban plans through to<br />
2030. A national spatial strategy approved in 2006 emphasizes<br />
the protection of fragile ecosystems, a reduction of internal<br />
migration from the desert to the coast and from smaller<br />
to larger cities, the development new towns in the Tripoli<br />
and Benghazi regions, the revitalization and conservation<br />
of the urban heritage and the promotion of economic<br />
diversification. 11 The implementation of these broad strategies<br />
has lagged as a result of the plans having not been adapted<br />
to account for the lack of local planning capacity as well as<br />
inadequate public participation. 12<br />
There is a critical need to coordinate national strategies<br />
with local interventions, as seen in Libya. Plans should be<br />
tailored to local conditions with participation from leaders<br />
and key stakeholders. There should be adequate capacity and<br />
financial resources to implement the strategies. In addition,<br />
there should be coordination among the centralized agencies.<br />
In Morocco, the 2008 National Spatial Strategy emphasized<br />
the development of cities as competitive engines of economic<br />
growth, promoting urban social cohesion and the efficient<br />
use of natural resources. In addition, it proposed to improve<br />
urban management practices through a better-defined<br />
allocation of complementary responsibilities between central<br />
and local governments and the creation of an interdisciplinary<br />
urban observatory to document and analyse urban economic,<br />
social and energy issues.<br />
Major interventions included national urban improvements<br />
focused on infrastructure and public space, rehousing slum<br />
dwellers through the <strong>Cities</strong> without Slums programme and<br />
the collection and treatment of solid and liquid waste. 13 A<br />
key part of the urban strategy was to steer urban growth to<br />
FIGURE 26: URBAN EXPANSION IN MOROCCO: THE CREATION OF NEW TOWNS NEAR RABAT-SALÉ, MARRAKECH, CASABLANCA AND TANGIERS<br />
N1<br />
SAFI<br />
A4<br />
N8<br />
ESSAOUIRA<br />
IBN BATTOUTA<br />
AIRPORT<br />
RABAT<br />
A4<br />
EL JADIDA<br />
N1<br />
N7<br />
TAMENSOURT<br />
NEWTOWN<br />
TANGER<br />
18 KM<br />
18 KM<br />
N16<br />
ZU<br />
MELOUSSA 1<br />
N2<br />
5 KM<br />
N9<br />
A7 N8<br />
MARRAKECH<br />
11 KM<br />
A4<br />
CHRAFATE<br />
NEWTOWN<br />
CASABLANCA<br />
PORT TANGER<br />
KSAR SEGHIR<br />
OUARZAZATE<br />
26 KM<br />
ZU<br />
MELOUSSA 2<br />
N2<br />
N9<br />
A6 N13<br />
34 KM<br />
FES<br />
CEUTA<br />
FNIDEQ<br />
M’DIQ<br />
TETOUAN<br />
CHRAFATE<br />
N1<br />
A3<br />
CASABLANCA<br />
EL JADIDA<br />
ESSAOUIRA<br />
15 KM<br />
N1<br />
N1<br />
AIN ATIQ<br />
5 KM<br />
SAHEL EL’KHAYAÎTA<br />
NEWTOWN<br />
A5<br />
8 KM<br />
A3<br />
TEMARA<br />
CASABLANCA<br />
N1<br />
A5<br />
N1<br />
TAMENSNA<br />
NEWTOWN<br />
SIDI YAHYA DES ZAER<br />
N11<br />
N9<br />
A7<br />
A3<br />
20 KM<br />
N1<br />
SETTAT<br />
N1<br />
A5<br />
RABAT<br />
10 KM<br />
N11<br />
A3<br />
BERRECHID<br />
AIN EL AOUDA<br />
MOHAMMEDIA
Fes, Morocco. Morocco has managed to reduce the population of slum (bidonville) dwellers by 65 per cent between 1990 and 2010. ©Roberto Gennaro/iStockPhoto<br />
new towns within 5 to 15 km of existing agglomerations.<br />
Four new towns near Rabat/Salé, Marrakech, Casablanca and<br />
Tangiers are under construction by Al Omrane, a publiclyowned<br />
holding company, to relocate residents of substandard<br />
housing areas and increase the supply of affordable housing.<br />
Adopted in 1997, Tunisia’s National Spatial Strategy has<br />
sought to improve the country’s international competitiveness,<br />
promote the sustainable development of natural resources<br />
and ensure social cohesion and fairness.<br />
Operationally, it intended to manage the densification<br />
of coastal cities through coordinated infrastructure<br />
improvements, relieve development pressures on<br />
environmentally sensitive areas, improve the management<br />
of scarce water resources, develop a national geographic<br />
information system accessible to stakeholders involved in<br />
urban management and promote a more efficient urban<br />
hierarchy. The improved hierarchy includes the development<br />
of secondary cities, improvement of urban infrastructures,<br />
augmentation of the contribution of urban activities to<br />
GDP and the creation of more efficient connections and<br />
relationships between urban and rural interests.<br />
The 2008-2011 Schéma Directeur d’Aménagement du<br />
Territoire for Greater Tunis laid out a plan to spur growth<br />
in the west away from the lower lying coastal areas. It also<br />
described five urban development programmes for the city.<br />
As part of the 11 th Economic Development Plan (2007-<br />
2011), the government planned to rehabilitate the medinas<br />
of Sfax, Sousse and Tunis upgrade parks and improve access<br />
to sanitation. 14<br />
Since 1995, the management of urban growth has been a<br />
national priority in Mauritania and USD 270 million have<br />
been invested in over 50 urban projects financed by multi-<br />
and bi-lateral funders as part of the CLSP (Cadre Stratégique<br />
de Lutte contre la Pauvreté – Strategic Framework to Fight<br />
Poverty): economic development; the improvement of urban<br />
infrastructure and services, with an emphasis on peri-urban<br />
informal areas; housing upgrading and the reinforcement of<br />
the urban institutional framework. Since 2003, USD 14.8<br />
million has been invested in neighbourhood improvements<br />
in Nouakchott and Nouadhibou and another USD 5.6<br />
million in the restructuring of informal settlements.<br />
91
92 3.2 The Growing Economic Role of <strong>Cities</strong><br />
<br />
Institut Supérieur des Sciences Humaines de Tunis (ISST), Tunisia. Tunisia's National Development Strategy focusses on creating centres for training and research with emphasis on the fields of<br />
science and technology. ©Rais67<br />
While Algeria and Libya are heavily dependent on<br />
their natural resources (primarily oil), Morocco<br />
and Tunisia have shifted from agriculture to<br />
industry and services, particularly tourism, reinforcing the<br />
role of their cities as engines of the national economy. Most of<br />
the major economic activities of the region are concentrated<br />
in a few cities, particularly in urban areas along the coast.<br />
Tunisian cities produced more than 80 per cent of the<br />
wealth. Tunis, the major economic and industrial pole,<br />
produced a quarter of the wealth in 2002 and had 69 per<br />
cent of the job opportunities, mainly in services. 15 Since<br />
many of Tunisia’s economic activities are located in coastal<br />
cities, the country has been trying to address this geographic<br />
imbalance by promoting inland economic development for<br />
local employment creation, especially in the traditionally<br />
labour-exporting governorates. As part of its 2006-2016<br />
industrialization strategy, it has clustered export-oriented<br />
economic activities in specialized competitive poles in<br />
selected cities.<br />
To this end, the government is upgrading the inland<br />
transportation and communication infrastructure besides<br />
providing fiscal incentives to private investors. 16 Privatelyheld<br />
companies, with a public sector capital infusion, develop<br />
the poles. The private sector is responsible for the planning,<br />
construction and management of each pole and provides<br />
support for start-up industries. 17<br />
Tunisia’s economy is dominated by services. It is the region’s<br />
most integrated country in the world economy. Integration<br />
first occurred in the early 1970s, when it created an offshore<br />
programme that attracted foreign direct investment and spurred<br />
growth in new export industries, mainly textiles and clothing.<br />
In the 1990s, Tunisia entered new markets in manufacturing. 20<br />
Exports now account for 47 per cent of GDP. By the beginning<br />
of 2010, the real national GDP growth rate had increased to<br />
4.5 per cent, primarily due to rising exports for textiles and<br />
mechanical and electrical goods, while the agricultural and<br />
energy sectors contracted. 21 Recently, the mining, energy and<br />
services sectors have been particularly dynamic.
TABLE 35: TUNISIA’S ECONOMY BY SECTOR<br />
Sector Per cent of GDP18 Per cent of Employment19 Services 53.7 49.3<br />
Industry 35.3 33.0<br />
Agriculture 11.0 17.7<br />
The 11 th National Development Strategy placed emphasis<br />
on developing the knowledge economy, upgrading the<br />
information and communication infrastructure, creating<br />
centres for training and research and placing more emphasis<br />
on the fields of science and technology. 22 Investment to<br />
improve the infrastructure in selected urban and inter-urban<br />
areas is one of the key components of the Plan. 23<br />
Most of Morocco’s economic activities and wealth are<br />
concentrated in five urban agglomerations. Eighty per cent<br />
of economic activities in industry and services are located in<br />
Casablanca, Rabat-Salé and Tangiers, These activities account<br />
for 75 per cent of urban employment. 24 Although accounting<br />
for only 10 per cent of the population, Casablanca has 60 per<br />
cent of industrial workers and 55 per cent of the country’s<br />
production units. 25 Morocco’s economy declined slightly in<br />
2009 and 2010, but it is expected to increase again in 2011. 26<br />
The economy is dominated by services, representing 51.4 per<br />
cent of GDP while industry and agriculture represent 31.6<br />
per cent and 17.1 per cent, respectively. 27 The public sector<br />
and industry each account for 20 per cent of urban jobs. Most<br />
of the urban population is employed in trade, construction<br />
and public works, social services, administration, the<br />
textile industry, personal and domestic services and other<br />
manufacturing. 28<br />
In recent years, Morocco has become better integrated<br />
in the world economy through the impacts of bilateral and<br />
regional free trade agreements: Euro-Med, Greater <strong>Arab</strong> Free<br />
Trade Area (GAFTA), the U.S. Free Trade Agreement, the<br />
Agadir Agreement and the Turkey Free Trade Agreement.<br />
With its limited exposure to the world economy, Libya<br />
has only been marginally affected by the economic crisis.<br />
Although real GDP growth declined in 2009 due to falling<br />
commodity demand and lower OPEC quotas, it rebounded<br />
to 7.4 per cent in 2010 and is expected to decline by 19 per<br />
cent in 2011 due to the negative economic impacts of the<br />
conflict. Oil production is expected to increase to 3 million<br />
barrels per day by 2012-2013. 29 Non-oil growth has remained<br />
at a very high 6 per cent in 2009 and is expected to increase<br />
further to 7-8 per cent.<br />
Its economy is dominated by hydrocarbons, which represent<br />
95 per cent of export earnings, 90 per cent of government<br />
revenues and 70 per cent of GDP. In order to diversify the<br />
economy and reduce unemployment, Libya has made an effort<br />
to reduce the economic importance of the public sector and<br />
promote private sector investments in construction, solar and<br />
wind power generation, sustainable agriculture and tourism. 30<br />
From 2005 to 2008, foreign direct investment increased<br />
fourfold. 31 It has successfully sought public investments to<br />
expand and improve its infrastructure and housing stock.<br />
Most of Libya’s economic activities are concentred in<br />
Benghazi and Tripoli. To attract private sector initiatives in<br />
the future, the government plans to reform the administrative<br />
and legal systems 32 and invest in infrastructure (USD 123<br />
billion over five years 33 ) to create better geographic economic<br />
balance. One of the top priorities, particularly in urban areas,<br />
is to provide 1.5 million additional jobs by 2030. 34<br />
In Algeria, the economy is focused on oil production.<br />
Despite strong growth in the non-mineral sector, particularly<br />
in agriculture which grew by 17 per cent in 2009 due to<br />
the availability of credit free loans, good rainfall, the<br />
elimination of farm debt and new production contracts<br />
from the government 35 , the economy declined by 0.2 per<br />
cent from 2.4 per cent in 2008 to 2.2 per cent 2009. This<br />
was primarily as the result of a 9 per cent decrease in oil<br />
production at the request of OPEC. To reduce dependence<br />
on oil, the government is also promoting fishing, tourism,<br />
services and industry. 36<br />
As in other countries in the region, most Algerian economic<br />
activities are located in the capital city: 23 per cent of public<br />
servants, two major universities, four major industrial zones<br />
and 26 business parks. 37 To reduce the pressure on the<br />
central city, the government has created regional economic<br />
development plans to spur growth outside the capital.<br />
At the end of 2010, a majority of the urban workforce was<br />
employed in services (62.4 per cent), followed by construction<br />
and public works (17.8 per cent), industry (15.3 per cent)<br />
and agriculture (4.5 per cent). In addition, the majority of<br />
the workforce was employed by a private or mixed entity (62<br />
per cent) as compared to the public sector (38 per cent). 38 The<br />
2010 activity rates varied significantly for males and females<br />
and from urban to rural.<br />
In Mauritania, 80 per cent of construction employment,<br />
60 per cent of manufacturing, and the majority of public<br />
sector jobs are located in Nouakchott.<br />
City Marketing and Related Incentives<br />
Many Maghreb countries are deemed to have unfriendly<br />
foreign investment environments due to high corporate tax<br />
rates, complicated legal environments and limited access to<br />
land, electricity and finance. Governments have instituted<br />
such reforms as reducing the corporate tax, establishing<br />
TABLE 36: DIFFERENCES IN MALE-FEMALE LABOUR PARTICIPATION<br />
IN ALGERIA<br />
Location Male Female<br />
Urban 67.5% 16.3%<br />
Rural 71.5% 9.9%<br />
Source: Office National des Statistiques.<br />
93
94<br />
<br />
In Tunisia the port of Sousse has been upgraded to help stimulate investment. ©Marcin Ciesielski/iStockPhoto<br />
offshore programs that provide businesses with attractive<br />
incentives and fiscal advantages, better governance and<br />
improved infrastructures.<br />
Morocco created the Social and Economic Development<br />
Program 2008-2012 to support access to education,<br />
health and housing and enhance growth, investment and<br />
export potentials, focusing on key sectors, and improving<br />
support infrastructure (transportation, information and<br />
communication technologies, energy) and more efficient<br />
governance. 39 To market its cities, Morocco advertises its<br />
skilled workforce and offers incentives to investors. In Tunisia,<br />
the city of Sousse has recently improved its port and created<br />
a technology centre 40 and Sfax has invested in improved<br />
infrastructure.<br />
Unemployment<br />
Despite the steady rise in per capita income, unemployment<br />
remains a major challenge in the region, primarily affecting<br />
youth, women and university graduates because employer<br />
demand and labour force skills do not match. In Morocco,<br />
urban unemployment (12.7 per cent in 2010) has been higher<br />
than rural unemployment (3.3 per cent in 2010). 41 Urban<br />
unemployment has disproportionately affected the younger,<br />
more educated segments of the population.<br />
In Algeria in 2010, the unemployment rate was 10.6 per<br />
cent in urban areas and 8.7 per cent in rural areas. Young<br />
people accounted for the bulk of urban unemployment: 35<br />
per cent of the active population under 20 years, 30 per<br />
cent of the 20-24 age group and 22 per cent of the 25-29<br />
age group were looking for work in 2007. Taken together,<br />
those under 30 years of age account for 71 per cent of<br />
urban unemployment, with females accounting for 25.6 per<br />
cent. 42 By the end of 2010, urban unemployment has also<br />
disproportionately affected those with higher degrees. 43<br />
In Tunisia, urban unemployment rates of around 15 per<br />
cent have historically been lower than the rural rates of 15-18<br />
per cent and higher for females than males. 44 Unemployment<br />
has remained high at 13 per cent in 2010 45 and primarily<br />
affects the young and the educated as most of the labour<br />
demand is for unskilled workers, while 57 per cent of new<br />
entrants into the labour market have university degrees. In<br />
spite of the government’s strategy to promote knowledgeintensive<br />
sectors to provide employment opportunities for<br />
TABLE 37: UNEMPLOYMENT RATES IN ALGERIA AT THE END OF 2010<br />
Gender Urban (%) Rural (%)<br />
Male 8.6 7.2<br />
Female 18.8 20.1<br />
Source: Office National des Statistiques-Algérie. (2011)
Madrasah pupils in Mauritania where educational enrolment is the lowest in the region. ©Ferdinand Reus. Licensed under the Creative Commons Attribution-Share Alike 2.0 Generic license.<br />
better educated and higher skilled workers, the development<br />
of the sector has lagged. 46<br />
Despite of a positive growth trend in recent years,<br />
Mauritania’s economy has not been able to generate sufficient<br />
employment to absorb new entrants, particularly those with<br />
a technical or professional degree and urban unemployment<br />
is estimated at 32 per cent of the labour force (39.1per cent<br />
among the urban poor) and was concentrated among the<br />
young. 47 The public sector continues to be the country’s<br />
major employer (32 per cent) followed by trade (24.6 per<br />
cent), agriculture and animal husbandry (24.5 per cent) and<br />
services (15 per cent).<br />
High rates of unemployment, particularly for the younger<br />
and better-educated segments of society, contributed to the<br />
uprisings in late 2010 and 2011. The demands of the market<br />
and the skills of the labour force have not been congruent.<br />
This was further complicated as opportunities to enter<br />
Southern Europe had become more restrictive and higherskilled<br />
workers who had typically found employment abroad<br />
were unable to migrate.<br />
Education<br />
With the exception of Mauritania, educational enrolment<br />
and attainment in the region is high, particularly in urban<br />
areas. In Morocco, national net primary school enrolment<br />
rates were 93.5 per cent in 2007. Enrolment rates for middle<br />
school and upper secondary school were 43.4 per cent in<br />
2007 and 17.5 per cent in 2007 for upper secondary school. 48<br />
Literacy rates vary significantly from urban to rural areas. 49<br />
In Morocco, literacy among urban residents age 10 and older<br />
was 71 per cent, as compared with 42 per cent in rural areas<br />
with better access to education in urban areas. 50<br />
In Tunisia, the enrolment rate for primary school reached<br />
97.4 per cent for both males and females in 2007/2008. 51<br />
In the same period, gross enrolment rate for secondary<br />
education was 88 per cent for males and 96 per cent for<br />
females and 27 per cent of males and 40 per cent of females<br />
for tertiary education. 52 In Tunis, the schooling rate of the<br />
6-14 population was 97.8 per cent and the higher education<br />
rate among the 19-24 population was 30.7 per cent. 53<br />
In 2010, Libya achieved universal primary school enrolment<br />
and 94 per cent secondary enrolment. Tertiary educational<br />
enrolment rates reached over 56 per cent in 2009. The<br />
gains in education are primarily the result of the oil wealth<br />
accumulated in recent years. 54<br />
In Algeria, the gross enrolment rate for primary education<br />
was 108 per cent in 2008 and, at 80-90 per cent, was relatively<br />
high at the secondary level. In urban areas, the enrolment rate<br />
was 96.7 per cent for children ages 6-14 and the literacy rate<br />
was 93.5 per cent. 55 For the population 10 years and older, it<br />
was 87.7 per cent in Algiers and 84.2 per cent in Oran. 56<br />
In Mauritania, according to the 2008 poverty profile,<br />
literacy among the 15 + population rose from 57.5 per cent in<br />
95
96<br />
2004 to 61.5 per cent in 2008; it was higher for men (70.3<br />
per cent) than for women (54.4 per cent) and greater for the<br />
those living in urban areas (73.3 per cent) than in rural (50.3<br />
per cent) 57 .<br />
Health<br />
A continuing, albeit diminishing, differential access to<br />
clean water sources and the concentration of health services<br />
in cities are reflected in differential rates of infant mortality<br />
between urban and rural areas. Most Maghreb countries have<br />
surfeits of doctors in urban areas and shortages of health care<br />
workers in rural and peri-urban areas. 58<br />
In Tunisia and Morocco, infant mortality rates vary from<br />
16 to 33 per 1,000 live births in cities to 30 to 55 per 1,000<br />
live births in rural areas, respectively. 59 In Tunisia, five of the<br />
11 hospitals, 14 of the 21 specialized institutes and centres<br />
and 49 of the 2,083 basic health centres are located in Tunis.<br />
In Algeria, the proportion of births assisted by a qualified<br />
professional was higher than in rural areas. The prevalence of<br />
underweight children under-five was 3.1 per cent for cities<br />
and 4.4 per cent for rural areas and the percentage of children<br />
that experienced diarrhoea over a two-week period was 8.5<br />
per cent in cities and 9.3 per cent in rural areas. 60<br />
Tourism<br />
Most of the governments in the Maghreb region have been<br />
promoting tourism, which is primarily concentrated in the<br />
coastal cities. In 2009, three Moroccan cities received 71<br />
per cent of the tourists: Marrakech, Agadir and Casablanca.<br />
Morocco has recently undertaken a regional tourism<br />
development plan with the goal of increasing hotel occupancy<br />
rates to 58 per cent by 2015. Investments will improve<br />
infrastructure and rehabilitate the historic medinas and the<br />
most-visited sites.<br />
Most of the tourism in Tunisia (75 per cent) is located along<br />
the coastline; 61 an estimated 18 per cent of the coastline is<br />
dominated by tourist activities, primarily resorts and second<br />
homes. 62 Foreign arrivals increased by about nine per cent<br />
from 2009 to 2010, mainly from France, Libya and Algeria.<br />
Although the number of night stays increased in 2010, the<br />
receipts for tourism declined. 63 Libya has been promoting<br />
tourism and, in 2007, announced the creation of a green<br />
sustainable development area between Benghazi and Tobruk to<br />
attract eco-tourists, protect the archaeological sites and prevent<br />
overdevelopment of its Mediterranean coast. The investment<br />
of USD 3 billion is expected to generate 70,000 new jobs. 64<br />
In Algeria, the government launched in 2008 a 15-year<br />
plan for tourism development, which has focused on niche<br />
tourism in the desert (Tamanrasset, Djanet, Chardaia and<br />
Timimoun), in coastal cities and in the cultural sites of<br />
Annaba, Algiers, Oran and Constantine. The government<br />
plans to create 280 new hotels and 14 tourism villages and<br />
has invested in a National School of Tourism as well as other<br />
training institutions.<br />
Incentives to attract private investors include reduced<br />
land prices and infrastructure improvements such as the<br />
proposed southwest loop rail line and the development of new<br />
airports. Lower interest rate loans are available for tourism<br />
modernization projects as well as such fiscal incentives as<br />
reducing the value added tax from 17 per cent to 7 per cent<br />
and exempting companies from registration fees. 65 From 2000<br />
to 2008, revenue from tourism increased by nearly 37 per cent.<br />
Urban Poverty, Inequality and Vulnerable<br />
Groups<br />
The poverty rate in Algeria, Mauritania, Morocco and<br />
Tunisia is two to three times higher in rural areas than in<br />
cities. In Morocco, nearly 70 per cent of poverty is rural<br />
and, in 2007, the urban poverty rate was only 4.8 per cent<br />
as compared to 14.5 per cent in rural areas. 66 From 2001 to<br />
2007, both the urban and rural poverty rates fell: by 2.8 per<br />
cent in urban areas and 10.6 per cent in rural areas. However,<br />
it is estimated that over 26 per cent of the population is in<br />
poverty or vulnerable to it. 67<br />
In Tunisia, poverty rates declined from 4.1 per cent in<br />
1980 to 1.0 per cent in 2000. 68 In Mauritania, in spite<br />
of significant gains since 2000, the national incidence of<br />
extreme poverty was 25.9 per cent in 2008, 59.4 per cent<br />
in rural areas and 7.7 per cent in cities. In Nouakchott, the<br />
percentage of the population living below the poverty level<br />
dropped from 29.2 per cent in 2000 to 15.6 per cent in 2008,<br />
while the population living in extreme poverty dropped from<br />
13.8 per cent to 4.8 per cent. 69<br />
With the exception of Morocco, urban inequality has been<br />
relatively low with urban Gini coefficients ranging from<br />
0.34 to 0.39. In recent years, unlike other countries in the<br />
region such as Tunisia, where inequality has been decreasing,<br />
inequality in both urban and rural areas has been increasing. 70<br />
Inequality in Casablanca has been particularly high with a<br />
Gini coefficient of 0.52.<br />
In Mauritania, whose Gini coefficient rose significantly<br />
from 0.34 in 1996 to 0.40 in 2008, according to 2008 survey<br />
data, 11.7 per cent of urban households ‘always’ and 20.3<br />
per cent ‘often’ experience difficulties in satisfying their basic<br />
food needs. In Nouakchott, these figures are 12.6 and 17.2<br />
per cent respectively. 71
3.3<br />
Urban Development and Housing Conditions<br />
Securing affordable housing in the region continues<br />
to be a challenge and many residents obtain housing<br />
in the informal markets. To address this challenge,<br />
governments have upgraded existing informal and slum<br />
areas and constructed new units to provide more affordable<br />
options, which is critical given that housing affordability has<br />
been one of the contributing factors to the uprisings in the<br />
<strong>Arab</strong> world.<br />
Informal Urbanization and Responses<br />
Both Morocco and Tunisia have successfully addressed<br />
the challenge of informal urbanization through vigorous<br />
interventions including housing upgrading and the<br />
construction of affordable housing.<br />
Since the 1980s, Morocco reduced the number of bidonvilles<br />
(shantytowns) and upgraded slum areas by constructing new<br />
housing units and providing serviced land.<br />
In 2003, the government gave the private sector more<br />
responsibility for the provision of affordable housing and<br />
provided credit to lower-income families who had not<br />
previously had access to credit. In 2005, the government<br />
launched the <strong>Cities</strong> without Slums programme that upgraded<br />
250 neighbourhoods in 25 cities through a participatory<br />
process. It focused on areas with high unemployment,<br />
limited access to services and poor housing conditions. The<br />
holding company Al Omrane has played a major role in the<br />
<strong>Cities</strong> without Slums programme. (See Box 12 overleaf).<br />
<br />
Election time in Tunis, Tunisia. Tunisia, the first country in the <strong>Arab</strong> world to hold elections since the start of the <strong>Arab</strong> Spring, has made massive strides in eliminating urban slums.<br />
©Nataliya Hora/Shutterstock<br />
97
98<br />
BOX 12: TUNISIA & MOROCCO - SLUM UPGRADING AND HOUSING DEVELOPMENT EXPERIENCES ARRU AND AL OMRANE MODELS<br />
<br />
Salé, Morocco. Al Omrane slum upgrading in Sidi Moussa. ©Bertramz. Licensed under the Creative Commons Attribution-Share Alike 3.0 Unported license.<br />
Since the early 1980s, Tunisia and Morocco<br />
have established programmes to reduce the<br />
number of slums, expand affordable housing<br />
opportunities and improve the provision of<br />
urban services. Today, Tunisia has essentially<br />
eliminated all bidonvilles (slums) through a<br />
programme managed by the public enterprise,<br />
Agence de Réhabilitation et de Rénovation<br />
Urbaine (ARRU).<br />
ARRU was established under the Ministry<br />
of Equipment, Housing and Land Use<br />
Planning. Its mandate is to renovate and<br />
rehabilitate urban areas and promote real<br />
estate development. Since its inception, ARRU<br />
has acted to control urban sprawl, improve<br />
conditions in the older districts, regularise<br />
substandard fringe settlements, offer loans<br />
for housing construction and improvements<br />
and provide basic services including potable<br />
water, sanitation, schools and health facilities,<br />
especially to the urban poor. 1 From 2002 to<br />
2009, ARRU spent over USD 72 million on<br />
urban projects that have improved living<br />
conditions for 1,140,000 people.<br />
The success of these interventions can be<br />
attributed to ARRU’s effective coordination of<br />
public authorities, specifically its willingness to<br />
cooperate and collaborate with local agencies.<br />
This is particularly important as decentralization<br />
has devolved functions and responsibilities<br />
to local authorities and given them a more<br />
prominent role in planning and management.<br />
ARRU has also formed partnerships with the<br />
private sector to ensure effective and efficient<br />
implementation of programs and projects.<br />
About 65 per cent of the funding for ARRU’s<br />
projects targeting lower income families<br />
originates from the National Solidarity Fund.<br />
Through this fund, municipalities can borrow<br />
money to complete local infrastructure<br />
projects and community facilities as well as<br />
transfer funds to ARRU to undertake projects.<br />
The remaining support comes from the<br />
Housing Fund, government departments and<br />
the private sector.<br />
Morocco has initiated a forceful intervention<br />
to resettle bidonville dwellers and managed<br />
to reduce the number of slums by 65 per cent<br />
from 1990 to 2010 2 . Al Omrane, established<br />
in 2004, is a government-owned holding<br />
company that has integrated the functions<br />
previously held by three different government<br />
agencies (Agence Nationale de Lutte Contre<br />
l’Habitat Insalubre-ANHI, Attacharouk Co.<br />
and Société Nationale d’équipement et de<br />
construction-SNEC). It acts through 14 regional<br />
subsidiaries and its activities include four major<br />
programmes:<br />
<br />
housRehousing bidonville dwellers (cities<br />
without slums);<br />
<br />
provinces; and<br />
<br />
Through these projects, Al Omrane has<br />
rehoused families from makeshift dwellings,<br />
upgraded underserviced neighbourhoods,<br />
regularised land tenure in informal settlements<br />
and developed new towns and urban<br />
expansion zones, with a significant portion of<br />
land dedicated to affordable housing.<br />
From 2004 to 2009, Al Omrane completed<br />
724,000 housing units which included<br />
rehousing of 143,000 families living in shacks,<br />
increasing the number of cities and towns<br />
without slums to 38. Through 2009, the<br />
cumulative cost of the programme was MAD<br />
35.9 billion (USD 4.6 billion). In 2009, the<br />
holding company completed 176,843 housing<br />
units (114,459 for urban and rural upgrading<br />
activities commissioned by the national<br />
and local authorities, 9,627 produced in<br />
cooperation with the private sector and 52,757<br />
for Al Omrane’s own production). It re-housed<br />
18,300 families living in shacks.<br />
In 2010, Al Omrane programmed the<br />
construction of 107,400 units, of which 33,000<br />
are earmarked for lower income residents<br />
(units at MAD 140,000 or USD 17,800),<br />
37,200 for moderate-income households and<br />
37,200 for sale at market rate. The market rate<br />
units will cross-subsidize the units allocated<br />
to the lower-income households. 3 Al Omrane<br />
planned to rehouse 30,000 families living in<br />
shacks, adding another 24 cities and towns to<br />
the cities without slums list.
BOX 13: RETURNING TO THE COMPACT CITY?<br />
<br />
Returning to the compact city in Cairo: The fabric of Bab el Wazir, established 800 years ago (left), compared with that of Fostat Plateau (Ezbet Kheirallah), established informally in<br />
the 1980s (right)<br />
Observers of traditional urban forms have<br />
frequently pointed to the medieval <strong>Arab</strong> city,<br />
from Fes to Aleppo, as supreme representations<br />
of the dense, compact, specialized, multifunctional<br />
and livable city. The medina remnants<br />
are as attractive and much appreciated today as<br />
they were in medieval times. However, starting<br />
in the late-19 th and accelerating throughout<br />
the 20 th century, this traditional and dense<br />
urban form became viewed as a backward<br />
and unacceptable holdover - the antithesis of<br />
modern living.<br />
The creation and reproduction of the city<br />
under Modernist planning theory, based on<br />
urban functional segregation, private carorientation<br />
and low-density spatial layouts<br />
became the norm almost worldwide, pushed<br />
further by imported concepts of zoning,<br />
satellite towns and mega-projects. With its<br />
rampant land speculation, convenient desert<br />
hinterlands and the resulting sprawl, today’s<br />
<strong>Arab</strong> city has become a horizontal one,<br />
apparently without spatial expansion limits.<br />
Starting in the 1990s, when faced with<br />
many unforeseen impacts of the Modernist city<br />
such as depopulated city centres, debilitating<br />
traffic congestion, urban air pollution and<br />
undesirably fragmented cities, Western<br />
planners and urban theorists ‘discovered’<br />
the compact city as a viable alternative to<br />
the seemingly unstoppable trend towards<br />
ever more sprawling, regimented, suburban,<br />
amorphous and ultimately dysfunctional<br />
metropolises. There has even been talk of<br />
compactness as ‘the new urban paradigm’<br />
since the concept dovetails well with notions<br />
of low-carbon, sustainable urban development<br />
and the inclusive/equitable city.<br />
In 2003, the United Nations Global<br />
Compact <strong>Cities</strong> Programme was created to<br />
translate the principles of compactness into<br />
everyday urban governance and management.<br />
Although considered a global trend, the main<br />
interest in and discussion of compactness<br />
was firmly rooted in evolving Western planning<br />
philosophies, especially in Australia, parts of<br />
Europe and the US where modern examples of<br />
urban compactness were few and far between.<br />
But the compact city remains alien to most<br />
of today’s <strong>Arab</strong> planners, businessmen and<br />
municipal officials, who continue to shape their<br />
cities towards ever more disbursed and sterile<br />
urban landscapes, dotted with shopping malls,<br />
gated communities, car show rooms, tract<br />
suburbs and mega urban highways. In Gulf<br />
cities, even the relatively dense downtown<br />
areas created in the 1950s and 1960s are now<br />
being pulled down with glee, to be replaced<br />
with glass towers planted in a sea of vacant lots<br />
and parking garages that are all void of human<br />
scale and any <strong>Arab</strong> identity.<br />
In Egypt, a penchant for disbursed, distancedefying<br />
and function-segregated new towns in<br />
the desert started in the 1970s. This trend has<br />
not abated despite the fact that practically no<br />
one lives in them. The 2006 Census of Egypt<br />
revealed that, after 30 years of huge investments<br />
and national urban policy orientation, the<br />
combined population of all these new towns<br />
did not exceed 800,000 persons - less than<br />
six months of the country’s average population<br />
increase. Likewise in Morocco, where the state<br />
developer Omrane is proceeding headlong with<br />
the creation of satellite dormitory towns miles<br />
and miles from existing cities.<br />
Trends germinated in the West are taken to<br />
their extremes in many <strong>Arab</strong> countries. Thus<br />
we have Masdar in Abu Dhabi, a compact,<br />
clean, carbon-neutral town and, parenthetically,<br />
an outrageously expensive showcase of high<br />
Source: Sims, David, Understanding Cairo: the Logic of a City Out of Control; Cairo: AUC Press, 2010, page 117<br />
technology. <strong>Arab</strong> architects and designers<br />
talk about applying traditional <strong>Arab</strong> city design<br />
principles. Wind tower embellishments are all<br />
the vogue but these are mere tiny blips on the<br />
screen of the modern <strong>Arab</strong> cityscape.<br />
It is ironic that, in some <strong>Arab</strong> countries,<br />
common citizens are quietly creating huge<br />
compact neighbourhoods themselves. These<br />
are dense, inclusive, vibrant, energy-efficient<br />
and multi-functional urban neighbourhoods<br />
where the street is the centre of life.<br />
They are called ‘informal settlements’ and,<br />
considered overcrowded and illegal, they are<br />
rejected as urban managers’ worst nightmare.<br />
Nevertheless, they are a defining feature of<br />
many and of even the most renowned <strong>Arab</strong><br />
cities. There are already 12 million inhabitants<br />
of informal areas in Greater Cairo alone, and 75<br />
per cent of the additions to Cairo’s population<br />
are finding homes there.<br />
This is not some aberration that can be<br />
wished away. It is the future of Cairo and many<br />
other <strong>Arab</strong> cities.<br />
Does this mean that there is an ongoing<br />
return to the compact city in the <strong>Arab</strong> world?<br />
The answer is a definite ‘Yes’ despite the fact<br />
that informality is in many ways rejected out of<br />
hand, especially by elitist urban professionals.<br />
One should not interpret this trend as a<br />
recommendation that urban informality is the<br />
desired future of the <strong>Arab</strong> city. Rather, we<br />
should read this as a clear message that the<br />
sterile Modernist city is being rejected by the<br />
urban dwellers as neither affordable nor the<br />
social habitat of choice. There are lessons to<br />
be learned from informal urban development.<br />
And given the rapidity with which <strong>Arab</strong> cities<br />
are growing today, we better learn fast and<br />
apply the implications of the lessons provided<br />
by our citizens.<br />
99
100<br />
Tunisia has also essentially eliminated urban slums through<br />
its Société Nationale Immobilière Tunisienne (SNIT) and its<br />
Agence de Réhabilitation et de Rénovation Urbaine (ARRU).<br />
Established in the 1980s, SNIT is a government-owned<br />
company whose production of affordable housing peaked<br />
at 15,000 units a year during the Sixth Plan (1982/86).<br />
Production had decreased to 1,000 from 1,500 units per year<br />
by 2002.<br />
As of 2004, less than 1 per cent of the population<br />
was classified as living in substandard housing and the<br />
government’s focus shifted to infrastructure improvements<br />
and upgrading. ARRU is the agency primarily responsible<br />
for the upgrading efforts. (See Box 12, p.98). In spite of the<br />
elimination of slums, informal settlements, particularly in<br />
Tunis, remain a challenge and it is estimated that around 30<br />
per cent of housing production is informal. 72<br />
Morocco views new towns as a key component of its urban<br />
strategy to relieve congestion in existing cities and shape urban<br />
growth in areas that are experiencing strong urbanisation<br />
pressures. Four new towns are currently under construction<br />
near Casablanca, Tangiers, Rabat-Salé and Marrakech. 73<br />
Their purpose is to:<br />
<br />
bidonville dwellers as well as provide social housing<br />
to improve the living conditions of lower income families;<br />
<br />
infrastructure projects; and<br />
<br />
Lower-priced housing units are affordable through a<br />
combination of subsidies and low interest loans. Buyers of<br />
low-cost units are eligible for mortgages guaranteed by the<br />
Fonds de Garantie pour les Revenus Irréguliers et Modestes<br />
(FOGARIM), an agency created in 2004 to encourage banks<br />
to provide long-term credit to lower-income individuals. By<br />
mid-2009, the Fund had guaranteed 48,000 loans worth<br />
MAD 7 billion (USD 890 million).<br />
Despite a growing housing shortage in Libya, the<br />
government has not generated a substantial amount of<br />
affordable housing units since the 1980s. Most of the new<br />
housing construction has been for high-income households,<br />
including for expatriates from Egypt and Sudan. 74<br />
In Algeria, the Ministry of Housing and Urbanism<br />
launched a slum-reduction strategy in 1999 that focused on<br />
slum reduction through the rehabilitation of lower-income<br />
housing and provision of land to house marginalized groups.<br />
The government has upgraded infrastructure and regularized<br />
land registration in informal settlements. The policy has<br />
included 65 sites in 11 wilaya, with a total population of<br />
172,057. 75<br />
A parallel urban improvement plan demolished over<br />
12,000 precarious housing units from 2006 to 2008. The<br />
government also has plans to build 1.2 million housing units,<br />
including 340,000 public rental units, to help eradicate the<br />
remaining 561,000 precarious housing units. 76<br />
Mauritania’s 2008 poverty profile uses two classifications<br />
for housing: standard and precarious (that is tents, shacks,<br />
sheds, etc.); 32.5 per cent of the stock was classified as<br />
precarious in 2008; in Nouakchott alone, 38,800 households,<br />
or 24.3 per cent of the population, lived in precarious<br />
neighbourhoods on the urban fringe. 77<br />
In spite of a growing government commitment to improving<br />
urban conditions – water distribution, sewage collection and<br />
treatment and solid waste management – scarce resources<br />
and the preponderance of substandard housing has limited<br />
progress. As of 2008, 70 per cent of urban households still<br />
bought water from private distributors and the daily per<br />
household water consumption in Nouakchott’s low income<br />
neighbourhoods was only 18 litres. 78 Over 95 per cent of<br />
households were not connected to the sanitary system.<br />
Despite its limited impact, the most innovative programme<br />
developed in Mauritania simultaneously addressed housing<br />
improvements and poverty reduction (see Box 14).<br />
Housing Supply and Affordability<br />
The supply of affordable housing in the Maghreb is<br />
insufficient to meet the demand of lower-income households.<br />
Supply is primarily constrained by government ownership<br />
of land, complicated property registration systems and<br />
development regulations that discourage the construction of<br />
rental units.<br />
In Algeria, formal private investment in housing has been<br />
impeded by the government’s inability to release land to<br />
meet the growing demand of its cities and provide adequate<br />
financing. 79 A middle-income family in Algeria would have<br />
to save its household income for nine-12 years to afford an<br />
average dwelling 80 and meeting the demand for housing by<br />
low- and even middle-income families has been left to the<br />
informal sector. 81<br />
The current government provides an 80 per cent tax<br />
rebate on land sold for housing and a tax rebate that benefits<br />
higher- and middle-income residents. Only 14 per cent of<br />
the funding allocated to housing supports activities target the<br />
lowest quintile of the population. 82<br />
In Morocco, in spite of the achievements of Al Omrane<br />
programmes, the urban housing deficit is still estimated at<br />
over a million units (one-third of the stock). In 2007, 610,000<br />
households lived in shantytowns and 450,000 households in<br />
dilapidated dwellings or unserviced settlements.<br />
The shortage of affordable housing has pushed lower-income<br />
households to the urban periphery. Over 30 per cent of urban<br />
housing construction starts are located on agricultural land<br />
in the urban fringe. In Greater Casablanca, for example, the<br />
average density was 71 households per hectare in the city and<br />
21 in the urbanised periphery.<br />
In Tunisia, affordable land development has been<br />
inadequate and although the total housing supply has been<br />
sufficient, there is an endemic shortage for low-income<br />
families. 83 Growth of informal settlements is continuing<br />
despite the near eradication of slums in Tunisia. As shown in<br />
Table 38, it is apparent that formal housing is unaffordable<br />
for lower-income residents.
BOX 14: MAURITANIA’S TWIZÉ PROGRAMME<br />
<br />
Nouakchott, Mauritania has needed to accommodate vast numbers of eco-migrants. ©Attila Jandi/Shutterstock<br />
In the 1970s and 1980s, severe droughts and<br />
desertification in the Sahel region destroyed the<br />
nomadic way of life in Mauritania and spurred<br />
significant eco-migration to Nouakchott and<br />
Nouadhibou, the two largest cities. From<br />
1977 to 2000, the population in Nouakchott<br />
increased from 134,700 to approximately<br />
728,600, with an average annual growth rate of<br />
over 7 per cent. Nouadhibou almost quintupled<br />
from 21,900 in 1997 to 107,900 in 2000. 4<br />
The cities had to accommodate large<br />
influxes of nomadic people settling on the<br />
urban periphery. 5 The Twizé programme was<br />
conceived to alleviate the hardships endured by<br />
the settlers and manage chaotic urban growth.<br />
In 1998, Groupe de Recherches et d’Échanges<br />
Technologiques (GRET), a professional solidarity<br />
and international cooperation association,<br />
established the Twizé programme to improve<br />
access to affordable housing and living<br />
conditions for lower-income residents and<br />
poor eco-migrants. In 2003, the programme<br />
expanded with financial support from the World<br />
Bank and the government. GRET, in collaboration<br />
with the Mauritanian Commissariat aux Droits<br />
de l’Homme, à la Lutte Contre la Pauvreté, et<br />
à l’Insertion, the municipality of Nouakchott<br />
and non-governmental organizations (NGOs),<br />
prioritized regularization of land tenure, access<br />
to microcredit for housing improvements and<br />
the creation of microenterprises, training and<br />
capacity building initiatives for community<br />
members and infrastructure improvements. 6<br />
The initial pilot project demonstrated that<br />
marginalized settlements could be transformed<br />
into viable neighbourhoods. At the end of the<br />
first phase, the 130 families who participated<br />
in the pilot had managed to double the size<br />
of their homes and increase the value of the<br />
land and structure by a factor of four. Loan<br />
repayment rates were very high (close to 100<br />
per cent). 7<br />
Following the termination of the World Bank<br />
funding (USD 15 million over five years), the<br />
project ended in 2008. Rising construction and<br />
infrastructure costs substantially increased<br />
the subsidies needed to cover the widening<br />
gap between the affordability of the target<br />
group and the cost of land and housing.<br />
The construction cost of the basic module<br />
quadrupled between 1998 and 2005 from<br />
MUR 110,000 (USD 390) to MUR 400,000<br />
(USD 1,413.43). Despite the doubling of<br />
participants’ contributions, the subsidies<br />
provided increased from 27 to 60 per cent<br />
of the total cost, eroding the programme’s<br />
financial viability. 8<br />
Although the programme ended in 2008,<br />
it was not without its achievements. At the<br />
conclusion of the programme, 6,500 houses<br />
had been constructed. Residents indicated<br />
that they felt safer and more financially<br />
secure. They were also able to divert money<br />
saved on housing to start or expand incomegenerating<br />
activities and eventually purchase<br />
other assets. The programme enhanced the<br />
skills of the masons constructing the dwellings<br />
and improved communication among the<br />
labourers, creditors and beneficiaries. It<br />
provided skills training for workers in a variety<br />
of fields, including craftsmanship and textiles<br />
as well as literacy training. 9<br />
The programme facilitated the mobilization<br />
and involvement of residents in the planning<br />
process. 10 The property titles issued and the<br />
permanent construction and investments in the<br />
homes encouraged residents to settle in that<br />
location, reducing the repeated displacement of<br />
poor families further out to the urban periphery<br />
in a rapidly expanding urbanized area. 11<br />
Twizé offered a model of partnership<br />
between national and local governments,<br />
communities, development organizations<br />
and NGOs, providing technical assistance<br />
and capacity building. In its early phases, it<br />
worked remarkably well. It underscored the link<br />
between organized settlements and poverty<br />
alleviation.<br />
Rising costs far outstripped the<br />
affordability of residents and local authorities<br />
and undermined the sustainability of the<br />
programme’s operational modalities, which<br />
were not adjusted to respond to the growing<br />
imbalance. However, the partnership concept<br />
to address the challenge of urban poverty<br />
alleviation and social inclusion by improving<br />
the lives of slum dwellers remains a valid<br />
and effective approach towards achieving the<br />
Millennium Development Goal Target 11.<br />
101
102<br />
TABLE 38: AVERAGE RENTS AND SALES PRICES<br />
Regionally, access to housing and affordability varies<br />
significantly by income category. The top 20 per cent of income<br />
earners secure housing on the private market. The second<br />
quintile require access to below market interest rates housing<br />
finance that is usually provided by governments to cooperatives<br />
and other groups willing to develop their own housing.<br />
Cooperatives are usually given priority in the allocation of<br />
state-owned land designated for urban residential development.<br />
The third and fourth quintiles access land either through<br />
government-subsidized programs offering housing units and<br />
serviced sites or on the informal land market. Households<br />
in the poorest 20 per cent are unable to enter the informal<br />
land markets and can only access land through the illegal<br />
occupancy of undesirable parcels of land with the hope of<br />
gaining eventual security through prescription rights or the<br />
regularization of their tenure. Undesirable sites such as steep<br />
slopes and flood prone lowlands are prime destinations. The<br />
alternative is renting one or two rooms in an informal area at<br />
inordinately high rents.<br />
Young families have been particularly affected by high urban<br />
land prices, forcing them to live with their parents or in older,<br />
Tunis Marrakech Casablanca<br />
Average rent/m² USD 11 - 13 USD 10.49 - 12.89 USD 9.37 - 12.70<br />
Average sales price/m² USD 2,100 - 4,100 USD 1,994 - 2,489 USD 1,710 - 3,072<br />
National GDP per capita USD 3,907 USD 2,748 USD 2,748<br />
Source: Global Property Guide<br />
<br />
Algiers. In Algeria, the largest country in the Maghreb, access to housing finance is limited. ©Pichugin Dmitry/Shutterstock<br />
more crowded sections of the city. In Libya, men are delaying<br />
marriage until they can find an adequate apartment. 84<br />
A study of six cities in Morocco (Rabat/Salé, Casablanca,<br />
Marrakech, Fes, Benguerir and Azrou) showed that the<br />
lowest income quartile spent 24 per cent of total income<br />
on housing, more than the 20 per cent spent by the upper<br />
quartile. 85 Forty-three per cent of households had access to<br />
housing credit, both formal and informal. The largest source<br />
of funding for home improvements came from savings<br />
(approximately 60 per cent), followed by family help and a<br />
formal loan. Most residents wanted to invest in furniture and<br />
household appliances, followed by painting and fixing walls<br />
or the floor. 86<br />
Mortgages have been available in Tunisia since the early<br />
1980s and in Morocco since the mid-1980s and are becoming<br />
more readily available in Algeria. However, families who have<br />
not participated in the formal finance system and who lack<br />
guarantees do not have access to housing finance.<br />
In Morocco, since 2002 there has been an effort to<br />
increase access to microfinance for housing improvements.<br />
As of 2004, 12 microfinance agencies served 403,950 clients,
BOX 15: ISLAMIC PRINCIPLES AND LAND: OPPORTUNITIES FOR ENGAGEMENT<br />
ISLAMIC<br />
Introduction and<br />
Brief Overview<br />
LAND TOOL<br />
DEVELOPMENT<br />
The Global Land Tool Network (GLTN) aims to<br />
establish a continuum of land rights, rather than just<br />
focus on individual land titling; improve and develop pro<br />
poor land management, as well as land tenure tools;<br />
unblock existing initiatives; assist in strengthening<br />
existing land networks; improve global coordination on<br />
land; assist in the development of gendered tools which<br />
are affordable and useful to the grassroots; and improve<br />
the general dissemination of knowledge about how to<br />
implement security of tenure.<br />
Most land, property and housing issues<br />
faced by Muslim societies are not dissimilar<br />
to those encountered elsewhere, but<br />
strategies and tools often need to be<br />
adapted to these specific contexts. About<br />
20% of the global population is Muslim<br />
(including significant minorities in the<br />
West and elsewhere) which is influenced<br />
to varying degrees by Islamic land principles,<br />
either through official systems or<br />
informal practices. 1 This impacts land<br />
management systems as well as security of<br />
tenure in various parts of the Muslim<br />
world. However, global approaches to<br />
secure tenure rarely acknowledge that several<br />
Islamic land principles potentially<br />
offer opportunities for enhancing property<br />
rights. The objective of the Global<br />
Land Tool Network (GLTN) Islamic Land<br />
Tools initiative is to facilitate the development<br />
of innovative, pro-poor and gendered<br />
Islamic land tools which could be<br />
used appropriately in specific contexts.<br />
Three broad challenges face tool development<br />
in the Muslim world. First, the crystallisation<br />
of positive strategies from the<br />
Islamic land discourse, and best practices<br />
from the Muslim world, need to inform the<br />
tool development process. Second, there is a<br />
need to prioritise specific Islamic tools<br />
which can be innovative, pro-poor, gendered,<br />
affordable and scalable. Third, interface<br />
between the various actors i.e tool<br />
developers, grassroots, civil society, States,<br />
development partners and scholars – is<br />
needed to harmonise universal, Islamic and<br />
professional land principles. This mechanism<br />
proposes how this could be done.<br />
Operationalising Land Tool<br />
Development<br />
Islamic land tool development is not a preference<br />
for religious discourse over universal<br />
or secular land approaches. It is a pragmatic<br />
strategy which could enhance the knowledge<br />
and augment the capacity of GLTN<br />
partners to work more effectively in Muslim<br />
contexts. Though Islamic principles are<br />
1 Sait, S and Lim, H (2006) Land, Law and Islam: Property and Human Rights in the Muslim World (London: ZED).<br />
influential, they intersect in dynamic ways<br />
with State, customary and international<br />
norms. Hence, their relationship with<br />
other systems of formal and informal land<br />
tenure needs further study. In clarifying<br />
Islamic principles and developing effective<br />
tools, injurious cultural practices carried<br />
out in the name of religion could be countered.<br />
Yet, Islamic land tools, even in<br />
Muslim countries, cannot be a substitute<br />
for the continuing process of universal or<br />
generic land tool development. The complimentarily,<br />
role or appropriateness of<br />
Islamic tools depends on particular<br />
demands and contexts.<br />
There is an increasing demand for authentic<br />
land solutions and tools in several<br />
Muslim countries. Where there are enduring<br />
Islamic land practices, a range of tools,<br />
including Islamic tools, need to be considered.<br />
Reviews of property rights in Muslim<br />
societies (including among European<br />
Muslims) have pointed to several critical<br />
gaps. Whether it be funding through<br />
Islamic finance or models such as Islamic<br />
Over 20 per cent of the world’s population<br />
is influenced to varying degrees by Islamic<br />
principles and practices, either through official<br />
systems or informal practices. Among other<br />
areas, Islamic principles are impacting on land<br />
and property. Despite their wide geographical<br />
spread and relevance, they are often neither<br />
sufficiently documented nor aligning informal<br />
and statutory systems. These shortfalls can<br />
negatively impact on land management<br />
systems and security of tenure.<br />
Land systems and tenure approaches<br />
across the globe rarely acknowledge that<br />
some Islamic principles can offer opportunities<br />
for enhancing property rights. Just as with<br />
customary and informal land rights, there is a<br />
need to better understand these approaches<br />
and get a more comprehensive picture on how<br />
land is managed in different contexts.<br />
The elements inherent to Islamic principles<br />
and relevant to land can have many practical<br />
ISLAMIC ISL IS AMIC<br />
LAND LA LAN LAAND TOOL DEVELOPMENT<br />
DEV<br />
on Islamic Land Tools 4 endowments (waqf), there are distinctive<br />
. It specifically calls on<br />
approaches. Equally, locating women’s UN-HABITAT as focal point and GLTN<br />
property rights and inheritance within to garner regional and international support<br />
Islamic principles is challenging. and resources to consolidate and further<br />
promote the development of Islamic land<br />
tools. Among the endorsers of the study<br />
include the Al Azhar, the leading Islamic<br />
institution and the Government of Egypt.<br />
However, it is proposed that like customary<br />
tools, the development of Islamic land<br />
tools not be seen as an internal matter but<br />
a cross-cultural, interdisciplinary and<br />
global effort. The ownership of the<br />
process by Muslims is important. Equally,<br />
civil society and development partners<br />
must contribute to a process that is inclusive,<br />
objective, systematic and transparent.<br />
Professionalizing the Process<br />
The process needs to be representative,<br />
focused, constructive and non-ideological.<br />
Every Islamic professional tool undergoes<br />
the rigorous process as do other tools.<br />
Therefore, consultations between representative<br />
groups of professional tool developers,<br />
civil society, Islamic scholars, policy<br />
makers and development partners are<br />
needed. Specific inputs of GLTN partners<br />
will stimulate Islamic tool development.<br />
Harmonisation of universal and Islamic<br />
principles, objectives and values enables<br />
systematic identification, upscaling, development<br />
and evaluation of Islamic tools.<br />
The Islamic tool development process generally<br />
follows the stages similar to develop-<br />
2 Little is<br />
known about existing Islamic land tools<br />
but more information can lead to their up<br />
scaling alongside systemic development of<br />
new tools in response to the gaps.<br />
Research on Islamic<br />
Land Tools<br />
UN-HABITAT has completed the first<br />
phase of research on Islamic Land Tools<br />
(2004-2005) through web publications,<br />
creation of research database and preliminary<br />
consultations with partners. A pioneering<br />
UN-HABITAT report of<br />
September 2005 carried out by University<br />
of East London explores eight themes -<br />
land theories, law, human rights, land<br />
tenure arrangements, inheritance,<br />
women’s rights, endowments (waqf) and<br />
microfinance. 3 endowments (waqf), there are distinc<br />
ing other types of land tools, adjusted to its<br />
approaches. Equally, locating wom<br />
distinctive sources, needs and sensitivities.<br />
property rights and inheritance wit<br />
The relationship between Islamic and<br />
Islamic principles is challenging. other tools will be explored in order to<br />
facilitate valuable cross-fertilisation<br />
through best practices. The main players<br />
will be the community groups including<br />
grassroots women, tool developers, State<br />
officials and development partners with<br />
the addition of Islamic scholars and<br />
Muslim communities and institutions.<br />
The process will be realised through the<br />
GLTN by the following steps:<br />
1. Facilitating Islamic Tool Networking<br />
2. Reviewing Land Tool Frameworks<br />
3. Conducting Islamic Research<br />
and Analysis<br />
4. Determining Priority Land Tools<br />
5. Promoting Islamic Land Tools Dialogue<br />
6. Mobilising Tool Support of<br />
Member States<br />
It points to a range of<br />
7. Evaluating Islamic Land Tools<br />
strategies which could potentially<br />
empower vulnerable categories such as<br />
In operationalising the Islamic land tools<br />
the landless, urban poor, women and<br />
initiative the Global Land Tool Network<br />
squatters. Several influential concepts<br />
needs dialogue, partnership, methodologies,<br />
such as ijtihad (reasoning), maslaha (pub-<br />
expertise and resources. GLTN partners and<br />
lic interest) and ‘adl (justice) generate<br />
its development partners, who already work<br />
approaches which can assist the construc-<br />
in these areas, could provide leadership and<br />
tion of workable tools including those<br />
direction in order to ‘authenticate’ tools.<br />
which support women’s rights.<br />
This tooling approach could result in far<br />
reaching changes in the protection of land,<br />
At the <strong>Arab</strong> Regional Meeting in December<br />
housing and property rights in the Muslim<br />
2005, experts adopted the Cairo Initiative<br />
societies all over the world.<br />
2 Littl<br />
known about existing Islamic land to<br />
but more information can lead to their<br />
scaling alongside systemic developmen<br />
new tools in response to the gaps.<br />
Resear arch on Islamic<br />
Land Too Toools UN-HABITAT has completed the<br />
phase of research on Islamic Land T<br />
(2004-2005) through web publicatio<br />
creation of research database and preli<br />
nary consultations with partners. A p<br />
neering UN-HABITAT report<br />
September 2005 carried out by Univer<br />
of East London explores eight them<br />
land theories, law, human rights, l<br />
tenure arrangements, inheritan<br />
women’s rights, endowments (waqf)<br />
microfinance. 3 It points to a range<br />
strategies which could potenti<br />
empower vulnerable categories such<br />
the landless, urban poor, women<br />
squatters. Several influential conce<br />
such as ijtihad (reasoning), maslaha (p<br />
lic interest) and ‘adl (justice) gene<br />
approaches which can assist the constr<br />
tion of workable tools including th<br />
which support women’s rights.<br />
At the <strong>Arab</strong> Regional Meeting in Decem<br />
2005, experts adopted the Cairo Initia<br />
2 See for example Moors, A. (1995) Women, Property Prop and Islam: Palestinian Experience, 1920-1990 (New York: Cambridge University Press)<br />
3 UN-HABITAT (2006) Islam, Land & Property Propert Series http://www.unhabitat.org/programmes/landtenure/publications.asp<br />
4 Adopted at the Workshop on Land Tenures at the t <strong>Arab</strong> Ministerial Meeting on Urbanisation, Cairo, December 17-18, 2005. It was hosted by the Government of Egypt<br />
and organised by United Nations Economic an and Social Commission for Western Asia (ESCWA), UN-HABITAT, and the League of <strong>Arab</strong> States.<br />
Photos: Rasna Warah, Olav Saltbones/UN-HABITAT, photos.com ph<br />
Contact Information io<br />
For further information, please contact conta the Global Land Tool Network Secretariat:<br />
GLTN Secretariat, Land and Tenure Te Ten Te Tenure Section, S UN-HABITAT, P.O. Box 30030 Nairobi 00100, Kenya, Tel. +254 (0)20 762 31 16<br />
Fax. +254 (0)20 762 42 56, 6 Email: Ema m il: gltn@unhabitat.org<br />
gl<br />
most of whom were women (49-68 per cent depending on<br />
the organization). It is estimated that there are significant<br />
opportunities for growth, as about 50 per cent of the urban<br />
population are potential users of microfinance. 87<br />
In Algeria, where the value of the housing deficit is<br />
equivalent to 25 per cent of GDP and loans account for only<br />
1.5 per cent of GDP, the government is targeting low-income<br />
families and providing them with better access to credit. 88<br />
However, housing finance remains limited.<br />
As a result of public policies aimed at affordable rental<br />
housing through public ownership and rent controls, private<br />
owners of older buildings have delayed maintenance or kept<br />
applications. This is not to say that religious<br />
discourse should necessarily be preferred over<br />
universal or secular land approaches, but it<br />
rather suggests a pragmatic strategy where<br />
Islamic land principles may complement or<br />
offer authentic land solutions in some contexts.<br />
There is no single unified and systematic<br />
field of Islamic land law. However, those<br />
working with Muslim communities recognize<br />
key features drawn from various Islamic<br />
sources relating to land. Protection of property<br />
rights is in general recognized under Shari’a<br />
as a priority and state policy must operate to<br />
promote it. Islamic law is therefore important<br />
for land tenure in Muslim societies. Whether<br />
or not their states ‘officially’ implement Islamic<br />
principles, land tenure regimes and concepts<br />
are generally constructed and realized with<br />
reference to the Shari’a. While Islamic countries<br />
share a common culture, they nevertheless<br />
demonstrate diversity in applying Islamic law<br />
through different methods, mechanisms and<br />
legal practices. It is therefore important to note<br />
that Islamic principles relevant to land are not<br />
necessarily the same throughout the Muslim<br />
world and may vary, even within countries.<br />
The Global Land Tool Network (GLTN), with<br />
its secretariat at UN-Habitat, has established<br />
innovative, pro-poor, scalable and gendersensitive<br />
land management and land tenure<br />
tools (www.gltn.net). It elaborates a range<br />
of activities such as promoting research and<br />
disseminating materials on land, supporting<br />
documentation of tools and best practices,<br />
developing innovative methodologies and<br />
approaches, organizing workshops and<br />
consultations, facilitating a wide range of<br />
stakeholder inputs and strengthening capacity<br />
through training. GLTN recognizes the demand<br />
for targeted tools, including culturally or<br />
religiously formatted tools, as there are many<br />
positions and approaches to conceptualizing<br />
and delivering secure tenure and access to<br />
land.<br />
GLTN’s work on Islamic dimensions of land<br />
began in 2004 with the commissioning of<br />
research leading to Sait and Lim’s Land, Law<br />
and Islam: Property and Human Rights in the<br />
Muslim World (London: Zed Press/UN-Habitat,<br />
2006) which was endorsed by leading Muslim<br />
and non-Muslim stakeholders including the<br />
seat of Islamic scholarship, the Al-Azhar in<br />
Egypt. Based on this research, a training<br />
course on Islamic Land, Property and Housing<br />
Rights in the Muslim World was produced in<br />
2010 and piloted by GLTN in cooperation with<br />
the University of East London. In 2011 a short<br />
booklet to accompany these products was<br />
launched. The Network is now rolling-out the<br />
products based on demand.<br />
their properties vacant. Alternatively, they have diverted<br />
their investments to more profitable sub-markets, such as<br />
expatriates. In Libya, for example, there was a 36 per cent<br />
decrease in the number of available rentals in 2010, 89 while<br />
rising prices have made the rental market less accessible to<br />
lower-income residents. 90<br />
Urban Land Markets, Tenure and Property Rights<br />
Tenure systems in the Maghreb region, although rooted in<br />
Shari'a law, have been heavily influenced by the legal systems<br />
introduced under European colonial rule that increased<br />
103
104<br />
individual property rights and allowed foreigners to own real<br />
estate. After independence, several countries nationalized<br />
property formerly owned by foreigners, adding large areas<br />
to the public reserves. More information on the history of<br />
land tenure and the historic layers of the Maghreb cities is<br />
available in the 2010 The State of African <strong>Cities</strong> 2010 report. 91<br />
Generally, the urban land market is divided between<br />
individual owners, the government and religious<br />
organizations. In historic centres, estates known as waqf<br />
or habous deeded for charitable, educational or religious<br />
purposes comprise as much as 20 to 40 per cent of properties<br />
and are managed by ministries of awqaf. Once designated<br />
as waqf land, properties cannot be changed to private<br />
ownership. Many organizations can no longer manage these<br />
properties or generate revenues from them, leading to the<br />
deterioration of the historic fabric.<br />
Private land tenure is unevenly divided between freeholds,<br />
usufructs and leaseholds. Individual freehold is the<br />
predominant form of urban land tenure but much of the<br />
urban land is also held in joint ownership, as result of Shari'a<br />
inheritance laws.<br />
Although this is more common in rural areas, urban land<br />
tenure also includes usufruct rights where someone other than<br />
the owner has the use of the property for an extended period<br />
of time. Urban residents can also secure land rights through<br />
long-term leaseholds that give the lessee full ownership<br />
rights to all of the improvements made to the property over<br />
a specific time period. 92 They can also hold derivative rights,<br />
including the right of habitation in a dwelling and the right<br />
of use of commercial premises in a structure owned by other<br />
parties.<br />
In the Maghreb region, the state owns all land not privately<br />
owned, including deserts, forests, wastelands and vacant<br />
unclaimed land, or roughly 20 to 30 per cent of the total<br />
land area. 93 In recent years, governments have been taking a<br />
more active role in directing urban growth to the state-owned<br />
lands, particularly on the urban peripheries in Morocco.<br />
Property rights in some Maghreb countries are fairly<br />
limited. For an index where the greatest level of property<br />
rights is designated as 100, Morocco ranked 40, Algeria<br />
ranked 30 and Libya ranked 10, all far behind other countries<br />
in the region. 94 In Libya, the government abolished property<br />
rights in 1978, limiting private ownership to one dwelling<br />
per family, and redistributed the surplus. It was also illegal<br />
for persons to lease residential property and collect rent. The<br />
restriction on renting the dwelling was later relaxed as were<br />
other regulations when the country began to feel the effects<br />
of United Nations sanctions. 95<br />
Titling and Registration<br />
Titling and registration of property in the Maghreb region<br />
is a costly and cumbersome process that includes notarial<br />
and registration fees, land fees, and transfer taxes, among<br />
others. 96 As a result, many housing transactions simply occur<br />
before a notary public and much of the urban land remains<br />
unregistered, making it very difficult to track ownership.<br />
About 80 per cent of the urban land in Morocco is not<br />
formally registered, limiting the ability of owners to access the<br />
mortgage market as banks do not accept unregistered land as<br />
collateral. 97 In Algeria, only about one-third of all properties<br />
have been registered with the L’Agence National du Cadastre. 98<br />
The lack of full registration increases the challenge of effective<br />
urban planning. Simpler procedures and the introduction of<br />
a nationwide improved registration technology are expected<br />
to increase the percentage of registered properties. 99<br />
Urban Land and Fiscal Policy<br />
Land is the most rapidly appreciating asset in the Maghreb<br />
region, doubling every three years since 1970. The prevailing<br />
rates of appreciation of land values obviously encourage<br />
speculation. In an attempt to control speculative investments<br />
that drive up land values, governments are revising existing<br />
property taxes, instituting taxes on vacant land and<br />
repossessing allocated serviced land in new urban areas if not<br />
developed within two or three years.<br />
Today, when both productive and beneficial uses of the<br />
property are taxed, the burden falls primarily on the formal<br />
real estate and business sectors. The urban expansion of recent<br />
years has not resulted in a commensurate increase in taxproducing<br />
assets because of the lag in property registration,<br />
particularly in informal settlements.<br />
In Morocco, two taxes are levied on the appraised rental<br />
value: a flat 10 per cent tax, and another on increases in the<br />
property value. In Tunisia, the area of both occupied and<br />
unoccupied urban land parcels is taxed at 2 per cent of the<br />
assessed value. Vacant undeveloped land is now taxed at its<br />
potential capital value.<br />
In Mauritania, the rapid urbanisation that followed the<br />
droughts of the 1970s outstripped the ability of government<br />
to manage urban growth and the regularisation of periurban<br />
informal developments has not kept up with their<br />
creation. Lack of cadastral information and cumbersome<br />
legal procedures have hampered the transfer of property<br />
titles to occupants while a lack of clarity of planning<br />
responsibilities and financial resources have prevented local<br />
authorities from developing and implementing growth<br />
management policies.<br />
While all regional capitals were directed to adopt<br />
Simplified Master Plans (Schémas Directeurs Simplifiés) in<br />
2008, none have been approved by the national authorities<br />
and only Nouakchott has an enforceable set of planning<br />
regulations. Property-based local revenues are minimal and<br />
further hamper the ability of local governments to provide<br />
basic infrastructure, particularly to the informal settlements<br />
on the urban fringe where most of the urban growth is<br />
concentrated.
3.4 Urban Mobility<br />
<br />
The Société Nationale des Chemins de Fer Tunisiens (SNCFT) is the national railway of Tunisia, a country investing heavily in its rail network. ©Rais67.<br />
Licensed under the Creative Commons Attribution-Share Alike 3.0 Unported license.<br />
Mass Transportation<br />
Given prevailing income levels, the Maghreb region’s<br />
people have traditionally walked or taken public<br />
transit. In Algiers, two-thirds of all motorized trips<br />
are made by bus and rail, and less than a quarter by private<br />
car. In Casablanca, 50 per cent of motorized trips are by public<br />
transit and 30 per cent by car 100 Public investments in mass<br />
transit have not kept pace with urbanization. Vehicles are<br />
overcrowded, travel times are long and schedules uncertain.<br />
In Tunis, average bus speeds have fallen to 10 km/h due to<br />
congestion. Compared with Latin America, where there are<br />
over 1,000 buses per one million inhabitants, Casablanca<br />
only has 433, Rabat-Salé 361, Fes 239, Tangier 107 and Tunis<br />
508 buses. 101<br />
Public transportation as a share of motorized transit in<br />
Tunis fell from 68 per cent in 1977 to 40 per cent in 2002. 102<br />
By 2010, the bus and tram system accounted for 38 per<br />
cent of motorized trips while 58 per cent were made by car.<br />
Similarly, 60 per cent of motorized passenger trips are made<br />
by car in Tangier and the remainder by public and private<br />
buses and taxies.<br />
In many cases, public transit is provided through privatelyoperated<br />
shared taxis, mini- or microbuses and vans. In<br />
Tangier and Algiers, taxies and minibuses serve a critical<br />
function in urban mobility, comprising 90 per cent of mass<br />
transit vehicles. At the same time, the large numbers of<br />
vehicles, many of which are over 10 years old, contribute to<br />
the problems of congestion and air pollution.<br />
As with many public services, urban mobility management<br />
is highly centralized, with responsibilities split between<br />
ministries of urban transport, roads, and railroads. With<br />
105
106<br />
no single agency charged with mobility planning and<br />
management, and capacities constrained at both local and<br />
national levels, urban transportation has deteriorated.<br />
Algeria, plagued by civil war from 1991 to 2002, was<br />
unable to implement long-term infrastructure plans, while<br />
in Libya, public transportation received little attention until<br />
recently since a culture of cheap fuel and private motorization<br />
prevails. Reforms have been implemented to create dedicated<br />
transport authorities in Morocco and Tunisia, under state<br />
supervision, but they are as yet incipient.<br />
Public transportation has suffered from significant<br />
underinvestment because, as a result of subsidized fares,<br />
government-run transportation agencies have endemic<br />
operating budget deficits and are therefore unable to expand<br />
or renew their rolling stock. One study of 24 cities in<br />
Morocco in 2006 showed that they had invested an estimated<br />
31 per cent of the funds needed for their transportation<br />
infrastructure. 103<br />
Governments are increasingly aware of the importance of<br />
urban mobility planning and have formulated plans to build<br />
new subways, light rail, trams, and high-speed rail. While<br />
these projects will bring important improvements, their cost<br />
and long gestation period diminish their ability to influence<br />
current spatial development trends.<br />
Tunis was one of the first cities in the region to develop an<br />
urban transportation master plan, approved in 1999 and designed<br />
to strengthen the existing light rail metro systems and<br />
develop a new network of regional rail, some of it high-speed.<br />
The first component of the high-speed rail network obtained<br />
funding in 2010 but will take decades to complete. Its long<br />
time horizon and integration with the city’s spatial plans allowed<br />
the government to purchase land for future projects at<br />
lower costs. Today, its light rail system, the first of its kind in<br />
Africa, comprises five lines and 47 stations over 32 kilometres.<br />
FIGURE 27: PERCENTAGE OF REGISTERED MOTOR VEHICLES BY CATEGORY, 2007 106<br />
Morocco<br />
Tunisia<br />
Libya<br />
0% 10% 20% 30% 40% 50% 60% 70% 80% 90% 100%<br />
Motorcars Minibuses/vans Trucks Motorized 2-3-wheelers Buses Non-motorized vehicles Other<br />
Source: WHO “Global Status Report on Road Safety: Time for Action”, 2009<br />
<br />
A common traffic sign in Moroccan cities: No entry for horse/donkey-pulled carts.<br />
©Tonkie/Creative. Licensed under the Creative Commons Attribution-Share Alike 3.0 Unported license.
Algiers will launch a metro system in 2012, the second of its<br />
kind in Africa after Egypt. The city is also constructing a 23 km<br />
tramway system that, although not connected with the subway,<br />
is envisaged to serve an estimated 185,000 people per day<br />
upon completion. Two other major rail projects are underway<br />
in Algeria, including an 8 km light rail line with 11 stations<br />
in Constantine and an 18 km tramway with 32 stations in<br />
Oran, both set to be launched in 2011 or 2012. Tripoli is also<br />
planning a 104 km subway system with 73 passenger stations,<br />
which is anticipated to be launched in 2016.<br />
In 2011, Morocco launched its first tramway, at a cost of<br />
USD 450 million. The 31-station line connects Morocco’s<br />
capital Rabat and the nearby city of Salé with a combined<br />
population of around 3 million people. Casablanca has<br />
developed an ambitious transportation plan with a time<br />
horizon of 2030 for a 160 km network based on four tram<br />
lines, a suburban rail line and a metro subway line. The<br />
first phase of the project, a 28 km tramway serving major<br />
universities, hospitals and business districts and built at a cost<br />
of around USD 750 million, will be launched in 2012.<br />
Individual Mobility<br />
While walking still remains the prevalent means of<br />
transportation, accounting for 50 per cent of the modal<br />
split in Tunis and 56 per cent in Algiers and Tangier, the<br />
rapid expansion of urbanized areas increasingly necessitates<br />
motorized mobility options. With the exception of Libya, the<br />
rate of motorization across the Maghreb is still relatively low<br />
compared with the world average, but is rapidly increasing.<br />
In Algiers, there were 100 private vehicles per 1,000 people<br />
in 2010, up from 69 in 1990; in Tunis, 102 in 2010, up from<br />
64 in 1994. 104<br />
<br />
Operational taxis in Nouakchott, Mauritania. ©Guido Potters<br />
The trend towards individualized transport has been spurred<br />
by the deterioration of public transport and national policies<br />
aimed at increasing private car ownership. The government of<br />
Tunisia, for instance, provided tax breaks and other credits to<br />
facilitate car ownership in the 1990s, while Algeria liberalized<br />
car imports to promote car ownership. In Algiers the number<br />
of private vehicles tripled from 1995 to 2009, while public<br />
transport vehicles increased by a mere 36 per cent. 105 In<br />
addition, Libyan and Algerian fuel costs are below the world<br />
average, while cheap automobiles for domestic consumption<br />
are manufactured in Tangier.<br />
Extensive road networks across the Maghreb have also<br />
supported the demand for private cars. Together, Algeria,<br />
Libya, Morocco and Tunisia have over 268,000 km of roads,<br />
around 57 to 70 per cent of which is paved. Mauritania’s<br />
surfaced road system is still embryonic and primarily<br />
concentrated in Nouakchott.<br />
Road Safety<br />
Road fatality rates in the Maghreb, as in the rest of Africa,<br />
are among the highest in the world. Regionally, more than<br />
11,800 people died in traffic accidents in 2007 and almost<br />
180,000 were injured. Libya has the third highest fatality rate<br />
in the world, with 40.5 people killed per 100,000 inhabitants;<br />
Tunisia (34.5), Morocco (28.3) and Algeria follow closely. 107<br />
In comparison, the world average was 20.8 fatalities per<br />
100,000, and 10.3 among high-income countries. While<br />
around 50 to 60 per cent of accidents involved motorised<br />
vehicles, 15 per cent of traffic fatalities in Libya, 28 per cent<br />
in Morocco and 32 per cent in Tunisia were pedestrians,<br />
highlighting the need to enhance the safety of sidewalks and<br />
crosswalks. 108<br />
107
108 3.5 Urban Environmental Challenges<br />
The Challenge of Water Scarcity<br />
All Maghreb countries are water stressed, with Algeria,<br />
Libya and Tunisia each having total resources of less<br />
than 500 m 3 /capita, and Morocco less than 1,000<br />
m 3 /capita. Algeria, Morocco and Tunisia already exploit 47<br />
to 65 per cent of renewable water resources but Libya is<br />
withdrawing eight times more water than is renewed. 109<br />
While both desalination of seawater and fossil aquifer water<br />
sources under the Sahara can be tapped, their development<br />
can be prohibitively expensive in countries where water tariffs<br />
are already among the highest in the <strong>Arab</strong> world. Today, in<br />
line with policies to ensure some measure of food security,<br />
60 to 95 per cent of water in the Maghreb is used for<br />
agriculture. 110 With the region’s population growing at 1.0 to<br />
1.8 per cent annually and expanding consumption in urban<br />
areas, all Maghreb countries face difficult tradeoffs between<br />
water security and food security.<br />
Recognizing the importance of preserving agricultural<br />
productivity both for food security and to slow rural-urban<br />
migration, governments have developed diverse plans to<br />
promote irrigation efficiency, in addition to promoting urban<br />
water reuse and greater use efficiency.<br />
In Morocco, the 2008 Green Plan proposes to make<br />
agriculture the country’s main economic engine in the next<br />
ten to 15 years by increasing private investment in high-value<br />
agriculture for 400,000 farms, and providing public support to<br />
FIGURE 28: AVAILABLE AND WITHDRAWN WATER RESOURCES<br />
PER CAPITA<br />
Per capita per year (m3/yr)<br />
4000<br />
3500<br />
3000<br />
2500<br />
2000<br />
1500<br />
1000<br />
500<br />
0<br />
Algeria<br />
Source: FAO Aquastat 2008<br />
Libya<br />
Mauritania<br />
Renewable Water Resources (2008)<br />
Total Water Withdrawn (2002 or 2007)<br />
Morocco<br />
Tunisia<br />
600,000 to 800,000 small-holder farms to increase productivity<br />
and reduce water demands. 111 In Algeria, the national Plan for<br />
Hydrologic Management focuses on desalination, improving<br />
efficiency of use, reducing water losses and reusing water for<br />
irrigation during the 2009-2014 period.<br />
In the long term, Algeria aims to develop new reservoirs and<br />
transfer water from the High Plateaus. Tunisia has developed<br />
a strategy of increasing wastewater reuse to 50 per cent for<br />
irrigation, increasing agricultural efficiency, and reducing<br />
water allocations for agriculture by 1.3 per cent a year. 112<br />
Libya has resolved its extreme water scarcity with an aqueduct<br />
to the Nubian Sandstone Aquifer, which it shares with Chad<br />
and Egypt. This supplies water to Tripoli, Benghazi, Sirt and<br />
other localities.<br />
Urban Access to Domestic Water<br />
Urban access to improved water and sanitation is relatively<br />
high in Maghreb countries and nearly universal in Morocco<br />
and Tunisia. Algeria, however, may miss its Millennium<br />
Development Goal target for water and sanitation as the<br />
result of a decline in the proportion of people with access<br />
to water and because the country is undergoing the region’s<br />
highest absolute and relative increase in urban population.<br />
Having reached relatively high levels of urban water service<br />
provision, Algeria, Morocco and Tunisia are now turning to<br />
diverse strategies to ensure future water supply and reduce<br />
<br />
A man sells water from the back of a truck in Tripoli, Libya. Water has been cut off throughout<br />
the city. ©J. Weeks/Voice of America
TABLE 39: DOMESTIC WATER TARIFFS<br />
Casablanca Rabat-Salé Safi Marrakech Meknes Algiers Tunisia<br />
Water Tariff (USD/m3 ) USD 1.03 + USD 0.21 + USD 0.54* USD 0.39* USD 0.20* USD 0.21 + USD 0.10 – 0.63^<br />
Sources: Global Water Intelligence, 2005 Water Tariffs Survey; *World Bank 2000 data; ^Newspaper 2010<br />
water pollution. In Morocco, the 2005 National Sanitation<br />
Master Plan aims to achieve an 80 per cent sewerage<br />
connection rate in urban areas, reduce wastewater pollution<br />
by 60 per cent, target 260 cities and consider wastewater<br />
reuse. 113 By 2009, the latter is envisaged to increase treated<br />
wastewater nationwide to 15 per cent, up from 8 per cent in<br />
2005. 114 The treatment plants will provide water for reuse by<br />
farms and golf courses. Tunisia similarly has a goal of raising<br />
wastewater reuse in the Greater Tunis and coastal areas to<br />
50 per cent by 2014, up from 30 per cent prior to 2009. 115<br />
In Algeria, the government has prioritized limiting aquifer<br />
abstraction and increased desalination, with as many as 13<br />
desalination plants to open by 2011.<br />
High systemic water losses in Algeria – 43 per cent in Oran<br />
and 51 per cent in Algiers as compared with 18 per cent in<br />
Tunis, 25 per cent in Rabat/Salé and Casablanca, and 7 to 20<br />
per cent in European and U.S. cities – indicate the need for<br />
better maintenance of distribution networks. 116<br />
Residential water use per capita ranges around 100 litres<br />
per day in the Maghreb, 117 although use varies significantly<br />
between countries. On the low end, daily water consumption<br />
in Mauritania varies between 18 litres/capita in unserviced<br />
areas to 40 litres/capita in the serviced areas of Nouakchott. In<br />
Libya, per capita water use is two to three times the regional<br />
average, although it has the least domestic water resources<br />
of the Maghreb. Water tariffs in Casablanca are among the<br />
highest in the region at USD 1.03 per cubic metre, followed<br />
by other Moroccan cities, while the lowest tiers of Tunisia’s<br />
national tariff blocks have some of the region’s cheapest<br />
water tariffs. 118 In Casablanca and Rabat/Salé, revenues cover<br />
operating costs, including depreciation, while in Oran and<br />
Tunisia they cover only 90 per cent of operating costs and the<br />
government subsidizes the remainder. 119<br />
Climate Change<br />
FIGURE 29: PER CENT OF NATIONAL URBAN POPULATION IN A LOW-ELEVATION COASTAL ZONE (LECZ) 123<br />
% of national urban population in urban LECZ<br />
0.0 - 5.0<br />
5.1 - 10.0<br />
10.1 - 15.0<br />
15.1 -20.0<br />
20.1 - 25.0<br />
> 25.0<br />
City size<br />
Small: 100K - 500K<br />
Intermediate: 500K - 1 million<br />
Large: Over 1 million<br />
Casablanca<br />
Climate change in Northern Africa is predicted to shift<br />
the Westerly winds, resulting in as much as a 12 per cent<br />
reduction in median annual precipitation by 2030 120 and<br />
the temperate climate that characterizes coastal Maghreb will<br />
become more extreme. Already, droughts in the region are<br />
increasingly frequent and severe, while floods have destroyed<br />
major crops in Morocco and Tunisia.<br />
The overall trend in reduced precipitation, coupled with<br />
higher temperatures and rates of evaporation, will reduce<br />
agricultural and pastoral productivity by 10 per cent although<br />
some studies suggest it could be as much as 40 per cent in<br />
Morocco. 121 A rise in sea levels is also predicted to impact<br />
major cities in Northern Africa, particularly Alexandria,<br />
Algiers, Casablanca, Tunis and Tarabulus.<br />
Since the 1970s, despite the limitations of arable land and<br />
water, the Maghreb countries have sought to strengthen food<br />
security by promoting domestic agricultural production.<br />
Agriculture accounts for 16 per cent of GDP in Morocco, 11<br />
per cent in Tunisia, 8 per cent in Algeria but only 1.7 per cent<br />
in Libya, which imports 75 per cent of its food. 122<br />
Algiers<br />
Tunis<br />
Tarabulus<br />
N<br />
0 1,000 2,000Km<br />
109
110<br />
With growing demand for water, especially in cities, as well<br />
as growing shortages due to prolonged droughts, water will<br />
increasingly be allocated away from agricultural areas, causing<br />
rural hardship and accelerating migration to cities and abroad.<br />
Projected changes in climate will further exacerbate existing<br />
urban challenges of providing adequate infrastructure,<br />
housing, employment and social services, heightening the<br />
potential for social, political and economic conflicts.<br />
Food Security<br />
As evidenced in the riots across the <strong>Arab</strong> world in 2008<br />
and early-2011, food security has the potential to destabilize<br />
governments. With only five countries exporting 73 per cent<br />
of the world’s traded cereal, and only 18 per cent of all wheat<br />
and 6 per cent of all rice produced for export, the global cereals<br />
market is highly susceptible to shifts in supply and demand. 124<br />
Between June and December 2010, FAO documented a 57<br />
per cent increase in the cereals price index, 56 per cent increase<br />
in the oils index, and 77 per cent increase in the sugar index.<br />
As net food importers, Maghreb countries have been affected<br />
to varying degrees by rising world food prices.<br />
Traditionally, countries in the Maghreb have relied on<br />
reduced taxes on grains and food subsidies to ensure food<br />
affordability; Morocco spends 0.7 per cent of its GDP on<br />
food subsidies and Algeria 0.03 per cent. As an oil exporting<br />
nation, Algeria’s fiscal surplus allows it to subsidize food costs<br />
while countries with fiscal deficits, such as Morocco, are less<br />
able to subsidize basic food prices. Food subsidies can be<br />
blunt market instruments that ultimately benefit the nonpoor,<br />
detract public funds from more productive uses and<br />
further drive up costs of grains. The Algerian government’s<br />
move in January 2010 to buy 800,000 tons of wheat, for<br />
instance, resulted in a further rise in market prices.<br />
Under a changing climate, future food price spikes will be<br />
more frequent and more drastic. To more effectively respond<br />
to future food crises, Maghreb nations will need to implement<br />
broad reforms to agriculture, water and food trade and more<br />
narrowly target social welfare nets.<br />
Energy and Air Pollution<br />
By 2005, 99 per cent of the population in Tunisia, 98<br />
per cent of Algeria, 97 per cent in Libya and 85 per cent<br />
in Morocco had access to electricity. 125 Between 1997 and<br />
2007, the consumption of electricity in Algeria, Morocco and<br />
Tunisia grew by 44 to 48 per cent. In tandem with increasing<br />
TABLE 40: WIND AND SOLAR POWER POTENTIAL IN THE MAGHREB<br />
energy consumption, carbon emissions have grown from 49<br />
to 79 per cent during the 1990 to 2005 period, although<br />
emissions per capita have remained stable. 126 While Morocco<br />
and Tunisia, both energy importers, consume low amounts<br />
of energy per capita, and Algeria is on par with the world<br />
average, Libyans consume more than twice the world average.<br />
The cost of meeting energy needs in the region will increase<br />
as 2006 consumption is estimated to more than double by<br />
2030. 127<br />
The region has one of the highest potentials for renewable<br />
energies in the world, and major initiatives to build solar and<br />
wind facilities are underway for transmission to Europe, where<br />
governments are required to increase their use of renewable<br />
energy. The ongoing World Bank Concentrated Solar Scaleup<br />
Programme (CSP) aims to build 20GW around the<br />
Mediterranean by 2020, most of it in Maghreb and Mashreq<br />
countries.<br />
The proposed multi-billion dollar DESERTEC initiative,<br />
implemented by a consortium of European and Algerian<br />
companies led by Münich Re, aims to build a network of<br />
solar and wind facilities throughout the Middle East and<br />
North Africa (MENA) region, with large-scale plans to be<br />
established by 2012 and pilots beginning in Morocco. Algeria<br />
has committed to build 220MW in Megahir, Naama and<br />
Hassi R’Mel II; Tunisia has committed to build over 200MW<br />
and Morocco’s Solar Plan aims to build 2,000MW by 2020,<br />
starting with a 500MW project in Ouarzazate that may be<br />
commissioned by 2015. 128<br />
In addition, Morocco aims to add 1GW of wind energy by<br />
2012, including proposals for a 300MW project in Tarfaya<br />
and Tangier, and Tunisia 300MW of wind energy by 2011,<br />
including proposals for 120MW in the Bizerte. While CSPbased<br />
energy is generally too expensive for sale in the producer<br />
countries, the projects will have a positive impact on the local<br />
and national economies.<br />
Several Maghreb countries have also established their own<br />
renewable energy targets. Building on past initiatives to<br />
electrify rural areas through renewable energy, Tunisia set a<br />
target of 500,000 square metres of solar hot water generation<br />
by 2009, and Morocco aims to add 400,000 square metres<br />
by 2015. By 2010, Morocco aimed to source 10 per cent of<br />
its energy from renewable sources, up from 4.3 per cent in<br />
2006, and 20 per cent of all electricity by 2012, suggesting<br />
an increase of 1GW in renewable capacity for domestic<br />
consumption. 129<br />
Air quality in the Maghreb, already at risk from the region’s<br />
aridity and periodic sand storms, continues to deteriorate.<br />
Algeria Libya Morocco Tunisia<br />
Wind Power Potential (GW) 20 8 9 4<br />
Solar Potential (GW) 62,600 51,700 7,800 3,900<br />
Source: Booz Allen Report, 2009
Isofoton photovoltaic micro-plants in Morocco. The region has one of the highest potentials for renewable energy in the world. ©Isofoton.es. Licensed under the Creative Commons Attribution 3.0<br />
Unported license.<br />
FIGURE 30: PROPOSED INFRASTRUCTURE MAP FOR DESERTEC<br />
179 Benabderrazik, H. “Opportunities for Logistical Improvements through Maghreb Integration.” Chapter 11 in Hufbauer, G. and C. Brunel, eds. Maghreb Regional and Global Integration: a Dream to<br />
be Fulfilled. Washington, D.C.: Peterson Institute for International Economics, 2008. Source: DESERTEC<br />
111
112<br />
FIGURE 31: PARTICULATE MATTER (PM10) AS A WEIGHTED<br />
AVERAGE OF THE URBAN POPULATION<br />
Micrograms per m3 of PM10<br />
120<br />
100<br />
80<br />
60<br />
40<br />
20<br />
0<br />
Algeria<br />
Libya<br />
Mauritania<br />
Source: World Bank Development Indicators<br />
While per capita trends in some types of air pollution are<br />
stable or declining, the increase in urban population has<br />
caused an overall increase in levels of pollution. The largest<br />
and fastest-growing contributors to air pollution include<br />
transport, industry and power plants. In addition, low<br />
building energy efficiency and a high proportion of old<br />
vehicles contribute to air pollution.<br />
Following worldwide trends, all Maghreb countries have<br />
reduced their per capita emissions of particulate matter<br />
(PM10). However, Algeria and Libya are still above the<br />
world average of 50 micrograms per cubic metre of PM10,<br />
and Algeria, Libya and Tunisia are above the WHO standard<br />
of 20 micrograms per cubic metre. Morocco and Tunisia<br />
finally phased out leaded gasoline in 2009 but Algeria is one<br />
of 12 remaining countries in the world that continues to<br />
use leaded petrol. 130 For the latest data on other national air<br />
pollution emissions, refer to The State of African <strong>Cities</strong> 2008<br />
Report.<br />
Traffic also contributes to noise pollution. In Greater Tunis,<br />
a study commissioned by the Ministry of Environment<br />
and Sustainable Development found that noise levels in<br />
residential areas near major nodes of transportation and light<br />
industry ranged between 56 and 76 dB(A), compared with<br />
the regulatory threshold of 45 to 60 dB(A). 131 In Algeria, the<br />
regulatory threshold for noise in residential areas is 70 dB (A)<br />
during the day and 45 dB (A) at night, standards that are<br />
typically exceeded at all times of day.<br />
Solid Waste Management<br />
Morocco<br />
Tunisia<br />
1996<br />
2006<br />
World<br />
Improper waste disposal and widespread littering cause<br />
environmental degradation and foregone economic<br />
opportunities in the Maghreb countries: 0.5 per cent of<br />
GDP in Morocco, 0.3 per cent of GDP in Algeria and 0.2<br />
per cent of GDP in Tunisia. 132 Recognizing the challenge,<br />
Algeria, Morocco and Tunisia have established national solid<br />
waste management frameworks. Libya lags in solid waste<br />
management, but is developing a national strategy.<br />
While urban solid waste collection has steadily risen, Algeria<br />
disposes 58 per cent and Morocco 95 per cent of waste in open<br />
dumps rather than sanitary landfills. 133 The environmental<br />
challenge is severe in Morocco, where a study of 150 sites<br />
found that 80 per cent were situated on vulnerable soils.<br />
Solid waste management is implemented by local<br />
governments in Algeria, Libya, and Morocco, while a national<br />
agency is responsible in Tunisia. Morocco outsources most of<br />
the collection services to private companies, Tunisia contracts<br />
landfills to private management, and Algeria is working to<br />
grow private participation. In 2007, solid waste management<br />
consumed 10.5 per cent of total municipal budgets. Costrecovery<br />
is limited – in Tunisia, the national government<br />
recoups only 15 per cent of the total cost of collecting,<br />
transferring and disposing the waste. 134<br />
In the mid-2000s Tunisia took the regional lead in improving<br />
waste management by constructing nine new sanitary landfills<br />
in Bizerte, Gabès, Jerba, Kairouan, Medenine, Monastir,<br />
Nabeul, Sfax and Sousse as well as increasing the capacity<br />
of the country’s largest landfill in Tunis. With World Bank<br />
funding, the government will construct biogas collection and<br />
flaring systems at all landfills and sell carbon reduction credits<br />
to help fund operation and maintenance costs. 135<br />
Following suit, the Government of Morocco launched the<br />
National Municipal Solid Waste Management Programme in<br />
2008, setting new standards and goals for urban areas, and<br />
aiming to raise collection coverage to 90 per cent by 2021,<br />
introduce sanitary landfills for all major urban areas, close or<br />
rehabilitate 300 existing open dumps, and promote recycling,<br />
waste reduction and reuse. 136 Financing the programme will<br />
draw on short-term subsidies, accessing international carbon<br />
market funds, exploring new local revenue such as a solid<br />
waste fee or an eco-tax on packaging and improving costeffectiveness<br />
through inter-city facility sharing and greater<br />
transparency in contract bidding and procedures.<br />
Algeria has also begun to rehabilitate open dumps, with<br />
projects in Algiers, Bouira and 18 municipalities in the<br />
western Mascara region. Libya plans to build sanitary landfills<br />
for a list of coastal cities and expand its network of composting<br />
facilities that transform organic solid waste into fertilizers. 137<br />
Liveability and Quality of Life<br />
When international companies attempt to rank the liveability<br />
of cities based on indicators on safety, education, hygiene,<br />
health care, culture, environment, recreation, stability, and<br />
public transport, less-developed countries typically have a<br />
low ranking. In the Mercer 2010 survey, 19 out of the 25<br />
lowest ranked cities are in Africa. In 2007, Algiers was last<br />
out of 132 cities, trailing Tunis in 78th place and Casablanca<br />
in 119 th . 138 Although the Maghreb cities can improve their<br />
liveability ranking, it is important to note that the indicators<br />
used are subjective and do not account for difference in<br />
cultural context, community life, and actual quality of life as<br />
perceived by residents.
3.6 Urban Governance Systems<br />
National Urban Policy<br />
Throughout the Maghreb, urban policy is formulated<br />
at the ministerial level and most countries have<br />
taken a sectoral approach to urban investments.<br />
Tunisia’s central government plays a key role in developing<br />
urban improvement projects, including the eradication of<br />
slums and the construction of affordable housing. The main<br />
agencies involved are the public companies responsible for<br />
the planning, construction operation and maintenance of<br />
urban utilities; the Ministry of Public Facilities, Housing<br />
and Regional Planning and the Ministry of Economic<br />
Development and International Cooperation, which acts as a<br />
channel for bi- and multi-lateral funds. 139<br />
In Libya, the Urban Planning Agency prepares the national<br />
physical plan and the urban development strategy and<br />
national consultancy offices prepare plans for provinces and<br />
municipalities. The extent to which local authorities adhere<br />
to the plans is not well known. In Morocco, the Ministry<br />
of Housing, Equipment and Environment is responsible<br />
for undertaking important local programmes and projects.<br />
Implementation is delegated to Al Omrane, which unified<br />
three national agencies involved in urban development<br />
activities in 2004. In Algeria, the Ministry of Planning and<br />
the Environment prepare national physical plans as well as<br />
plans for the country’s four major cities.<br />
Mauritania’s national policy has focused on an integrated<br />
poverty reduction strategy to improve the quality of urban life.<br />
The Ministry of Equipment and Transportation is responsible<br />
for regional and urban planning, project development and<br />
land management. The Directorate of Buildings, Housing<br />
and Urbanization (DBHU) drafts the plans, formulates<br />
and enforces building regulations and regularizes informal<br />
settlements. It is also in charge of the distribution of state<br />
land to individual citizens.<br />
The inability of most municipalities to finance urban<br />
projects has led to reliance on specialized national agencies,<br />
such as Al Omrane in Morocco, to implement economic<br />
and social projects. In Tunisia, ARRU implements projects<br />
to improve older, deteriorating areas, preserve and revitalize<br />
historic city centres and upgrade informal settlements by<br />
combining central funding and contractual agreements<br />
with municipalities for the delegation of project execution<br />
authority. In Mauritania, the national executive agency for<br />
public projects AMEXTIP implements projects for which<br />
funding can be secured.<br />
Decentralization and Local Government Systems<br />
The Maghreb countries share common features in the<br />
structure of local governance that reflect the legacy of the<br />
Ottoman and French colonial administrations. The countries<br />
are divided into provinces or governorates (wilayas), headed by<br />
an appointed governor (wali). This is in practice the dominant<br />
level of local governance. The presence of de-concentrated<br />
offices of central ministries that provide important public<br />
services, including health, education and housing, reinforce<br />
their dominance. 140<br />
Provinces are further divided into districts and sometimes<br />
sub-districts headed by appointed officials. Provinces and<br />
municipalities have elected councils that are legally vested with<br />
powers commensurate with their status as legal representatives<br />
of the people, including approval of plans, development<br />
projects, regulatory controls and local budgets. In practices,<br />
walis and mayors wield more authority. Mayors are usually<br />
elected by the municipal council from among its members.<br />
Since the 1980s, decentralization laws have combined<br />
varying degrees of political and administrative autonomy<br />
with central control over finances. The mismatch between<br />
functional devolution and fiscal centralization constrains<br />
local governments. Central transfers continue to be the main<br />
source of local finance and the share of local expenditures in<br />
the GDP is still low, rarely exceeding 30 per cent.<br />
Tunisia’s 24 provinces have a regional assembly (Conseil<br />
Regional) headed by the province’s governor. The assembly<br />
groups ex-officio representatives of urban and rural<br />
jurisdictions (municipal mayors and rural council presidents)<br />
with elected members from each district within the province.<br />
They operate under the umbrella of the Ministry of Interior.<br />
The 262 municipalities have elected councils and mayors.<br />
Non-urbanized jurisdictions have rural councils appointed<br />
by the Ministry. The councils have only a consultative role<br />
and the jurisdictions are administered by the province. City<br />
mayors are ex officio members of the regional assemblies,<br />
which are responsible for the preparation of regional plans<br />
and the management of the province’s affairs. City mayors<br />
also sit on the development councils established in 1994 and<br />
their role is primarily advisory. 141<br />
Algeria’s 48 provinces are subdivided into districts and<br />
communes. The 1,541 communes are municipalities headed<br />
by elected councils and mayors. They are under the authority<br />
of the provinces, which are headed by appointed walis.<br />
Morocco’s provincial administrations headed by walis<br />
appointed by the King have authority over all areas that lie<br />
outside municipal jurisdictions. Municipal governance is<br />
complex, with administrative responsibilities split between<br />
an appointed prefect who holds police powers and an elected<br />
communal council whose president acts as mayor and manages<br />
all other municipal functions, including local plans and<br />
projects, the issuance of building permits, inspection services<br />
and the budget. They all report to the Directorate General of<br />
Local Communities (DGLC) in the Ministry of Interior.<br />
113
114<br />
Morocco’s decentralization strategy, prepared in 2009 with<br />
UNDP’s technical assistance, aims to foster participation<br />
and accountability in local governance through participatory<br />
planning, development of human resources, decentralization<br />
of monitoring and evaluation, improved management of<br />
public services and local resource mobilization. The strategy<br />
also promotes fiscal decentralization and changes in the legal<br />
framework to give local authorities greater autonomy with<br />
appropriate central technical and managerial support.<br />
UNDP is also supporting the computerization of civil<br />
registry records and the UNDP-ART (Articulating Territorial<br />
and Thematic Networks for Human Development)<br />
programme fosters partnerships between municipalities in<br />
Europe and in the south and eastern Mediterranean countries<br />
to promote achievement of the Goals.<br />
In Algeria, Morocco and Tunisia, when the expansion of<br />
major cities spills over adjoining jurisdictions, another level<br />
of governance, the urban agglomeration is established with<br />
its own elected council and mayor. The degree to which the<br />
urban agglomeration can exercise authority over constituent<br />
municipalities is unclear. Cooperation among all the actors<br />
at the different levels of governance is needed to implement<br />
local development programs and promote sustainable<br />
urbanization.<br />
In Mauritania, provinces are headed by appointed<br />
governors and act as offices of the central administration.<br />
Municipalities deal directly with the state and rely on central<br />
ministries to discharge key functions and services.<br />
Libya has provincial, district and municipal levels of<br />
administration, with a variety of specialized commissions<br />
and councils. Municipalities have elected city councils. The<br />
structure of the system of local governance that will emerge<br />
in the aftermath of the civil war is unclear. The geography of<br />
the country and the tribal structure of society will be reflected<br />
in the legal and institutional framework. The boundaries of<br />
provinces and local jurisdictions may be re-demarcated. It<br />
can be assumed that at all levels of local governance, elected<br />
councils will be the norm.<br />
Local Government Finance<br />
Throughout the Maghreb region, municipalities run<br />
perennial operational deficits. The various local taxes, fees and<br />
permits that constitute the bulk of local revenues cover only<br />
a portion of the budget. Central transfers and shared taxes<br />
collected by the treasury contribute the balance.<br />
The inability to keep up with rapid urban growth and the<br />
resultant informal urbanization undermine potential revenue<br />
while the inefficiency of billing and collection systems result<br />
in low collection rates and varying degrees of inequity and<br />
corruption, as well as the perpetuation of reliance on central<br />
transfers to cover local deficits and finance capital projects.<br />
Funding local initiatives and projects is a pervasive problem.<br />
The bulk of the municipal budget goes to salaries and operating<br />
expenditures for municipal services such as maintenance of<br />
the road system and public spaces, solid waste collection and<br />
some community facilities.<br />
Capital improvements are financed in large part by the<br />
central government. Foreign-funded programmes channel<br />
funds to localities through the Ministry of Finance. In some<br />
countries, municipalities are authorized to borrow from<br />
municipal development funds. Morocco’s Fonds d’Equipement<br />
Communal (FEC) and Tunisia’s Caisse des Prêts et de Soutien<br />
des Collectivités Locales provide municipalities with long-term,<br />
low-interest credit to finance revenue producing projects.<br />
The Role of Civil Society<br />
Morocco has the most open policy towards civil society<br />
organizations (CSOs) in the Maghreb. Since 1996, these have<br />
grown from 8,000 to an estimated 30,000 organizations in<br />
2009. 142 The oldest CSOs comprise Islamic charity groups,<br />
which have long provided basic services to poor communities<br />
and have developed grassroots healthcare networks without<br />
external assistance. Since the 2000s, the government has<br />
promoted non-religious CSOs for healthcare, education, and<br />
poverty alleviation. They are largely funded by international<br />
donor groups and have close relationships with the state<br />
authorities.<br />
Morocco has also adopted reforms affecting the rights of<br />
women, the Berber community, and human rights, including<br />
the creation of the <strong>Arab</strong> region’s first Truth Commission to<br />
address civil rights abuses. During the current <strong>Arab</strong> region's<br />
wave of civil unrest, associations have demanded social justice,<br />
better living conditions, jobs for the unemployed and greater<br />
political freedoms. 143 The Moroccan King has promised to<br />
devolve some of his prerogatives to the Council of Ministers<br />
and to Parliament.<br />
In Tunisia, Algeria and Libya, civil society was much<br />
more restricted and constraints on local and foreign funding<br />
made it difficult for organisations to operate independently<br />
of the government. 144 Considered progressive and developed<br />
in many spheres, Tunisia had restrictions on the activities of<br />
civil society, human rights groups and freedom of expression.<br />
This repression, coupled with corruption, lack of employment<br />
opportunities and frustrated expectations, led the youth to<br />
protest the regime in January 2011.<br />
In Algeria, civil society had mushroomed to an estimated<br />
70,000 diverse voluntary associations for sports, education,<br />
health, trade and students by 2008. 145 The protests in January<br />
2011 served as a rallying cry for many of these CSOs, who<br />
joined to create a National Coordination Committee for<br />
Democratic Change to lift the 19-year state of emergency.<br />
In Libya, a tribal society, non-governmental organizations<br />
were illegal. Rather, quasi-governmental organisations<br />
provided services to the people. 146 The upheaval of 2011<br />
fractured the population along tribal lines, resulting in a<br />
destructive civil war and foreign involvement.
Local woman in the medina of the holy city of Moulay Idriss. Morocco has adopted positive reforms affecting both human rights and the rights of women. ©Attila Jandi/Shutterstock<br />
Women in Politics and Governance<br />
Between 1959 and 1964, all Maghreb countries granted<br />
women the right to vote and to stand in elections. Until the<br />
past ten years, however, women’s participation in politics<br />
was minimal. While women’s participation is increasing in<br />
numbers, they rarely assume significant executive positions or<br />
policymaking roles in national assemblies, local councils, or<br />
political parties.<br />
In Algeria, Libya and Morocco, women comprise 8 to<br />
11 per cent of the lower parliamentary house, compared to a<br />
world average of 15 per cent. In upper houses, women hold<br />
1 per cent of the seats in Morocco, 3 per cent in Algeria, and<br />
none in Libya’s General People’s Council and General People’s<br />
Congress. The main exception in the region is Tunisia, where<br />
women comprise 28 per cent of the lower house and 13 per<br />
cent of the upper house. In Algeria, Morocco and Tunisia, the<br />
highest position women have attained is that of vice-speaker<br />
of assemblies. 147<br />
In 2002, Morocco established a parliamentary quota<br />
system that ensures 30 seats for women, up from two elected<br />
women in the 1997 elections. The current government has an<br />
unprecedented seven female ministers. Partly at the urging of<br />
women politicians, the government also established a quota<br />
system for local council elections in 2009, ensuring that 12<br />
per cent of seats are held by women, up from 0.55 per cent in<br />
2003. It has dedicated MAD 10 million (USD 1.28 million)<br />
in 2009 for political parties and CSOs that aim to increase<br />
women’s participation in politics. 148<br />
Family codes are a set of regulations common in <strong>Arab</strong><br />
countries that govern the rights of women in marriage,<br />
divorce and child custody. In 2005 Algeria revised the<br />
1984 family code, giving important rights and protection<br />
to women. In 2008, the government further amended the<br />
Algerian constitution to officially recognize women’s political<br />
role. Still, women occupy only 5 per cent of seats in local<br />
popular assemblies. 149 In Libya, the government promoted<br />
gender equality, running counter to the country’s more<br />
conservative traditions. Thus, while women were encouraged<br />
to participate, particularly in local assemblies and debates,<br />
cultural traditions discouraged women speaking in public<br />
constrained meaningful participation. 150 Throughout the<br />
Maghreb region, women fully participated in the protests and<br />
demonstrations that marked the 2011 civil unrest.<br />
115
116 3.7 Migration and Remittances<br />
<br />
Moroccan vegetable pickers working in the fields beside the Polaris World La Torre Golf Resort in Murcia, Spain. ©Steve Forrest/Panos Pictures<br />
Migrants and Refugees<br />
With high unemployment rates, countries in<br />
the Maghreb (with the exception of Libya<br />
until recently) have for several decades been<br />
net exporters of labour to France as well as Belgium, the<br />
Netherlands and Germany. As immigration policies were<br />
tightened in these countries in the 1990s and 2000s, migrant<br />
flows shifted to destinations to Spain and Italy. Increasingly,<br />
migrants – particularly better-educated migrants – are also<br />
travelling to the Canada and United States. Algeria, Morocco<br />
and Tunisia have 1 to 3 million residents abroad, 90 per cent<br />
of them in Europe.<br />
The example of Tunisia typifies their experience. Despite<br />
significant developmental progress, Tunisia has some of the<br />
highest rates of unemployment in the region (22 per cent),<br />
particularly among the better educated. According to a survey<br />
by the Ministry of Youth, the percentage of people aged 15 to
29 wishing to emigrate rose from 22 per cent in 1996 to 76<br />
per cent in 2005. Of those emigrating in 2005, 62 per cent<br />
had a secondary degree or higher and 76 per cent of male<br />
migrants left in search of employment, as compared to 30 per<br />
cent of females. 151<br />
National efforts, along with United Nations and<br />
international support, have established pilot projects in the<br />
migration-prone governorates of Le Kef, Gafsa and parts<br />
of Tunis to create higher-skilled jobs, upgrade informal<br />
enterprises and promote youth training. 152 Nevertheless, as<br />
seen in the protests leading to the ouster of President Ben Ali<br />
in 2011, unemployment remains a critical issue in Tunisia. In<br />
the power vacuum that followed, over 4,000 Tunisians fled to<br />
the Italian island of Lampedusa.<br />
Following 30 years of prohibiting emigration, Algeria<br />
has once again opened its borders in line with the country’s<br />
economic reforms that started in the 2000s. The remittances<br />
of migrants have become increasingly important to the<br />
economy.<br />
In the wake of the civil war in Libya, over 652,000 non-<br />
Libyans and 40,000 Libyan refugees have fled the country. 153<br />
International organizations are facilitating the repatriation of<br />
non-Libyans, although many are staying for the time being in<br />
Egypt, Tunisia and, to a lesser extent, Algeria.<br />
Since the 1990s, the Maghreb has also become a transit<br />
point for migrants from sub-Saharan Africa and Asia seeking<br />
to enter Europe and the Americas. An estimated 65,000 to<br />
120,000 sub-Saharan Africans cross the Maghreb countries<br />
every year, most of them on their way to Europe. In recent<br />
years, Northern Africa has also received temporary labourers<br />
from Bangladesh, China, India, Pakistan, and the Philippines,<br />
who work in construction, trade, and services. 154<br />
In some cases, the modern-day trans-Saharan migration<br />
routes have helped revitalize the old trade routes and oases<br />
in Abéché (Chad), Agadez (Niger), Gao (Mali), Kufra and<br />
Sebha (Libya), Nouadhibou (Mauritania) and Tamanrasset<br />
(Algeria). 155 The tightening of European borders has led to<br />
increasing pressure from European countries for the Maghreb<br />
countries to control their own borders or risk losing important<br />
sources of donor aid, foreign investment and other benefits.<br />
As a result, the Maghreb has become a migration destination<br />
by default for people from sub-Saharan Africa countries who<br />
failed to enter or were expelled from Europe and stayed in the<br />
region. Algeria hosts an estimated 240,000 foreign residents,<br />
predominantly from <strong>Arab</strong> countries but including 100,000<br />
sub-Saharan Africans; the latter reside mostly in Oran and<br />
Algiers. It issued 23,000 work permits in 2007, up from<br />
1,100 permits in 2001, 41 per cent of which were for workers<br />
from China. 156<br />
As a consequence of the United Nations-imposed air and<br />
arms embargo on Libya from 1992 to 2000, the country<br />
launched a pan-Africa policy that resulted in a massive inflow<br />
of sub-Saharan migrants to work in the oilfields in the south<br />
or in Tripoli and Benghazi. As of 2006, an estimated 1 to 1.5<br />
million sub-Saharan migrants lived in the country. Domestic<br />
backlash against immigrants has led to a hardening of visa<br />
restrictions and the deportations of hundreds of thousands<br />
of workers.<br />
Maghreb countries have also absorbed important refugee<br />
populations displaced by natural disasters and conflict in<br />
surrounding countries. Tindouf, Algeria, hosts 90,000<br />
Saharawi refugees fleeing the conflict between the Western<br />
Sahara Polisario Front and Morocco. They live in abject<br />
poverty, with 18 per cent suffering from acute malnutrition. 157<br />
The line between refugees fleeing persecution and economic<br />
refugees is often blurred and, in the face of high domestic<br />
unemployment and prejudices, the Maghreb countries have<br />
repatriated many people perceived as economic migrants,<br />
regardless of their actual status.<br />
Remittances<br />
Remittances play a significant role in the economies of<br />
Morocco and Tunisia, where they account for 7 and 5 per<br />
cent of GDP, respectively. In Algeria, Morocco and Tunisia,<br />
remittances total three to seven times net international and<br />
bilateral development assistance. The impact of remittances<br />
on the national economy is negligible in Libya, where<br />
immigration is higher than emigration.<br />
The global recession has reduced remittances, tourism<br />
revenues, exports and real estate-related construction,<br />
particularly in Egypt and Morocco, while the fall in oil prices<br />
in 2009 stressed oil exporting countries such as Algeria and<br />
Libya. These changes reduced both household and government<br />
capacity to cope with rising food and housing prices.<br />
Remittances have provided important funds for local<br />
development and investment. In Morocco, they have been the<br />
source of financing for small- and medium-sized enterprises<br />
in villages and small towns, first in the Rif Mountains and<br />
now nationwide. By one estimate, 600,000 households<br />
in Morocco would fall under the poverty line without<br />
remittances. 158 According to one study of remittances sent by<br />
Moroccans living in the Netherlands, which accounts for 4<br />
per cent of Morocco’s total in this area, 23 per cent of the<br />
remittances are used for food, 16 per cent for healthcare and<br />
15 per cent for housing. While most recipients had other<br />
sources of income, nearly 30 per cent of them depend entirely<br />
on remittances and the largest receiving areas were the Rif and<br />
Greater Casablanca. 159<br />
The flow of remittances has helped expand the country’s<br />
banking sector and the availability of microcredit loans.<br />
Nevertheless, there is still a lack of established institutional<br />
frameworks throughout the Maghreb to leverage remittances<br />
for savings and investment purposes, as compared with<br />
such Asian countries as the Philippines, South Korea and<br />
Thailand. 160<br />
117
118 3.8 Regional Corridors and Cooperation<br />
FIGURE 32: TANGER-MED DEVELOPMENT<br />
Cap Spartel<br />
Industrial and logistics free zone<br />
Free zone<br />
Tangier Gueznaya<br />
Source: Posted in an unsourced blog, 2010.<br />
Cap Malabata<br />
Tangier<br />
Ibn Battouta dam<br />
Extend express<br />
road Project NR 2<br />
The Tangier Extended Metropolitan Region<br />
Oued Aliane<br />
Free zone<br />
Melloussa 1<br />
Two major urban corridors exist in the Maghreb: the<br />
first from Kenitra to El Jadida on Morocco’s Atlantic<br />
coast and the second along the Mediterranean<br />
Coast. The Kenitra-El Jadida Corridor includes the<br />
cities of Casablanca and Rabat, Morocco’s economic and<br />
administrative capitals which is home to 7.5 million people<br />
and produces half the country’s GDP. The coastal zone was<br />
important in Roman times and has revived significantly since<br />
the 1960s, driven by the development of oil, industries and<br />
tourism.<br />
The Union for the Mediterranean, which was established<br />
in 2008 to implement the Barcelona Declaration, has made<br />
integrated rail and highway networks between Morocco and<br />
Tunisia a key goal and is considering proposals for urban<br />
development and transport in the region. The successful<br />
development of these projects will strengthen the Maghreb’s<br />
internal ties as well as external integration with Europe. The<br />
Ksar Seghir<br />
Free zone<br />
Melloussa 2<br />
Planned highway<br />
FZ Fnideq-Tangier<br />
Planned railway<br />
R’mel sito dam<br />
Dalia Belyounech<br />
Spain<br />
Oued Marsa<br />
Morocco<br />
Smir dam<br />
Tetouan<br />
Ceuta<br />
Free zone<br />
Oued Negro<br />
Fnideq<br />
Extend Express<br />
road PR 28<br />
State of African <strong>Cities</strong> 2008 and 2010 reports’ North Africa<br />
chapters discussed these two corridors, respectively, in greater<br />
detail (available as free downloads from www.unhabitat.<br />
org). 161<br />
Taking advantage of its location at the intersection of<br />
these east-west and north-south corridors, a new extended<br />
metropolitan region (EMR) is growing around Tangier,<br />
which has become North Africa’s largest container port. The<br />
port at Tanger-Med launched a new passenger terminal in<br />
2009 that can handle 7 million persons per year, 700,000<br />
trucks and 2 million cars. In addition, Tanger-Med features<br />
a dry port, a general cargo terminal, a 250 ha logistics zone,<br />
a 1,000 ha industrial free zone at Melloussa-Joamaa, and a<br />
345 ha Tangier Free Zone where 400 businesses have located,<br />
employing 40,000 people. 162 Tanger-Med has attracted a<br />
EUR 600 (USD 866) million Renault car factory that will<br />
assemble 200,000 cars per year by 2010. The public port<br />
authority is planning a second phase that will more than<br />
double the port’s existing capacity by 2015.
FIGURE 33: EURO-MED TRANSPORT PROJECT<br />
Source: EuroMed Aviation, 2005<br />
Download a pdf of this map from: http://p23680.mittwaldserver.info/fileadmin/images/MapsAndData/Projects/PROJ_ROAD_AIR_web.pdf<br />
119
120<br />
To connect the port with the country’s other economic<br />
centres, Morocco built a new Tangier-Casablanca highway in<br />
2008, followed by a 45 km rail link to the national network<br />
in 2009. A new high-speed railway is expected to open in<br />
2014 linking the port to Casablanca, thereby extending<br />
the coastal corridor from El Jadida to Tangier. 163 Tangier’s<br />
population tripled from 1982 to 2008 and the construction<br />
of the new port has further consolidated its position as the<br />
economic centre of the north. 164<br />
By 2015 the government plans to upgrade the port of Nador,<br />
350 km east of Tangier, with new infrastructure focusing<br />
on the storage and export of hydrocarbons. Nador will<br />
also be connected through new highways to Taourirt, Fes and<br />
Oujda.<br />
Regional Competition and the Challenge of<br />
Cooperation<br />
Despite the signing of a number of regional trade agreements<br />
and the establishment of the Euro-Mediterranean Partnership<br />
and the Union for the Mediterranean, intra-regional trade<br />
accounted for less than 3 per cent of the sub-region’s total<br />
trade in 2007. 165 Instead, Maghreb countries have oriented<br />
themselves to the European Union, with each country<br />
building its own port infrastructure to links its markets to<br />
Europe. Despite the increasing strength of outward trade and<br />
cooperative agreements, a number of studies demonstrate<br />
the potential for increased intra-regional trade by opening<br />
borders and integrating infrastructural networks.<br />
Maghreb countries lag behind other regions in trade<br />
liberalization, with certain sectors closed to foreign<br />
participation and high cost of service provision. Stronger<br />
regional cooperation and trade reforms would help strengthen<br />
Maghreb efforts to integrate trade internationally. 166 In<br />
addition, revitalizing a hub-and-spoke system of infrastructure<br />
would reduce logistics costs and enhance Maghreb countries’<br />
business competitiveness. 167<br />
Efforts to integrate the region’s economies are particularly<br />
important given the growth of the trans-boundary corridor<br />
along the southern Mediterranean coast, and the planned<br />
expansion of the region’s renewable energy production.<br />
The closure of the border between Morocco and Algeria<br />
in 1994, due to the conflict over the Western Sahara, has<br />
prevented cargo and passenger movement. Existing train lines<br />
are inoperable and the Maghreb east-west highway stops at<br />
Oujda in Morocco and Tlemcen and Maghnia in Algeria. As<br />
a result, Morocco developed a port at Nador while, 120 km<br />
to the east, Algeria built a port at Ghazaouet. The closure of<br />
the border also forces cities such as Oujda, located close to<br />
Ghazaouet to use the more distant facility at Nador. 168<br />
Nador’s new hydrocarbons port would be strengthened if it<br />
were accessible to Algeria’s petroleum and fossil fuels industry.<br />
Similarly, Tanger-Med’s position would be consolidated if<br />
connected by sea, rail and highways to other North African<br />
countries and, from there, to the Mashreq.<br />
Trade in energy resources poses another regional<br />
challenge. Morocco imports 10.6 per cent of its petroleum<br />
product needs from Algeria and the rest from outside of<br />
the Maghreb despite significant regional resources. Electric<br />
interconnections exist between Morocco and Algeria<br />
(at Ghazaouet/Oujda and Tlemcen/ Oujda), between<br />
Algeria and Tunisia (at Djebel Onk/Métlaoui, El Aouinet/<br />
Tajerouine, and El Kala/Fernana) and between Tunisia and<br />
Libya (Medenine/Abukamash). However, these connections<br />
are only used for emergency backup purposes and provide<br />
less than 1 per cent of total electricity consumption in these<br />
countries.<br />
The World Bank and DESERTEC renewable energy<br />
initiatives will require new transport infrastructure and<br />
electricity transmission lines. These projects will have<br />
important implications for the development of cities along<br />
the transmission lines’ rights of way.
Maghreb Statistical Annex<br />
TABLE 41: TOTAL AND URBAN POPULATION (‘000S) AND PERCENTAGE POPULATION URBAN<br />
1990 1995 2000 2005 2010 2015 2020 2025 2030<br />
Total Population (‘000s)<br />
Algeria 25,283 28,292 30,506 32,888 35,423 37,954 40,630 42,043 44,726<br />
Libya 4,365 4,775 5,346 5,770 6,546 6,606 7,699 7,465 8,519<br />
Mauritania 1,988 2,292 2,604 3,047 3,366 3,869 4,091 4,742 4,791<br />
Morocco 24,808 26,929 28,827 30,392 32,381 33,570 36,200 36,406 39,259<br />
Tunisia 8,215 8,936 9,452 9,912 10,374 11,026 11,366 11,921 12,127<br />
Urban Population (‘000s)<br />
Algeria 13,168 15,828 18,246 20,804 23,555 26,409 29,194 31,779 34,097<br />
Libya 3,305 3,674 4,083 4,561 5,098 5,654 6,181 6,647 7,060<br />
Mauritania 789 904 1,041 1,206 1,395 1,609 1,859 2,152 2,478<br />
Morocco 12,005 13,931 15,375 16,835 18,859 20,999 23,158 25,235 27,157<br />
Tunisia 4,760 5,493 5,996 6,455 6,980 7,537 8,096 8,636 9,115<br />
Per cent Population Urban (%)<br />
Algeria 52.1 56.00 59.81 63.32 66.50 69.34 71.85 74.11 76.23<br />
Libya 75.7 75.99 76.37 77.01 77.89 78.99 80.29 81.62 82.88<br />
Mauritania 39.7 39.83 40.0 40.40 41.4 43.11 45.4 48.45 51.7<br />
Morocco 48.4 51.69 53.34 55.21 58.24 61.17 63.97 66.65 69.18<br />
Tunisia 57.9 61.47 63.43 65.35 67.28 69.25 71.23 73.21 75.17<br />
Source: UN-DESA,WPP 2008 and WUP 2009<br />
TABLE 42: NATIONAL AND URBAN GROWTH RATES<br />
1990-1995 1995-2000 2000-2005 2005-2010 2010-2015 2015-2020 2020-2025 2025-2030<br />
Urban Growth Rates<br />
Algeria 3.68 2.84 2.62 2.48 2.29 2.01 1.70 1.41<br />
Libya 2.12 2.11 2.21 2.23 2.07 1.78 1.45 1.21<br />
Mauritania 2.73 2.83 2.94 2.91 2.86 2.89 2.93 2.81<br />
Morocco 2.98 1.97 1.81 2.27 2.15 1.96 1.72 1.47<br />
Tunisia<br />
National Population Growth Rates<br />
2.86 1.75 1.48 1.56 1.54 1.43 1.29 1.08<br />
Algeria 2.23 1.53 1.48 1.51 1.45 1.29 1.08 0.84<br />
Libya 2.04 2.01 2.05 2.00 1.79 1.46 1.12 0.90<br />
Mauritania 2.65 2.75 2.73 2.40 2.07 1.84 1.65 1.51<br />
Morocco 1.66 1.35 1.12 1.20 1.17 1.06 0.90 0.72<br />
Tunisia 1.68 1.13 0.88 0.98 0.96 0.87 0.74 0.55<br />
Source: UN-DESA,WPP 2008 and WUP 2009<br />
121
122<br />
TABLE 43: AVERAGE ANNUAL GROWTH RATES OF URBAN AGGLOMERATIONS WITH 750K+ PEOPLE IN 2009 (PER CENT)<br />
City 1990-1995 1995-2000 2000-2005 2005-2010 2010-2015 2015-2020 2020-2025<br />
Agadir 5.70 2.58 2.57 2.44 2.07 1.75 1.46<br />
Algiers 2.17 2.17 2.17 2.17 2.03 1.68 1.29<br />
Oran 0.86 0.86 0.86 0.9 1.43 1.73 1.47<br />
Casablanca 1.91 0.62 0.62 0.91 1.49 1.52 1.26<br />
Fes 2.72 2.04 2.04 2.02 1.92 1.7 1.42<br />
Marrakech 3.26 2.07 2.07 2.06 1.95 1.72 1.44<br />
Nouakchott .. .. 2.80 2.77 2.68 2.64 2.86<br />
Rabat 3.22 1.77 1.77 1.8 1.81 1.62 1.35<br />
Tangier 3.73 2.98 2.98 2.75 2.16 1.75 1.46<br />
Tripoli 2.64 0.77 0.71 0.89 1.48 1.51 1.17<br />
Tunis 1.16 0.84 0.63 0.87 1.21 1.19 1.04<br />
Source: UN-DESA, 2009<br />
TABLE 44: UNEMPLOYMENT RATES BY AGE AND LOCATION IN MOROCCO, SECOND TRIMESTER 2010<br />
Age Group Urban (%) Rural (%) Total (%)<br />
15-24 years 31.0 7.0 16.3<br />
25-34 years 17.1 3.8 11.4<br />
35-44 years 6.9 1.4 4.7<br />
45 and older 3.1 1.1 2.1<br />
Source: National Employment Survey, Haut Commissariat au Plan<br />
TABLE 45: UNEMPLOYMENT RATES BY AGE AND EDUCATION IN MOROCCO<br />
Age Group No Degree Intermediate Degree Upper Level Degree<br />
15-24 years 19.1% 36.2% 56.6%<br />
25-34 years 9.6% 21.3% 32.2%<br />
35-44 years 6.0% 7.9% 7.7%<br />
44 and older 3.1% 3.7% 1.4%<br />
Source: National employment survey , Haut Commissariat au Plan<br />
TABLE 46: URBAN/RURAL HEALTH INDICATORS FOR MOROCCO<br />
Indicator Urban Rural National<br />
Crude mortality rate 4.8 6.6 5.5<br />
Infant mortality rate (per 1,000) 33 55 40<br />
Under-five mortality rate (per 1,000) 38 69 47<br />
Neonatal mortality rate (per 1,000) 24 33 27<br />
Post-neonatal mortality rate (per 1,000) 9 22 14<br />
Maternal mortality rate (per 100,000) 187 267 227<br />
Life expectancy at birth (years) 75.5 67 72.2<br />
Child delivery assistance* 85.3 39.5 ..<br />
Pregnant women receiving prenatal care* 84.9 47.9 ..<br />
Fully vaccinated children* 93.5 84.1 ..<br />
Sources: The World Bank. (2009). Country Strategy for the Kingdom of Morocco for the Period FY 10-13. Washington D.C.: The World Bank. Direction de la Statistique. (2009). “ Moroccan Social<br />
Indicators 2008.” Haut commissariat du plan.
TABLE 47: LEVEL OF MOTORIZATION IN MAGHREB COUNTRIES<br />
Algeria Libya Mauritania Morocco Tunisia<br />
Roads (km) 108,302 83,200 11,066 57,799 19,232<br />
% roads paved 70 57 27 62 66<br />
Road Density (km of roads per 100 km2 land area) 4.5 4.7 1 13 12<br />
Motor Vehicles (per 1,000 people) 91 291 .. 72 103<br />
Passenger Cars (per 1,000 people) 58 225 .. 53 73<br />
Source: World Bank Development Indicators; 2007 data except for kilometres of roads and % of roads paved, where the data is the latest available from 2000 to 2007<br />
TABLE 48: WATER AVAILABILITY AND USAGE<br />
Annual Availability Annual Water Usage % Use by Sector<br />
Natural Renew-<br />
Country<br />
able Resource<br />
Bm3 Desalinated End<br />
/yr<br />
Water Bm3 Waste-water<br />
/yr Reuse Bm3 Per Capita Renewable<br />
/yr Availability (m3 Bm<br />
)<br />
3 As a % of total<br />
2006 2015 2025<br />
water resources<br />
(AFED) (AFED)<br />
Algeria 11.50 0.07 Neg. 350 297 261 4.59 40 25 15 60<br />
Libya 0.80 0.03 - 99 80 67 3.89 469 9 4 87<br />
Morocco 20.00 0.02 0.07 940 620 558 16.84 84 5 - 95<br />
Tunisia 3.35 0.00 0.14 450 405 373 2.53 72 12 4 84<br />
Source: AFED 2010 Report<br />
TABLE 49: 2008 ACCESS TO IMPROVED WATER AND SANITATION (% OF HOUSEHOLDS)<br />
Improved Water Access Improved Sanitation Access<br />
Total Urban Rural Total Urban Rural<br />
Algeria 83 85 79 95 98 88<br />
Libya* 71 72 68 97 97 96<br />
Mauritania 49 52 47 26 50 9<br />
Morocco 81 98 60 69 83 52<br />
Tunisia 94 99 84 85 96 64<br />
Source: WHO/GHO Database; *Libya water data is from 2000<br />
TABLE 50: 2007 ENERGY CONSUMPTION<br />
Algeria Libya Morocco Tunisia MENA<br />
Energy Use (kg of oil equiv. per cap) 1,100 2,943 458 863 1,254<br />
Electricity Use (kWh per cap) 870 3,688 685 1,221 1,435<br />
Electricity from fossil fuels (% of total) 99 100 92 99 91<br />
Electricity from hydropower (% of total) 0.6 0 6.9 0.7 16<br />
Energy Imports (net, % of energy use) -346 -470 95 11 -105<br />
Sources: World Bank Little Green Book 2009; WDI; REN21, “Renewables Global Status Report”, 2007<br />
Domestic<br />
Industry<br />
Agriculture<br />
123
124<br />
TABLE 51: MUNICIPAL SOLID WASTE (MSW) COMPOSITION AND GENERATION<br />
Algeria Mauritania* Morocco Tunisia<br />
MSW Generated (million tons) 8.5 0.45 6.5 1.8<br />
Urban Per Capita MSW (kg/day) 0.9-1.0 0.5 0.75 0.8<br />
Urban Collection Coverage 92% 30% 70% (2009) 95%<br />
MSW Generation Growth per year<br />
Material Composition of MSW<br />
2% 6% 3% 3%<br />
Food/organic wastes 67-73% 5% 67% 68%<br />
Paper 7-12% 6% 19% 9%<br />
Plastic 2.5-7% 20% 2.6% 11%<br />
Glass 1% 4% 0.4% 2%<br />
Metal 2% 4% 1.4% 4%<br />
Other<br />
Treatment Method<br />
11-13% 61% 9.6% 6%<br />
Composted 1% 0% 1% 0.5%<br />
Recycled 2% 8% 2% 5%<br />
Landfilled 0.2% 37.3% 1% 50%<br />
Uncontrolled public dumping 40%<br />
Open Dumping 58% 54.7% 95% 44.5%<br />
Sources: METAP, most data from 2002; Mauritania 2009<br />
TABLE 52: PARTICIPATION IN THE WORKFORCE AND NATIONAL POLITICS BY WOMEN VERSUS MEN<br />
Algeria Libya Mauritania Morocco Tunisia<br />
<br />
Literacy rate of Women/Men (% literate aged 15+, 2006-08) 64 81 81 95 63 70* 44 69 70 86<br />
Labour Force Participation Rate by Women / Men<br />
(% of those aged 15-64 employed, 2008)<br />
38 83 25 81 .. .. 29 84 28 74<br />
% of Unemployment of Women/Men (2004-08) 18 13 .. .. .. .. 10 10 17 13<br />
Year Women Received Right to Vote and Stand for Election 1962 1964 .. 1963 1959<br />
Year First Woman Elected (E) or Appointed (A) to Parliament 1962 A .. .. 1993 E 1959 E<br />
% Parliament (single or lower house) seats female (2010) 7.7 7.7 22.1 10.5 27.6<br />
% Parliament (upper house or senate) seats female (2007) 3.1 0 .. 1.1 13.4<br />
% of ministerial positions held by women (2005) 10.5 .. .. 5.9 7.1<br />
Source: World Bank Gender Statistics, UN HDR 2007/08, MDG Indicators Database<br />
TABLE 53: IMMIGRATION DATA BY COUNTRY<br />
# of International Migrants<br />
in Country (2010)<br />
# of Refugees in<br />
Country (2008)<br />
% Population Foreign<br />
Born (2010)<br />
Average Annual Net<br />
Migration (2005-2010)<br />
Emigration Rate of<br />
Tertiary Educated (2010)<br />
Algeria 242,000 94,100 1% -28,000 6%<br />
Libya 682,000 6,700 11% 4,000 4%*<br />
Mauritania 99,000 27,000 2,000<br />
Morocco 49,000 800 0.2% -85,000 10%<br />
Tunisia 34,000 100 0.3% -4,000 10%<br />
Source: UN DESA International Migration Wall Chart 2009; Emigration Rate of Tertiary Educated from IOM 2010, except * from World Bank Development Indicators Database, 2005
TABLE 54: DESTINATIONS OF EMIGRANTS BY PERCENTAGES<br />
# of Citizens<br />
Abroad<br />
% of Pop.<br />
Abroad Total<br />
Europe<br />
France Spain Italy<br />
<strong>Arab</strong><br />
Nations<br />
USA &<br />
Canada<br />
Africa<br />
Algeria (2008) 895,250 3 90.9 75.8 6.3 2.7 3.3 5.1 --<br />
Libya (2010) 110,000 2 Top destinations: Israel, UK, Chad, USA, Jordan, Egypt, Germany, Turkey, Canada, Italy<br />
Mauritania<br />
20 per cent of Mauritanians living abroad in 2008 resided in another <strong>Arab</strong> country,<br />
primarily Saudi <strong>Arab</strong>ia (30,000 persons), Libya (30,000) and the UAE (5,000)<br />
Morocco (2007) 3,300,000 10 86.2 43.9 4.3 5.9 8.6 4.8 --<br />
Tunisia (2008) 1,058,700 7 82.6 54.6 13.4 14.5 8.4 --<br />
Source: CARIM Country Profiles 2009, 2010; Libya data from World Bank Migration and Remittances Factbook, 2011<br />
TABLE 55: RECEIPT OF OFFICIAL DEVELOPMENT ASSISTANCE (ODA) AND REMITTANCES<br />
Net ODA Received (current USD million)<br />
Remittance Inflows<br />
(USD million)<br />
Remittances<br />
(% of GDP)<br />
2008 1999 2009 1999 2009 1999<br />
Algeria 316 138 2,193 790 1.6% 1.6%<br />
Libya 60 5 16 -- 0.03% 0.03% (2000)<br />
Mauritania 311 219 2 2 0.07% 0.2%<br />
Morocco 1,217 678 6,271 1,938 7% 5%<br />
Tunisia 479 252 1 966 761 5% 4%<br />
Source: World Bank Development Indicators Database<br />
ENDNOTES<br />
1 UN-DESA. 2009. World Urbanization Prospects: The<br />
2009 revision population database. New York: United<br />
Nations.<br />
2 UN-DESA, 2009.<br />
3 The population is 767,000 for Tunis from UN-DESA<br />
(2010 estimate) and 340,000 for Sfax from the<br />
US Embassy or 265,131 for Sfax in 2004 from City<br />
Population Data. UN-DESA, 2009. http://www.<br />
citypopulation.de/Tunisia.html.<br />
4 UN-DESA, 2009.<br />
5 UN-DESA, 2009.<br />
6 UN-DESA, 2009.<br />
7 Haut Commissariat au Plan, Royaume du Maroc.<br />
General Census 2004 and 2009. Tunis: HCP.<br />
8 General census from http://www.citypopulation.de/<br />
Tunisia.html<br />
9 Safar Zitoun, M. & Tabti-Talamali, A. (2009), La Mobilite<br />
Urbaine dans l’Agglomeration d’Alger: Evolutions et<br />
Perspectives, p.25-27. Plan Bleu.<br />
10 Safar Zitoun, M. & Tabti-Talamali, A. (2009), La Mobilite<br />
Urbaine dans l’Agglomeration d’Alger: Evolutions et<br />
Perspectives, p.32-44. Plan Bleu.<br />
11 UN-Habitat, Libya Urban Planning Newsletter,<br />
Issue No. 1. Retrieved October 20, 2010 at: http://<br />
www.unhabitat.net/pmss/pmss/electronic_<br />
periodicals/2418_alt.pdf<br />
12 Azlitni, B. R. Kh. (2005). The Development of Physical<br />
and Urban Planning Systems in Libya Sustainability of<br />
Planning Projects. Pretoria: World Congress on Housing<br />
Transforming Housing Environments through Design<br />
13 Royaume du Maroc, Ministère de l’Intérieur et<br />
Ministère de l’Habitat, de l’Urbanisme et de<br />
l’Aménagement de l’Espace. (2008). Cadre<br />
d’orientation pour une stratégie nationale de<br />
développement urbain. Rabat: Ministère de l’Intérieur<br />
et Ministère de l’Habitat, de l’Urbanisme et de<br />
l’Aménagement de l’Espace.<br />
14 Bigio, A., Adapting for climate change and preparing<br />
for natural disasters in the coastal cities of North<br />
Africa’, p.5. World Bank, June 2009.<br />
15 UN-Habitat. (2002). City Development Strategy for<br />
Tunis. Nairobi: UN-Habitat.<br />
16 World Bank. (2010). Les poles de competitivite en<br />
Tunisie : Note de problematique. Washington D.C. :<br />
The World Bank.<br />
17 World Bank. (2010). Les poles de competitivite en<br />
Tunisie: Note de problematique.<br />
18 Central Intelligence Agency. (2010). The CIA World<br />
Factbook: Tunisia. Washington D.C.: CIA.<br />
19 Institution national de la statistique. (2010).<br />
Employment and unemployment indicators. Tunis: INS<br />
http://www.ins.nat.tn/indexen.php<br />
20 World Bank. (2009). Country Strategy for Tunisia for<br />
the Period FY 10-13.<br />
21 World Bank. (2009). Country Brief for Tunisia.<br />
Washington D.C.: The World Bank.<br />
22 World Bank. (2009). Country Strategy for Tunisia for<br />
the Period FY 10-13.<br />
23 World Bank. (2009). Country Strategy for Tunisia for<br />
the Period FY 10-13.<br />
24 The World Bank. (2009). Country Strategy for<br />
the Kingdom of Morocco for the Period FY 10-13.<br />
Washington D.C.: The World Bank.<br />
25 Portail de la Région du Grand Casablanca. http://www.<br />
casablanca.ma Viewed on 9 January 2010.<br />
26 OECD Development Centre. (2010). African<br />
Economic Outlook-Morocco. Issy les Moulineaux:<br />
OECD Development Centre. http://www.<br />
africaneconomicoutlook.org/en/countries/north-africa/<br />
morocco/<br />
27 Central Intelligence Agency. (2010). The CIA World<br />
Factbook: Morocco. Washington D.C.: CIA.<br />
28 HCP Employment Statistics<br />
29 OECD. 2011. African Economic Outlook 2011: Libya.<br />
Paris: OECD.<br />
30 OECD. 2011. African Economic Outlook 2011: Libya.<br />
Paris: OECD.<br />
31 UN-Habitat. (2007). Libya Urban Planning, Second<br />
Newsletter. Nairobi: UN-Habitat.<br />
32 EU Business (2010), Libya Investment Climate 2009.<br />
33 EU Business (2010), Libya Investment Climate 2009.<br />
34 st UN-Habitat, Libya Urban Planning, 1 newsletter<br />
35 OECD. 2011. African Economic Outlook 2011: Algeria.<br />
Paris: OECD.<br />
36 Republic of Algeria, Plan d’Action du Gouvernement<br />
pour la mise en œuvre du Programme du Président de<br />
la République, pp.21-27.<br />
37 Safar Zitoun, M. & Tabti-Talamali, A. (2009), La<br />
Mobilite Urbaine dans l’Agglomeration d’Alger:<br />
Evolutions et Perspectives, p.24. Plan Bleu.<br />
38 Office National des Statistiques-Algerie. (2011).<br />
Tableau synoptique de la population active en milliers.<br />
Alger: ONS. http://www.ons.dz/<br />
39 World Bank. (2009). Country Strategy for the Kingdom<br />
of Morocco for the Period FY 10-13. Washington D.C.:<br />
125
126<br />
ENDNOTES<br />
The World Bank.<br />
40 Government of Tunisia, Commune Sousse. “Projets<br />
municipaux.”<br />
41 Haut Commissariat au Plan. (2010). Indicateurs<br />
Trimestriels D’Activité et de Chômage par Milieu de<br />
Résidence. Rabat: HCP.<br />
42 Office National des Statistiques.‘Enquête Emploi<br />
auprès des Ménages’, 2007.<br />
43 Office National des Statistiques-Algerie. (2011).<br />
Tableau synoptique de la population active en milliers.<br />
Alger: ONS.<br />
44 World Bank. (2006). Republic of Tunisia: Health Sector<br />
Study. Washington D.C.: The World Bank.<br />
45 Institut national de la statistique. http://www.ins.nat.<br />
tn/. Viewed on 2 February 2011.<br />
46 World Bank. (2009). Country Strategy for Tunisia for<br />
the Period FY 10-13. Washington D.C.: The World Bank.<br />
47 Rapport du Comité Technique Sectoriel, Emploi pour<br />
l’actualisation du plan d’action du CSLP 2011-2015.<br />
48 World Bank. (2009). Country Strategy for the Kingdom<br />
of Morocco for the Period FY 10-13. Washington D.C.:<br />
World Bank.<br />
49 Haut-Commissariat au Plan (Direction de la<br />
Statistique). (2007). Les Indicateurs Sociaux du Maroc<br />
en 2007. Rabat : HCP.<br />
50 Haut-Commissariat au Plan (Direction de la<br />
Statistique). (2007).<br />
51 World Bank. (2009). Country Strategy for Tunisia for<br />
the Period FY 10-13. Washington D.C.: The World Bank.<br />
52 UNESCO. (2008). UNESCO Institute for Statistics.<br />
Paris: UNESCO.<br />
53 Institution national de la statistique. (2010). Tunis: INS<br />
http://www.ins.nat.tn/indexen.php<br />
54 OECD. 2011. African Economic Outlook 2011: Libya.<br />
Paris: OECD.<br />
55 Republic of Algeria, Algerie: 2eme Rapport Nationale<br />
sur les Objectifs du Millenaire pour le Developpement,<br />
p.53.<br />
56 Office Nationale de Statistiques. Retrieved February<br />
20, 2011 at: http://www.ons.dz/IMG/pdf/pop9_<br />
national.pdf<br />
57 Ministère des Affaires Economiques et du<br />
Développement & Office National de la Statistique<br />
(2009), Profil de la Pauvrete en Mauritanie, p.7.<br />
58 World Bank, Maghreb Department. Morocco: National<br />
Initiative for Human Development Support Project.<br />
Washington DC: The World Bank, 2006.<br />
59 World Bank. (2006). Republic of Tunisia: Health Sector<br />
Study. Washington D.C.: The World Bank.<br />
60 Republic of Algeria, Rapport National sur le<br />
Developpement Humain 2006.<br />
61 Stefano (2004) in Hall, C.M., ‘Tourism urbanisation<br />
and global environmental change’, pp.147-148, in<br />
Gosling, S. & Hall, C.M. (eds.) (2006), Tourism & Global<br />
Environmental Change: Ecological, Social, Economic<br />
and Political Interrelationships. Retrieved December 31,<br />
2010<br />
62 Ministry of Development and International Cooperation<br />
(2006), The 11th Plan and the 2007-2016 Decade,<br />
p.126.<br />
63 Oxford Business Group, ‘Tunisia: Tourism upgrades’.<br />
December 22, 2010.<br />
64 BBC. (2007). ‘Reformed Libya eyes eco-tourism boom.’<br />
London: BBC.<br />
65 Embassy of the People’s Republic of Algeria in Sofia,<br />
Bulgaria. (2010). Tourism Sector. Sofia: Embassy of the<br />
People’s Republic of Algeria.<br />
66 The World Bank. (2009). Country Strategy for<br />
the Kingdom of Morocco for the Period FY 10-13.<br />
Washington D.C.: The World Bank.<br />
67 The World Bank. (2009). Country Strategy for the<br />
Kingdom of Morocco for the Period FY 10-13.<br />
68 Lahouel, M.H., ‘’The success of pro-poor growth in<br />
rural and urban Tunisia’, in Besley, T. & Cord, L.J. (eds.)<br />
(2006), Delivering on the Promise of Pro-Poor Growth,<br />
pp.199-218. World Bank/Palgrave Macmillan.<br />
69 Ministère des Affaires Economiques et du<br />
Développement & Office National de la Statistique<br />
(2009), Profil de la Pauvrete en Mauritanie, p.27.<br />
70 The World Bank. (2009). Country Strategy for the<br />
Kingdom of Morocco for the Period FY 10-13.<br />
71 Ministère des Affaires Economiques et du<br />
Développement & Office National de la Statistique<br />
(2009), Profil de la Pauvrete en Mauritanie, p.164.<br />
72 <strong>Cities</strong> <strong>Alliance</strong>/World Bank. (2003). Tunisie: Evaluation<br />
des Programmes de Rehabilitation Urbaines.<br />
Washington D.C.: The World Bank.<br />
73 Al Omrane. (2010). www.alomrane.ma<br />
74 Colliers International. (2010). MENA Real Estate<br />
Overview. Boston: Colliers.<br />
75 Caisse National du Logement. http://www.cnl.gov.<br />
dz/?Resorption-de-l-habitat-precaire<br />
76 Republic of Algeria, Algerie: 2eme Rapport Nationale<br />
sur les Objectifs du Millenaire pour le Developpement,<br />
p.112.<br />
77 Ministère des Affaires Economiques et du<br />
Développement & Office National de la Statistique<br />
(2009), Profil de la Pauvrete en Mauritanie, p.8.<br />
78 Communauté urbaine de Nouakchott, Household<br />
Survey, October 2008.<br />
79 World Bank. (2005). Country Assistance Strategy<br />
Progress Report. Washington D.C.: The World Bank.<br />
80 World Bank (2005), Housing Policies and Sector<br />
Performances in MENA Countries, p.3. Retrieved<br />
February 20, 2011. UN-Habitat (2005), Financing<br />
Urban Shelter: Global Report on Human Settlements<br />
2005, p.55. Retrieved February 20, 2011.<br />
81 Bellal, T. (2009), ‘Housing supply in Algeria:<br />
affordability matters than availability’. Theoretical and<br />
Empirical Researches in Urban Management, 3 (12).<br />
Retrieved February 20, 2011 at: http://www.um.ase.<br />
ro/No12/8.pdf<br />
82 World Bank. (2005). The Macroeconomic and Sectoral<br />
Performance of Housing Supply Policies in Selected<br />
MENA Countries: A Comparative Analysis. Washington<br />
D.C.: The World Bank.<br />
83 <strong>Cities</strong> <strong>Alliance</strong>/World Bank. (2003). Tunisie : Evaluation<br />
des Programmes de Rehabilitation Urbaines.<br />
Washington D.C.: The World Bank.<br />
84 Slackman, M. Social issues clown their way to centre<br />
stage in Libya. New York Times, Mar. 12, 2007.<br />
http://nytimes.com/2007/03/12/world/africa/12libya.<br />
html?_r=1<br />
85 CHF International. (2005). Practical Guide For<br />
Housing Microfinance In Morocco. Silver Spring: CHF<br />
International.<br />
86 CHF International. (2005).<br />
87 CHF International. (2005).<br />
88 World Bank./IMF (2004), Algeria Financial Sector<br />
Assessment, p.3.<br />
89 Colliers International. (2010). MENA Real Estate<br />
Overview. Boston: Colliers.<br />
90 EU Business. (2010). Libya Investment Climate 2009.<br />
91 UN-Habitat. 2010 State of the African <strong>Cities</strong>. Nairobi:<br />
UN-Habitat, 2010.<br />
92 Serageldin, M., et al., 1979.<br />
93 World Bank. (2005). The Macroeconomic and Sectoral<br />
Performance of Housing Supply Policies in Selected<br />
MENA Countries: A Comparative Analysis. Washington<br />
D.C.: The World Bank.<br />
94 Global Property Guide<br />
95 Colliers International. (2010). MENA Real Estate<br />
Overview. Boston: Colliers.<br />
96 Global Property Guide. (2010). Manila: Global Property<br />
Guide.<br />
97 World Bank. (2005). Housing Sector Development<br />
Policy Loan. Washington D.C. : The World Bank.<br />
98 M’Hassni, M, Feljy, M, and Khalali H. (2003).<br />
“L’évolution de la Propriété Foncière”. Copenhagen:<br />
Fédération Internationale des Géomètres.<br />
99 World Bank, ‘Cluster project performance<br />
assessment’, pp. x, 11. June 29, 2010.<br />
100 “Urban Transport in the Mediterranean Region:<br />
Guidance and Recommendations.” Product of<br />
the Regional Seminar on Urban Transport in the<br />
Mediterranean Region held in Skhirat, Morocco, on<br />
January 22-23, 2008.<br />
101 Le Tellier, J., F. Debbi, and L. Amzil. “La Mobilité<br />
Urbaine dans L’Agglomération de Tanger: Evolutions et<br />
Perspectives.” Sophia Antipolis: Plan Bleu, 2009.<br />
102 Abdelkader, Z.B. “Express Metro and Light Rail Will<br />
Support Capital’s Growth.” Railway Gazette, April 1,<br />
2007.<br />
103 “Urban Transport in the Mediterranean Region:<br />
Guidance and Recommendations.” Product of<br />
the Regional Seminar on Urban Transport in the<br />
Mediterranean Region held in Skhirat, Morocco, on<br />
January 22-23, 2008.<br />
104 “Urban Transport in the Mediterranean Region: Guidance<br />
and Recommendations.” Product of the Regional<br />
Seminar on Urban Transport in the Mediterranean<br />
Region held in Skhirat, Morocco, on January 22-23,<br />
2008. And Houpin, S. “Urban Mobility and Sustainable<br />
Development in the Mediterranean: Regional Diagnostic<br />
Outlook.” Sophia Antipolis: Plan Bleu, 2010.<br />
105 Safar Zitoun, M. and A. Tabti-Talamali. “La Mobilité<br />
Urbaine dans L’Agglomération d’Alger: Evolutions<br />
et Perspectives.” Algiers: Plan Bleu, 2009. And Le<br />
Tellier, J., F. Debbi, and L. Amzil. “La Mobilité Urbaine<br />
dans L’Agglomération de Tanger: Evolutions et<br />
Perspectives.” Sophia Antipolis: Plan Bleu, 2009.<br />
106 World Health Organization. “Global Status Report on<br />
Road Safety: Time for Action.” Geneva: World Health<br />
Organization, 2009.<br />
107 World Health Organization, 2009. Although Algeria<br />
was not included in the WHO study, which used<br />
binomial regressions to determine the rate of fatalities<br />
per 100,000, the county suffered 4,177 traffic<br />
fatalities in 2007 out of a population of almost 35<br />
million, putting it on par with Morocco’s level.<br />
108 World Health Organization, 2009.<br />
109 FAO Aquastat Database<br />
110 National Intelligence Council. “North Africa: the<br />
Impact of Climate Change to 2030, Geopolitical<br />
Implications.” Washington, D.C.: National Intelligence<br />
Council, 2009.<br />
111 Government of Morocco. “La Nouvelle Stratégie<br />
Agricole au Maroc (Plan Vert): Les Clés de la<br />
Réussite.” Rabat: 2008.<br />
112 Thibault, H-L. “Les Arbitrages Concernant l’Eau<br />
Agricole dans un Contexte de Raréfaction de la<br />
Ressource.” Presentation Made at the conference<br />
Crise Alimentaire et Raréfaction de L’Eau au Maghreb,<br />
Paris, Feb. 23, 2009.<br />
113 Mustapha, M. “The ONEP Experience for Wastewater<br />
Treatment in Small Communities: Current Situation<br />
and Prospects.” Desalination, 246 (2009): 613-616.<br />
114 Rifki, M. “Programme National d’Assainissement<br />
Liquide et d’Epuration des Eaux Usées.” Presentation<br />
made at the workshop “Situation et Perspectives<br />
d’Assainissement au Maroc” in Agadir, Morocco on<br />
Dec. 7, 2009.<br />
115 ONAS. “Présentation de la Stratégie Future.”<br />
116 World Bank. “Making the Most of Scarcity:<br />
Accountability for Better Water Management Results<br />
in the Middle East and North Africa.” Washington,<br />
D.C.: The World Bank, 2007. Data on Oran from<br />
World Bank 2000 data<br />
117 FAO Aquastat Database<br />
118 Global Water Intelligence, 2005 Water Tariffs Survey<br />
(2010 available, for fee)<br />
119 World Bank, Making the Most of Scarcity, 2007.<br />
120 <strong>Arab</strong> Forum for Environment and Development.<br />
“Water: Sustainable Management of a Scarce<br />
Resource.” <strong>Arab</strong> Forum for Environment and
ENDNOTES<br />
Development, 2010. Also, National Intelligence<br />
Council. “North Africa: the Impact of Climate Change,<br />
Geopolitical Implications.” Washington, D.C.: National<br />
Intelligence Council, 2009.<br />
121 World Bank. “Improving Food Security in <strong>Arab</strong><br />
Countries.” Washington, D.C.: World Bank, 2009.<br />
Also, World Bank and the Agence Française de<br />
Developpement. “Managing the Social Dimensions<br />
of Climate Change in MENA: Climate Change and<br />
Human Mobility Concept Note developed for the<br />
“First Workshop on Climate Induced Migration and<br />
Displacement in MENA” on June 15-16, 2010 at<br />
Marseille, France.<br />
122 National Intelligence Council. “North Africa: the Impact<br />
of Climate Change to 2030, Geopolitical Implications.”<br />
Washington, D.C.: National Intelligence Council, 2009.<br />
123 UN-Habitat Global Urban Observatory as cited in<br />
UN-Habitat. “State of the World <strong>Cities</strong> 2008/2009.”<br />
Nairobi: UN-Habitat, 2009.<br />
124 World Bank. “Improving Food Security in <strong>Arab</strong><br />
Countries.” Washington, D.C.: World Bank, 2009.<br />
125 International Energy Agency. 2006. World Energy<br />
Outlook 2006.<br />
126 World Bank. World Development Indicators Online<br />
Database. Washington, DC.<br />
127 International Energy Agency. 2006. World Energy<br />
Outlook 2008.<br />
128 Walters, Jonathan. “MENA Concentrated Solar Power<br />
(CSP) Scale-Up Initiative.” Presentation Made at the<br />
Conference on the Mediterranean Solar Plan held in<br />
Valencia, Spain on May 11-12, 2010.<br />
129 REN21. “Renewables 2007 Global Status Report.”<br />
REN21, 2007.<br />
130 UNEP. “Partnership for Clean Fuels and Vehicles Core<br />
Campaigns: Global Phase-out of Leaded Petrol.”<br />
131 Sarra, A. “La Bruit dans les Grandes Villes: Une<br />
Pollution Negligee.” Webmanagercenter.com July 7,<br />
2008.<br />
132 World Bank. “Rapport du Pays – Maroc”; “Rapport<br />
du Pays - Tunisie”; and “Rapport du Pays – Algerie”.<br />
World Bank Mediterranean Environmental Technical<br />
Assistance Programme (METAP), 2004.<br />
133 World Bank. “Rapport du Pays – Maroc”; and “Rapport<br />
du Pays – Algerie”. World Bank Mediterranean<br />
Environmental Technical Assistance Programme<br />
(METAP), 2004.<br />
134 World Bank. “Project Appraisal Document on a<br />
Proposed Loan in the Amount of Euros 16.8 Million<br />
to the Republic of Tunisia for a Sustainable Municipal<br />
Solid Waste Management Project.” Washington, DC:<br />
BOX ENDNOTES<br />
1 Agence de réhabilitation et de rénovation urbaine<br />
(ARRU). (2011).<br />
2 UN-Habitat. (2010). State of the World’s <strong>Cities</strong> Report<br />
2010. Nairobi: UN-Habitat.<br />
3 Al Omrane. (2010). www.alomrane.ma<br />
4 UN-Habitat. (2008). State of the African <strong>Cities</strong>. Nairobi:<br />
UN-Habitat.<br />
5 Center for Urban Development Studies. (2001). Case<br />
World Bank, 2007.<br />
135 World Bank. “Project Appraisal Document on a<br />
Proposed Loan in the Amount of Euros 16.8 Million<br />
to the Republic of Tunisia for a Sustainable Municipal<br />
Solid Waste Management Project.” Washington, DC:<br />
World Bank, 2007.<br />
136 World Bank. “Program Document for a Proposed Loan<br />
to the Kingdom of Morocco for a Municipal Solid<br />
Waste Sector Development Policy Loan.” Washington,<br />
D.C.: World Bank, 2009.<br />
137 European Commission on the Environment. “Support<br />
to the DG Environment for Development of the<br />
Mediterranean De-Pollution Initiative ‘Horizon 2020’”.<br />
European Commission, 2006.<br />
138 “Alger, classée en avant-dernière position dans la liste<br />
des villes au monde ayant subies une évaluation du<br />
cadre de vie.” Echorouk Online, June 12, 2009.<br />
139 UN-Habitat. “State of African <strong>Cities</strong> 2008.” Nairobi:<br />
UN-Habitat, 2008.<br />
140 Tosun, M.S. and S. Yilmaz. “Centralization,<br />
Decentralization, and Conflict in the Middle East and<br />
North Africa.” Washington, D.C.: World Bank, 2008.<br />
141 Tosun, M.S. and S. Yilmaz, 2008.<br />
142 Transparency International. “National Integrity System:<br />
Morocco.” 2009<br />
143 Dimitrovova, B. “Reshaping Civil Society in Morocco:<br />
Boundary Setting, Integration and Consolidation.”<br />
Centre for European Policy Studies, 2009.<br />
144 Freedom House. Retrieved December 31, 2010<br />
145 Liverani, A. Civil Society in Algeria: the Political<br />
Functions of Associational Life. New York: Routledge,<br />
2008.<br />
146 EU Business (2010), Libya Investment Climate 2009.<br />
147 UNDP. “<strong>Arab</strong> Human Development Report.” New York,<br />
NY: UNDP, 2006.<br />
148 Sadiqi, F. “Morocco.” Chapter in Sanja, K. and J.<br />
Breslin, eds. Women’s Rights in the Middle East and<br />
North Africa: Progress amid Resistance. New York, NY:<br />
Freedom House, 2010.<br />
149 Marzouki, N. “Algeria.” Chapter in Sanja, K. and J.<br />
Breslin, eds. Women’s Rights in the Middle East and<br />
North Africa: Progress amid Resistance. New York, NY:<br />
Freedom House, 2010.<br />
150 Pargeter, A. “Libya.” Chapter in Sanja, K. and J.<br />
Breslin, eds. Women’s Rights in the Middle East and<br />
North Africa: Progress amid Resistance. New York, NY:<br />
Freedom House, 2010.<br />
151 Di Bartolomeo, A., T. Fakhoury, and D. Perrin. “CARIM<br />
– Migration Profile: Tunisia.” European University<br />
Institute Consortium for Applied Research on<br />
Study on the Twizé programme. Cambridge: CUDS.<br />
6 Center for Urban Development Studies. (2001). Case<br />
Study on the Twizé programme. Cambridge: CUDS.<br />
7 Wahba, S. (2002). From land distribution to integrated<br />
development: the evolution and impact of shelter and<br />
poverty alleviation policies in marginalized settlements<br />
in Nouakchott, Mauritania. Cambridge: Harvard.<br />
8 Choplin, A. (2009). Répondre au défi de l’habitat social<br />
International Migration, 2010.<br />
152 International Organization for Migration, 2010.<br />
153 International Organization for Migration. “Migration<br />
Crisis from Libya: Daily Statistical Report.” August 7,<br />
2011. Also, European Commission. “ECHO Situation<br />
Map - August 2011.”<br />
154 De Haas, H. “Trans-Saharan Migration to North Africa<br />
and the EU: Historical Roots and Current Trends.”<br />
Washington, DC: Migration Policy Institute, 2006.<br />
155 De Haas, 2006.<br />
156 Di Bartolomeo, A., T. Jaulin, and D. Perrin, 2010.<br />
157 Di Bartolomeo, A., T. Jaulin, and D. Perrin, 2010.<br />
158 Di Bartolomeo, A., T. Fakhoury, and D. Perrin. “CARIM<br />
– Migration Profile: Morocco.” European University<br />
Institute Consortium for Applied Research on<br />
International Migration, 2010.<br />
159 Barendse, J., C. Hiddink, A. Janszen, and A. Stavast.<br />
“The Remittance Corridor of the Netherlands-<br />
Morocco: Review of Obstacles and Recommendations<br />
on How to Increase Use of the Bank Channel.”<br />
Rotterdam: ECORYS Nederland BV, 2006.<br />
160 De Haas, H. “Trans-Saharan Migration to North Africa<br />
and the EU: Historical Roots and Current Trends.”<br />
Washington, DC: Migration Policy Institute, 2006.<br />
161 UN-Habitat. “State of African <strong>Cities</strong> 2008.” Available<br />
online at: “State of African <strong>Cities</strong> 2010.”<br />
162 “Tanger-Med Expansion: King Launches Construction<br />
Works.” Morocco Business News, Jun. 18, 2009.<br />
163 Oxford Business Group. “The Report: Morocco 2009.”<br />
164 2008 data from Centre d’Etudes et de Recherches<br />
Démographiques (CERED) as cited in Le Maroc en<br />
Chiffres 2008<br />
165 World Bank. “Economic Integration in MENA: the GCC,<br />
the Maghreb, and the Mashreq.” MENA Knowledge<br />
and Learning Quick Notes Series. Washington DC:<br />
October 2010.<br />
166 World Bank. “Is There a New Vision for Maghreb<br />
Economic Integration? Volume 1: Main Report.”<br />
Washington, D.C.: World Bank, 2006.<br />
167 Benabderrazik, H. “Opportunities for Logistical<br />
Improvements through Maghreb Integration.” Chapter<br />
in Hufbauer, G. and C. Brunel, eds. Maghreb Regional<br />
and Global Integration: a Dream to be Fulfilled.<br />
Washington, D.C.: Peterson Institute for International<br />
Economics, 2008.<br />
168 Benabderrazik, H. “Opportunities for Logistical<br />
Improvements through Maghreb Integration.” Chapter<br />
11 in Hufbauer, G. and C. Brunel, eds. Maghreb<br />
Regional and Global Integration: a Dream to be<br />
Fulfilled. Washington, D.C.: Peterson Institute for<br />
International Economics, 2008.<br />
dans les villes du Sud: l’exemple du programme Twise<br />
en Mauritanie. Les Editions du Gret: Etudes et Travaux<br />
en Ligne #23.<br />
9 Choplin, A. (2009<br />
10 Groupe de recherche et d’échanges technologiques.<br />
(2009). GRET Annual Report. Nogent-sur-Marne: GRET.<br />
11 Choplin, A. (2009).<br />
127
128<br />
Mecca, Saudi <strong>Arab</strong>ia.<br />
Saudi <strong>Arab</strong>ia is home<br />
to 67 per cent of GCC<br />
residents and the holiest<br />
city in the religion of<br />
Islam. ©Ahmad Faizal<br />
Yahya/iStockphoto<br />
CHAPTER FOUR<br />
THE STATE OF GCC CITIES
4.1<br />
The Gulf Cooperation Council (GCC), comprised of<br />
Bahrain, Kuwait, Oman, Qatar, Saudi <strong>Arab</strong>ia and the<br />
United <strong>Arab</strong> Emirates, is home to a population of over<br />
39 million residents, of whom nearly 67 per cent reside in<br />
Saudi <strong>Arab</strong>ia. 1 With the exception of Qatar, total population<br />
growth has been relatively slow and declining.<br />
The GCC is one of the most urbanized areas in the world,<br />
with over 70 per cent of the population living in urban areas<br />
and with Kuwait and Qatar almost 100 per cent urbanized.<br />
Urban expansion in the region has been fuelled by both internal<br />
migration and the influx of expatriate workers attracted by the<br />
region’s economic prosperity and employment opportunities.<br />
Recent urban growth rates, however, have been relatively<br />
moderate and, in the next two decades, are expected to slow<br />
further to approximately 1 to 2 per cent in all countries of this<br />
sub-region. 2 Despite these slowing urban growth rates, the urban<br />
populations in all countries will continue to grow more rapidly<br />
than the total populations, implying continued urbanization.<br />
Therefore, it will be important to manage this urban growth to<br />
prevent unplanned and chaotic informal development.<br />
Demographic Characteristics and Urban<br />
Concentrations<br />
A significant portion of the residents of GCC countries are<br />
young male expatriate workers, many from Asia, attracted by<br />
the region’s employment opportunities. In Oman, for instance,<br />
FIGURE 34: TOTAL POPULATION GROWTH RATES<br />
Per cent<br />
12<br />
10<br />
8<br />
6<br />
4<br />
2<br />
0<br />
-2<br />
-4<br />
-6<br />
Source: UN-DESA, 2008.<br />
Population and Urbanization<br />
TABLE 56: CITY POPULATIONS FOR SAUDI ARABIA (IN THOUSANDS)<br />
Bahrain<br />
Kuwait<br />
Oman<br />
Qatar<br />
approximately 600,000 or 28 per cent of the urban population<br />
are guest workers from Bangladesh, Egypt, India, Jordan,<br />
Pakistan and the Philippines. As a result, the ratio of males<br />
to females is high in all cities, reaching 5.42 males for every<br />
female in Doha, for instance. 3 The population is also very<br />
young with nearly 50 per cent of the total population under<br />
the age of 24 in Saudi <strong>Arab</strong>ia and Kuwait. In most countries<br />
in the <strong>Arab</strong> world, the urban population is concentrated in a<br />
few primary cities, mostly along the coast.<br />
In the UAE, the majority of the population lives in Abu<br />
Dhabi City, Dubai and Sharjah. In Oman, most live in<br />
Muscat and Al-Batinah along the northern coast, with a<br />
smaller concentration in the southern Dhofar region. Other<br />
important cities include Muttrah, a historic trade centre and<br />
the country’s main commercial port, and Bawahar where<br />
a number of government offices are located. 4 In Qatar,<br />
90 per cent of the population lives in the Greater Doha<br />
Metropolitan Area, the coastal capital city. 5 The population of<br />
Bahrain is concentrated most in the north and the Muharraq<br />
governorates in the northeast. Bahrain has among the highest<br />
population densities in the world, reaching from 3,000 to<br />
4,000 people/km² in the capital, Manama. 6 In Kuwait, most<br />
of the population lives in and around Kuwait City (76.8 per<br />
cent of the urban population and 75.6 per cent of the total<br />
population). 7 In Saudi <strong>Arab</strong>ia, most of the population is<br />
concentrated in the capital Riyadh, the secondary cities Jeddah<br />
and Dammam, and the holy cities of Mecca and Medina.<br />
City Riyadh Jeddah Mecca Medina Dammam<br />
Population 4,848 3,234 1,484 1,104 902<br />
Source: UN-DESA, 2009.<br />
Saudi <strong>Arab</strong>ia<br />
UAE<br />
1990-1995<br />
1995-2000<br />
2000-2005<br />
2005-2010<br />
2010-2015<br />
2015-2020<br />
2020-2025<br />
2025-2030<br />
129
130<br />
FIGURE 35: URBAN GROWTH RATES<br />
Per cent<br />
12<br />
10<br />
8<br />
6<br />
4<br />
2<br />
0<br />
-2<br />
-4<br />
-6<br />
Bahrain<br />
Source: UN-DESA, 2009.<br />
FIGURE 36: GROWTH RATES FOR THE LARGEST CITIES<br />
Per cent<br />
8<br />
6<br />
4<br />
2<br />
0<br />
-2<br />
-4<br />
Kuwait City<br />
Source: UN-DESA, 2009.<br />
Ad-Dammam<br />
Kuwait<br />
Medina<br />
Development Strategies and Plans<br />
Oman<br />
Riyadh<br />
With the exception of Qatar, all countries in the region<br />
have adopted spatial development strategies to manage<br />
growth and, given the dominance of primary cities, most<br />
countries are now making an effort to shift growth to<br />
secondary cities.<br />
The government of Oman launched its National Spatial<br />
Strategy in 2010, a 30-year development plan designed to<br />
promote geographically balanced and sustainable growth<br />
in line with its 2020 vision. 8 It focuses on developing both<br />
urban and rural areas through land planning, economic<br />
development, infrastructure, social services, heritage<br />
conservation and environmental protection. 9 As part of<br />
the National Population Strategy, the government will also<br />
address such issues as increasing the number of national<br />
Qatar<br />
Jeddah<br />
Mecca<br />
Saudi <strong>Arab</strong>ia<br />
Dubai<br />
UAE<br />
Sharjah<br />
FIGURE 37: GCC COUNTRIES AND MAJOR CITIES<br />
JORDAN<br />
EGYPT<br />
SUDAN<br />
Jeddah<br />
Red<br />
Sea<br />
Medina<br />
Mecca<br />
SAUDI ARABIA<br />
ERITREA Jizan<br />
YEMEN<br />
1990-1995<br />
1995-2000<br />
2000-2005<br />
2005-2010<br />
2010-2015<br />
2015-2020<br />
2020-2025<br />
2025-2030<br />
1990-1995<br />
1995-2000<br />
2000-2005<br />
2005-2010<br />
2010-2015<br />
2015-2020<br />
2020-2025<br />
KUWAIT<br />
BAHRAIN<br />
OMAN<br />
Manama<br />
Dubai<br />
Doha<br />
QATAR Abu Dhabi<br />
Riyadh<br />
UAE Muscat<br />
Kuwait<br />
IRAQ<br />
ISLAMIC<br />
REPUBLIC OF<br />
IRAN<br />
<strong>Arab</strong>ian<br />
Gulf<br />
Dammam<br />
Hofuf<br />
OMAN<br />
<strong>Arab</strong>ian<br />
Sea
FIGURE 38: THE DIYAR AL MUHARRAQ PROJECT, BAHRAIN<br />
workers in the labour force, creating the incentives to limit<br />
migration from rural to urban areas and narrowing the<br />
economic gap between towns and villages. 10<br />
In Bahrain, whose limited land resources and high<br />
population density limits opportunities for expansion, the<br />
2008 National Planning Development Strategy includes<br />
land reclamation projects around the coves and islands<br />
surrounding the mainland. 11<br />
One of the largest projects in the country is the construction<br />
of Diyar al Muharraq which will reportedly house 100,000<br />
residents on reclaimed land off the northern coast. 12 The<br />
strategy also addresses employment generation, housing<br />
shortages, infrastructure shortfalls, inadequate access to<br />
education, and the protection of natural resources.<br />
It also includes a national planning framework to expand<br />
Bahrain’s access to global markets, preserve its environmental<br />
resources, develop an integrated transport network, build<br />
new communities, accentuate the waterfront, protect its<br />
heritage, ‘green’ the country and build a sustainable future. 13<br />
The government has also recently embarked on developing a<br />
new national master plan for the creation of new towns and<br />
industrial areas, balancing economic development with well<br />
designed spatial planning. 14<br />
In Kuwait, the government has commissioned the<br />
development of a plan for Kuwait City’s expansion in<br />
conjunction with the national Kuwait 2030 initiative. The<br />
national plan will accommodate growth by creating three<br />
new urban regions in the northern, southern and western<br />
parts of the country and an expanded metropolitan area in<br />
Kuwait City.<br />
King Fahd Causeway<br />
Source: Diyar al Muharraq.<br />
Manama<br />
Bahrain International<br />
Circuit<br />
DIYAR AL MUHARRAQ<br />
Bahrain International Airport<br />
Muharraq<br />
Khalifa Bin<br />
Salman Port<br />
Future Bahrain Qatar Causeway<br />
Durrat Al Bahrain<br />
HAWAR ISLANDS<br />
In the north, the government plans to create a development<br />
corridor, which will include a deep sea port, agricultural<br />
development, support for industrial and touristic activities<br />
and infrastructure upgrades for road, rail and air transport. In<br />
the south, the government will create a development pole by<br />
supporting agriculture, industry and tourism and generating<br />
new housing developments. In the west, the government<br />
plans to add residential areas and major road networks. The<br />
metropolitan area will also accommodate additional growth<br />
with new towns and settlements outside the area. 15<br />
The aims of the city plan are to transform the capital into<br />
a major financial and commercial centre and to prepare for<br />
population expansion through 2030. 16 The plan also includes<br />
transportation upgrades, further development of commercial<br />
and entertainment activities, creating a pedestrian network,<br />
preserving historic buildings and improving the downtown<br />
area. 17<br />
In 2000, the government of Saudi <strong>Arab</strong>ia launched its<br />
National Spatial Strategy in anticipation of the country’s<br />
rising population and rapid urbanization. In particular, the<br />
strategy aimed to reduce urban sprawl, promoting spatiallybalanced<br />
development and protecting the environment. 18<br />
It focuses on creating (eastern, central and western)<br />
development corridors and targeted investment to lessdeveloped<br />
regions, designating small- and medium-sized<br />
cities as regional growth centres.<br />
Saudi <strong>Arab</strong>ia’s 9 th National Development Plan (2010-<br />
14) has five major themes: improving the quality of life,<br />
particularly through resource conservation and environmental<br />
protection; increasing national participation rates in the labour<br />
131
132<br />
market, especially among the young to reduce the country’s<br />
dependence on expatriate workers; creating balanced regional<br />
development; promoting diversified economic development<br />
through greater private sector involvement and the creation<br />
of a knowledge economy and increasing the competitiveness<br />
of the national economy in the global market. 19<br />
In the UAE, both Abu Dhabi and Dubai have strategic<br />
plans. Abu Dhabi’s Vision 2030 sets key targets for the<br />
emirate’s development over the next 20 years, with a central<br />
focus on investment, urban development and infrastructure. 20<br />
The plan places particular emphasis on the development of an<br />
environmentally sustainable framework. It posits as a central<br />
aim that Abu Dhabi should be a healthy, socially cohesive<br />
contemporary <strong>Arab</strong> City whose development reflects its<br />
stature as the capital of the UAE.<br />
Abu Dhabi promotes measured economic growth, the<br />
construction of affordable housing, mixed use neighbourhoods,<br />
walkable streets and a publicly accessible waterfront. 21 It<br />
proposes the creation of twin city centres (one in downtown,<br />
the other in the newly created Capital District) to facilitate<br />
traffic flows and to ease congestion with an integrated public<br />
transport system.<br />
Abu Dhabi includes an Open Space Framework plan with<br />
pedestrian paths providing access across the city. The city’s<br />
precinct system promotes distinct local identities, with high<br />
density in selected areas. 22 It proposes to mitigate excessive<br />
commercial development and prevent a surplus of high<br />
density housing for expatriates. 23<br />
In addition to government buildings, the new Capital<br />
District on Al Suwwah Island, on the eastern side of the city,<br />
will be developed for knowledge-based employment and to<br />
define the growth limits of the city to prevent uncontrolled<br />
sprawl. 24 Abu Dhabi’s ‘capital city framework’ also envisions<br />
iconic and monumental planning and architecture to<br />
highlight the status of the capital city. 25<br />
The Dubai Strategic Plan 2015 emphasizes optimal land<br />
use through careful urban planning, efficient resource use<br />
and a sustainable environment. The plan focuses on increased<br />
low- and middle-income housing, updated labour housing<br />
policies and an integrated transport system. It also aims to<br />
sustain a real GDP growth of 11 per cent per annum over the<br />
next ten years and enhance labour productivity. 26<br />
Although Qatar does not currently have a national<br />
planning strategy, legislative framework or single planning<br />
agency, the government is working to develop a hierarchy<br />
of plans and stronger regulations, foster cooperation among<br />
all of the administrative entities and provide resources to<br />
increase the capacity of local agencies to plan and implement<br />
programmes. 27<br />
FIGURE 39: DUBAI’S MASTER PLAN SHOWING NEW PROJECTS AND MAIN ICONIC DEVELOPMENTS (INCLUDING PALM ISLANDS 1, 2 & 3)<br />
Dubai<br />
waterfront<br />
Dubai<br />
waterfront<br />
Dubai<br />
Industrial<br />
City<br />
N<br />
Source: Dubai Municipality.<br />
MRTP<br />
Sheikh Mohammed<br />
Rashid<br />
Technology<br />
Park<br />
Dubai<br />
Aid City<br />
International Airport<br />
Jebel Ali<br />
The Palm Jebel Ali<br />
The Lost<br />
City<br />
The Palm Jumeirah<br />
Dubai<br />
Sports City<br />
Dubai<br />
Investments<br />
Park<br />
Motor City<br />
Studio City<br />
Studio City 2<br />
Golf City<br />
Dubailand<br />
The World<br />
The Palm Deira<br />
Maritime<br />
City<br />
Dubai<br />
Festival<br />
City<br />
International<br />
City
4.2<br />
The Growing Economic Role of <strong>Cities</strong><br />
<br />
The Yas Marina Formula 1 Grand Prix Circuit in Abu Dhabi, UAE. ©Hainaultphoto/Shutterstock<br />
Historically, most countries in the GCC region<br />
were modest fishing and trading settlements. The<br />
discovery of oil has increased wealth and spurred<br />
significant development and economic expansion. The GCC<br />
countries now have among the highest economic GDP per<br />
capita in the world.<br />
There is a need to reduce reliance on their oil and gas reserves.<br />
Most of the GCC countries are becoming more integrated<br />
into the world economy and are diversifying their economies,<br />
including the development of knowledge-based activities.<br />
Many are also shifting the concentration of economic activities<br />
from the primary cities to secondary locations.<br />
To reduce its dependence on oil, the UAE has launched<br />
a diversification and liberalization programme to transform<br />
the conventional labour-intensive economy to one based on<br />
knowledge, technology and skilled labour. The government<br />
has invested heavily in aluminium production, tourism,<br />
aviation, re-export commerce and telecommunications.<br />
The impact of diversification is apparent: the contribution<br />
of the non-oil sector rose from 46 per cent of GDP in 1975 to<br />
90 per cent in 2000 and 95 per cent in 2005. The largest share<br />
gains were in the trade, construction and real estate sectors<br />
which, between 2000 and 2005, grew by 6.7, 4.1 and 2.3 per<br />
cent respectively.<br />
Most of the UAE economic activities are concentrated in<br />
Abu Dhabi and Dubai. In Abu Dhabi, the 2030 Economic<br />
Vision aims to develop a sustainable knowledge economy,<br />
a thriving private sector, transparent regulations, strong<br />
international relationships, high quality national education<br />
and health care, domestic and international security, and<br />
social and cultural integrity. It seeks to enhance these areas<br />
through economic development, social and human capital<br />
development, infrastructure and environmental sustainability,<br />
and enhanced government operations. 28 The focus will be on<br />
energy, petrochemicals, aviation, armaments, pharmaceuticals,<br />
transportation and telecommunications. 29 The plan also aims<br />
to transform Abu Dhabi into a financial and trade hub and<br />
places an emphasis on tourism and environmental projects. 30<br />
In Dubai, the plan will focus on tourism, financial services,<br />
transport, trade and construction. 31<br />
Despite the impacts of the global financial crisis, the UAE<br />
economy remains robust, shielded by significant overseas<br />
133
134<br />
BOX 16: QATAR, BAHRAIN AND SAUDI ARABIA: THE POST-OIL KNOWLEDGE ECONOMY<br />
Oil-wealthy states in the Middle East<br />
have used their hydrocarbon endowments to<br />
rapidly develop their economies. But, given<br />
the looming post-global and post-oil paradigm,<br />
oil-producing states need to broaden their<br />
economic horizons. The United <strong>Arab</strong> Emirates<br />
and Bahrain were the first to start this difficult,<br />
yet inevitable economic reorientation. Although<br />
Dubai has now successfully accomplished the<br />
transition, its economy continues to evolve<br />
and, given recent developments, it is clear<br />
that their model of development will need to<br />
be comprehensively reevaluated to assure<br />
sustainability.<br />
<strong>Arab</strong> states with economies overwhelmingly<br />
dependent on mineral extraction perceive the<br />
knowledge and services sectors as the most<br />
appropriate future direction and the huge<br />
investment flows that over the past five years<br />
financed iconic real estate developments<br />
are now being shifted towards the planning<br />
and financing of knowledge centers. Urbanbased<br />
knowledge zones are increasingly<br />
being established in Abu Dhabi, Doha, Dubai,<br />
Manama, Riyadh and other cities.<br />
Knowledge and creative economies are<br />
structured around the value of people. The<br />
challenge is to create the ideal environments<br />
to encourage knowledge transfer and<br />
production, while nurturing creativity.<br />
Dubai’s Internet City is a unique development<br />
established in the Dubai Technology and<br />
Media Free Zone - a tax-free commercial site<br />
supporting the development of the knowledge,<br />
media and education sectors. Over the past<br />
three years, Dubai Internet City has provided<br />
business and community infrastructures for ICT<br />
companies and is now home to some 1,200<br />
companies with more than 10,000 employees.<br />
Doha: A Budding Gulf Knowledge City<br />
Whereas Doha was originally a small<br />
fishing and pearl diving town, today the city<br />
is home to more than 90 per cent of the<br />
country’s 1.6 million inhabitants - the majority<br />
of whom are expatriates. Although Qatar has<br />
been on a USD 75 billion spending spree to<br />
acquire assets across the globe, the country<br />
acknowledges the importance of development<br />
of Doha is set to change immeasurably over<br />
the coming years.<br />
Already a successful example of<br />
incorporating knowledge within the city, Doha<br />
will need to develop its social infrastructures<br />
further, especially focusing on educational<br />
institutions and environments that foster<br />
the very innovation on which knowledge<br />
economies are based. Qatar’s experience so<br />
far provides a positive example with its mega<br />
knowledge economy projects - the Science<br />
and Technology Oasis and the Education City -<br />
establishing interactive centres for knowledge<br />
production and transfer.<br />
The Qatar Foundation’s Education City - a<br />
dynamically expanding intellectual polis for<br />
the 21st Century - is set to become a selfcontained<br />
community designed to the highest<br />
standards. The third master plan for Education<br />
City, unveiled in early 2004, envisaged major<br />
new developments by 2009. It has grown from<br />
500,000 to some 10 million m2 to be expanded<br />
further with a Science and Technology Park.<br />
By the end of 2007, the first phase of Qatar’s<br />
Science and Technology Park was opened<br />
and now accommodates commercial giants<br />
like ExxonMobil and the European Aeronautic<br />
Defense and Space Company.<br />
The Qatar Foundation is headquartered in<br />
Education City, a 10,000 m2 campus on the<br />
outskirts of Doha which hosts branch campuses<br />
of some of the world’s leading universities<br />
as well as numerous other educational<br />
and research institutions. Education City is<br />
envisioned to serve Qatar’s citizenry from early<br />
childhood education to post-graduate studies<br />
and to become a hub for new knowledge with<br />
world-class research facilities and a pool of<br />
well-trained graduates.<br />
Saudi <strong>Arab</strong>ia: King Abdullah<br />
Economic City<br />
With a development area of 173 km², the<br />
USD 86 billion King Abdullah Economic City is<br />
located along the coast of the Red Sea, some<br />
100 km north of Jeddah, the commercial<br />
hub of the kingdom. Together with five other<br />
cities, King Abdullah Economic City is a part of<br />
an ambitious program to place Saudi <strong>Arab</strong>ia<br />
among the world’s top competitive investment<br />
destinations. The first stage of the city was<br />
completed in 2010, while the completion of<br />
the whole city is envisaged for 2020. With 40<br />
per cent of Saudi <strong>Arab</strong>ia’s population under the<br />
age of 15 years, the King Abdullah Economic<br />
City is expected to create up to one million jobs<br />
for the kingdom’s youthful population.<br />
The city provides six main employment<br />
components: a 63 km² industrial zone with<br />
4,400 ha dedicated to industrial and light<br />
manufacturing, estimated to create 330,000<br />
jobs; a research and development zone<br />
providing 150,000 jobs; a business and office<br />
zone creating 200,000 work places; 115,000<br />
jobs in services; 60,000 jobs in the hospitality<br />
industry and education and community<br />
services providing work to an estimates<br />
145,000 persons.<br />
The KAEC seaport is estimated to cover<br />
13.8 km2 and be the largest in the region with<br />
facilities to handle cargo and dry bulk and<br />
be capable of receiving the world’s largest<br />
vessels. The port will also have a custombuilt<br />
Hajj Terminal with a daily capacity of<br />
up to 300,000 pilgrims on their way to the<br />
holy Muslim cities. A residential area with<br />
extensive parks and green spaces will provide<br />
260,000 apartments and 56,000 villas for an<br />
estimated half a million residents. Additionally,<br />
a sea resort with 120 hotels and 25,000<br />
rooms, a yacht club, equestrian facilities and<br />
a golf course will be constructed to draw both<br />
local and international tourists.<br />
The Educational Zone of the King Abdullah<br />
Economic City is part of a plan to bring<br />
Saudi <strong>Arab</strong>ia’s capabilities and aspirations<br />
in technology to globally competitive levels.<br />
The Educational Zone will comprise an<br />
18,000-student, 7,500-faculty staff, multiuniversity<br />
campus combined with R&D parks. A<br />
central business district (CBD) will offer 3.8 km²<br />
office space, hotels and mixed-use commercial<br />
space. The Financial Island within the CBD will<br />
cover 14 ha of land and will be the largest<br />
financial centre in the region, catering for the<br />
world’s leading banks, investment houses and<br />
insurance groups. A 1,600 metre-high Kingdom<br />
Tower has been designed by Adrian Smith.<br />
Bahrain’ Science and Technology Park<br />
The Kuwait Finance House (KFH) announced<br />
the launch of a USD 1 billion Science and<br />
Technology Park plan in Bahrain, which will be<br />
the first in this part of the GCC. The proposed<br />
world-class park will host small, medium<br />
and large technology companies in niche<br />
markets and should attract global science and<br />
technology companies.<br />
This initiative will boost and encourage<br />
innovation in technology and scientific
esearch, while providing a solid infrastructure<br />
for the development of the technology sector in<br />
Bahrain. As a first step, the Bahrain Economic<br />
Development Board (EDB) acts as facilitator to<br />
ensure scientific research expertise to bring<br />
greater diversity to Bahrain’s economy.<br />
The first phase of the project will focus<br />
King Abdullah<br />
Economic City<br />
<br />
<br />
<br />
SAUDI ARABIA<br />
©2010 Emaar, The King Abdullah Economic City<br />
on infrastructure, while the second and third<br />
phases will see development of science<br />
laboratories, educational partnerships and<br />
lifestyle aspects. The Bahrain Science and<br />
Technology Park is in partnership with worldrenowned<br />
institutions and universities to<br />
build a dedicated international R&D platform,<br />
<br />
<br />
<br />
<br />
<br />
<br />
<br />
<br />
<br />
<br />
Sea Port (17,800,000 sqm)<br />
Industrial Zone (64,800,000 sqm)<br />
while an additional partnership with a leading<br />
European university is expected soon. The<br />
private sector will be called upon to take the<br />
initiative for establishing specialised science<br />
and technology clusters and reinforce Bahrainbased<br />
expertise in clean technology, renewable<br />
energy and ICT.<br />
Central Business District (13,700,000 sqm)<br />
Educational Zone (3,500,000 sqm)<br />
Resorts (16,700,000 sqm)<br />
Residential Areas (46,800,000 sqm)<br />
MRT Station<br />
Mecca-Medina Railway<br />
Football Stadium<br />
Marinas<br />
Main Roads<br />
MRT line<br />
Road System<br />
City Entrance<br />
135
136<br />
<br />
Colonnade in Muttrah, Oman. Before the discovery of oil, Muttrah was the center of commerce in Oman. It is home to Muttrah Souq, one of the oldest marketplaces in the <strong>Arab</strong> world and a<br />
popular tourist destination. ©Philip Lange/Shutterstock<br />
financial assets secured during the era of high oil revenues.<br />
Although it experienced a moderate GDP growth at 2.4 per<br />
cent in 2010, growth is expected to increase to 3.2 per cent in<br />
2011. The growth of Dubai’s economy, the hardest hit by the<br />
recession in the late 2000s, fell from 18 per cent in 2007, to<br />
3.2 per cent in 2008 and -2.4 per cent in 2009, in constant<br />
prices, but has been gradually recovering since. 32<br />
As in the UAE, Oman has been diversifying its economy<br />
as the country’s significant oil reserves are not expected to<br />
last beyond the next 20 years. While the petroleum sector<br />
currently contributes about 40 per cent of Oman’s GDP,<br />
down from 70 per cent in the 1980s, the goal is to reduce oil<br />
to 9 per cent of GDP and gas to 10 per cent by 2020. In order<br />
to do so, the government’s Vision 2020 plans to promote<br />
economic and financial stability through greater private sector<br />
participation, the diversification of the economic base and<br />
sources of national income and the development of the skills<br />
of the Omani workforce.<br />
A series of five-year plans proposed a rational exploitation<br />
of oil, gas and other mineral resources, the development of<br />
an industrial base, the promotion of ecologically-sustainable<br />
tourism, and investment in education, health and spatial<br />
development. The 7 th Five Year Plan emphasizes tourism,<br />
information communication technologies and research and<br />
development. Education, health and employment are also<br />
listed as priorities. 33<br />
To support these new activities, current policies aim to<br />
liberalize the economy and promote long-term economic<br />
growth through extensive investments in the environment,<br />
education and the tourism industries. The government has<br />
also invested heavily in infrastructures for information<br />
communication technologies and telecommunications, roads,<br />
and export-related facilities at seaports and airports.<br />
Most of Oman’s economic activities are concentrated<br />
in Muscat and Al-Batinah. Other cities which contribute<br />
include Muttrah, a historic trade centre with the country’s<br />
main commercial port, and Bawahar, where there are a<br />
number of government offices. The government is also<br />
developing other cities: Duqm is an emerging industrial<br />
settlement with an industrial park, a free trade zone and a<br />
large petrochemical complex. Medina A’Zarqa (the Blue<br />
City) is under construction on the coast outside Muscat City,<br />
with hospitals and educational facilities that will generate<br />
opportunities and investment.<br />
In Muscat, the government has developed an information,<br />
communication and technology complex – Knowledge Oasis<br />
Muscat – which is beginning to attract private investment in<br />
knowledge-based industries.<br />
In spite of efforts to reduce its dependence on oil through<br />
private and foreign investment in non-energy sectors, oil and<br />
gas still account for more than 50 per cent of Qatar’s GDP,<br />
roughly 85 per cent of export earnings and 70 per cent of
BOX 17: IMPACTS OF THE GLOBAL FINANCIAL CRISIS ON REAL ESTATE DEVELOPMENT IN THE UNITED ARAB EMIRATES<br />
<br />
On-going construction in UAE’s capital, Abu Dhabi. ©Zubair Khan/Shutterstock<br />
The construction industry has played a<br />
critical role in the UAE’s rapid economic<br />
diversification. The Global Competitive Report<br />
2010-2011 suggests that the UAE has in place<br />
the underlying fundamentals for a competitive<br />
economy with innovation-driven factors and<br />
the report’s Index ranked it 25 th in the world<br />
for competitiveness and one of the leading<br />
economies in the Middle East and North Africa<br />
region. The country’s overall competitiveness<br />
reflects recent investments in infrastructure,<br />
where it ranks an excellent third, the<br />
penetration rate of new technologies, where it<br />
ranks 14 th , and highly efficient goods markets,<br />
where it ranks sixth.<br />
The combination of Dubai becoming an<br />
international destination and the wealth<br />
emanating from the region, as crude oil<br />
revenues (constituting 37 per cent of the UAE<br />
economy in 2008) surged in recent years,<br />
has allowed it to build a strong real estate<br />
market. Dubai’s property prices have risen in<br />
the past decade for all types of real estate<br />
in a rapidly-growing market where demand<br />
has not been met by supply. As a result,<br />
large-scale investment projects by public and<br />
private real estate developers were begun to<br />
take advantage of a seemingly endless boom.<br />
However, the global economic slowdown that<br />
took hold towards the end of 2008 brought an<br />
abrupt end to the UAE’s construction boom.<br />
Since then, many building projects have been<br />
cancelled or delayed and there has been little<br />
in the way of new projects.<br />
Although the UAE is still the largest<br />
construction market in the GCC, Abu Dhabi’s<br />
developments now drive the market rather<br />
than Dubai. Abu Dhabi’s real estate market<br />
never became as flooded as others in the<br />
region and it has held up well against the global<br />
downturn. Moreover, its reputation for a more<br />
sustainable style of development has bolstered<br />
investor confidence.<br />
Following a challenging period, construction<br />
developers in the UAE are expecting a more<br />
promising 2012 and beyond. Firms are branching<br />
into new markets, switching focus from private<br />
to public sector schemes and forming new<br />
alliances in a bid to win work in an increasingly<br />
competitive environment. This trend is expected<br />
to continue in the short term with the UAE<br />
government’s drive to stimulate the economy<br />
by spending heavily on infrastructural projects,<br />
particularly in Abu Dhabi.<br />
137
138<br />
government revenues. Oil reserves of 15 billion barrels should<br />
sustain output at current levels for 37 years while reserves of<br />
natural gas in excess of 25 trillion cubic meters, about 14 per<br />
cent of the world’s total, are the third largest in the world.<br />
However, Qatar’s 2030 Vision emphasizes the need to<br />
diversify from hydrocarbons to a knowledge-based economy<br />
through diversification, financial growth and education.<br />
The Vision aims to balance modernization with tradition,<br />
control chaotic growth, protect the environment and expand<br />
economic and social development. 34 The 2010-2015 National<br />
Strategy will define the mechanisms to shift toward the<br />
knowledge economy. 35<br />
The government is supporting education, science and<br />
research as part of its policy to develop the knowledge<br />
economy. The education city is seen as a hub providing<br />
researchers with world-class facilities, well-trained graduates,<br />
opportunities for collaboration and the possibility to transfer<br />
ideas into real-world applications.<br />
Qatar also plans to make Doha, the capital city where<br />
most economic activities are concentrated, a vibrant science<br />
and technology hub that will attract and retain highlyskilled<br />
nationals at a Science and Technology Park close<br />
to the top universities in the education city. The park will<br />
incubate innovations, support scientific research and provide<br />
facilities to transform ideas into applied projects. Qatar is<br />
also developing the arts in Doha by establishing partnerships<br />
between educational institutions and its museums within an<br />
overall cultural vision of the country.<br />
Bahrain has one of the most diversified economies in the<br />
region with oil accounting for only 13 per cent of its GDP.<br />
It has undertaken a series of reforms in the past decade,<br />
including the privatisation of many government enterprises<br />
and the dismantling of barriers to foreign investment,<br />
significantly increasing the production of goods and services<br />
as well as employment opportunities. 36<br />
One of the stated aims of Bahrain’s Economic Vision 2030<br />
is to reorient the economy towards greater productivity,<br />
global competitiveness and encourage the participation of<br />
the private sector in tourism, manufacturing and business<br />
services. It also plans to raise living standards, wages and<br />
employment opportunities and provide a better quality of life<br />
to its citizens. 37<br />
Currently, most economic activities are concentrated in the<br />
capital city of Manama. In an effort to increase manufacturing<br />
activities outside the capital, Bahrain has invested in several<br />
new urban areas: the industrial area of Mina Salman, located<br />
next to the port of Bahrain; North Sitra, an area that provides<br />
all of the necessary services and amenities in close proximity to<br />
a deep marine channel and a service pier. The city is close to<br />
the Bahrain International Airport and King Fahd Causeway to<br />
Saudi <strong>Arab</strong>ia, with another causeway to Qatar also planned.<br />
As of January 2010, the city had already attracted USD 3.5<br />
billion of inward investment and is anticipated to reach USD<br />
7.6 billion once the projects are complete. 38<br />
Oil is still the main source of export revenue in Kuwait (94<br />
per cent in 2007). 39 However, plans are under way to undertake<br />
a variety of projects to diversify the economy including the<br />
Kuwait University City, a complex consisting of 16 colleges<br />
on three campuses, a hotel and a sports complex, among other<br />
facilities. The schools will accommodate an additional 40,000<br />
students. Silk City, to be located in Subiya, northern Kuwait,<br />
will include 30 smaller specialised complexes such as Finance<br />
City, Leisure City, Ecological City and Education and Culture<br />
City, providing both employment and housing. This project is<br />
expected to generate about 450,000 new jobs. The government<br />
also has plans to invest in infrastructure and services, a metro<br />
and railway system and a major container harbour.<br />
Saudi <strong>Arab</strong>ia is the world’s largest exporter of oil: it<br />
accounts for 45 per cent of GDP, 80 per cent of public revenue<br />
and 90 per cent of export earnings. 40 Saudi <strong>Arab</strong>ia is currently<br />
attempting to diversify its economy and encourage private<br />
investors to provide more employment opportunities to Saudi<br />
nationals, particularly its substantial youth population 41 .<br />
While diversification remains a challenge, Saudi <strong>Arab</strong>ia<br />
has managed to raise its non-oil sector’s share of GDP to 55<br />
per cent. 42 The 9 th Development Plan (2010-2014) has the<br />
ambitious aims to achieve a real GDP annual growth of 5.2<br />
per cent with targets of 11.8 per cent for the private sector<br />
and 10.0 per cent for non-oil exports. 43<br />
The Plan also aims to diversify the economy through<br />
“industries which utilise the national economy’s comparative<br />
advantage by transforming them into competitive advantages”<br />
with an emphasis on petrochemicals and energy-intensive<br />
industries, tourism, export-oriented manufacturing, highvalue<br />
added agriculture, 44 aluminium (12 per cent of global<br />
output), steel (6 per cent of global output), fertilizers (16 per<br />
cent of global production), 45 capital goods products such as<br />
machinery and electronics, and high-tech, capital intensive<br />
industries such as pharmaceuticals. 46 It is anticipated that<br />
construction, real estate development, public administration,<br />
defence and social security will be the most important<br />
generators of employment. 47<br />
Riyadh is the country’s financial, political and commercial<br />
centre. It has successfully created prominent financial and<br />
industrial sectors with two large industrial parks with the<br />
support of the Saudi Industrial Development Fund. 48<br />
Jeddah, the largest port and gateway to Mecca, has also<br />
developed rapidly. It is now preparing a strategic plan to<br />
guide its development through extensive infrastructure<br />
improvement, enhance its liveability, exploit its potential as a<br />
hub in the globalised market and maintain its competitiveness<br />
with other emerging ‘economic cities’ in the country. 49 Jeddah<br />
has diversified its economy to tourism, transport, logistics,<br />
education, healthcare, finance and retail and wholesale trade. 50<br />
Economic activities are also concentrated in other cities.<br />
Dammam is located close to the country’s oil fields and<br />
this has boosted its development. Mecca attracts millions<br />
of pilgrims annually, while Medina (Al Madinah) also hosts<br />
large numbers of pilgrims and is developing a ‘Knowledge<br />
Economic City’. 51<br />
In an effort to shift economic growth to the secondary cities,<br />
Saudi <strong>Arab</strong>ia is improving the infrastructure of Asir, Hail,
FIGURE 40: DEVELOPMENT OF SECONDARY CITIES IN SAUDI ARABIA<br />
TABUK ECONOMIC CITY<br />
Early Planning Stage<br />
KNOWLEDGE ECONOMIC CITY<br />
Islamic Civilization Studies Centre<br />
Complete Business Centre<br />
Residential Areas<br />
Commercial Complexes<br />
Recreational & Religious Centres<br />
Expected Completion 2016-18<br />
KING ABDULLAH<br />
ECONOMIC CITY<br />
Modern World-Class Seaport &<br />
Industrial District<br />
Financial Island<br />
Education Zone<br />
KAUST-Centre for Science &<br />
Technology<br />
Resorts and Residential Areas<br />
Expected Completion 2012<br />
Hofuf, Medina, Tabuk, and Taif. 52 It is also investing in the<br />
development of new towns. The Knowledge Economic City<br />
in Medina (completion 2016-18) will focus on developing<br />
commercial expertise, supported by a range of commercial and<br />
cultural complexes. In 2012, a renewable energy city in Riyadh,<br />
will be completed. The King Abdullah Economic City, north<br />
of Jeddah, will be a modern world-class seaport and industrial<br />
district, with an educational zone, resorts and residential areas<br />
as well as the KAUST-centre for Science and Technology. Jizan<br />
Economic City will focus on heavy industries, biotech and<br />
pharmaceuticals. In Ha’il, the Prince Abdul Aziz Bin Mousaed<br />
Economic City will become a transport and logistics hub.<br />
Both are scheduled to be completed in 2016. Plans for two<br />
other Economic <strong>Cities</strong>, in Tabuk and in the Eastern Provinces,<br />
are currently under development. 53<br />
Marketing<br />
WEST BANK<br />
EGYPT<br />
JORDAN<br />
Tabuk<br />
SUDAN<br />
Jeddah<br />
ERITREA<br />
Medina<br />
Mecca<br />
To attract more investment, some countries have opened<br />
their economies and provided support for potential<br />
investments. The UAE has opened its borders and created<br />
a stable environment for investment opportunities. In the<br />
most recent Global Enabling Trade report, it ranked among<br />
the top 15 countries in the world for domestic and foreign<br />
market access, efficiency of import/export procedures,<br />
efficiency of customs administrators, availability and quality<br />
of transport infrastructure, availability and use of technology<br />
Ha’il<br />
IRAQ<br />
Buraydah<br />
Khamis Mushayt<br />
Jizan<br />
Nejran<br />
Riyadh<br />
KUWAIT<br />
Dammam<br />
Hofuf<br />
SAUDI ARABIA<br />
YEMEN<br />
QATAR<br />
and telecommunications, regulatory environment and<br />
physical security. Furthermore, the UAE leads e-commerce<br />
penetration among the <strong>Arab</strong> states, an achievement that has<br />
been driven by the openness of its foreign trade policy.<br />
Bahrain does not tax private companies and levies little<br />
indirect taxes on enterprises and individuals. It allows<br />
foreigners to fully own businesses and real estate in most<br />
sectors and plans to open up its market even more fully to<br />
promote greater private sector activity. 54<br />
In an effort to increase investments, Qatar has earmarked a<br />
significant part of its budget for infrastructure development<br />
including a new port in Doha, the new Doha International<br />
Airport and the upgrades and expansion of rail linkages,<br />
including the Doha Metro, and railways to Bahrain and<br />
Saudi <strong>Arab</strong>ia. 55<br />
Poverty and Inequality<br />
PRINCE ABDUL AZIZ BIN<br />
MOUSAED ECONOMIC CITY<br />
Logistics and Transport Hub<br />
Expected Completion 2016<br />
EASTERN PROVINCE ECONOMIC CITY<br />
Early Planning Stage<br />
JIZAN ECONOMIC CITY<br />
Heavy Industries: Power, Steel<br />
Port Development<br />
Secondary Industries: Textiles,<br />
Pharmaceuticals, Biotech<br />
Residential & Commercial Development<br />
Expected Completion 2016<br />
The distribution of wealth is unequal in the GCC countries,<br />
in spite of their high GDP per capita, with concentrations of<br />
poverty among expatriate migrants. In Kuwait, the residents<br />
of such slum areas as Jebel Al-Shuyoukh, mainly migrant<br />
workers, face overcrowding, poor housing and crime. 56 In<br />
Qatar, housing assistance, health care and other services<br />
from the government are limited to Qataris. 57 Of the 1,056<br />
non-Bahraini households surveyed in 2005-2006, two-thirds<br />
earned less than BHD 9,600 (USD 25,500) annually while<br />
139
140<br />
<br />
Doha, Qatar. Asian labourers at work on the drainage system in front of Qatar’s national<br />
“Orry the Oryx” mascot, originally created for the 2006 Asian Games. Qatar’s impressive<br />
infrastructure is being created by a vast army of cheap labourers drawn from across Asia.<br />
©Paul Cowan/iStockphoto<br />
only 42 per cent of the 2,192 Bahraini households surveyed<br />
earned below this income level. 58<br />
In Saudi <strong>Arab</strong>ia, according to one estimate, 1.6 per cent<br />
of Saudi families live in extreme poverty (
immigrant labourers, the Saudi participation rate in the labour<br />
force has been growing: it rose from 32.6 per cent in 1997 to<br />
44.2 per cent in 2000, an increase partly attributable to the<br />
greater engagement of women in the labour force. 71<br />
In the UAE, the urban employment rate was 76 per cent for<br />
non-nationals and 41 per cent for nationals in 2009. 72<br />
In Qatar, 94.4 per cent of those employed were non-Qataris<br />
in 2010 and 49.3 per cent of Qataris were inactive compared<br />
to 9 per cent of non-Qataris. 73 Most Qataris are employed in<br />
government and mining followed by professional and clerical<br />
occupations whereas non-Qataris primarily work in crafts or<br />
as elementary and machine operators. 74 As in other countries,<br />
the percentage of Qataris in the private sector is very small<br />
(0.6 per cent). 75<br />
Many of the GCC countries are working to increase the<br />
national share of the labour force. In the UAE, a country<br />
with diverse demographic challenges, ‘Emiratization’ is a<br />
crucial item on the government agenda. The federal and local<br />
authorities are continuously generating and implementing<br />
initiatives to support the policy of expanding participation<br />
of the country’s citizens in the workforce. Among these<br />
are the establishment of the National Human Resource<br />
Development and Employment Authority, the Abu Dhabi<br />
Emiratization Council, the Dubai-based Emirates National<br />
Development Programme and the Department for Human<br />
Resources Development in Sharjah. These organisations help<br />
develop the capabilities and skills of nationals in order to<br />
create a better balance in the labour market.<br />
As a result of market conditions, as well as the availability<br />
of expatriate labour, many UAE citizens have been unable to<br />
find suitable work. Over 89,000 UAE citizens registered for<br />
prospective jobs with the above mentioned organizations in<br />
June 2009.<br />
In Saudi <strong>Arab</strong>ia, the 2005 Labour Law requires that at<br />
least 75 per cent of the staff of private companies are Saudis. 76<br />
The government has also limited foreign labour with more<br />
stringent visa and temporary working license requirements. 77<br />
The 9 th Development Plan also aims to increase the national<br />
share of the labour force. 78<br />
Although Oman’s expatriate population continues to grow,<br />
particularly in the private sector, the government is trying to<br />
increase participation in the labour force for its citizens by<br />
improving their training.<br />
Health<br />
Basic health indicators – life expectancy and infant<br />
and child mortality rates – have improved significantly in<br />
TABLE 57: PERCENTAGE ADULT LITERACY RATES 15+<br />
Country<br />
UAE<br />
2005<br />
Bahrain<br />
2008<br />
the GCC region. However, as is the case in the advanced<br />
economies, there has been an increase in diabetes and<br />
cardiovascular disease.<br />
Health care is universal in the UAE and life expectancy is on<br />
par with that of most advanced economies. However, diabetes<br />
affects 20 per cent of the population (the second highest rate<br />
in the world) 79 and cardiovascular disease accounts for 28 per<br />
cent of all deaths.<br />
Oman has undertaken major healthcare reforms to reduce<br />
mortality, increase access to health services and eradicate<br />
infectious diseases. There has been a reduction in infant and<br />
child mortality rates in Muscat and other cities. Nevertheless,<br />
cardiovascular diseases, obesity and diabetes still remain major<br />
concerns, particularly in urban areas where 21.2 per cent of<br />
the population was obese in 2004 as opposed to 13.1 per cent<br />
in rural areas. 80 (See Box 18.)<br />
In Qatar, WHO indicated that 59.5 per cent of males<br />
15 years and older are ‘overweight’ and 18.7 per cent are<br />
‘obese’, while 65.9 per cent of females are ‘overweight’ and<br />
31.6 per cent are obese. 81 In Bahrain, the city of Manama<br />
was recognized as part of the World Health Organization’s<br />
1000 <strong>Cities</strong>-1000 Lives programme for its effort to promote<br />
healthy behaviours among its residents. 82<br />
Education<br />
With the oil wealth, many countries have invested heavily<br />
in education and all of the region’s countries have high<br />
literacy rates and relatively high enrolment rates for primary<br />
and secondary school. For instance, in Doha, the literacy rate<br />
is 96.3 per cent. 83 In Riyadh and Jeddah, the literacy rates<br />
were 92 84 and 90 per cent 85 respectively.<br />
The UAE has put emphasis on higher education including<br />
training in engineering and information technology. Primary,<br />
secondary and tertiary education is offered to all citizens.<br />
Literacy rates have increased to approximately 87 per cent.<br />
In Oman, human resources development is a major<br />
component of the Vision 2020 as well as the Fifth Five-<br />
Year Plan. The reform of the educational system includes<br />
modernizing basic education and emphasizing technical and<br />
vocational training.<br />
Tourism<br />
Many of the countries in the region have attempted to<br />
increase tourism’s contribution to GDP, placing an emphasis<br />
on the preservation of existing historical sites and the creation<br />
of new tourist resorts.<br />
Saudi <strong>Arab</strong>ia<br />
2009<br />
Adult Literacy Rates 15+ 90.0 90.8 85.5 86.7 93.1 94.5<br />
Source: UNESCO Institute for Statistics.<br />
Oman<br />
2008<br />
Qatar<br />
2007<br />
Kuwait<br />
2007<br />
141
142<br />
BOX 18: YOUTH, WEALTH AND HEALTH IN THE GCC: A LIGHT REVIEW OF A HEAVY PROBLEM<br />
<br />
©Andrei Zarubaika/Shutterstock<br />
Since the discovery of oil in the <strong>Arab</strong>ian Gulf<br />
region, the GCC countries have experienced<br />
sustained growth in per capita income and<br />
wealth that has contributed to rapid urbanization<br />
and the associated urban life styles. The<br />
horizontal urban sprawl created car-dependent<br />
and pedestrian-unfriendly cities where almost<br />
all mobility is motorized. With a relative lack of<br />
open spaces and outdoor recreational facilities,<br />
many children in the GCC region have sedentary<br />
lifestyles and socialize in air-conditioned<br />
shopping malls with their easy access to fast<br />
food. Moreover, traditional food in the Gulf<br />
countries relies on rice and red meats with little<br />
vegetables or fruits.<br />
This has contributed to nutritional health<br />
problems and related diseases often referred<br />
to as the ‘nutrition transition’. A phenomenon<br />
first noted in developed countries but which<br />
quickly spread to emerging economies<br />
and developing nations. While these are<br />
recognized problems in the Gulf region, there<br />
is need to better understand the trends and<br />
who might be particularly vulnerable so<br />
that appropriate preventative measures and<br />
treatment can be targeted.<br />
Nationally representative overweight<br />
and obesity prevalence estimates among<br />
adolescents show that Saudi <strong>Arab</strong>ian, Bahraini<br />
and Kuwaiti adolescent girls have higher<br />
combined overweight and obesity rates<br />
compared with adolescent boys but slightly<br />
lower rates in Qatar and UAE. Rates are<br />
persistently high among both sexes in Kuwait.<br />
Worldwide, one in ten schoolgoing children<br />
is obese. Although Qatar and Saudi <strong>Arab</strong>ia<br />
compare reasonably well with this high global<br />
average, adolescent obesity is far too common<br />
in the Gulf region - particularly among preschoolers<br />
and adolescent girls in Kuwait, Qatar<br />
and UAE.<br />
Rates are now also rising among Bahraini<br />
boys. Gender differences in these prevalence<br />
rates suggest that there might be biological<br />
and socio-cultural factors that need to be<br />
better understood.<br />
There is a need to track children’s growth<br />
and the incidence of overweight and obesity<br />
over time, because overweight and obese<br />
adolescents are significantly more likely to<br />
become obese adults and develop health<br />
problems. With those below 20 years<br />
representing more than 50 per cent of the Gulf<br />
population, the estimates below do not bode<br />
well for the future health and well-being of this<br />
population section.<br />
It is accepted that cardiovascular diseases<br />
(CVD), coronary heart disease, diabetes<br />
mellitus, hypertension, metabolic syndrome,<br />
steato-hepatitis and certain cancers have<br />
become problems in the Gulf region. These<br />
diseases, which have been highly associated<br />
with overweight and obesity, can develop<br />
even at young ages because childhood and<br />
adolescent obesity elevate CVD risks and allcause<br />
mortality.<br />
Studies have found associations with<br />
frequent snacking, fast-food and soft-drink<br />
consumption, low fruit and vegetable intake<br />
and a rise in available calories, particularly from<br />
fat. The food environment for the schoolgoing<br />
population and the growth of fast food<br />
restaurants, supermarkets and hypermarkets<br />
are also possible reasons for this trend.<br />
Due to increasingly urbanized life styles,<br />
too many children in the Gulf are physically<br />
inactive, rarely participate in sports and spend<br />
their leisure time in sedentary activities. The hot<br />
climate and lack of awareness about sports and<br />
active outdoor life reduce children’s exposure<br />
to healthy life styles. Females have especially<br />
low physical activity levels, partly due to<br />
conservative socio-cultural norms that create<br />
obstacles for sport involvement in sports attire<br />
and lack of role models.<br />
Schools are the most effective place to<br />
reach young people and encourage more<br />
healthy lifestyles. GCC education and health<br />
ministers should allocate more resources<br />
for coordinated school programs to address<br />
the unhealthy aspects of urban life styles by<br />
promoting: physical fitness through rhythm and<br />
dance and individual and team sports; access<br />
to appealing and nutritious meals; education<br />
on the risks of unhealthy habits and behaviour;<br />
school environments free from heat, excessive<br />
noise or poor lighting; health screening of<br />
students and management of chronic disease<br />
and counseling and psychological services.<br />
Country and Study Year Age<br />
Overweight only (%)<br />
<br />
Obese (%)<br />
<br />
Overweight & Obese (%)<br />
<br />
Saudi <strong>Arab</strong>ia 1998 12-18 14.5 15.6 5.8 6.9 20.3 22.5<br />
Bahrain 2008 15-18 15.8 17.4 13.7 19.4 29.5 36.8<br />
UAE 2005 10-19 21.2 21.7 13.2 11.0 34.4 32.7<br />
Qatar 2004 10-18 27.5 20.0 7.1 3.9 34.6 23.9<br />
Kuwait 2006 10-14 29.3 32.1 14.9 14.2 44.2 46.3<br />
Sources: Ng, S. et al, The prevalence and trends of overweight, obesity and nutrition-related non-communicable diseases in the <strong>Arab</strong>ian Gulf States, in Obesity Reviews, 12:1-13;<br />
Buente, M. et al, GCC School Health Programs: Health and Wellness Through Early Intervention.
The wind tower of Sheikh Isa bin Ali house, located in Muharraq, the old capital of Bahrain. Muharraq hopes to promote its rich pearling legacy as a UNESCO World Heritage Site.<br />
©Dr Ajay Kumar Singh/Shutterstock<br />
Cultural tourism in UAE has become an integral part of<br />
both the domestic hospitality service sector and the economy<br />
as a whole. In 2007 tourism contributed 18 per cent of<br />
Dubai’s direct GDP and 29 per cent of its indirect GDP. 86 In<br />
Abu Dhabi, the Vision 2030 plan aims to invest in tourism<br />
related hotels, resorts and business and leisure activities.<br />
The Abu Dhabi Tourism Authority is also overseeing the<br />
development of Saadiyat Island as a cultural and leisure<br />
district. 87<br />
In Qatar, the government is investing USD 17 billion over<br />
the next five years in the construction of luxury hotels resorts<br />
and leisure facilities. The government will also invest in<br />
tourism sites, particularly the Museum of Islamic Art, the Suq<br />
Waqif area, the Doha National Museum, the <strong>Arab</strong> Modern<br />
Art Museum and the National Library. 88<br />
The natural and cultural assets of Oman are great<br />
opportunities for tourism development. Recently, the<br />
sultanate has emphasized tourism, particularly cultural<br />
tourism, with the goal of significantly increasing its<br />
contribution to GDP over the next ten years. Twelve fivestar<br />
hotels will be constructed over the next four years. In<br />
Bahrain, tourism contributes 10 per cent to GDP 89 and<br />
the government is investing in hotels and tourist facilities in<br />
Durrat Al Bahrain and Al Areen. 90 It has proposed Muharraq<br />
for UNESCO’s world heritage list. 91<br />
In Saudi <strong>Arab</strong>ia, religious pilgrimages are a major source of<br />
tourism. The number of pilgrims attending the Hajj has grown<br />
steadily from 1.86 million in 1995 to 2.79 million in 2010. 92<br />
In 2006, 11 million foreign visitors came to Saudi <strong>Arab</strong>ia for<br />
religious reasons. 93 In September 2010, the Ministry of Hajj<br />
announced that more than 3.8 million pilgrims had arrived<br />
in Saudi <strong>Arab</strong>ia for umrah in the past six months. 94 Although<br />
most tourists fly into Jeddah, others travel directly to Mecca<br />
or Medina.<br />
The Saudi government has recently invested a significant<br />
amount of money to restore and preserve the historic<br />
buildings and sections of Jeddah, create a historic department<br />
in the city, develop a tourism corridor linking to Al Balad<br />
and obtain world heritage status for Al Balad, among other<br />
initiatives. The government is also investing in initiatives to<br />
train local workers in the tourism sector and collaborating<br />
with educational institutions to offer vocational training. 95<br />
143
144 4.3 Urban Development and Housing Conditions<br />
<br />
The Jumeriah Palm development. Dubai, UAE - the ultimate gated community. ©Haider/Shutterstock<br />
The Growth Patterns of GCC <strong>Cities</strong><br />
Historically, life in the <strong>Arab</strong>ian Peninsula was<br />
nomadic, with pearling and fishing on the coasts,<br />
where most of the oldest towns first developed. To<br />
the east, the medinas of Doha and Sharjah developed around<br />
fishing ports and the pearl trade with India. To the west, in the<br />
Hejaz, Mecca and Medina were the oldest and largest cities.<br />
In the interior, the Riyadh oasis supported a relatively large<br />
population by the early 1900s due to abundant groundwater<br />
and fertile soils.<br />
The discovery of oil in the 1960s caused a population boom<br />
and exponential economic development that transformed<br />
the mud-walled towns into commercial capitals integrated<br />
into the global economy. The immediate impact on urban<br />
settlement was the application of Western modernist planning<br />
theories popular at that time, leading to the abandonment of<br />
the traditional medina in favour of the urban grid, functional<br />
spacial segregation, private vehicle reliance and extensive<br />
highway networks. Modern villas and developments on the<br />
outskirts replaced traditional courtyard-based housing as the<br />
preferred lifestyle. In Manama and Muharraq, for instance,<br />
80 per cent of the original population in the old city left for<br />
suburban areas, leaving behind a deteriorating housing stock. 96<br />
Today, cities in the GCC aim to embody the image of<br />
the global city, with skyscrapers in central business districts,
multi-story residential buildings, large shopping malls and<br />
wide urban boulevards. Due to the harsh desert interior,<br />
80 per cent of the population lives in coastal cities, with all<br />
GCC countries except for Saudi <strong>Arab</strong>ia functioning as citystates.<br />
Wealthy nationals and expatriates live in the cosmopolitan<br />
city centres and suburban compounds. Across the region,<br />
highly paid expatriates live in gated communities that<br />
include villas, recreational services, high walls, and 24hour<br />
surveillance that convey exclusivity and security. But,<br />
parallel realities exist in these cities, with housing according<br />
to class, social power, ethnicity and nationality. Low-paid<br />
expatriate workers, rural migrants and refugees from the<br />
Horn of Africa reside in the older parts of the city, in<br />
temporary housing on construction sites and in informal<br />
or slum settlements on the urban periphery.<br />
Among the challenges posed by a wholesale adoption of<br />
Western planning and architecture has been the loss of local<br />
architectural tradition. A survey of architects in Kuwait found<br />
that 88 per cent believed there was no Kuwaiti architectural<br />
identity and 94 per cent believed there was a need to create<br />
such an identity. 97<br />
FIGURE 41: POPULATION AGE STRUCTURE OF KUWAITIS VS. NON-KUWAITIS IN THE COUNTRY (2005) 104<br />
65+<br />
60-64<br />
55-59<br />
50-54<br />
45-49<br />
40-44<br />
35-39<br />
30-34<br />
25-29<br />
20-24<br />
15-19<br />
10-14<br />
5-9<br />
0-4<br />
100,000<br />
80,000<br />
60,000<br />
40,000<br />
20,000<br />
Non-Kuwaiti<br />
0<br />
Female<br />
20,000<br />
40,000<br />
60,000<br />
80,000<br />
100,000<br />
120,000<br />
140,000<br />
160,000<br />
65+<br />
60-64<br />
55-59<br />
50-54<br />
45-49<br />
40-44<br />
35-39<br />
30-34<br />
25-29<br />
20-24<br />
15-19<br />
10-14<br />
5-9<br />
0-4<br />
Male Female Male<br />
FIGURE 42: POPULATION AGE STRUCTURE OF OMANIS VS. TOTAL POPULATION IN OMAN (2009) 105<br />
80+<br />
75-79<br />
70-74<br />
65-69<br />
60-64<br />
55-59<br />
50-54<br />
45-49<br />
40-44<br />
35-39<br />
30-34<br />
25-29<br />
20-24<br />
15-19<br />
10-14<br />
5-9<br />
0-4<br />
80+<br />
75-79<br />
70-74<br />
65-69<br />
60-64<br />
55-59<br />
50-54<br />
45-49<br />
40-44<br />
35-39<br />
30-34<br />
25-29<br />
20-24<br />
15-19<br />
10-14<br />
5-9<br />
0-4<br />
Kuwaiti<br />
Omani Total Population<br />
60,000<br />
50,000<br />
40,000<br />
30,000<br />
20,000<br />
10,000<br />
0<br />
10,000<br />
20,000<br />
30,000<br />
40,000<br />
50,000<br />
60,000<br />
150,000 100,000 50,000 0 50,000 100,000 150,000<br />
200,000 100,000 0 100,000 200,000 300,000 400,000<br />
Female<br />
Male Female Male<br />
To develop a balance between the global and local aspects,<br />
municipalities in the UAE have adopted policies to convey<br />
a tradition of <strong>Arab</strong>-Islamic architectural design, particularly<br />
arched windows, gates and decorative stucco. <strong>Cities</strong> are also<br />
taking efforts to preserve their urban heritage through the<br />
renovation of old forts, palaces, suqs and mosques.<br />
The Challenge of Affordable Housing<br />
Housing affordability and availability varies across the Gulf<br />
and has been driven by high rates of population growth in<br />
the 1980s and 1990s. With the exception of Qatar, whose<br />
population grew by 7 to 11 per cent annually in the 2000s,<br />
population growth has stabilized and is expected to increase<br />
by only 1 to 2 per cent annually for the next two decades,<br />
with Qatar expected to reach this rate by 2030.<br />
Nevertheless, the acute specific age structure of the<br />
population is expected to continue to drive the demand for<br />
housing. In GCC countries, 52 to 64 per cent of the national<br />
population is under 25 years of age. 98 In Riyadh, 34 per cent<br />
of citizens are under 15 and 50 per cent are under age 20.<br />
The annual rate of household formation was 3,000 a year in<br />
145
146<br />
Bahrain and 14,700 in Kuwait in 2008; 99 25,600 in Oman in<br />
2009; 100 2,900 in Qatar 101 and 4,400 in Dubai in 2010 102 and<br />
130,500 in Saudi <strong>Arab</strong>ia in 2007. 103<br />
The constitutions of GCC countries require the<br />
governments to provide their citizens with homes, land or<br />
interest-free home construction loans, a benefit limited in<br />
some countries to adult males or citizens earning below set<br />
income levels.<br />
Saudi municipalities are required to provide 625m 2 of land<br />
– and as much as 900m 2 for royal grants – free of charge to<br />
any adult male Saudi that requests it.<br />
In theory, the unlimited supply of housing would<br />
allow adequate housing for all nationals. However, rising<br />
populations, escalating land speculation, and changing<br />
housing preferences are making it harder for the government<br />
to provide loans to meet housing demand among low and<br />
middle-income households. With the high reliance on oil<br />
revenues for government budgets, fluctuations in oil prices<br />
can dramatically affect the ability of government to provide<br />
affordable housing.<br />
In Kuwait, the waiting list for a government housing grant<br />
can be up to 15 years. 106 In Qatar, population growth in Doha<br />
– as much as 40 per cent in 2008 – has placed significant<br />
pressure on the residential property market. By 2012, Abu<br />
Dhabi will require an additional 120,000 units to fill unmet<br />
demand. Due to the real estate crash in 2008, developers have<br />
placed a number of projects on hold that may prolong the<br />
housing shortage. The emirate’s Urban Planning Council has<br />
repeated its call for more affordable housing, which may now<br />
be of greater interest to developers given the softening of the<br />
market for luxury housing. 107<br />
Bahrain is experiencing a particularly acute housing<br />
shortage due to rapid population growth and a mismatch<br />
between housing demand and supply. Out of 138,000<br />
employed Bahrainis, 60,000 earn less than BHD 399 (USD<br />
1,060) per month; 60,000 earn BHD 399 to 1,199 (USD<br />
3,200) and 16,000 earn more than BHD 1,200 (USD 3,200).<br />
The government provides social housing for those in<br />
the first category, but the present waiting list is 53,000<br />
households to which another 3,000 to 4,000 households are<br />
added each year. Those in the second income tier are eligible<br />
for government subsidized mortgages of BHD 40,000<br />
(USD 106,000).<br />
Culturally, Bahrainis prefer to live in villas or townhouses<br />
that can accommodate an extended family. However, the cost of<br />
TABLE 58: FORMAL HOUSING MARKET PERFORMANCE INDICATORS<br />
serviced land zoned as low-density residential has risen rapidly<br />
and a 225m 2 plot costs BHD 50,000 (USD 133,000). Given<br />
these prices, the government’s subsidized mortgages do not<br />
cover even the cost of land, much less construction, which relies<br />
entirely on expensive imported materials.<br />
Given the affordability gap, developers do not produce<br />
units for this middle-income group, and around two-thirds<br />
of Bahraini nationals cannot afford the typical two-bedroom<br />
house even though three-fifths have received government<br />
housing support. 110 Affordable housing shortages continue<br />
to dominate the Bahraini press and grievances over lack of<br />
access to affordable and adequate housing was a key issue in<br />
the country’s 2011 protests.<br />
In 2011-2012, the government anticipates spending an<br />
estimated BHD 240 million (USD 640 million) on housing<br />
projects and BHD 116 million (USD 308 million) on<br />
housing services, 111 with the aim of reducing the average wait<br />
for a loan to three years by 2012, down from five to 15 years<br />
in the past. 112<br />
Saudi <strong>Arab</strong>ia also has serious housing shortages. With an<br />
existing stock of 4.2 million units in 2007, estimates project<br />
that 1.5 million housing units will be needed by 2015, and<br />
5 million by 2020, requiring an investment of USD 640<br />
billion. 113,114 Twenty-five per cent of the existing units have<br />
been financed by loans from the government’s Real Estate<br />
Development Fund. 115<br />
The 9 th Development Plan (2010-14) allocates SAR100<br />
billion (USD 27 billion) for municipal and housing services,<br />
around 7 per cent of the five-year budget. These allocations aim<br />
to establish 60 new municipalities and 40 new urban centres,<br />
one million housing units (roughly 80 per cent of anticipated<br />
demand during the period), and 266 million square meters of<br />
land for private and public housing projects. 116 In addition,<br />
legislative reforms including the mortgage law, housing<br />
finance terms and rent-to-lease laws are needed to resolve<br />
fundamental barriers to market equilibrium. 117<br />
About one-fifth of Saudi <strong>Arab</strong>ia’s growth will take place in<br />
Jeddah, which has an oversupply of high-end retail space and<br />
luxury housing 118 but a shortage of 200,000 middle-income<br />
units and 80,000 low-income units. 119 Overall, 52 per cent<br />
of households rent their home, 41 per cent own, 6 per cent<br />
receive housing from their employer, and 1 per cent cited<br />
other arrangements. Sixty per cent live in apartments, 24 per<br />
cent in traditional housing, 9 per cent in villas and 4 per cent<br />
occupy one floor of a house. 120<br />
Mecca Medina Jeddah Riyadh Doha Dubai Abu Dhabi<br />
Average Rent (USD /m2 /month) USD 48 USD 38 USD 81 USD 66 USD 255 USD 310 USD 520<br />
Average Sales Price (USD /m2 ) USD 643 USD 670 USD 850 USD 730 USD 4,520 USD 3,480 USD 5,277<br />
Vacancy Rate .. .. .. 6% 3% 7% 3%<br />
Source: Jeddah 108 , Riyadh 109 , Abu Dhabi/Dubai: Colliers International 2009.
Low cost migrant housing in Deirah, Dubai, UAE. ©Tanuki Photography/iStockphoto<br />
One in eight units is vacant, although an estimated 250,000<br />
people are living in overcrowded units and are in need of<br />
better housing. 121 To anticipate the 2029 population of 5.7<br />
million, Jeddah’s Strategic Plan calls for the construction of<br />
950,500 housing units, with 685,000 units affordable to<br />
lower- and middle-income groups. 122<br />
Riyadh has also experienced a construction boom with<br />
28 per cent of all building permits issued countrywide in<br />
2005. 123 Much of the construction has been speculative,<br />
with inadequate provision for middle-income housing. An<br />
estimated 495,000 units will be needed by 2024. Given<br />
average rents at USD 66 per square metre, providing<br />
affordable housing is a challenge with a median family<br />
income of USD 1,600 per month.<br />
In Oman, a growing population with a high purchasing power<br />
and a large expatriate population have caused a rise in property<br />
prices. After the 2008 financial crisis, Muscat rental rates have<br />
returned to 2007 levels, except for luxury villas which remain<br />
down by as much as 40 per cent from peak levels.<br />
In contrast, the one- to three-bedroom apartment market<br />
has seen minimal change, reflecting an acute supply shortage<br />
and burgeoning demand for smaller accommodation. The<br />
government has recently designated areas of Muscat where<br />
developers may build complexes of up to 12 stories as a way<br />
to increase the supply of affordable housing.<br />
Housing for Migrant Workers<br />
With migrant labourers comprising 88, 70 and 69 per cent<br />
of the total population in Qatar, the UAE and Kuwait, their<br />
housing conditions and rights require special attention. 124<br />
Although their housing conditions are poor in comparison<br />
to the standard of living in the GCC, they are not unlike<br />
those of migrants worldwide who try to maximize their<br />
remittances.<br />
Governments have been reluctant to assume responsibility<br />
for privately-sponsored workers but, under pressure, have<br />
begun to consider regulatory reform that would increase<br />
oversight of labour importation and a commitment to<br />
international labour standards. These reforms are a positive<br />
first step to addressing a complex issue.<br />
While little information is available on specific migrant<br />
labour living conditions, they tend to live in housing built<br />
by their employers, low-cost units in the old city or on the<br />
premises where they are employed.<br />
Kuwait provides a clear example of the situation across<br />
the GCC. Expatriates cannot own property and, in many<br />
cases, the wages of sponsored workers are such that they<br />
cannot afford market rate rental housing. In 2009, following<br />
repeated strikes and protests, the government established<br />
KWD 40 (USD 144) per month as the minimum wage<br />
147
148<br />
BOX 19: KUWAIT EXPATRIATE HOUSING<br />
Expatriates represent more than 50 per cent<br />
of the total population of 3.2 million, according<br />
to 2011 statistics. In 2010, out of more than<br />
1.2 million expatriates living in Kuwait, more<br />
than 60 per cent are categorized as lowincome<br />
foreign single workers in marginal and<br />
service activities, according to a Kuwait civil<br />
information organization.<br />
Expatriates are not allowed to own houses<br />
in Kuwait as only citizens of Gulf cooperation<br />
council countries enjoy such privilege.<br />
Expatriates can access housing through the<br />
rental market but this can only be provided<br />
by their employer or paid for by the worker<br />
himself depending on the terms of employment<br />
contract.<br />
Kuwait’s rental housing market has diversified<br />
and provides a variety of housing categories for<br />
expatriate workers that suit income, living style<br />
and family circumstances. The variety ranges<br />
from high-end villas and luxurious multi-storey<br />
apartment units in prime locations suitable for<br />
white collar executives, to single-room apartment<br />
buildings and dormitories for low-skilled labour<br />
and marginal single workers. Kuwaiti families<br />
often have single rooms attached to their houses<br />
to accommodate their domestic workers (maids,<br />
drivers, gardeners or cooks).<br />
The new Kuwaiti Labour law no. 6 of 2010<br />
has designated an article which ensures<br />
the right to adequate housing (article 34):<br />
“employers handling government projects and<br />
those whose employees stay in the outskirts to<br />
provide suitable accommodation and transport<br />
without any deduction form the employees’<br />
entitlements. The employer should also pay<br />
housing allowance in case he does not provide<br />
INCOME AND RENT FOR LOW-INCOME<br />
SINGLE EXPATRIATE WORKERS LIVING IN<br />
SIX SURVEYED AREAS, 2010.<br />
Kuwaiti Dinars<br />
250<br />
200<br />
150<br />
100<br />
50<br />
0<br />
Bneid<br />
Al-Qar<br />
Khaytan Salmiya<br />
Jleeb<br />
Average rent Average worker income<br />
Hawalli Al-<br />
Farawaniyah<br />
suitable accommodation for the employees.<br />
The ministerial decision shall specify Outskirts,<br />
conditions governing suitable accommodation,<br />
activities and criteria the employers should<br />
observe in providing the accommodation.”<br />
The Kuwait master plan designates areas<br />
within Kuwaiti cities and new urban extensions<br />
for private investment housing (areas for housing<br />
development by private sector for rental to both<br />
Kuwaitis and non-Kuwaitis). It also identifies<br />
areas for private housing (mostly designations<br />
for Kuwaiti families and diplomatic missions).<br />
The purpose of such dedication is to allow for<br />
equal access to housing for both expatriates and<br />
nationals and ensure that market forces do not<br />
lead to increase in housing supply for expatriates<br />
and gradual conversion of areas designated for<br />
housing of Kuwaitis to investment housing.<br />
Despite the regulations and master plan<br />
guidelines, many areas within Kuwaiti cities<br />
designated for private Kuwaiti housing have<br />
been converted either formally or informally to<br />
workers housing. In most cases those concern<br />
dilapidated housing in areas awaiting planning<br />
for redevelopment and owners cannot develop<br />
until then. Hence they rent it to brokers who<br />
maximize their gains by sub-letting to large<br />
numbers of single expatriate low-income<br />
workers. According to a recent Kuwait<br />
Municipality and UN-Habitat survey in six areas<br />
of Kuwaiti cities (Khitan, Bnied Al-Qar, Glieb<br />
El-Shieoukh, Farawania, Salmiya and Hawalli)<br />
which focused on the housing conditions of<br />
lower-income single workers, most of those<br />
workers, of both Asian and <strong>Arab</strong>ian origin, live in<br />
group housing in overcrowded situations with an<br />
average of five to 14 people per room, sharing<br />
Amghara 2<br />
Algahra<br />
Amghara 1<br />
NEW WORKERS COMMUNITIES<br />
PROJECTS - KUWAIT<br />
rooms in an apartment unit and most of them<br />
as secondary tenants with no security of tenure.<br />
Each worker pays an average of KWD 10-15 per<br />
month as rent out of an average monthly salary<br />
of KWD 65 Kuwaiti dinar. It is important to note<br />
that despite the bad condition of the units, lack<br />
of security of tenure, overcrowding and lack of<br />
basic amenities, safety and services the survey<br />
has shown that most of those living in such units<br />
and in these areas do not consider their housing<br />
as problematic.<br />
They stated that it is still better than their<br />
housing situation back in their native countries,<br />
with good proximity for work and services. They<br />
came to save money and send remittances back<br />
home and cheap housing option maximizes<br />
their savings and provide them with a social<br />
environment that compensate for being away<br />
from their families by sharing their living space<br />
with fellow expatriates with similar origins.<br />
The Kuwait government addressed group<br />
housing needs in the Kuwait Master Plan with<br />
the dual objective of ensuring adequate housing<br />
for all and regenerating dilapidated areas in the<br />
country’s cities. It developed a programme for<br />
workers housing by which it constructs new<br />
workers neighborhoods in several locations<br />
and makes plans for dilapidated areas while<br />
designating certain locations in these areas<br />
for workers housing. The programme design<br />
was based on providing group housing for<br />
single expatriate workers and gradually reduce<br />
densities from 14 to 8 persons/unit by 2030<br />
while producing 55,000 units every ten years to<br />
accommodate gradual increases in labour from<br />
2010 till 2030.<br />
Alragie<br />
Capital<br />
South Rabia<br />
Kuwait City<br />
Sabhan<br />
Abdullah Port<br />
<strong>Arab</strong>ian Gulf<br />
Elmahboula<br />
Abo Halifa<br />
South Sabahia
TABLE 59: PERCENTAGE OF URBAN POPULATIONS LIVING IN SUBSTANDARD HOUSING<br />
Bahrain (2001) Saudi <strong>Arab</strong>ia (2005) Jeddah (2009)<br />
Informal Settlements Population .. 3,441,626 1,200,000<br />
% of Urban Residents Living in Informal Settlements 2 (2001) 18 (2005) 35<br />
Sources: Bahrain 126 , Saudi <strong>Arab</strong>ia 127 , Jeddah. 128<br />
for migrant workers – an improvement, given past levels of<br />
KWD 8 (USD 29) to KWD 20 (USD 72) per month.<br />
Worker housing suffers frequent water shortages, loss of<br />
electricity, faulty wiring, lack of sanitation and buildings<br />
that, at times, are not built to code. In tandem with<br />
economic hardship and social abuses, these communities<br />
face high levels of crime, violence, prostitution and sexually<br />
transmitted diseases.<br />
So-called bachelor ghettos have formed in Bneid El<br />
Gar, Jahra, Khaitan, Subhan, Suelibeikhat, and Sulaibya<br />
with the most infamous at Jleeb El Shyoukh near the<br />
Kuwait International Airport. 125 Women living in housing<br />
compounds as domestic servants are often also vulnerable to<br />
abuse.<br />
In response to criticism, the Kuwaiti government passed<br />
the New Labour Law in 2009 to provide more rights for<br />
private sector workers, to set tougher punishment for abuse<br />
and to create a public authority to regulate international<br />
labour recruitment. In addition, the government has issued<br />
a call for private sector investment in six residential labour<br />
cities built to international standards that would house<br />
60,000 workers and be located north of Sabiya, north of Al<br />
Mutaleh, South Jahra, East of Ereifjan City, and north of<br />
Khairain City.<br />
While these labour cities would improve living standards,<br />
more significant efforts are needed to integrate the 2.3 million<br />
expatriate workers in the life of the country. As has been<br />
demonstrated in housing projects worldwide, the physical,<br />
social and residential segregation of low-income groups tend<br />
to deepen poverty, lead to disinvestment and encourage the<br />
creation of urban slums.<br />
In Saudi <strong>Arab</strong>ia, sponsored labourers, rural migrants and<br />
poorer nationals have taken residence in mixed-ethnicity<br />
communities of substandard housing. 129 While some<br />
employers provide housing on site, others do not. There has,<br />
consequently, been a proliferation of informal settlements as<br />
a result of an inadequate supply of affordable housing and<br />
loosely enforced development regulations. 130 Of the 3.4<br />
million slum residents in Saudi <strong>Arab</strong>ia, around one-third are<br />
located in Jeddah in more than 50 slums spread across 4,800<br />
hectares (about 16 per cent of the city’s built-up area). 131<br />
Some are located in the neglected Old City centre –<br />
particularly between Al Balad, the Old Airport and Khozam<br />
Palace – while others have located in wadis subject to periodic<br />
flooding – such as the one in which 120 people were killed<br />
in 2009. 132 These settlements lack sanitation, sidewalks and<br />
public lighting and, in the old city, lack of maintenance has<br />
caused buildings to deteriorate to unsafe levels. In 2005,<br />
66 per cent of buildings in Al Sharafiyah settlement were<br />
considered to be in “bad” or “very bad” physical condition.<br />
In the newer, self-built settlements on the periphery of the<br />
city, including Kilo 14, Kilo 11 and Quwaizah, low-quality<br />
materials make buildings unsafe. 133<br />
As part of its Jeddah without Slums programme, the Jeddah<br />
Development and Urban Regeneration Company plans to<br />
redevelop areas in the city centre and reduce the total number<br />
of residents living in informal areas to 300,000. 134 The<br />
programme aims to provide residents with better services,<br />
better integrate them into society, redevelop existing areas<br />
with high density developments, open key land holdings to<br />
high-value uses and preserve and improve existing buildings<br />
and street networks.<br />
The programme will begin in the Khosam Palace area, with<br />
the regeneration of four communities – Sabil, Nuzlah, parts<br />
of Al Balad and Qurayyat – that are located on 370 hectares<br />
of which 60 per cent are unplanned settlements. The second<br />
phase will address the Ruwais area, with 140 hectares, 60 per<br />
cent of which is also unplanned. Forty per cent of residents<br />
will need to be resettled in 151,600 new housing units. 135<br />
Although SAR 4 billion (USD 1.1 billion) has been issued<br />
as relocation compensation, not all residents were satisfied or<br />
wanted to leave their communities. 136<br />
Land Tenure, Property Rights and Titling<br />
To open real estate markets and diversify the economy,<br />
Oman granted all GCC nationals in 2002 the right to own<br />
property and all nationalities in 2007 the right to invest in<br />
Integrated Tourism Complexes or zones designated for an<br />
international clientele.<br />
Along similar lines, Kuwait passed a law in 2010 that<br />
allows expatriates to buy an apartment of up to 350m 2 if<br />
they have lived in the country for longer than ten years<br />
and have an unblemished criminal record. They must sell<br />
the property upon leaving the country. Saudi <strong>Arab</strong>ia,<br />
which historically barred foreigners from owning property,<br />
announced in 2010 that foreigners would be permitted to<br />
buy property in one of four new cities under construction,<br />
the first of which will be the King Abdullah Economic City,<br />
a new financial district in Riyadh. 137 In Jeddah, starting in<br />
2007, the municipality began to issue land titles to Saudis<br />
living in unplanned settlements. However, most of the<br />
residents of these informal areas are expatriates who will not<br />
benefit from these reforms. 138<br />
149
150<br />
In Bahrain, while the constitution guarantees property<br />
rights and provides just compensation for expropriation,<br />
the ruling family has repeatedly violated these policies by<br />
taking agricultural and coastal property for development. 139<br />
In older parts of cities and unplanned settlements, properties<br />
commonly lack formal deeds or have overlapping deeds;<br />
significant corruption has been cited in this regard. 140<br />
In other GCC countries, expatriates may buy properties<br />
in designated zones. 141 According to the 2010 Index of<br />
Economic Freedom, the GCC countries rank the highest<br />
among <strong>Arab</strong> countries in property rights, with the exception<br />
of Saudi <strong>Arab</strong>ia, which lags behind Egypt, Jordan and<br />
Morocco.<br />
Urban Land and Fiscal Policies<br />
The sharp market correction of real estate prices in 2008<br />
demonstrated the degree to which property development<br />
had become speculative, particularly in Bahrain, Dubai and<br />
Qatar. 142 In 2008, the price of 100 m 2 of unserviced land<br />
in Jeddah was 2.2 times the average annual family income,<br />
while the same amount of land with water and electricity<br />
services and connected by a road was 19 times the average<br />
family income. 143<br />
Real estate speculation in the GCC countries is driven<br />
by current public land and finance policies, a prevalence of<br />
foreign workers and a lack of urban land management. The<br />
inability of foreigners to own property in most areas results<br />
in strong and often speculative “buy-to-let” markets. In the<br />
absence of effectively enforced land planning and zoning<br />
or vacant property taxation, governments have few fiscal<br />
management tools to curb land speculation while a lack of<br />
private-sector housing finance prevents lower-income groups<br />
from making long-term housing investments.<br />
Recently, the Saudi government froze free land allocations,<br />
although many grants which have yet to be processed<br />
are already in the system, including as many as 200,000<br />
applications (equalling 12,500 hectares) in Jeddah. 144 In<br />
addition, private developers in Jeddah have requested the<br />
allocation of over 20,000 hectares of land outside the city’s<br />
1988 boundary in what was clearly a speculative move.<br />
However, the municipal government demonstrated that the<br />
city would need only 17,000 hectares total to accommodate<br />
growth in the next 29 years, half of which could be situated<br />
on vacant land within its boundary. 145 The burst of the 2008<br />
speculative bubble led Abu Dhabi to adopt a new Escrow Law<br />
and to create an organization similar to Dubai’s Real Estate<br />
Regulatory Authority to regulate all property transactions,<br />
prohibit off-plan land transfers, and develop a transaction<br />
database.<br />
Housing Finance and Mortgage Markets<br />
Traditionally, the Gulf countries, Saudi <strong>Arab</strong>ia in particular,<br />
have been suspicious of interest-charging banking services<br />
due to Shari’a’s prescriptions on usury. Laws authorizing the<br />
development of Islamic banks led to the establishment of<br />
such institutions in Dubai in 1975, Kuwait in 1977, Bahrain<br />
in 1979, Qatar in 1982, and Saudi <strong>Arab</strong>ia in 1987. 146 As of<br />
2006, Islamic banks account for 50 to 55 per cent of the<br />
financial markets in Bahrain, Kuwait, Qatar and the UAE,<br />
40 per cent in Saudi <strong>Arab</strong>ia, and less than 15 per cent in<br />
Oman. 147 Most non-Islamic banks also offer Islamic banking<br />
products and services.<br />
Saudi <strong>Arab</strong>ia, the most religiously conservative country in<br />
the region, has the least developed housing finance market.<br />
The country’s first mortgage law was passed in 2008 but its<br />
impacts and implications have yet to become clear. At the<br />
same time, the government-owned Real Estate Development<br />
Fund, which provides housing finance with zero interest<br />
charges to citizens, is poorly capitalized and, given the lack<br />
of fines and fees, many borrowers defer or default on their<br />
payments. With fewer than 10,000 loans approved each<br />
year, the waiting list has grown. The national Islamic Al<br />
Rajhi Bank also offers musharaka arrangements in which the<br />
bank lends for up to 90 per cent of the property cost and<br />
the client pays the bank rent and amortization over a 15- to<br />
25-year period. Such arrangements are used mainly in new<br />
developments by wealthier clients. 148<br />
Kuwait did not grant low-interest housing loans or<br />
government-subsidized housing to women. As of 2010,<br />
there were an estimated 68,000 women in the country who<br />
were divorced, widowed, single without parents, or married<br />
to non-Kuwaitis. 149 The government’s creation of special<br />
housing blocks for them only served to deepen their isolation<br />
in society. 150 In 2010, at the recommendation of Parliament’s<br />
Women’s Affairs Committee, the government agreed to<br />
amend housing, credit and banking laws that discriminate<br />
on the basis of gender. These reforms and the disbursement<br />
of a KWD 500 million (USD 1.7 billion) to capitalize a<br />
Credit and Savings Bank housing welfare fund for women<br />
paved the way to offer them low-interest housing finance. 151
4.4<br />
Urban Mobility<br />
The Challenges of Urban Mobility<br />
Oil money in the Gulf has facilitated heavy investment<br />
in extensive road networks, with high-capacity<br />
highways and arterials encircling neighbourhoods<br />
and cities. In Oman, massive investment in the road system<br />
has created a strong network of roads reaching even remote<br />
areas. The country paved and repaired nearly 6,000 km of<br />
roads from 2007 to 2009. 152 In Saudi <strong>Arab</strong>ia, Jeddah’s<br />
network comprises 564 km of roads, including 100 km of<br />
freeways that by the city’s own admission are over-scaled and<br />
inefficient consumers of urban land.<br />
Concurrent with rising GDP per capita and road<br />
construction projects, the Gulf has motor vehicle ownership<br />
rates roughly equivalent to those of other high-income<br />
countries. From 2004 to 2009 the number of registered<br />
vehicles grew by 150 per cent in Bahrain 153 , by 149 per cent<br />
in Abu Dhabi from 2006 to 2008 154 and by 143 per cent<br />
in Qatar from 2002 to 2007. 155 Riyadh, where, on average,<br />
households have 1.7 cars, saw the number of daily vehicular<br />
trips increase from 1 million in 1987 to 5 million in 2006<br />
and 6 million in 2007. 156<br />
However, there are large disparities between the national<br />
and expatriate residents. In urban areas of Dubai, the average<br />
number of cars per urban household was 2.4 for locals, 0.9 for<br />
non-locals and 0.3 for expatriates living in group quarters. 157<br />
The surge in vehicles has led to severe congestion in city<br />
centres. In Kuwait City, sections of the road network are 85 per<br />
cent congested. 158 In Jeddah, outdated and poorly synchronized<br />
traffic signals further contribute to delays and congestion. In<br />
a survey, Doha’s Urban Planning and Development Authority<br />
found that only 18 per cent of residents were satisfied with<br />
traffic flows, the lowest score given on any topic, compared<br />
FIGURE 43: PERCENTAGE OF REGISTERED MOTOR VEHICLES BY CATEGORY (2007) 166<br />
UAE<br />
Oman<br />
Kuwait<br />
Bahrain<br />
Motorcars Minibuses/vans<br />
(seating
152<br />
BOX 20: DUBAI’S STRATEGIC TRANSPORTATION PLAN<br />
<br />
Dubai’s impressive road network. ©Philip Lange/Shutterstock<br />
A crucial element of the successful<br />
industrialization and development of any<br />
country is a well-designed transportation<br />
system. Dubai’s transportation challenges lie<br />
in reducing traffic congestion and developing<br />
adequate transportation infrastructure to<br />
sustain continued economic growth.<br />
As of 2009, the road network in Dubai<br />
reached 10,700 lane-kilometers and<br />
comprised of freeways, expressways, arterial<br />
roads, collector roads, and local and industrial<br />
roads. In 2006, the Dubai Statistics Center<br />
reported 213,000 registered vehicles, 80 per<br />
cent of which were light vehicles, with the<br />
remainder composed of light and heavy trucks,<br />
buses, motorcycles and heavy mechanical<br />
vehicles. This high level of individualized<br />
mobility generates 42 per cent of the emirate’s<br />
air pollution. Chronic congestion costs Dubai<br />
between 2.4 and 3.2 per cent of GDP.<br />
In response, the government developed a<br />
Strategic Transportation Plan, which identifies<br />
the most efficient and cost-effective solutions to<br />
combat traffic congestion and air pollution. This<br />
plan proposes an integrated system consisting<br />
of taxis and limousines, buses, metro rail, water<br />
taxis and water-buses. The plan, already well<br />
underway, suggests how coordinated action<br />
can help move a car-dependent society towards<br />
greater reliance on public and other more<br />
sustainable transportation options.<br />
Dubai opened the <strong>Arab</strong>ian Peninsula’s first<br />
metro line in 2009 with 29 stations over 52<br />
km to connect major businesses and tourist<br />
attractions. In 2010, 140,000 passengers<br />
used the metro daily. Two other lines are under<br />
construction and are expected to open in 2011<br />
and 2012 extending the system by 62 km and<br />
26 stations; several other lines and extensions<br />
are in the planning stages.<br />
To expand the reach of the mobility system,<br />
Dubai’s Roads and Transport Authority is<br />
planning a 3,000 km bus network to be fully<br />
operable by 2020, a 450 km marine transit<br />
system, 270 km of tram lines and 900 km of<br />
bicycle lanes. In 2009, 1,550 buses serving 116<br />
routes, including 40 feeder bus routes serving<br />
the metro system, carried 350,000 passengers<br />
per day. By the end of 2010, public transit’s<br />
mode share rose to 12 per cent, up from 6 per<br />
cent in 2008. By implementing the rest of the<br />
city’s ambitious transportation plans, Dubai’s<br />
Road and Transport Authority aims to raise<br />
transit’s mode share to 30 per cent by 2020.
Mass Transportation<br />
Unique among <strong>Arab</strong> countries, the GCC has the resources<br />
to implement ambitious urban transport plans as part of<br />
broader development visions. The Gulf governments have<br />
developed transportation master plans to reduce congestion<br />
and improve public transit, the safety of pedestrian networks<br />
and the general quality of urban life. Following the 2008<br />
financial crisis, some development and transit projects have<br />
been put on hold or cancelled. Given the long-term value<br />
of public transport networks, most of these projects will<br />
ultimately move forward.<br />
The most ambitious urban public transportation<br />
undertakings are in Abu Dhabi, Dubai and Jeddah. Given<br />
their small size, Bahrain, Kuwait, Oman and Qatar are<br />
focusing on regional rail, bridge and air linkages with other<br />
cities in the region; these initiatives are explored in Section<br />
4.8 – Emerging Issues.<br />
In Saudi <strong>Arab</strong>ia, the Saudi Company for Group Transport<br />
provides public transportation in ten major cities (Abha,<br />
Buraida, Al Attas, Dammam, Jeddah, Mecca, Medina,<br />
Riyadh, Tabuk and Taif), serving 11.9 million passengers in<br />
2008. There are also a number of private companies offering<br />
transportation services in cities. Intercity transport links 359<br />
cities and villages along 109 routes. 167<br />
In Jeddah, 86 per cent of all trips are taken by car, 10 per<br />
cent by taxi, and less than 2 per cent by bus. 168 The state-run<br />
bus system operates a small number of routes that are severely<br />
underutilized. A network of informal and unregulated<br />
minibuses also runs within Jeddah Governorate.<br />
The Ministry of Transport’s latest comprehensive transport<br />
study calls for the development of a new public transit<br />
network consisting of three light-rail lines; a 429 km feeder<br />
bus system involving 36 routes; a commuter rail on existing<br />
tracks to connect the suburb of North Obhur with Jeddah<br />
City Centre; and, for tourists, two water ferry routes and an<br />
extension of the existing trolley. Saudi <strong>Arab</strong>ia has launched<br />
an ambitious programme to expand its rail system and link it<br />
to networks in neighbouring countries. 169<br />
In Abu Dhabi, an estimated 48 per cent of trips are made<br />
by private car, 8 per cent by taxi, 33 per cent by contract<br />
bus (such as buses for children and day labourers), 10 per<br />
cent by foot, and 1 per cent by public transport. 170 Taxis are<br />
essentially the only form of transportation available to those<br />
without cars.<br />
Based on projected population increase, Abu Dhabi’s<br />
Department of Transport predicts that, in a baseline scenario,<br />
59 per cent of trips in 2030 would be made by car and 20<br />
per cent by mass transit, with car trips taking an average of<br />
85 minutes. To anticipate the emirate’s transportation needs,<br />
the Surface Transport Master Plan calls for an investment<br />
of Dh 300 billion (USD 86 billion) in a transport system<br />
consisting of 131 km of monorail, 340 km of tram lines, at<br />
least two metro lines with 40 stations, a feeder bus system<br />
on dedicated bus lanes on the busiest roads, improved<br />
pedestrian walkways and “personal rapid transit”, a system of<br />
battery-powered “podcars”. 171 As part of its plans to reduce<br />
congestion, the Urban Planning Council will promote mass<br />
transit developments in two city centres, one downtown<br />
and the other in the new Capital District. Through these<br />
investments, Abu Dhabi hopes to reduce car trips to 43 per<br />
cent of mode share and increase transit trips to 41 per cent<br />
by 2030. 172<br />
Efforts to promote mass transit face obvious challenges<br />
given the level of motorization today, but will also be much<br />
welcomed by women, the poor and migrant labourers<br />
who do not have cars and/or cannot afford taxis. Public<br />
transit initiatives must also overcome the low cost and high<br />
convenience of private transport, as well as the social stigma<br />
that is associated with bus transit.<br />
Road Safety<br />
Despite their high rate of motorization, roads in the GCC<br />
countries are relatively safe when compared with other <strong>Arab</strong><br />
countries although, with the exception of Bahrain, less so<br />
than in the advanced economies. Saudi <strong>Arab</strong>ia and the UAE<br />
have the worst road safety record, with an average of 200<br />
accidents per day in Jeddah in 2007, 173 and the UAE has the<br />
ninth-highest rate of fatalities in the world. 174 Traffic-related<br />
deaths in Oman have consistently risen since 2000 and may<br />
soon overtake the rates in Qatar and Saudi <strong>Arab</strong>ia if meaures<br />
are not taken to improve road safety. Traffic fatalities are also<br />
on the rise in Bahrain. 175<br />
Accidents tend to be concentrated in cities, with a few<br />
experiencing particularly high levels of car accidents. For<br />
instance, the Al-Jahra Governorate in Kuwait has 3.6 times as<br />
many injurious or fatal accidents as Al-Kuwait Governorate<br />
although the two have equal populations. 176<br />
About two-thirds to three-quarters of all fatalities involve<br />
motorized vehicles with the rest involving pedestrians<br />
and cyclists. In 2007, Jeddah reported 1,200 pedestrian<br />
casualties, 12 per cent of which were fatal. 177 Ostensibly,<br />
most accidents are due to speeding and lack of compliance<br />
with or enforcement of traffic rules. More fundamentally,<br />
the city’s grid layout isolates and surrounds neighbourhoods<br />
with high-speed roadways. The poor design of the road<br />
network, sidewalks and pedestrian crossings inherently makes<br />
pedestrians, who are more likely to be poor, more vulnerable.<br />
A number of GCC countries plan to improve the safety and<br />
comfort of pedestrian networks as part of their transport plans.<br />
In Dubai, the Road and Transport Authority implemented<br />
safety measures, improved pedestrian infrastructure and<br />
launched a widespread awareness-raising campaign in order<br />
to reduce pedestrian fatalities, which had reached 300 in<br />
2007. Due in large part to these efforts, pedestrian fatalities<br />
fell by 33 per cent from 2008 to 2009 and by another 23 per<br />
cent in 2010. 178<br />
153
154 4.5 Urban Environmental Challenges<br />
Water Resource Scarcity and Management<br />
With its arid climate and rapidly growing population,<br />
the Gulf is one of the most water-scarce regions in<br />
the world. Five GCC countries are among the ten<br />
countries in the world with the lowest per capita renewable<br />
water supply. The region’s limited water resources include<br />
shallow aquifers that are replenished by the winter rains and<br />
larger supplies of non-renewable fossil water in deep aquifers<br />
formed millions of years ago. Since 1960, population in the<br />
GCC has grown sevenfold while water consumption per<br />
capita rose by 336 per cent in Kuwait from 1992 to 2010; 179<br />
by 125 per cent in the UAE from 2006 to 2008; 180 by 120 per<br />
cent in Muscat from 2005 to 2009; 181 and by 120 per cent in<br />
Bahrain from 2000 to 2008. 182 To meet demand, the GCC<br />
countries have overexploited existing resources and have<br />
begun to invest heavily in desalination facilities.<br />
Government investments in water and sanitation<br />
infrastructure have achieved near universal access to these<br />
basic services throughout the region, with the exception of<br />
Oman. While water distribution networks are extensive in<br />
cities, many urban and most rural households continue to rely<br />
on wells and tankers.<br />
In Saudi <strong>Arab</strong>ia, 1,660 cities, towns, villages and hamlets<br />
have water distribution networks, while 4,060 villages and<br />
hamlets rely on water tankers. 183 In Jeddah, only 25 per cent<br />
of households have a direct water connection, although the<br />
water distribution network reaches 90 per cent of the city.<br />
Households in low-income and informal settlements rely on<br />
tankers to deliver water that can cost as much as 150 per cent<br />
that of piped water. 184<br />
Improved sanitation takes the form of either urban sewer<br />
systems or sealed septic tanks. Most areas of the Gulf cities<br />
lack drainage systems. Septic tanks are sealed and vacuum<br />
tankers collect the waste every few weeks. Dubai has 4,000<br />
FIGURE 44: AVAILABLE AND WITHDRAWN WATER RESOURCES PER CAPITA<br />
m3 of water per inhabitant per year<br />
1,000<br />
800<br />
600<br />
400<br />
200<br />
0<br />
Total Renewable Water Resources (actual)<br />
Total Water Withdrawn<br />
Bahrain<br />
Kuwait<br />
Oman<br />
Qatar<br />
Saudi <strong>Arab</strong>ia<br />
Source: FAO Aquastat 2007 data, except for Kuwait’s consumption, which is 2002 data.<br />
UAE<br />
<br />
Kuwait’s landmark towers which hold a total of 4,500 cubic metres of water.<br />
©Johnny Dao/Shutterstock
BOX 21: RESPONSES TO WATER SHORTAGES IN THE UNITED ARAB EMIRATES<br />
<br />
Desalination plant in Dubai, UAE. ©Shao Weiwei/Shutterstock<br />
UAE governments are vigorously enforcing<br />
water conservation measures. In addition to<br />
its focus on desalination and wastewater<br />
treatment, the UAE has begun adopting<br />
alternatives to avoid exploiting hydrocarbon<br />
fuel and groundwater supplies.<br />
such tankers; only 22 out of 106 municipal areas in Saudi<br />
<strong>Arab</strong>ia have sewerage infrastructure and it is estimated that<br />
only one-third of these systems treat wastewater to the<br />
tertiary standards required for reuse. The Ministry of Water<br />
and Electricity estimates that the country will need to invest<br />
USD 20 billion in sewer networks and USD 17 billion in<br />
wastewater treatment facilities over the next 20 years. 185<br />
As a result of government subsidies, per capita consumption<br />
of water in the GCC is among the highest levels in the world.<br />
In comparison with consumption levels of 150 to 250 litres<br />
per day in the advanced economies, Qataris consume 400<br />
litres and Saudis 250 litres. 186 In Jeddah, households pay<br />
SAR 0.15 (USD 0.04) per cubic meter for the first 100m 3 ,<br />
although the production and delivery cost to the government<br />
is SAR 7 (USD 1.90). 187 In Riyadh and Manama, water costs<br />
USD 0.03 and USD 0.07 per m 3 , respectively. 188 In Kuwait,<br />
which has similar water costs and subsidies, government<br />
water subsidies equalled 2.4 per cent of GDP in 2002. 189<br />
Systemic water loss levels are also high: Bahrain – 23 per cent;<br />
Abu Dhabi already has plans to increase<br />
its underground emergency water storage to<br />
90 days’ worth of water, up from its current<br />
storage of three days’ worth. According to<br />
the Environment Agency Abu Dhabi that is<br />
implementing the USD 5 billion (Dh 18.37<br />
billion) project, the Aquifer Storage and<br />
Recovery (ASR) technique involves injecting<br />
excess desalinated and fresh water into the<br />
aquifer by using wells or infiltration basins.<br />
When the project is ready in 2013, it will be<br />
able to store 26 million cubic metres of water<br />
to be tapped by the distribution network only in<br />
case of emergency. The underground storage<br />
has proved technically efficient in comparison<br />
with the health, economic and environmental<br />
implications of surface storage.<br />
In the western and eastern regions, the Abu<br />
Dhabi Environment Agency is implementing<br />
a desalination plant that works on solar<br />
energy. The newly developed membrane<br />
technology will be used for the first time in<br />
this plant, which will be powered by ultra-high<br />
concentrator photovoltaic technology, capable<br />
of operating the system at a concentration<br />
greater than 1,500 suns, or about three times<br />
the solar concentration of most concentrator<br />
photovoltaic panels currently in operation.<br />
Of the ten largest desalination plants in the<br />
world, five are in the UAE and four in the other<br />
GCC countries. Each square kilometre of land<br />
in the MENA region receives solar energy that<br />
is equivalent to 1.5 million barrels of crude oil<br />
a year. As renewable energy becomes more<br />
available, there is a greater need to develop<br />
more environmentally friendly and costeffective<br />
sustainable fresh water.<br />
Saudi <strong>Arab</strong>ia – 28 per cent; Qatar – 35 per cent; Oman – 35<br />
per cent; and Kuwait – 38 per cent. 190 No city in the GCC<br />
charges wastewater treatment fees.<br />
The GCC countries increasingly rely on desalinized water<br />
to meet growing demand and have become the forerunners<br />
in desalination technology. Qatar relies on desalinized water<br />
for 99 per cent of its supply, Jeddah 97 per cent; and Kuwait<br />
and Riyadh 60 per cent. 191 In the UAE, the use of desalinized<br />
water increased by 450 per cent from 2000 to 2008; in 2010,<br />
the country spent USD 800 million on desalination, a cost<br />
that is expected to rise to USD 3.2 billion by 2016 to meet<br />
growing demand. 192<br />
Most desalinized water is used for washing, cleaning,<br />
swimming pools and golf courses, while many people use<br />
bottled mineral water for drinking. The cost of desalination<br />
has decreased over time and Abu Dhabi’s experiment with<br />
solar-powered desalination plants in 30 locations around the<br />
emirate may reduce the energy demand further. However, the<br />
disposal of excess salt in the sea has had a growing impact<br />
155
156<br />
on the marine environment and increased coastal soil salinity,<br />
which in Qatar has forced some coastal farmers to abandon<br />
their land. 193<br />
Governments are re-evaluating water resource management<br />
and deploying more sustainable water use strategies. The most<br />
prevalent strategy is to expand the capacity of desalination<br />
plants and improve the water collection infrastructure.<br />
To implement Oman’s National Water Resources Master<br />
Plan (2000-2020), the country’s 8th Five Year Plan (2011<br />
to 2016) authorizes the Public Authority for Electricity<br />
and Water to build ten emergency reservoirs in and around<br />
Muscat for water storage, extend water supply networks,<br />
build elevated tanks in four of the eight wilayat, expand<br />
the desalination plant at Al Ghubra, and add a high-speed<br />
mobile desalination plant with a 1 million gallon capacity.<br />
As desalination capacity increases, the Authority hopes to use<br />
less groundwater, which would be held as a strategic reserve.<br />
Similarly, Qatar, will invest USD .75 billion to construct<br />
a mega-reservoir to contain seven days’ worth of emergency<br />
water supply. In Abu Dhabi, authorities have begun<br />
constructing an underground reservoir to store enough water<br />
for 90 days of rationed use. In Saudi <strong>Arab</strong>ia, the production<br />
of desalinated water increased from 7.65 million m³ in 1980<br />
to 1,096.7 million m³ in 2009. 194<br />
A second strategy is to reduce demand through tariff reform<br />
and consumer education. Reversing its historically free water<br />
policy, Doha has set the region’s highest rates at USD 1.20<br />
per m3 . 195 The Public Authority for Electricity and Water<br />
in Muscat will also replace 30,000 water metres to improve<br />
the efficiency and metering. In the UAE, where water and<br />
electricity are jointly managed by state-owned authorities,<br />
water and electricity price hikes are expected, with water and<br />
electricity prices in Dubai to rise by 15 per cent in 2011. 196<br />
Such measures, important as they are, tend to be highly<br />
unpopular and may be put off in the face of social unrest<br />
across the Middle East. The electricity and water authorities<br />
of Dubai and Abu Dhabi are also sponsoring a number of<br />
high-profile demand management campaigns. A study<br />
found that even without tariff increases, Abu Dhabi could<br />
avoid building two power stations and a desalination plant<br />
if it increased the efficiency requirements for households,<br />
improved education campaigns and strengthened insulation<br />
and cooling system requirements inits building codes.<br />
A third strategy is to reduce domestic agriculture, which<br />
consumes 60 to 93 per cent of water in the GCC countries.<br />
In 2003, Saudi <strong>Arab</strong>ia stopped subsidizing the production<br />
of barley and, following a 2008 decree, it will phase out all<br />
water-intensive crops by 2016, including wheat. 197<br />
Such policies have critical impacts on national food<br />
policies, with countries trading domestic water subsidies<br />
for food subsidies. Countries are also increasing wastewater<br />
reuse, most of which is used for landscaping and industrial<br />
purposes. Kuwait treats 60 per cent of its wastewater to<br />
tertiary levels, 198 and Abu Dhabi reuses 60 per cent of treated<br />
wastewater, which represents only 4 per cent of total water<br />
199, 200<br />
consumption.<br />
Climate Change<br />
Climate models generally point to higher average<br />
temperatures and a combination of lower and increased<br />
rainfall and flooding in the GCC, depending on the area.<br />
Climate change will further reduce long-term water supplies,<br />
increase the reliance on desalination with subsequent energy<br />
costs, reduce available water for agriculture, and lead to more<br />
heat waves. Already, compared to 1957, average temperatures<br />
outside of Kuwait City are 1.5 to 2.0ºC higher and increased<br />
desertification affects nearly 300 km 2 of land in Kuwait each<br />
year. 201 Surface sea temperatures in Kuwait Bay have been<br />
rising by 0.6°C per decade, around three times faster than<br />
the global average, due to a combination of climate change,<br />
changing wind and water currents, coastal power generation<br />
and desalination. 202<br />
Demand for new residential communities in the GCC’s<br />
coastal areas has led to land reclamation and infilling of the<br />
salt-flats and nearby islands. As a result, growing populations<br />
live in low-lying areas with little remaining coastal habitat to<br />
absorb floods and storms. Many unplanned communities have<br />
also developed in floodplains close to wadis and water sources.<br />
A one-meter rise in sea level could cover 3 per cent of<br />
Qatar’s land area and 1 per cent of Kuwait’s land area; and a<br />
five-meter rise in sea level could cover 13 per cent of Qatar’s<br />
land area 203 and 3 per cent of Kuwait’s land area. 204<br />
These changes could affect over 50 per cent of the<br />
populations in Qatar, Bahrain and the UAE. 205 In Saudi<br />
<strong>Arab</strong>ia, were around 50 per cent of the population lives<br />
within 100 km of the coast, Dammam, Ras Tanura, Jubail<br />
and Khafji on the eastern coast and Jeddah, Rabigh, Yanbu<br />
and Jizanon the western coast are the most vulnerable coastal<br />
cities. 206<br />
In 2009, the World Meteorological Organization<br />
recommended that Bahrain construct flood barriers in<br />
anticipation of sea level rises between 20 and 60cm by<br />
2100. 207 As part of its efforts to meet these challenges, Bahrain<br />
has established a National Disaster Management Committee<br />
that requires all new construction projects in Bahrain to be<br />
designed to withstand potential sea level rise. 208<br />
In the UAE, which has more than 1,300 km of coastline, an<br />
estimated 85 per cent of the population and over 90 per cent<br />
of the infrastructure are only a few metres above sea level. 210<br />
Given this vulnerability, the UAE became one of the first<br />
major oil-producing countries to ratify the Kyoto Protocol<br />
to the UN Convention on Climate Change in 2005. Abu<br />
Dhabi’s Environment Agency issued projections in 2009 on<br />
the possible inundation effects of sea-level rise. 211 Plan Abu<br />
Dhabi 2030 cites the need to develop an integrated coastal<br />
environmental management plan, 212 and adopt measures to<br />
mitigate heat island effects. 213<br />
Over 50 per cent of Oman’s population lives along the<br />
coastline in Muscat and in the Batinah region. 214 With<br />
Cyclone Guno in 2007, Oman experienced its strongest<br />
recorded tropical cyclone and realised the vulnerability of its<br />
coast to extreme weather. 215
FIGURE 45: GCC REGIONAL CLIMATE MODEL PROJECTIONS IN THE 2020s, 2040s AND 2070s RELATIVE TO THE 1990s 209<br />
PRECIPITATION CHANGES (%) AVERAGE TEMP CHANGES (˚C)<br />
2020s Model<br />
0 0.4 0.8 1.2 1.6 2 3<br />
0 0.4 0.8 1.2 1.6 2 3 0 0.4 0.8 1.2 1.6 2 3<br />
-30 -20 -10 0 10 20 -30 -20 -10 0 10 20 -30 -20 -10 0 10 20<br />
FIGURE 46: GCC CITIES VULNERABLE TO SEA-LEVEL RISE 216<br />
% of national urban<br />
population in urban LECZ<br />
City size<br />
0.0 - 5.0<br />
5.1 - 10.0<br />
10.1 - 15.0<br />
15.1 -20.0<br />
20.1 - 25.0<br />
> 25.0<br />
Small: 100K - 500K<br />
Intermediate: 500K - 1 million<br />
Large: Over 1 million<br />
Jeddah<br />
Aden<br />
N<br />
0 1,000 2,000Km<br />
2040s Model 2070s Model<br />
The government has formed a separate Ministry of<br />
Environment and Climatic Affairs to evaluate disaster<br />
vulnerability, established a hydro-meteorological network<br />
of rain and wadi gauges, and it developed guidelines for<br />
developments in flood prone areas. These studies point to the<br />
inadequacy of the drainage systems in urban areas and the<br />
inability of combined sewer systems to handle flash floods.<br />
Food Security<br />
Even as climate change models predict a further reduction<br />
in crop production, the GCC demand for food is growing<br />
rapidly due to population growth and rising incomes. GCC<br />
countries now import 60 to 90 per cent of their food intake. 217<br />
In 2007, the GCC imported USD 10 billion in foodstuffs, 70<br />
per cent of the <strong>Arab</strong> region’s total food imports that year and<br />
roughly double its 2004 imports.<br />
Fiscal surpluses have allowed governments to raise the<br />
wages of public sector staff and maintain large food subsidies.<br />
In 2007, Saudi <strong>Arab</strong>ia and Kuwait spent only 0.2 and 0.1<br />
157
158<br />
per cent of their GDP on food subsidies. 218 Following the<br />
protests in Bahrain in 2011, the King pledged to raise<br />
food subsidies by 50 per cent in 2011 and 2012 to USD<br />
175 million each year, or 0.8 per cent of GDP. 219<br />
After global food price rose by 25 per cent in 2008, 220<br />
the GCC began to make significant agricultural<br />
investments in countries that are logistically proximate<br />
and have cultural and political ties to the Gulf. In<br />
particular, they are focusing on countries such as Sudan<br />
and Turkey that have untapped water supplies and lack<br />
infrastructure. As of 2010, the UAE controlled more<br />
than 2,800 km 2 of farmland in Khartoum, Jazeera, Nile<br />
and other provinces of Sudan, an area equal to 3.5 per<br />
cent of its own land mass and greater than its farmland. 221<br />
GCC countries are aware that some of the countries<br />
where they are investing are themselves food importers<br />
and receive food aid. Their investments therefore seek<br />
to strengthen local food security and socio-political<br />
stability while also generating adequate exports to the<br />
GCC. 222 See also The State of African <strong>Cities</strong> 2010, p.56.<br />
(Free pdf download from www.unhabitat.org)<br />
Energy and Air Pollution<br />
Due to the region’s extreme temperatures and need<br />
for desalinated water, energy demand in the GCC is<br />
exceptionally high. Although electricity costs on average<br />
USD 0.12 per kWh to produce in the Gulf, it is sold<br />
for around USD 0.04. With the exception of the UAE,<br />
where Sharjah’s Electricity and Water Authority sharply<br />
increased electricity prices in 2009 and other emirates<br />
are expected to follow, countries have been reluctant to<br />
reform tariffs.<br />
On average, demand for energy has increased in the<br />
GCC by 6 per cent annually. 223 In 2007, Bahrain,<br />
Kuwait, Qatar and the UAE were the first, third,<br />
fourth and fifth-highest CO 2 per capita producers in the<br />
world. 224 As a whole, the GCC produces roughly half the<br />
carbon dioxide emissions produced in the <strong>Arab</strong> world.<br />
The GCC governments are developing new energy<br />
portfolios with a focus on nuclear and renewable energy.<br />
The UAE is the most active in planning its post-oil<br />
energy future and is the first <strong>Arab</strong> nation to develop<br />
nuclear power on a commercial scale. It aims to provide<br />
25 per cent of its electricity needs in 2020 from nuclear<br />
sources and has commissioned four nuclear power plants<br />
at a cost of Dh 75 billion (USD 20 billion) to be built<br />
by 2020.<br />
In 2010, the government also launched the Emirates<br />
Energy Star programme to promote high-tech<br />
infrastructure to monitor and optimize energy use in<br />
buildings. If successful, this initiative could reduce<br />
UAE’s overall power consumption by as much as 30 per<br />
cent. 225<br />
One of the UAE’s boldest ideas is Masdar City,<br />
located 17 km from Abu Dhabi City. The Abu Dhabi<br />
<br />
Proposed master plan of Masdar City in Abu Dhabi, UAE. ©www.masdar.ae
FIGURE 47: PARTICULATE MATTER (PM10) AS A WEIGHTED AVERAGE OF THE<br />
URBAN POPULATION<br />
PM10 μg/m3<br />
180<br />
150<br />
120<br />
90<br />
60<br />
30<br />
0<br />
1996<br />
2006<br />
Bahrain<br />
Kuwait<br />
Oman<br />
Source: World Bank Development Indicators.<br />
Qatar<br />
Saudi <strong>Arab</strong>ia<br />
Future Energy Company, a government-owned commercial<br />
enterprise, will spend USD 15-30 billion to create Masdar,<br />
a city that will obtain all its energy coming from renewable<br />
sources, recycle most of its water, reuse all waste and<br />
include pedestrian walkways. Though the city, which will<br />
accommodate 40,000 residents and 70,000 employees,<br />
features traditional architectural elements, it also inserts<br />
futuristic designs, such as subterranean pod-cars. Lauded by<br />
some for its innovation, the project has also been criticized<br />
as being targeted for an elite economic class and for its<br />
geographic isolation from other existing urban areas. 226<br />
The Gulf has high potential for renewable solar and wind<br />
energy. In 2009, Abu Dhabi became the first emirate to<br />
declare a renewable energy target, with an aim of generating<br />
7 per cent of electricity from renewables by 2020. It also<br />
opened its first solar energy plant in Masdar in 2009.<br />
Bahrain has begun testing renewables through the use<br />
of wind turbines that power 13 per cent of energy use in<br />
the World Trade Center in Manama, a solar street lighting<br />
project and a feasibility study of commercial scale solar. 227 In<br />
Oman, where more solar energy falls on each square meter<br />
of land than almost anywhere else in the world, the Public<br />
Authority for Electricity and Water is conducting a feasibility<br />
study to implement the country’s first commercial solar plant<br />
with 100 to 200MW capacity.<br />
Growing levels of motorization and the construction<br />
industry are worsening air pollution in cities such as Abu<br />
Dhabi, Doha, Dubai, Jeddah, Kuwait City, Manama and<br />
Sharjah. 228 Micro particulate matter (PM10) remains far<br />
above WHO standards of 20 micrograms per cubic metre,<br />
although they declined between 1996 and 2006. Abu<br />
Dhabi’s Environment Agency will convert 20 per cent of<br />
public vehicles and taxis to run on compressed natural gas<br />
and requires all public diesel vehicles to use ultra low sulphur<br />
fuel by 2012. 229<br />
UAE<br />
Solid Waste Management<br />
The Gulf’s per capita municipal solid waste generation<br />
rates are among the highest in the world, totalling over 17<br />
million tons per year, 230 not including industrial, hazardous,<br />
construction and demolition wastes. Bahrain’s waste flows<br />
rose from 1.3 to 1.6 kg per capita per day in the late 1990s<br />
to around 2.7 kg per capita per day in 2007. 231 Per capita<br />
waste generation in Dubai has been increasing by 10 per cent<br />
a year. 232<br />
Depending on the country, services are provided by<br />
municipalities, public-private partnerships, or completely<br />
by private companies. The most prevalent method of waste<br />
disposal is in sanitary landfills, the majority of which are<br />
managed by local or national authorities. Composting and<br />
recycling is limited because the lack of domestic reuse markets<br />
makes recycling unprofitable in comparison to landfilling.<br />
The rapid expansion of the volume of solid waste has<br />
overwhelmed the existing capacity of landfills and is a<br />
particular problem for land-scarce countries like Bahrain<br />
and Kuwait. Thirteen of Kuwait’s 16 landfills have reached<br />
capacity and closed. Illegal dumping, particularly of building<br />
wastes, has been reported in the UAE and Bahrain, resulting<br />
in the destruction of marine life. 233<br />
To counter these trends, the UAE government endorsed a<br />
total phase out of plastic shopping bags and decreed that, by<br />
the end of 2012, all plastic bags made anywhere in the UAE<br />
must be biodegradable.<br />
Dubai plans to develop a 6,000 ton/day waste-to-energy<br />
incineration plant. 234 Given that 56 per cent of the country’s<br />
waste stream comes from the construction and demolition<br />
sector, Abu Dhabi recently opened a Construction and<br />
Demolition Waste Recycling Plant that uses environmentally<br />
friendly technologies to process and recycle building waste<br />
into reusable aggregate materials. One of the largest and<br />
most sophisticated in the region, the plant has an initial<br />
capacity of 5,000 tons per day and could reach 15,000 tons/<br />
day in the future.<br />
Liveability and Quality of Life<br />
As part of ongoing efforts to diversify their economies<br />
and attract investment, cities in the Gulf are actively trying<br />
to improve their urban liveability and quality of life. Open<br />
space has declined, with vegetated areas in Riyadh dropping<br />
from 78m 2 per capita in 1950 to 16m 2 in 1999. 235 A survey<br />
of Doha residents found that, in addition to overcrowding<br />
and concerns about education, healthcare and congestion,<br />
residents felt that public spaces should be improved, feedback<br />
that is reflected in the National Master Plan. 236 In Jeddah,<br />
there is on average 2m 2 of open space per capita, compared to<br />
the WHO standard of 8m 2 . Jeddah’s Strategic Plan therefore<br />
focuses on making public spaces available, civic life and<br />
allocating non-urban land for protection and leisure. 237<br />
159
160 4.6 Urban Governance Systems<br />
<br />
Opened in November 2010, the 842 meter long Sheikh Zayed bridge in Abu Dhabi is said to be the most intricate bridge ever constructed. ©Philip Lange/iStockphoto<br />
National Urban Policy<br />
All aspects of government in the GCCs are highly<br />
centralized, including planning and urban<br />
administration. Typically, national ministries develop<br />
national, regional and local urban policies, and municipal<br />
authorities implement plans and new developments.<br />
Particularly in the smaller emirates, the national planning<br />
agency prepares national, metropolitan and local level plans.<br />
In Saudi <strong>Arab</strong>ia, the Ministry of Economy and Planning is<br />
responsible for national development, while the Ministry of<br />
Municipal and Rural Affairs (MOMRA) is responsible for the<br />
development of spatial strategies and infrastructure at all levels<br />
of government. Working with UNDP, MOMRA will update<br />
the 2000 National Spatial Strategy and provide principles<br />
to translate the country’s 2025 strategy and Ninth National<br />
Development Plan (2010-2015) into urban development<br />
projects. 238<br />
Bahrain’s Ministry of Municipalities Affairs and Agriculture<br />
formulated the 2008 National Planning Development<br />
Strategy. The Ministry’s Urban Planning Affairs department<br />
conducts infrastructure and planning studies, prepares<br />
detailed master plans on behalf of towns, villages and cities,<br />
and formulates development controls.<br />
In Oman, urban planning is managed by the Ministry of<br />
Regional Municipalities, Environment and Water Resources.<br />
Following the damage caused by Hurricane Gonu in 2007, this<br />
entity was split into the Ministry of Regional Municipalities<br />
and Water Resources and the Ministry of Environment and<br />
Climatic Affairs, whose focus is on natural hazards. Oman’s<br />
Supreme Committee for Town Planning launched a National<br />
Spatial Strategy in 2010 in coordination with the country’s<br />
Vision 2020.<br />
In Qatar, the Ministry of Municipal Affairs and Agriculture<br />
supervises planning and development, road maintenance,<br />
agriculture, food safety, public services and the environment.<br />
The Ministry’s Assistant Secretary for Municipal Affairs<br />
coordinates the development of the country’s ten<br />
administrative districts. However, it is the only GCC country<br />
that has not yet developed a national urban strategy.<br />
Both Abu Dhabi and Dubai in the UAE have strategic<br />
development plans, and Abu Dhabi is conducting some of the<br />
more ambitious state-led planning experiments in the region.<br />
The Urban Planning Council (UPC), established in 2007, has<br />
developed Urban Structure Framework Plans for Abu Dhabi<br />
City, Al Ain City, and Al Garbiya, proposing conceptual<br />
solutions to meet growth demands.<br />
To implement these plans, the UPC launched the estidama<br />
(‘sustainability’ in <strong>Arab</strong>ic) programme, a set of guidelines that<br />
aim to increase the long-term sustainability of developments<br />
in the emirate. This relies on the Pearl Rating System to<br />
evaluate the integrated development process: ecological
systems, liveability, water, energy, materials and innovation in<br />
buildings and developments.<br />
Developers seeking to achieve these voluntary standards<br />
must introduce improved practices in the design and<br />
construction process. The construction of roads, water supply<br />
systems, wastewater treatment plants, power supply networks,<br />
and education and health facilities resulted in significant<br />
improvements in the quality of life of their citizens.<br />
Urban development projects in the GCC are primarily<br />
driven by the private sector and market demand. The policy<br />
of giving free land and low- or no-interest loans to citizens for<br />
housing has contributed to wasteful patterns of urbanization<br />
that in turn has led to high operating costs for municipal<br />
governments.<br />
As in many labour-importing countries, formal<br />
development addresses the needs of nationals and wealthy<br />
expatriates. Migrant workers’ housing, quality of life and<br />
social services are substantially inferior. The challenge for<br />
Gulf cities is to integrate rapid urbanization within a holistic<br />
framework of sustainable development, spatial planning<br />
and development controls to help create more inclusive and<br />
ecologically responsive communities.<br />
Decentralization and Local Government Systems<br />
Saudi <strong>Arab</strong>ia reorganized its local governance structure<br />
in 1993. The government established regional councils<br />
and increased the number of regions from four to 13 to<br />
reflect differences in local characteristics and priorities and<br />
coordinate the work of the sectoral ministries.<br />
Local governance consists of 13 regions, five city authorities<br />
and six directorates for water and sewer. The head of the regional<br />
council, the emir, is appointed by the king and has the rank<br />
of minister. The emir oversees the governorates, districts and<br />
municipalities within the region. The council’s membership<br />
consists of the local heads of the sectoral ministries, the heads<br />
of government agencies, ten citizens and local civic leaders.<br />
The responsibilities of the council are to maintain law and<br />
order and to supervise socio-economic development within<br />
the region. The regional and city councils prepare master<br />
plans for their areas and monitor implementation. 239<br />
Recently, the government has attempted to give<br />
municipalities more power and autonomy to make and<br />
implement decisions. Despite this effort to devolve<br />
responsibilities, their autonomy is still limited as higher<br />
officials have the power to interfere with decisions and<br />
overrule them. The central government also has the power<br />
to dissolve a local government, remove members of the local<br />
council or choose contractors to undertake local projects,<br />
which in some cases can create conflicts of interest.<br />
Central ministries issue regulations and oversee the<br />
preparation of plans. Local governments cannot set local tax<br />
rates, have no borrowing power and are dependent on central<br />
transfer for their budgets. 240<br />
Although the power of local governments is limited, some<br />
authorities in the Emirates of Riyadh, Mecca and Medina<br />
manage their own finances and have budgets separate from<br />
the Ministry of the Interior. In Mecca and Medina, technical<br />
committees conduct administrative functions, planning and<br />
development, and education and health services, among<br />
others. Most importantly, they oversee the Hajj, the annual<br />
pilgrimage that brings about 3 million Muslims from all over<br />
the world to the holy cities. Medina’s performance has been<br />
outstanding and its urban observatory with performance<br />
indicators has received wide recognition throughout the<br />
<strong>Arab</strong> world. 241<br />
Municipalities, which constitute the second tier of local<br />
administration in Saudi <strong>Arab</strong>ia, are responsible for issuing<br />
building and business permits, ensuring food safety and<br />
public health, maintaining parks and public space, solid waste<br />
management and street lighting. The national ministries<br />
provide education, social services and housing. 242 While the<br />
mayors of all municipalities are appointed, the country held<br />
its first elections for the 179 municipal councils in 2005 and<br />
another in 2011. Half the seats are filled by elected members,<br />
the other half are appointed by the king. 243 In 2005, an<br />
estimated 20 per cent of citizens were eligible to vote, namely<br />
men over age 21 who were not in the military and had resided<br />
in their district for at least one year. 244 In September 2011,<br />
however, King Abdullah announced that Saudi women will<br />
be given the right to vote and run for municipal elections and<br />
also have the right to be appointed to the shura council.<br />
The smaller GCC countries are essentially city-states, where<br />
services are provided by a mix of national and local level<br />
agencies. The Oman government is technically decentralized<br />
into 43 municipalities, although these sub-units have limited<br />
autonomy. The Ministry of Regional Municipalities and<br />
Water Resources supervises and funds municipalities, and<br />
may commission specific infrastructure projects.<br />
Muscat has an elected, 28-member municipal council led<br />
by a chairman, with 11 of the councillors representing specific<br />
government ministries. The municipal council frames local<br />
policies and budgets and develops proposals for local taxes<br />
and fees to be approved by the Ministry. While cities provide<br />
such public services as parking and wastewater treatment,<br />
the central government manages parks, pest control, capital<br />
investments in wastewater infrastructure, and services that it<br />
is now trying to privatize.<br />
Ultimate power resides with the sultan and the appointed<br />
59 members of the State Council. Citizens of the country<br />
have elected the 84-member consultative council (shura) since<br />
the 1990s but this advisory body has no legislative powers. 245<br />
No political parties are permitted in the country.<br />
Qatar has little need for decentralization and central<br />
government agencies deliver effective services. The country<br />
is divided into 10 municipalities, with 80 per cent of the<br />
population living in Doha.<br />
Since the current ruler took power in 1995, a series of reforms<br />
have been implemented to increase popular participation in<br />
governance, beginning with the creation of a single, popularly<br />
elected Central Municipal Council in 1999. The 29-member<br />
municipal council has no legislative powers but advises on<br />
161
162<br />
BOX 22: MANAGEMENT OF THE HOLY CITIES MECCA AND MEDINA<br />
<br />
Medina, Kingdom of Saudi <strong>Arab</strong>ia. ©Ahmad Faizal Yahya/Shutterstock<br />
The Kingdom of Saudi <strong>Arab</strong>ia accommodates<br />
the Holy <strong>Cities</strong> of Mecca and Medina Al-<br />
Munawarah, where the Grand Mosque and<br />
the Prophet’s Mosque are located. These<br />
cities have been of great significance since<br />
the Islamic age and large numbers of Muslims<br />
(up to 7.5 million annually) perform Hajj and<br />
Umrah rituals there. Therefore, the planning<br />
and organization of services for pilgrims is an<br />
important priority for Saudi officials.<br />
The combined resident population of these<br />
two large cities (Mecca had 1.48 million people<br />
and Medina had 1.10 million inhabitants in<br />
2010) is currently growing by about 3 per cent<br />
annually. Together they account for about 10<br />
per cent of Saudi <strong>Arab</strong>ia’s 2010 population of<br />
26.3 million.<br />
As in other urban areas of Saudi <strong>Arab</strong>ia,<br />
the Holy <strong>Cities</strong> are in administrative and<br />
management terms provided for by the 1938<br />
Statute for the Capital and Municipalities -<br />
the Kingdom’s first autonomous municipal<br />
statute. This empowers municipalities to<br />
perform planning and urban management<br />
and manage all urban facilities and functions,<br />
including public health, building codes and city<br />
beautification.<br />
In 1992, the Law of Provinces was<br />
promulgated to improve provincial<br />
administrative standards and development<br />
through local authorities. It also aimed at<br />
maintaining law and order while guaranteeing<br />
citizens’ rights and freedoms within the<br />
framework of Shari’a. The core priorities of<br />
this 1992 law, however, focus on regional and<br />
urban development through provincial and<br />
local level decentralization of managing local<br />
change and development meeting the needs of<br />
the population and utilizing local resources and<br />
assets. This has required the establishment of<br />
a highly-coordinated partnership under the<br />
9th Five-Year Development Plan that includes<br />
the formulation of development indicators at<br />
the level of provinces, governorates and subgovernorates<br />
to be used in the re-classification<br />
of provinces and in disparity management<br />
between and within provinces.<br />
In 2004, the ‘Development Commission<br />
of Mecca, Medina and the Holy Sites’ was<br />
established to develop comprehensive plans<br />
for these areas in addition to its supervisory<br />
mandate for all other development issues. A<br />
Higher Committee for Hajj was established,<br />
presided by H.R.H. the Crown Prince, Minister<br />
of the Interior and with membership of all<br />
relevant departments and bodies involved<br />
in Hajj-related procedures and legislation<br />
to ensure pilgrims’ safety and convenience<br />
in all stages of their journey to Mecca and<br />
Medina.<br />
The Municipalities of Holy Mecca<br />
and Medina have also established urban<br />
observatories, including pilgrim-related<br />
observatories (Hajj Observatory), which<br />
collect Habitat Agenda indicators and<br />
local indicators (special indicators for Hajj<br />
activities) to monitor services and facility<br />
delivery and that serve as tools for decision<br />
making and policy formation. During the past<br />
five years, in cooperation with development<br />
partners, civil society and the private<br />
sector in both cities, a number of urban life<br />
indicators have been developed to monitor<br />
urban performance - especially during Hajj<br />
and Umrah seasons in both cities - as well as<br />
seasonal crisis management indicators.<br />
The Holy Mecca and Medina Observatories<br />
produce 85 indicators and 107 indicators,<br />
respectively. They aim at enhancing urban<br />
development and services delivery in the Holy<br />
<strong>Cities</strong> through seasonal city indicators during<br />
the Hajj and Umrah seasons of the Greater<br />
and Lesser Pilgrimage. They also serve to<br />
assess progress in the achievement of local<br />
goals and the Millennium Development<br />
Goals for the creation of developmentconducive<br />
environments that include all<br />
aspects of development. These indicators<br />
are incorporated into municipal projects,<br />
including those related to urban studies and<br />
research.<br />
Through performance monitoring and<br />
evaluation, challenges are being addressed,<br />
such as those pertaining to the built<br />
environment, infrastructure and services<br />
delivery, besides addressing economic<br />
challenges like unemployment and<br />
Saudization of the private sector.<br />
Finally, the achievements of the urban<br />
observatories in both cities under the<br />
governance of the administrative boards -<br />
presided by the Mayors of each province<br />
and with membership of governmental<br />
department directors and representatives<br />
from civil society and the private sector -<br />
illustrates how the constraints and challenges<br />
of balanced and sustainable urban growth<br />
are being addressed and how societies are<br />
created that are based on equity, justice and<br />
partnership to achieve sound performance of<br />
integrated urban governance systems.
local development and infrastructure programmes that are<br />
implemented by the central government. 246<br />
For the first time, both men and women were able to vote<br />
and stand for municipal elections. The Permanent Population<br />
Committee aims to promote decentralization and greater<br />
popular participation in local urban management. 247<br />
At the national level, the 2003 constitution, approved by<br />
referendum, continues to allow the emir to appoint the prime<br />
minister, the cabinet and most judges; however, for the first<br />
time, the shura will comprise 30 elected and 15 appointed<br />
members. To date, no elections for the shura have been held<br />
and the 35-member council is still appointed by the emir,<br />
although a 2008 draft law on the issue was approved. Political<br />
parties are not permitted.<br />
Bahrain is divided into 12 municipalities with limited<br />
autonomy. Most services and programmes are implemented by<br />
the Ministry of Interior’s Municipal Central Authority and the<br />
Ministry of Housing, Municipalities and the Environment.<br />
Following his ascension to power in 1999, H.R.H. Hamad<br />
bin Isa al Khalifa decreed some reforms including dismissing<br />
controversial state security laws, releasing all political prisoners,<br />
giving women the right to vote and holding parliamentary<br />
elections. In 2002, he created elected municipal councils in<br />
Bahrain’s five governorates. The councils are composed of<br />
10 elected members who appoint and supervise a general<br />
municipal director. 248 They are responsible for acting on<br />
behalf of the executive authority and implementing national<br />
policy within the governorates. 249 However, urban policy<br />
continues to be developed at the national level. 250 Political<br />
parties are not allowed but political associations may form,<br />
although these may be disbanded.<br />
In Bahrain’s 2030 Vision, the country aims to reduce the<br />
scale and cost of its government administration through<br />
selected out-sourcing, enhanced regulation and transparency,<br />
expanded infrastructure, and a policy framework that moves<br />
the country away from oil dependence. 251<br />
Bahrain’s Shia population (65-75 per cent) is high<br />
compared to those in Oman (5-10 per cent), Qatar (10 per<br />
cent), UAE (10 per cent), Saudi <strong>Arab</strong>ia (10-15 per cent)<br />
and Kuwait (20-25 per cent). Despite constituting the<br />
majority of the population, they hold only 14 per cent of<br />
senior government positions. 252 In the workplace, they tend<br />
to occupy lower-skilled positions. Older neighbourhoods in<br />
and near Manama house a predominantly Shia population. 253<br />
Their discontent and feeling of discrimination led to violent<br />
riots in the spring of 2011.<br />
In the UAE, a federation of seven emirates, each state is<br />
responsible for urban planning and municipal management<br />
within its jurisdiction, although some of the smaller and less<br />
developed emirates have surrendered some functions to the<br />
central government. 254<br />
The two largest emirates, Abu Dhabi and Dubai, each<br />
have government structures that parallel those of the federal<br />
government’s consultative council and public administration.<br />
Abu Dhabi has two municipalities, each headed by an<br />
appointed municipal council, responsible for public works,<br />
finance, the provision of water and electricity, and customs. 255<br />
In recent years, these cities have launched e-government<br />
and technology upgrade initiatives to modernize municipal<br />
administration. By strengthening the capacity of local<br />
government, they hope to increase municipal decentralization.<br />
In 2010 the, Dubai local government and executive<br />
council launched the Dubai Model for Government Service<br />
Delivery to improve the government’s operational efficiency<br />
and customer satisfaction. The programme will provide<br />
information on indicators of government performance, with<br />
the eventual aim of inter-agency benchmarking. In 2006,<br />
as part of reforms to make the federal government more<br />
responsive and accountable to the states, the UAE held its first<br />
elections for 20 out of the 40 seats of the Federal National<br />
Council, which comprises a fixed number of representatives<br />
from each of the states. 256<br />
Local Government Finance<br />
In all GCC countries oil revenues finance central<br />
government transfers to local governments. In Saudi <strong>Arab</strong>ia,<br />
cities may only collect fees for advertising, building permits<br />
and annual business registrations. The level of the fees is<br />
established by the national government and collected by the<br />
Ministry of Finance, which then returns the funds back to the<br />
cities where they were collected. 257<br />
In the UAE, customs duties and oil revenues account for<br />
each emirate’s revenues. By law, they must transfer half of the<br />
revenues to the federal coffers but in practice only Abu Dhabi<br />
and Dubai do so, albeit at less than the required 50 per cent. 258<br />
Gulf cities do not pay for capital investments or their operating<br />
costs and are not held accountable for their development<br />
decisions, resulting in wasteful land consumption patterns,<br />
excessive urban sprawl and an increasing reliance on private<br />
cars for transport.<br />
The Role of Civil Society<br />
Civil society organizations (CSOs) are legally permitted<br />
throughout the GCC and a number have developed around<br />
cultural, sports, social service and environmental issues.<br />
In all countries, private organizations must register with<br />
the Ministry of Labour and Social Affairs or the Ministry<br />
of Social Development. In the UAE, they must also be<br />
licensed by the local authorities, and in Oman they must<br />
be approved by the Council of Ministers. In Kuwait, the<br />
ministry responsible for CSO registrations has not approved<br />
new organizations for many years and had 149 applications<br />
pending as of 2009. 259<br />
Semi-official organizations address sensitive issues. The<br />
Emirates Human Rights Association in UAE 260 , the National<br />
Human Rights Committee in Qatar and Saudi <strong>Arab</strong>ia’s<br />
National Organization for Human Rights, whose chairman<br />
and executive committee also sit on the shura. The government<br />
of Oman established the Oman Women’s Association<br />
in 1970, which now has 38 chapters and an estimated<br />
163
164<br />
membership of 3,000 women. Migrant worker associations<br />
are a sensitive topic; Qatar prohibits any private society from<br />
having a proportion of non-citizens exceeding 20 per cent of<br />
its membership. 261 In all countries, civil society organizations<br />
avoid prohibited political activism in their work.<br />
Among the Gulf States, Bahrain may have the most<br />
developed civil society, with over 500 organizations. Many are<br />
sports-related or inactive and the remainder are classified as<br />
professional, women’s rights, youth, human rights, and topical<br />
groups (such as environmental organizations, for example).<br />
On the whole, they have had a positive impact on governance<br />
and women’s groups have led demonstrations to promote their<br />
rights. The 1989 Societies Law, prohibits political activity, and<br />
a number of organizations are not registered because they did<br />
not apply, were denied registration or had their registrations<br />
revoked. 262 CSOs are also prohibited from accepting foreign<br />
funds, which has restricted their growth.<br />
Saudi <strong>Arab</strong>ia imposes restrictive policies on civil society<br />
dealing with politically sensitive or divisive issues, reflecting<br />
the strong adherence to conservative precepts held by a large<br />
segment of the population. 263 Instead, the government levies<br />
a 2.5 per cent tax on income (zakat) and uses the funds to<br />
support permitted charities.<br />
In Qatar, civil society initiatives such as Sustainable Qatar,<br />
Qatar Green Building Council, Green Doha and Friends<br />
of the Environment Society work to raise awareness on<br />
environmental issues. Most, if not all, of these initiatives<br />
were established and are sustained by expatriates. Local<br />
participation remains limited and its increase should be<br />
considered a key goal for such organizations.<br />
Women in Politics and Governance<br />
On the whole, attitudes towards women are more<br />
conservative in the GCC than in the Mashreq and Maghreb,<br />
with their labour participation lagging far behind that of men.<br />
However, the number of women with a higher education<br />
degree, working as civil servants and gaining senior positions<br />
in government is quickly rising, with some countries adopting<br />
a policy to increase women’s participation in the workforce<br />
as a way to diversify and strengthen the economy. 264 Women<br />
appointees to senior government positions tend to be well<br />
educated, often with higher education than in the West; many<br />
are also related to the ruling families and married to men<br />
of power. Despite gains in the workplace and government,<br />
gender equality is not yet achieved.<br />
Outside of Saudi <strong>Arab</strong>ia, the only <strong>Arab</strong> state to practice<br />
conservative Wahabism, women have made important gains<br />
in politics. Qatar became the first country in the GCC to<br />
allow both men and women to run for municipal elections in<br />
1999, and in 2003 Sheikha al-Jufairi became the first woman<br />
to win a municipal seat in the Gulf.<br />
In Bahrain, ten women were appointed to the 40-member<br />
Consultative Council in 2006. One woman, running<br />
unopposed, was elected to the Council of Representatives the<br />
same year, 265 and one was elected to the municipal council of<br />
Muharraq in 2010, the first woman to do so in Bahrain. 266<br />
In the UAE, women comprise 20 per cent of the diplomatic<br />
corps, 20 per cent of the Federal National Council and 66<br />
per cent of government workers; the country appointed four<br />
women ministers to the cabinet and its first woman judge in<br />
2008. It is allowing women to have a presence in the military.<br />
In 2000, the sultan of Oman appointed five women to<br />
the State Council and increased it to eight in 2003. In 2004,<br />
he appointed the country’s first woman minister for higher<br />
education. Women hold around one-third of all civil service<br />
posts, and they fill two out of 83 seats on Oman’s Consultative<br />
Council. 267<br />
In Saudi <strong>Arab</strong>ia, practices constraining women’s ability to<br />
participate in society have been changing slowly over time:<br />
King Faisal established the first school for girls in 1961 (as<br />
compared with Egypt, which established its first girls school<br />
in 1873) and women-only shopping malls, banks, offices,<br />
colleges and businesses have been created. However, the<br />
burden of segregated workplaces makes it difficult for most<br />
businesses to employ women, and male migrant workers fill<br />
many posts that are traditionally taken by women in other<br />
<strong>Arab</strong> countries. 268<br />
A 2009 cabinet reorganization led to the appointment of<br />
the first female cabinet member as the Deputy Minister for<br />
Girls’ Education. 269 The level of conservatism varies across<br />
the country from Mecca, Medina and Riyadh, where these<br />
practices are strictly observed, to cosmopolitan cities like<br />
Jeddah, where they are more relaxed.<br />
<br />
The Emiri Diwan or Emir’s Palace, Doha, Qatar. Qatar has implemented a series of reforms<br />
including giving women the right to vote in, and stand for municipal elections.<br />
©Paul Cowan/Shutterstock
4.7<br />
Migration and Remittances<br />
<br />
Construction workers on a new skyscraper in Doha, Qatar. ©Jason Larkin/Panos Pictures<br />
Migrant Workforce in the GCC<br />
Since the discovery of oil, the GCC has drawn increasing<br />
numbers of migrant workers. From 1975 to 2005, the<br />
number of migrants rose from 1 million to 12.7 million,<br />
while the total population increased almost fivefold, from 7.8<br />
million to 34 million. 270 <strong>Arab</strong>s comprised three-quarters of<br />
migrant workers in the GCC in 1975 but GCC countries<br />
began to import labour from outside the region, mainly<br />
South and Southeast Asia, after the Gulf War of 1990. This<br />
was due in part to rising wages for <strong>Arab</strong> workers.<br />
Today, only about one-quarter of the 15 million migrant<br />
workers in the GCC are <strong>Arab</strong>s, 271 including 1.5 million<br />
Egyptians, 900,000 Yemenis, 500,000 Palestinians and<br />
Jordanians and 300,000 Sudanese. 272 The remaining migrants<br />
include a mix of well-paid expatriates from the advanced<br />
economies and low-paid kafala or sponsored workers. China,<br />
Ethiopia and other African countries are also beginning<br />
to send workers. In Qatar, which has the highest ratio of<br />
migrant workers to nationals in the world, the number of<br />
migrant workers increased at an average annual rate of 12 per<br />
cent between 2005 and 2010. 273<br />
Although labour importation is a global phenomenon, its<br />
magnitude in the GCC is unique. In 2010, in Qatar, the UAE<br />
and Kuwait, 87, 70 and 69 per cent of the population was<br />
composed of expatriates. 274 In Bahrain, and Oman, 39 and<br />
28 per cent of the population is foreign born. 275 In Saudi<br />
<strong>Arab</strong>ia, foreigners account for 28 per cent of the population<br />
and 67 per cent of the overall workforce and hold 90 to 95<br />
per cent of private sector jobs. 276 In Riyadh, migrant workers<br />
comprise 52 per cent of a 3.6 million labour force. 277 In<br />
Kuwait, foreigners comprise 69 per cent of the workforce,<br />
respectively. 278 Migrant workers are predominantly male and<br />
in Kuwait, the ratio of female to male workers is 1 to1.9 and<br />
in Saudi <strong>Arab</strong>ia 1 to 2.2. 279,280<br />
FIGURE 48: NUMBER OF MIGRANTS IN GCC COUNTRIES IN 2000, 2005 AND<br />
2010 (IN THOUSANDS)<br />
Saudi <strong>Arab</strong>ia<br />
UAE<br />
Kuwait<br />
Qatar<br />
Oman<br />
Bahrain<br />
Source: UN DESA, 2009 as cited in IOM World Migration Report 2010<br />
2010<br />
2005<br />
2000<br />
0 1,000 2,000 3,000 4,000 5,000 6,000 7,000 8,000<br />
Stock of migrants (thousands)<br />
165
166<br />
In Kuwait, an estimated 550,000 to 660,000 women<br />
work in domestic services, giving the country a ratio of one<br />
domestic worker per two nationals, the highest proportion in<br />
the Middle East. 281 Male migrant workers tend to work in the<br />
construction industry, where they hold 95 per cent of jobs. 282<br />
The burst of the real estate bubble in 2008 caused the<br />
cancellation or delay of numerous projects with resulting<br />
impacts on migrant construction workers. In Dubai alone,<br />
tens of thousands of workers lost their jobs and in 2010<br />
hundreds of workers remained stranded in labour camps,<br />
many of whom claim that they have not been paid and are<br />
unable to return home. 283<br />
Living Conditions among Sponsored Migrant<br />
Workers<br />
Most migrant workers come to the GCC through the<br />
sponsorship system, often with deceptive promises of high<br />
salaries that will rapidly pay back the brokerage fee. Labourcontracting<br />
companies that are awarded service contracts in<br />
the GCC countries import migrant workers from their home<br />
countries and are responsible for their housing and wellbeing.<br />
Immigration and sponsorship laws give employers<br />
broad power over their workers, many of whom are illiterate<br />
and have no social or legal protections in the host countries.<br />
The running of the kafala system has come under scrutiny<br />
to ascertain whether its safeguards of worker conditions<br />
were fairly enforced. The lack of public oversight of workers’<br />
conditions has drawn international criticism, recurring riots<br />
among the workers themselves and growing opposition<br />
within the GCC governments.<br />
Sponsored workers live in labourer housing, low-cost units<br />
in dilapidated buildings in the older parts of cities or, in the<br />
case of domestic workers, with employers. Many of Bahrain’s<br />
labourers’ camps are unlicensed and tend to be made of nondurable<br />
materials. Deadly fires are common. 284<br />
In 2008, Human Rights Watch found 40 per cent of the<br />
UAE’s 1,033 labourers’ camps were in violation of health and<br />
fire safety regulations. 285 Sonapur, a labourers’ camp located<br />
in the desert between Dubai and Sharjah, houses as many as<br />
500,000 workers from India and Pakistan. Workers share a<br />
single room with up to 14 other people and sleep in shifts. 286<br />
When living in shops or employers’ homes, workers are often<br />
given cramped or degrading living quarters. 287<br />
Residential areas for migrant workers are segregated<br />
throughout the GCC. 288 In Bahrain, legislators have tried<br />
to prevent landlords in local residential areas from renting to<br />
non-Bahrainis. 289<br />
A common government response throughout the GCC<br />
countries to criticism over migration workers’ living<br />
conditions has been to re-house workers in new “labour<br />
towns”, “bachelorvilles” or similar arrangements.<br />
As part of its Labour and Human Resources Policy, Abu<br />
Dhabi plans to build low-cost worker housing, located close<br />
to workplaces where possible and which satisfies or exceeds<br />
international standards for living area, hygiene, safety and<br />
leisure facilities, with a maximum of 10,000 residents per<br />
settlement to avoid creating ghettos. 290 Qatar’s government<br />
aimed to build a worker city of 50,000 near Doha, but put<br />
the project on hold in 2009. 291 The Southern Municipal<br />
Council of Bahrain announced plans in 2010 to build a<br />
labour town that would accommodate workers from 100<br />
camps in the area, with other municipal councils planning<br />
similar projects.<br />
The motivation behind these initiatives is as much to<br />
improve workforce living conditions as to protect nationals<br />
from the perceived social problems of migrant workers.<br />
This spatial and, therefore, social segregation, however, is<br />
not a desirable option as it leads to fragmented cities with<br />
concentrated areas of poverty, crime and other mutually<br />
reinforcing societal ills.<br />
Workforce Reforms in the GCC<br />
The issue of migrant labour in the GCC is highly complex<br />
and reveals the ambivalent attitude towards reform in<br />
countries that are both deeply suspicious of and highly<br />
dependent upon their migrant labour population. All GCC<br />
countries are concerned about the national security threat<br />
of having such large populations of foreigners within their<br />
borders. To deter migrants from staying, GCC countries<br />
have established strict residency permit requirements, set<br />
high standards for granting citizenship, adopted tougher<br />
recruitment policies and deported surplus workers. Through<br />
formal and subtle ways, the GCC states prevent migrants at<br />
all income levels from integrating into national society.<br />
Continued dependence on migrant labour presents a<br />
significant challenge for governments as they try to reduce<br />
both local unemployment and subsidies, either in the form<br />
of government jobs or unemployment benefits. For decades,<br />
the public sector has absorbed nationals who could not<br />
obtain jobs in the private sector and efforts to “nationalize”<br />
jobs have had limited success. In Kuwait, for instance, 77<br />
per cent of the 350,000 employed nationals work in the<br />
public sector. 292<br />
With oil revenues projected to gradually decline, while the<br />
number of educated young nationals entering the workforce<br />
increases rapidly, GCC governments are reviving efforts to<br />
change the structure of the workforce. In Saudi <strong>Arab</strong>ia, for<br />
instance, the 9 th Development Plan (2010-2014) aims at<br />
a Saudization rate of 54 per cent, up from 48 per cent in<br />
2009. This necessitates the creation of 1.1 million new jobs<br />
for Saudis. 293<br />
The experience from similar efforts in the 1990s, when<br />
GCC countries faced budget deficits and high unemployment<br />
rates, shows that these policies are difficult to implement. A<br />
decade of workforce Omanization from 1988 to 1999, for<br />
instance, led to nationals holding over 86 per cent of jobs in<br />
government, far exceeding the 72 per cent target. 294 In the<br />
private sector, however, nationals made gains only in minor<br />
industries that, at the time, comprised only 8 per cent of the<br />
private sector workforce.
One of the reasons that the effort failed was because the<br />
social guarantees available to nationals did not incentivize<br />
productivity. Private companies remain reluctant to employ<br />
nationals, who often lack the technical skills and vocational<br />
expertise.<br />
The region’s various economic plans aim to diversify the<br />
economy and reform education to target skilled graduates<br />
who can fill local positions. Bahrain’s Economic Vision<br />
2030 hopes that by 2030, “businesses in Bahrain will have<br />
caught up with the world’s leaders in productivity. Our<br />
private sector will no longer equate competitiveness with<br />
low-cost expatriate labour, but instead will create productive,<br />
high-wage employment for Bahrainis. The Government will<br />
ensure that economic growth benefits all Bahrainis fairly by<br />
creating a level playing field in the job market for Bahrainis<br />
through immigration reform and the revision of labour<br />
laws.” 295<br />
The GCC’s Ministers of Labour have also proposed quota<br />
systems to cap the number of foreign workers, citing both<br />
security concerns and the local employment issue. 296 For<br />
the foreseeable future, however, while nationals may replace<br />
highly skilled and highly paid expatriates, the countries will<br />
continue to import workers in the construction and domestic<br />
services sectors.<br />
Under international and domestic pressure, GCC<br />
governments are beginning to address migrant labour<br />
conditions. In 2009, Bahrain instituted Decree 79, the first<br />
policy in the region to end the absolute power of sponsors<br />
over workers by allowing migrants to change employment<br />
without the consent of their sponsor. 297 A major detraction<br />
of the law is its exclusion of workers in the domestic sector,<br />
where female workers are particularly vulnerable. 298<br />
Without ending the sponsorship system, Kuwait’s 2009<br />
New Labour Law establishes protection of workers’ annual<br />
leave, end of service indemnities, raises the minimum wage<br />
and sets tougher penalties for people who trade in visas,<br />
recruit workers without providing jobs or fail to pay regular<br />
wages. The government also established an independent<br />
labour authority and a shelter for abused workers.<br />
In 2007, the UAE introduced a standard migrant worker<br />
contract 299 and, in 2009, implemented a mandatory<br />
electronic Wage Protection System, increased inspections<br />
on violations of daytime breaks and continued housing<br />
conditions inspections. 300 The Qatar government is<br />
considering requiring employers to submit monthly bulletins<br />
demonstrating their wage payments to increase financial<br />
protections for migrant workers. 301 In 2011, the government<br />
proposed a law establishing the rights and responsibilities<br />
of domestic workers. 302 Although Saudi <strong>Arab</strong>ia reinforced<br />
existing protections in the Labour Code in 2009, it did not<br />
make further reforms. 303<br />
Refugees and Stateless Persons<br />
Most refugees in the GCC are concentrated in Kuwait and<br />
Saudi <strong>Arab</strong>ia. As of 2008, Kuwait hosted 38,100 refugees<br />
and Saudi <strong>Arab</strong>ia 240,800, compared to fewer than 200<br />
in the other GCC countries. 304 The Saudi border serves as<br />
a major transit point for refugees from the Horn of Africa.<br />
Despite calls by UNHCR for countries to host refugees<br />
from Somalia, 305 Saudi agencies continue to deport refugees<br />
mostly from Somalia and Ethiopia, to Haradh, a border<br />
town in Yemen, where an unknown number of people have<br />
been left stranded. 306 Oman has apprehended and deported<br />
hundreds of Somali, Yemeni, Ethiopian, Eritrean, Afghan<br />
and Pakistani refugees. 307<br />
The Gulf region has a more significant challenge managing<br />
stateless persons, also known as bidoon or bidoon junsiya, a<br />
term meaning “without” in <strong>Arab</strong>ic that is used in the region<br />
to indicate their lack of citizenship. They are long-term<br />
residents in the Gulf who, for various reasons, have been<br />
denied citizenship. Many have been born in a GCC country,<br />
some for many generations, and continue to lack citizenship.<br />
Their origins vary.<br />
In Kuwait and Saudi <strong>Arab</strong>ia, most were of Bedouin origin<br />
and, either not understanding the concept of statehood<br />
or being illiterate, lack the documents needed to prove<br />
citizenship. In Bahrain, most are Shia of Iranian origin; in<br />
other GCC countries, they are from the Baluch region, West<br />
Africa and the Comoros.<br />
Statistics on their numbers are uncertain, with an<br />
estimated 80,000 to 140,000 in Kuwait 308 , 100,000 in the<br />
UAE 309 and 70,000 to 100,000 in Saudi <strong>Arab</strong>ia. 310 As noncitizens,<br />
they lack access to healthcare and education, 311 are<br />
barred from public positions (including the military and<br />
police) and prevented from owning property or opening<br />
businesses, forcing some into illegal activities. 312 In Bahrain,<br />
the government has reportedly naturalized around 68,000<br />
bidoon since 2002. 313<br />
Remittances<br />
Due to the number of migrant workers, the Gulf has<br />
become one of the top remitting regions in the world. 314 In<br />
2009, remittances equalling 7 per cent of GDP were sent<br />
from Bahrain, Kuwait, and Saudi <strong>Arab</strong>ia and remittances<br />
equalling 11 per cent of GDP were sent from Oman. 315 In<br />
2008, the remittance outflows of Bahrain, Kuwait and Saudi<br />
<strong>Arab</strong>ia as a percentage of GDP were ranked as the world’s<br />
fourth, ninth and 12 th highest. 316 In Qatar, the value of<br />
remittances rose from QAR 5 billion (USD 1.4 billion) in<br />
2001 to QAR 19 billion (USD 5.2 billion) in 2008, growing<br />
on average 19.5 per cent annually. 317<br />
With such large percentages of national income leaving<br />
the country, the GCC countries feel certain negative impacts<br />
on their economy. Large remittance outflows can distort the<br />
exchange rate and place pressure on foreign reserves; weaken<br />
fiscal policy and government spending multiplier effects;<br />
exert pressure on monetary policy; disrupt the business<br />
cycles through lack of local reinvestment and spending and<br />
foster black market activities such as the potential for money<br />
laundering through the Hawala system. 318<br />
167
168<br />
4.8<br />
Regional Corridors And Cooperation<br />
<br />
The 25 km King Fahd Causeway linking Saudi <strong>Arab</strong>ia to Bahrain. ©Mohamed Ghuloom. Licensed under the Creative Commons Attribution 3.0 Unported license.<br />
The GCC countries all compete with each other in<br />
finance, transport and energy development. 319 There<br />
is little planning at the regional level and each of<br />
the GCC countries has plans to transform key cities into<br />
world-class destinations. For instance, Bahrain, Dubai and<br />
Doha are existing regional centres for international finance,<br />
an area that Saudi <strong>Arab</strong>ia’s King Abdullah Financial City<br />
in Riyadh, which will house the GCC Monetary Fund, is<br />
trying to enter. 320 It will become increasingly necessary for<br />
the Council to help cities in the region develop competitive<br />
and differentiated sectors.<br />
Regional <strong>Cities</strong> and Urban Corridors<br />
As cities in the Gulf grow, they are beginning to form<br />
larger urban agglomerations and corridors. On the <strong>Arab</strong>ian<br />
Gulf, the most prominent urban corridor stretches from<br />
Abu Dhabi to Sharjah, and encompasses over 3.6 million<br />
residents. It contains Abu Dhabi, Dubai, Ajman, Sharjah, the<br />
Jebel Ali Free Trade Zone, which has over 200 factories and<br />
the largest container port between Rotterdam and Singapore,<br />
and several other ports.<br />
An Extended Metropolitan Region is also emerging between<br />
Dammam and Manama. The 25 km King Fahd Causeway,<br />
completed in 1986, allows an average of nearly 50,000 people<br />
to travel between the two cities daily. In 2010, Saudi <strong>Arab</strong>ia<br />
announced an expansion of the causeway to include more<br />
lanes, as well as a commercial centre in Bahrain. A planned<br />
Friendship Bridge will connect Doha with Manama. If<br />
completed, this would be the longest causeway in the world.<br />
Kuwait’s National Planning Strategy calls for a new<br />
port at Bubiyan and road networks to connect with other<br />
countries. 321 The Kuwait International Master Plan is also<br />
driven by the objective of developing a competitive financial<br />
and commercial centre in the region. 322<br />
As the numbers of pilgrims grew to almost 3 million<br />
annually for the hajj, Jeddah and Mecca have now formed an<br />
urban agglomeration, which could extend along the corridor<br />
to Medina following the establishment of the Haramain<br />
Railway, which will connect the two holy cities to Jeddah.
FIGURE 49: THE GULF PENINSULA’S EASTERN COAST AT NIGHT<br />
Source: NASA, via Google.<br />
FIGURE 50: THE GULF PENINSULA’S RED SEA COAST AT NIGHT<br />
Source: NASA, via Google.<br />
<br />
<br />
<br />
<br />
Red Sea<br />
<strong>Arab</strong>ian Gulf<br />
<br />
<br />
<br />
<br />
<br />
<br />
<br />
Asir Mountains<br />
<br />
Qushm Island<br />
<br />
Gulf of Oman<br />
<br />
<br />
169
170<br />
<br />
The E11 or Sheikh Zayed Road, Dubai. The longest road in the UAE, the E11 stretches from Al Silah in the Emirate of Abu Dhabi and ends in the Emirate of Ras Al Khaimah at the Oman border.<br />
©clearandtransparent/iStockphoto<br />
Regional Integration<br />
Given the similarities in their economies, history and social<br />
characteristics, the six Gulf countries established the Gulf<br />
Cooperative Council to strengthen their national security and<br />
promote regional economic development and integration.<br />
Since it was created in 1981, the GCC has sought to unify<br />
regulations in economy, finance, trade and customs, jointly<br />
promote research and development, build a single military<br />
presence known as the Peninsula Shield Force and create a<br />
common currency.<br />
Today, the GCC is the most integrated sub-region in the<br />
<strong>Arab</strong> world in terms of trade and capital mobility 323 and<br />
its Common Market allows its citizens to work, live, and<br />
receive social services and benefits equally in any of the GCC<br />
countries. They have also connected their electricity grids to<br />
share reserve capacity and improve reliability. 324 This network<br />
is critical as the region is developing renewable resources such<br />
as nuclear, solar and wind.<br />
Some efforts at integration have been less successful.<br />
In 2003, the GCC countries signed a Customs Union<br />
Agreement to remove internal trade restrictions, waive tariffs<br />
for goods that originated from within the GCC and establish<br />
low tariffs for products from countries outside the GCC. 325<br />
Implementation of this agreement is pending. 326 There<br />
have been plans for a decade to launch a common currency,<br />
the Khaleeji. If approved, it would be the most important<br />
supranational currency after the Euro.
BOX 23: ARAB GULF STATES COOPERATION REGIONAL INTEGRATION<br />
In December 2011, the leaders of a Gulf<br />
Cooperation Council (GCC) summit agreed in<br />
principle to the Saudi proposal to move from<br />
cooperation to form a union. This proposal<br />
resulted from more than three decades of<br />
cooperation and integration.<br />
The GCC (Saudi <strong>Arab</strong>ia, Kuwait, Bahrain,<br />
Qatar, United <strong>Arab</strong> Emirates, and Oman)<br />
economies can benefit from integration. Hit<br />
by the financial crisis, they recovered fast as<br />
oil demand rebounded and the financial sector<br />
stabilized. A solid economic base is very<br />
crucial for integration and union formation and<br />
in 2010 economic growth for the GCC was<br />
4.2% and reached 5% in 2011.<br />
The path to integration and further union<br />
establishment started in 1981 when the<br />
members ratified a charter that called for the<br />
establishment for the cooperation council<br />
for the <strong>Arab</strong> Gulf States. The overall charter<br />
stipulates that the GCC is a political, economic<br />
and regional organization. The GCC countries<br />
have joint security concerns given the<br />
instability in the region.<br />
All countries are, in some way, monarchies<br />
with varying levels of democracy. All<br />
countries enjoy cultural similarities. The GCC<br />
has coordinated a number of efforts towards<br />
integration, which can lead in the future<br />
to establishing a union. This will run from<br />
joint economic and financial policies to free<br />
trade, regional urban planning, cross-border<br />
infrastructure transport development and free<br />
movement of citizens and residents.<br />
The decrees of the GCC Supreme Council,<br />
its directives, reflected the importance of<br />
economic and commercial exchange, as<br />
well as smooth flow of commodities, goods<br />
and people across borders, resulting in the<br />
customs union, the common Gulf market,<br />
the economic union. The countries adopt a<br />
developmental integration approach with<br />
projects on transportation, communication and<br />
infrastructure and finally the development of<br />
human resources and cooperation in the field<br />
of scientific and technical research.<br />
The council ensures equal treatment of all<br />
GCC citizens in all economic fields, including<br />
transportation, work in the public and<br />
private sectors, social insurance, retirement,<br />
practicing professions, practicing economic<br />
service and investment activities, ownership<br />
of real estates, transfer of capitals, tax<br />
treatment, trade in and purchasing of stocks,<br />
establishing companies, education, health<br />
and social services.<br />
This has a positive impact on city<br />
developments in Gulf countries with further<br />
development of mega infrastructure projects<br />
that eases the flow of people, goods and<br />
services. The GCC light rail, metro and regional<br />
roads and cross-border transportation arteries<br />
facilitated integration process.<br />
Furthermore, the GCC is working towards<br />
a regional urban planning strategy by which<br />
it can develop areas along transport corridors<br />
between cities of Kuwait-Saudi <strong>Arab</strong>ia (Al-<br />
Nowaiseb-Alkhafji and Al-Salimi – Hafr elbaten),<br />
Bahrain-Saudi <strong>Arab</strong>ia cities (Manama<br />
–Dammam – Ihsaa) and to establish a sea<br />
link between Qatar and Saudi <strong>Arab</strong>ian cities<br />
(Doha – Al-Ihsa link). Such programmes<br />
will help in boosting development in border<br />
areas in the countries and enhance the<br />
productivity of citizens living in these areas<br />
and attract investment and development<br />
towards a number of joint border cities in<br />
GCC countries.<br />
KUWAIT – SAUDI ARABIA DEVELOPMENT CORRIDOR QATAR – SAUDI ARABIA POTENTIAL DEVELOPMENT CORRIDOR<br />
IRAQ<br />
Hafr<br />
el-baten<br />
Al Salimi<br />
Safwan<br />
KUWAIT<br />
SAUDI<br />
ARABIA<br />
Umm<br />
Qasr<br />
Al Jahra<br />
IRAQ<br />
Al Fintas<br />
IRAN<br />
<strong>Arab</strong>ian<br />
Gulf<br />
Kuwait City<br />
Al-<br />
Nuwaiseb<br />
Khafji<br />
Al Ihsa<br />
SAUDI<br />
ARABIA<br />
BAHRAIN<br />
Manama<br />
QATAR<br />
Doha<br />
171
172<br />
BOX 24: QATAR-BAHRAIN CAUSEWAY: AN EMERGING URBAN CORRIDOR<br />
King Fahd Causeway<br />
SAUDI<br />
ARABIA<br />
25km<br />
Manama<br />
BAHRAIN<br />
<strong>Arab</strong>ian<br />
Gulf<br />
QATAR<br />
Doha<br />
In 1986, Saudi <strong>Arab</strong>ia and Bahrain officially<br />
inaugurated the 25 km King Fahd Causeway. To<br />
capitalize on its success as an emerging urban<br />
development corridor, Qatar and Bahrain, in<br />
early 2005, decided to extend this physical<br />
connectivity pattern with a causeway between<br />
Bahrain and Qatar. The Qatar Bahrain Friendship<br />
Causeway (QBFC) will be one of the world’s<br />
longest overwater traffic links and serve and<br />
extend the King Fahd Causeway between<br />
Bahrain and Saudi <strong>Arab</strong>ia. It will take some four<br />
years to build and provide rail and multilane<br />
road connections, commercially linking the<br />
entire region through the free movement of<br />
people and freight.<br />
It will also be the affirmation of a new era<br />
in foreign relations between Bahrain and Qatar<br />
in the wake of the resolution of a 60-year-old<br />
territorial dispute over the Hawar group of<br />
islands.<br />
Emerging Transnational Transportation<br />
Corridors<br />
The region possesses a strong network of infrastructure<br />
for road, air and maritime transport, and is planning a USD<br />
25 billion project to create a regional rail system stretching<br />
over 2,100 km from Kuwait at the Iraqi border to Muscat. 327<br />
The system would ultimately connect with railways in<br />
the Mashreq and Maghreb. In addition, Saudi <strong>Arab</strong>ia is<br />
developing a 1,000 km “Landbridge” rail line that would<br />
connect Jeddah, Riyadh and Bahrain. 328 If completed, the<br />
rail corridors would further solidify the eastern coast as an<br />
important extended metropolitan region (EMR).<br />
In June 2006 the agreement on the 40 km<br />
QBFC linking the two countries took shape<br />
with the establishment of the Qatar Bahrain<br />
Causeway Foundation. Construction of the<br />
USD 4 billion causeway was envisaged to start<br />
in early 2009.The 40 km QBFC will consist of<br />
18 km of embankments and 22 km of viaducts<br />
and bridges, including two bridges high enough<br />
to allow freight ships to pass underneath. The<br />
four-lane highway is expected to cut the travel<br />
time by car between Qatar and Bahrain from<br />
four-and-a-half-hours to around 30 minutes.<br />
Apart from strengthening ties between Qatar<br />
and Bahrain and enhancomg cooperation,<br />
as an extension of the King Fahd Causeway<br />
connecting Bahrain and Saudi <strong>Arab</strong>ia, the QBFC<br />
is expected to create a development corridor.<br />
Since this development corridor is not primarily<br />
aiming at connecting the capital cities it will<br />
allow for more diffused spatial developments,<br />
both within Qatar and Bahrain, but it also has<br />
the potential of stimulating various other urban<br />
developments and become a regional urban<br />
development corridor.<br />
An urban development corridor is typically<br />
a ribbon-shaped, populated strip of land<br />
connecting two or more urban areas. If crossing<br />
national boundaries, an urban development<br />
corridor helps in establishing and reinforcing<br />
regional urban connectivity at the international<br />
scale that can strengthen political, economic,<br />
cultural, environmental and social connectivity.<br />
The relation between an urban corridor and<br />
the surrounding land use and development<br />
patterns, however, is crucial. Poor connections<br />
to the surrounding residential neighborhoods<br />
often result in inefficiencies in the corridor’s<br />
connective functions.<br />
Corridor development strategies should<br />
therefore incorporate land use studies, zoning<br />
regulations and design guidelines that support<br />
the strategic objectives. Such a strategy could<br />
support environmentally-sustainable transport<br />
that minimizes impacts on the physical, built<br />
and social environments to provide more<br />
equitably for future generations.<br />
Thriving urban corridors stimulate all types<br />
of development and increase surrounding land<br />
values but, more important, they improve<br />
overall inter-connectivity between cities and<br />
external connectivity with regional centers,<br />
leading to enhanced regional economic<br />
development growth.<br />
Although concentration of development will<br />
continue to take place in the capitals of Qatar<br />
and Bahrain, the QBFR will help introduce a<br />
pattern of spatial development that allows<br />
for new urban centers throughout the two<br />
countries.<br />
The start of construction works, however,<br />
has repeatedly been deferred to allow for<br />
redesign and introduction of new, upgrading<br />
features, including a high-speed rail line<br />
envisioned to eventually be extended to<br />
Muscat in Oman and Istanbul in Turkey,<br />
creating a major new international gateway<br />
that would turn Qatar and Bahrain into ideal<br />
access points for international companies to<br />
develop their business across the GCC.<br />
As of 2011, it was expected that the project<br />
would be completed in 2015 - the year Qatar<br />
is hosting the FIFA World Cup. However, the<br />
media are hinting that there are political<br />
obstacles to the project’s progress but it is<br />
hoped that these will soon be overcome and<br />
that work will commence.<br />
The GCC countries are also members of The United<br />
Nations Economic and Social Commission for Western Asia<br />
(ESCWA) and signed the Agreement on International Roads<br />
in the <strong>Arab</strong> Mashreq in 2001. The network prioritizes an<br />
east-west corridor (the M40) that connects Iraq, Jordan,<br />
Palestine and Egypt, and a north-south corridor (the M45)<br />
that connects Syria, Jordan, Saudi <strong>Arab</strong>ia and Yemen. With<br />
the two road systems 70 per cent complete, UN-ESCWA<br />
and member countries are exploring opportunities to extend<br />
these networks further east into the Maghreb and further<br />
south to reach Djibouti and Somalia.
FIGURE 51: PLANNED REGIONAL GCC RAIL<br />
Buraydah<br />
King Khalid<br />
Military City<br />
Source: Executive Magazine, 2010<br />
IRAQ<br />
RIYADH<br />
Basra<br />
KUWAIT<br />
Al Kharj<br />
KUWAIT CITY<br />
Dammam<br />
Hofuf<br />
SAUDI ARABIA<br />
FIGURE 52: UN-ESCWA PROPOSED ROAD TRANSPORT CORRIDORS<br />
Dakar<br />
Nouakchott<br />
Rabat<br />
Algiers<br />
Tunis<br />
Tripoli<br />
Harad<br />
BAHRAIN<br />
MANAMA<br />
QATAR<br />
IRAN<br />
A r a b i a n G u l f<br />
M40<br />
DOHA DUBAI<br />
ABU DHABI<br />
UNITED ARAB<br />
EMIRATES<br />
EXISTING RAILWAY LINES<br />
SRO Railway Lines 1 & 2<br />
RAILWAY LINES UNDER DESIGN<br />
GCC Railway Project<br />
NSR Railway Project<br />
Landbridge Railway Project<br />
OMAN<br />
FUJEIRAH<br />
OMAN<br />
G u l f o f O m a n<br />
Source: Safwat, N. “Transport Corridors Connecting Africa, Asia and Europe through the <strong>Arab</strong> Region: Priority Corridors and Facilities.” Presentation at the workshop “Impact of Transportation<br />
Networks on Trade and Tourism” held in Izmir, Turkey, on June 7-8, 2011.<br />
Cairo<br />
Damascus<br />
Gaza<br />
Aleppo<br />
Djibouti<br />
Jeddah<br />
Baghdad<br />
M45<br />
Sana’a<br />
Mogadishu<br />
MUSCAT<br />
N<br />
Sur<br />
173
174 GCC Statistical Annex<br />
TABLE 60: TOTAL AND URBAN POPULATION (‘000s) AND PERCENTAGE POPULATION URBAN<br />
1990<br />
Total Population (‘000s)<br />
1995 2000 2005 2010 2015 2020 2025 2030<br />
Bahrain 493 578 650 728 807 882 953 1,021 1,085<br />
Kuwait 2,143 1,725 2,228 2,700 3,051 3,378 3,690 3,988 4,273<br />
Oman 1,843 2,172 2,402 2,618 2,905 3,198 3,495 3,782 4,048<br />
Qatar 467 526 617 885 1,508 1,630 1,740 1,848 1,951<br />
Saudi <strong>Arab</strong>ia 16,259 18,255 20,808 23,613 26,246 28,933 31,608 34,176 36,545<br />
UAE 1,867 2,432 3,238 4,089 4,707 5,193 5,660 6,109 6,555<br />
Urban Population (‘000s)<br />
Bahrain 434 511 574 643 715 784 852 919 984<br />
Kuwait 2,100 1,692 2,188 2,654 3,001 3,326 3,637 3,933 4,218<br />
Oman 1,218 1,557 1,719 1,881 2,122 2,377 2,645 2,917 3,184<br />
Qatar 431 495 586 845 1,445 1,568 1,679 1,787 1,891<br />
Saudi <strong>Arab</strong>ia 12,451 14,361 16,615 19,120 21,541 24,058 26,617 29,131 31,516<br />
UAE 1,476 1,906 2,599 3,364 3,956 4,444 4,915 5,370 5,821<br />
Percentage Population Urban<br />
Bahrain 88.1 88.4 88.4 88.4 88.6 89 89.4 90 90.6<br />
Kuwait 98 98.1 98.2 98.3 98.4 98.5 98.6 98.6 98.7<br />
Oman 66.1 71.7 71.6 71.9 73 74.3 75.7 77.1 78.7<br />
Qatar 92.2 94.1 94.9 95.4 95.8 96.2 96.5 96.7 96.9<br />
Saudi <strong>Arab</strong>ia 76.6 78.7 79.8 81 82.1 83.2 84.2 85.2 86.2<br />
UAE 79.1 78.4 80.3 82.3 84.1 85.6 86.8 87.9 88.8<br />
Source: UN-DESA, WPP 2008 and WUP 2009.<br />
TABLE 61: NATIONAL AND URBAN POPULATION ANNUAL GROWTH RATES<br />
1990<br />
-1995<br />
National Population Growth Rates (%)<br />
1995<br />
-2000<br />
2000<br />
-2005<br />
Bahrain 3.17 2.36 2.25 2.08 1.77 1.56 1.37 1.23<br />
Kuwait -4.34 5.12 3.84 2.44 2.04 1.77 1.55 1.38<br />
Oman 3.28 2.02 1.72 2.08 1.92 1.78 1.58 1.36<br />
Qatar 2.35 3.20 7.23 10.65 1.55 1.31 1.21 1.09<br />
Saudi <strong>Arab</strong>ia 2.32 2.62 2.53 2.12 1.95 1.77 1.56 1.34<br />
UAE<br />
Urban Population Growth Rates (%)<br />
5.25 5.73 4.67 2.82 1.97 1.72 1.53 1.41<br />
Bahrain 3.23 2.36 2.26 2.12 1.85 1.66 1.5 1.37<br />
Kuwait -4.32 5.14 3.86 2.46 2.06 1.78 1.57 1.4<br />
Oman 4.9 1.99 1.8 2.41 2.27 2.14 1.96 1.75<br />
Qatar 2.75 3.38 7.33 10.74 1.62 1.37 1.25 1.13<br />
Saudi <strong>Arab</strong>ia 2.85 2.92 2.81 2.38 2.21 2.02 1.81 1.57<br />
UAE 5.1 6.21 5.16 3.25 2.32 2.02 1.77 1.61<br />
Source: UN-DESA, WPP 2008 and WUP 2009.<br />
2005<br />
-2010<br />
2010<br />
-2015<br />
2015<br />
-2020<br />
2020<br />
-2025<br />
2025<br />
-2030
TABLE 62: AVERAGE ANNUAL RATE OF CHANGE OF URBAN AGGLOMERATIONS WITH 750K+ PEOPLE IN 2009 (PER CENT)<br />
City 1990-1995 1995-2000 2000-2005 2005-2010 2010-2015 2015-2020 2020-2025<br />
Kuwait City -3.13 4.62 4.61 3.99 2.35 1.47 1.16<br />
Dammam 5.3 3.63 3.62 3.26 2.33 1.8 1.53<br />
Medina 4.69 3.45 3.45 3.12 2.27 1.77 1.5<br />
Riyadh 5.33 3.23 3.23 2.9 2.06 1.56 1.29<br />
Jeddah 4.66 2.63 2.62 2.46 1.97 1.61 1.35<br />
Mecca 3.76 2.45 2.45 2.35 2.02 1.72 1.46<br />
Dubai 6.36 6.64 6.67 4.3 2.46 1.76 1.42<br />
Sharjah 6.11 7.12 7.22 4.78 2.69 1.86 1.51<br />
Source: UN-DESA, WPP 2008 and WUP 2009.<br />
TABLE 63: YOUTH POPULATIONS IN 2010, MEDIUM VARIANT<br />
Country Per cent youth population (0-24)<br />
Bahrain 34.9<br />
Kuwait 42.2<br />
Oman 49.1<br />
Qatar 28.1<br />
Saudi <strong>Arab</strong>ia 48.3<br />
United <strong>Arab</strong> Emirates 33.1<br />
Source: UN-DESA, WPP 2010.<br />
TABLE 64: GDP PER CAPITA IN USD<br />
Country 2007 2008 2009<br />
UAE 45,991 53,338 -<br />
Bahrain 17,774 19,794 -<br />
Saudi <strong>Arab</strong>ia 15,868 19,200 14,809<br />
Oman 15,276 21,032 14,529<br />
Qatar USD USD 61,106<br />
Kuwait 47,538 59,666 42,385<br />
Source: The Cooperation Council for the <strong>Arab</strong> States of the Gulf Secretariat General. (2010). GCC: A Statistical Glance, Volume II. The Cooperation Council for the <strong>Arab</strong> States of the Gulf<br />
Secretariat General.<br />
TABLE 65: PRODUCTION OF OIL (1,000 B/D)<br />
Country 2007 2008 2009<br />
UAE 2,530 2,570 2,220<br />
Bahrain 184.3 182.7 182.2<br />
Saudi <strong>Arab</strong>ia 8,816 9,198 8,184<br />
Oman 710 757 813<br />
Qatar 845.7 839.3 792<br />
Kuwait 2,574.6 2,676 2,261.6<br />
Source: The Cooperation Council for the <strong>Arab</strong> States of the Gulf Secretariat General. (2010). GCC: A Statistical Glance, Volume II. Cooperation Council for the <strong>Arab</strong> States of the Gulf<br />
Secretariat General.<br />
175
176<br />
TABLE 66: PROPORTION OF EMPLOYED NATIONALS AND NON-NATIONALS IN THE LABOUR FORCE<br />
Country Sector National Non-National<br />
Oman (2009) Private 15.3% 84.7% 329<br />
Qatar (2010) Total 5.6% 94.4% 330<br />
Qatar (2010) Private 0.6% 99.4% 331<br />
Bahrain (2009) Total 26% 74% 332<br />
Bahrain (2009) Private 20% 80% 333<br />
UAE (2008) Total 3.9% 96.1% 334<br />
Saudi <strong>Arab</strong>ia Total 47.1% 52.9% 335<br />
Saudi <strong>Arab</strong>ia Private 13.3% 86.7% 336<br />
Source: Footnoted below due to the sheer number of sources.<br />
TABLE 67: WORKFORCE IN 2008<br />
Origin Number of workers Percentage of Total Workforce<br />
UAE 117,022 3.9%<br />
Other GCC Countries 6,051 0.2%<br />
Other <strong>Arab</strong> Countries 337,791 11.1%<br />
Non-<strong>Arab</strong> Asian Countries 2,507,792 82.7%<br />
Source: National Bureau of Statistics, Employment, Wages and Hours of Work Survey 2008. Retrieved January 26, 2011 at: http://www.uaestatistics.gov.ae:85/default.aspx<br />
TABLE 68: URBAN UNEMPLOYMENT RATES FOR 2009<br />
Gender National Non-National<br />
Male 7.1% 1.8%<br />
Female 21.3% 7.0%<br />
Total 11.5% 2.8%<br />
Source: UAE, 2009 labour survey. Retrieved January 26, 2011 at: www.uaestatistics.gov.ae/ReportPDF/DSS_SS_LF%202009.xls<br />
TABLE 69: LEVEL OF MOTORIZATION IN GCC COUNTRIES<br />
Bahrain Kuwait Oman Qatar<br />
Saudi<br />
<strong>Arab</strong>ia<br />
UAE<br />
Roads (km) 3,851* 5,749 48,874 7,790 221,372 4,030<br />
% roads paved 81* 85 41 .. 21 ..<br />
Road Density (km of roads per 100 km2 land) 493 32 16 68 10 5<br />
Motor Vehicles (per 1,000 people) 482 502 225 724 .. 313<br />
Passenger Cars (per 1,000 people) 405 282 174 335 415 293<br />
Estimated Traffic Related Deaths per 100,000 people^ 12 17 21 24 29 37<br />
Source: World Bank Development Indicators data from latest year available over 2000 to 2007. *CIA Factbook 2007; ^WHO Traffic Study, 2009.
TABLE 70: WATER AVAILABILITY AND USAGE<br />
Country<br />
Natural Renew.<br />
Resource Bm 3 /yr<br />
TABLE 71: 2008 ACCESS TO IMPROVED WATER AND SANITATION<br />
TABLE 72: GCC ENERGY INDICATORS<br />
Desal.<br />
End Water<br />
Bm 3 /yr<br />
Annual Availability Annual Water Usage % Use by Sector<br />
Wastewater<br />
Reuse Bm 3 /yr<br />
Per Capita Renewable<br />
Availability (m 3 )<br />
Bm3 As a % of<br />
total water<br />
resources Domestic<br />
2006 2015 2025<br />
Bahrain 0.11 0.14 Negligible 157 125 106 0.25 170 26 3 71<br />
Kuwait 0.11 0.65 0.12 7 5 4 0.76 87 37 2 60<br />
Oman 1.60 0.12 0.02 550 440 365 1.22 74 9 1 93<br />
Qatar 0.05 0.12 .. 71 50 40 0.28 .. 23 3 74<br />
Saudi <strong>Arab</strong>ia 2.50 2.28 0.15 96 77 64 17.00 506 15 1 84<br />
UAE 0.20 0.95 0.14 35 26 20 1.60 180 24 10 67<br />
Source: AFED 2010 <strong>Arab</strong> Environment Water Report.<br />
Improved Water Access Improved Sanitation Access<br />
Total Urban Rural Total Urban Rural<br />
Bahrain 100 .. .. 100 .. ..<br />
Kuwait 99 99 99 100 100 100<br />
Oman 88 92 77 97 .. ..<br />
Qatar 100 100 100 100 100 100<br />
Saudi <strong>Arab</strong>ia 97 .. .. 100 .. ..<br />
UAE 100 100 100 97 98 95<br />
Source: WHO/GHO Database.<br />
Bahrain Kuwait Oman Qatar Saudi <strong>Arab</strong>ia UAE<br />
2007 Energy Use (kg of oil equiv. per cap) 11,874 9,729 6,057 22,057 6,170 11,036<br />
2007 Electricity Use (kWh per cap) 12,628 16,311 4,456 17,181 7,080 14,567<br />
2007 Electricity from fossil fuels (%total) 100 100 100 100 100 100<br />
2007 Electricity from hydropower (%total) 0 0 0 0 0 0<br />
2007 Energy Imports (net, % energy use) -94 -482 -283 -364 -267 -245<br />
2005 Wind Power Potential (GW) .. .. 3 .. 11 ..<br />
2005 Solar Potential (GW) .. 700 7,900 400 49,800 1,000<br />
2007 Total CO Emissions (kt of CO ) 2 2 22,446 86,075 37,289 63,002 402,120 135,429<br />
2007 Per Cap CO Emissions (t) 2 29.6 32.3 13.7 55.4 16.6 31.0<br />
2007 % Growth in CO Emissions (1990-2007) 2 189 211 361 536 187 247<br />
1996 Micro Particulate Matter (PM10, μg/m3 ) 71 119 130 53 169 178<br />
2006 Micro Particulate Matter (PM10, μg/m3 ) 68 97 108 51 113 127<br />
Sources: World Bank Little Green Book 2009; World Bank Development Indicators; Booz Allen Report, 2009.<br />
Industrial<br />
Agriculture<br />
177
178<br />
TABLE 73: TOTAL WASTE STREAM BY SOURCE AND PROPORTION OF MUNICIPAL WASTE STREAM BY CONTENT<br />
Bahrain Kuwait Oman Qatar<br />
Saudi<br />
<strong>Arab</strong>ia<br />
UAE<br />
Total Waste Stream (tons/yr) 1,731,000 2,094,000 1,859,000 6,461,000<br />
Municipal (Domestic) 39% 43% 30% 33%<br />
Demolition & Construction 55% 42% 56%<br />
Industrial 8% 0.3% 3% 1.5%<br />
Agricultural 9.5%<br />
Healthcare 53% 1.6% 24%<br />
MSW Generated (kg/cap/day) 2.7 1.4 0.7 1.3 1.4 1.2<br />
Material Composition of MWS (Abu Dhabi)<br />
Food / organic wastes 35% 50% 40% 45% 37% 49%<br />
Paper 28% 20% 26% 18% 28.5% 6%<br />
Plastic 6% 12.6% 12% 15% 5.2% 12%<br />
Glass 5% 3.3% 5% 10% 4.6% 9%<br />
Mineral 12% 2.6% 11% 4% 8.3% 6%<br />
Textile 8% 4.8% 6% 3% 6.4%<br />
Other 6% 6.7% 5% 10% 18%<br />
Source: AFED 2008 Report on the Environment.<br />
TABLE 74: PARTICIPATION IN THE WORKFORCE AND NATIONAL POLITICS BY WOMEN / MEN<br />
TABLE 75: SOURCE COUNTRIES OF MIGRANT WORKERS<br />
Bahrain Kuwait Oman Qatar Saudi <strong>Arab</strong>ia UAE<br />
<br />
Literacy rate of women/men (% literate aged 15 and<br />
above, 2005-08)<br />
89 92 93 95 81 90 90 94 80 90 91 89<br />
Labour Force Participation Rate by women/men (% of<br />
those aged 15-64 employed, 2008)<br />
34 87 46 85 26 79 49 93 22 82 43 93<br />
Year Women Received Right to Vote and Stand for<br />
Election<br />
1973 (partial)<br />
& 2002 (full)<br />
2005<br />
1994 (partial)<br />
& 2003 (full)<br />
2003<br />
(vote only)<br />
.. ..<br />
Year First Woman Elected (E) or Appointed (A) to<br />
Parliament<br />
2002A 2005A .. .. .. ..<br />
% of parliament (single or lower house) seats held by<br />
women (2010)<br />
2.5 2.4 0 0 22.5<br />
% of parliament (upper house or senate) seats held by<br />
women (2007)<br />
25 3.1 15.5 .. .. ..<br />
% of ministerial positions held by women (2005) 8.7 0 10 .. 0 5.6<br />
Source: World Bank Gender Statistics, UN HDR 2007/08.<br />
Bahrain<br />
Top 10 Source Countries<br />
Algeria, Egypt, India, Iran, Iraq, Morocco, Saudi <strong>Arab</strong>ia, Sudan, Syria and Yemen<br />
Kuwait Australia, Canada, Denmark, France, India, Netherlands, Saudi <strong>Arab</strong>ia, Sweden, United Kingdom and United States<br />
Oman Bangladesh, Egypt, India, Jordan, Netherlands, Pakistan, Philippines, Sri Lanka, Sudan and United Kingdom<br />
Saudi <strong>Arab</strong>ia Bangladesh, Egypt, Pakistan, Philippines, India, Indonesia, Jordan, Sri Lanka, Sudan and Yemen.<br />
Source: Migration and Remittances, Factbook 2008.
TABLE 76: IMMIGRATION DATA BY COUNTRY<br />
# of International Migrants in<br />
Country (2010)<br />
# of Refugees in Country<br />
(2008)<br />
% Population Foreign Born<br />
(2010)<br />
Average Annual Net Migration<br />
(2005-2010)<br />
Bahrain 315,000 0 39.1 4,000<br />
Kuwait 2,098,000 38,000 68.8 24,000<br />
Oman 826,000 0 28.4 4,000<br />
Qatar 1,305,000 0 86.5 112,400<br />
Saudi <strong>Arab</strong>ia 7,289,000 240,600 27.8 30,000<br />
UAE 3,293,000 200 70.0 68,600<br />
Source: UN DESA International Migration Wall Chart 2009.<br />
TABLE 77: FLOWS OF REMITTANCES IN THE GCC<br />
Remittance Outflows<br />
(USD, in millions)<br />
Rank in the<br />
World<br />
Remittance Inflows<br />
(USD, in millions)<br />
Remittance Outflows<br />
(% of GDP)<br />
2009 1999 2008 2009 1999 2009 1999<br />
Bahrain 1,391 856 30th .. .. 7 13<br />
Kuwait 9,912 1,731 18th .. .. 7 (2008) 6<br />
Oman 5,313 1,438 21st 39 39 11 9<br />
Qatar 7,000* 1,600 (2001) .. .. .. 5 (2008^) 8.5 (2001^)<br />
Saudi <strong>Arab</strong>ia 25,970 13,958 2nd 217 .. 7 9<br />
Source: World Bank Development Indicators Database, Migration and Remittances Factbook 2008, * Remittance outflow from Qatar Central Bank 337 ; ^Qatar Statistics Authority. 338<br />
179
180<br />
ENDNOTES<br />
1 UN-Department of Economic and Social Affairs.<br />
(2008). The World Population Prospects: The 2008<br />
Revision. New York: UN-DESA.<br />
2 UN-Department of Economic and Social Affairs.<br />
(2009). The World Urbanization Prospects: The 2009<br />
Revision. New York: UN-DESA.<br />
3 Qatar Statistics Authority, 2010 census. Sourced at<br />
Qatar Information Exchange.<br />
4 Ministry of National Economy, 2009 Statistical<br />
Yearbook.<br />
5 Al-Manni, A. et al. (2007), ‘Urban growth and land<br />
use change detection in Using Remote Sensing and<br />
Geographic Information System Techniques in Doha<br />
City, State of Qatar. <strong>Arab</strong> Gulf Journal of Scientific<br />
Research, 25 (4): 190-198.<br />
6 Central Informatics Organisation, 2001 census.<br />
7 US Census Bureau, International Data Base.<br />
8 UN-Habitat. 2011. State of the <strong>Cities</strong> Background<br />
Paper: Oman. Nairobi: UN-Habitat.<br />
9 Kola, A., ’30-year road map for all-round prosperity’.<br />
Times of Oman, August 3, 2010.<br />
10 UN-Habitat. (2011). State of the <strong>Cities</strong> Report:<br />
Oman. Nairobi: UN-Habitat.<br />
11 Bahrain Tribune, ‘Bahrain: solving the housing<br />
problem in Kingdom’. September 12, 2008.<br />
12 Construction Week Online, ‘AECOM hired as Diyar al<br />
Muharraq master planner’. March 14, 2010.<br />
13 Ministry of Municipalities Affairs and Agriculture,<br />
Urban Planning Affairs.<br />
14 Atkins, ‘Atkins wins role to shape Bahrain’s economic<br />
growth’. June 25, 2010.<br />
15 State of Kuwait and Kuwait Municipality. 2005.<br />
Third Kuwait Master Plan Review: Executive<br />
Summary. Kuwait: State of Kuwait.<br />
16 Baxter, E., ‘Kuwait signs deals for capital city<br />
expansion plan’. <strong>Arab</strong>ian Business, August 4, 2010.<br />
17 State of Kuwait and Kuwait Municipality. 2005.<br />
Third Kuwait Master Plan Review: Executive<br />
Summary. Kuwait: State of Kuwait.<br />
18 Al-Imam Muhammad Ibn Saud Islamic University, ‘A<br />
National Spatial Strategy for Saudi <strong>Arab</strong>ia’.<br />
19 Ministry of Economy and Planning, Brief Report on<br />
the Ninth Development Plan.<br />
20 AMEInfo, ‘Abu Dhabi 2030: The blueprint’. March 24,<br />
2008.<br />
21 Abu Dhabi Urban Planning Council (2007), Plan Abu<br />
Dhabi 2030: Urban Structure Framework Plan, pp.<br />
20-21. p. 32, p.39.<br />
22 Abu Dhabi Urban Planning Council (2007), Plan Abu<br />
Dhabi 2030: Urban Structure Framework Plan, pp.<br />
10-12.<br />
23 Abu Dhabi Urban Planning Council (2007), Plan Abu<br />
Dhabi 2030: Urban Structure Framework Plan, p. 32.<br />
24 Abu Dhabi Urban Planning Council (2007), Plan Abu<br />
Dhabi 2030: Urban Structure Framework Plan, pp.55-<br />
56.<br />
25 Abu Dhabi Urban Planning Council (2007), Plan Abu<br />
Dhabi 2030: Urban Structure Framework Plan,.75-76.<br />
26 Dubai government, Highlights: Dubai Strategic Plan<br />
2015.<br />
27 Qatar General Secretariat for Development Planning.<br />
“Qatar National Development Strategy 2011 - 2016.”<br />
Gulf Publishing and Printing Company, Doha. 2011<br />
28 The Government of Abu Dhabi (2008), The Abu<br />
Dhabi Economic Vision 2030, p.5.<br />
29 National Bureau of Statistics (2010), Analytical<br />
Report on Economic and Social Dimensions in the<br />
United <strong>Arab</strong> Emirates 2009, p.23.<br />
30 AMEInfo, ‘Building the capital of the future’. March<br />
24, 2008.<br />
31 National Bureau of Statistics (2010), Analytical<br />
Report on Economic and Social Dimensions in the<br />
United <strong>Arab</strong> Emirates 2009, p.23.<br />
32 Government of Dubai, Dubai Statistics Center. “Gross<br />
Domestic Product at Constant Prices – Emirate of<br />
Dubai (2006-2009).”<br />
33 Ministry of Information.<br />
34 General Secretariat of Planning, Qatar National Vision<br />
2030.<br />
35 General Secretariat of Planning, Qatar National Vision<br />
2030.<br />
36 Bahrain Economic Development Board, Building Our<br />
Future: Annual Report 2009, p.18.<br />
37 Bahrain Economic Development Board (2008), From<br />
Regional Pioneer to Global Contender: the Economic<br />
Vision 2030 for Bahrain.<br />
38 Bahrain Economic Development Board, ‘Newly<br />
opened “Salman Industrial City” to play important<br />
role in attracting foreign investment’. January 10,<br />
2010.<br />
39 Central Statistical Office, Annual Statistical Abstract<br />
2008, pp.193-196. Release Sector> Statistics<br />
Publishing> General Statistics> Annual Statistical<br />
Abstract Statistical Abstract 2008.<br />
40 Central Intelligence Agency, The World Factbook.<br />
41 Freedom House (2010), ‘Freedom in the World 2010:<br />
Saudi <strong>Arab</strong>ia’.<br />
42 Ministry of Economy and Planning, Brief Report on<br />
the Ninth Development Plan, p.24.<br />
43 Ministry of Economy and Planning, Brief Report on<br />
the Ninth Development Plan, p.24.<br />
44 Ministry of Economy and Planning, Brief Report on<br />
the Ninth Development Plan, p.24.<br />
45 UN-Habitat. (2011). State of the <strong>Cities</strong> Background<br />
Report: Saudi <strong>Arab</strong>ia. Nairobi: UN-Habitat.<br />
46 Ministry of Economy and Planning, Brief Report on<br />
the Ninth Development Plan, p.24.<br />
47 UN-Habitat. (2011). State of the <strong>Cities</strong> Background<br />
Report: Saudi <strong>Arab</strong>ia. Nairobi: UN-Habitat.<br />
48 “2009 Annual Report.” Ar-Riyadh Development<br />
Authority, December 2009.<br />
49 Al-Sulami, M., ‘Migration from urban to rural areas<br />
on the rise’. <strong>Arab</strong> News, February 26, 2010.<br />
50 Jeddah Municipality. “Jeddah Strategic Plan: Local<br />
Economy.” Jeddah Municipality. 2009<br />
51 Al-Sulami, M., ‘Migration from urban to rural areas<br />
on the rise’. <strong>Arab</strong> News, February 26, 2010.<br />
52 UN-Habitat. (2011). State of the <strong>Cities</strong> Background<br />
Report: Saudi <strong>Arab</strong>ia. Nairobi: UN-Habitat.<br />
53 Jeddah Municipality (2009), Jeddah Strategic Plan.<br />
‘Local economy’, p.92.<br />
54 Bahrain Economic Development Board (2008), From<br />
Regional Pioneer to Global Contender: the Economic<br />
Vision 2030 for Bahrain.<br />
55 The Economist Intelligence Unit. “Country Report:<br />
Qatar: May 2011.” The Economist Intelligence Unit<br />
Ltd. May 2011. pg 12<br />
56 El Gamal, R., ‘Thousands live in the slums of Kuwait’.<br />
Kuwait Times, June 1, 2007.<br />
57 Nagy, S. 2006. ‘Making room for migrants,<br />
making sense of difference: spatial and ideological<br />
expressions of social diversity in urban Qatar’. Urban<br />
Studies, 43 (1): 119-137.<br />
58 Central Informatics Organization, Household<br />
Expenditure and Income Survey, chapter 4, tables<br />
4.01-4.02.<br />
59 <strong>Arab</strong> News, ‘King orders SR1.2bn aid for the poor’.<br />
September 2, 2010. UNDP also cites the 1.63%<br />
figure (2005).<br />
60 UN-Habitat. (2011). State of the <strong>Cities</strong> Background<br />
Report: Saudi <strong>Arab</strong>ia. Nairobi: UN-Habitat.<br />
61 <strong>Arab</strong> News, ‘King orders SR1.2bn aid for the poor’.<br />
September 2, 2010. UNDP also cites the 1.63%<br />
figure (2005).<br />
62 Qatar Statistics Authority, 2010 census. Sourced at<br />
Qatar Information Exchange.<br />
63 National Bureau of Statistics, Employment, Wages<br />
and Hours of Work Survey 2008.<br />
64 Qatar Statistics Authority, Results of the 2010<br />
Census on Population, Housing and Establishments.<br />
65 UN-Habitat. (2011). State of the <strong>Cities</strong> Background<br />
Report: Saudi <strong>Arab</strong>ia. Nairobi: UN-Habitat.<br />
66 Qatar Statistics Authority, Results of the 2010<br />
Census on Population, Housing and Establishments.<br />
67 UAE, 2009 labour survey.<br />
68 World Bank Development Indicators<br />
69 World Bank Development Indicators<br />
70 Hasan, O., ‘Kuwait MPs pass privatisation law,<br />
exclude energy production’. AFP, May 12, 2010.<br />
71 Silvey, R. (2008), ‘In the margins of Riyadh:<br />
Indonesian domestic workers in Saudi <strong>Arab</strong>ia’, p.291,<br />
in Price, M. and Benton-Short, L. (Eds.), Migrants<br />
to the Metropolis: The Rise of Immigrant Gateway<br />
<strong>Cities</strong>. Syracuse, NY: Syracuse University Press.<br />
72 UAE, 2009 labour survey.<br />
73 UNDP/Qatar Statistics Authority/Population<br />
Committee (2010), Millennium Development Goals In<br />
Qatar 2010, p.31.<br />
74 Qatar Statistics Authority, Results of the 2010<br />
Census on Population, Housing and Establishments.<br />
75 Qatar Statistics Authority, 2010 census. Sourced at<br />
Qatar Information Exchange.<br />
76 Freedom House (2010), ‘Freedom in the World 2010:<br />
Saudi <strong>Arab</strong>ia’.<br />
77 UN-Habitat. (2011). State of the <strong>Cities</strong> Background<br />
Report: Saudi <strong>Arab</strong>ia. Nairobi: UN-Habitat.<br />
78 Ministry of Economy and Planning, Brief Report on<br />
the Ninth Development Plan, p.24.<br />
79 Saberi, M. ‘Diabetes presents a major challenge’.<br />
Gulf News, November 15, 2010.<br />
80 Al-Lawati, J. & Jousilahti, P., ‘Prevalence and 10-year<br />
secular trend of obesity in Oman’. Saudi Medical<br />
Journal. 25 (3): 346-351.<br />
81 World Health Organisation.<br />
82 Trade <strong>Arab</strong>ia, ‘Top WHO award for Manama’. March<br />
23, 2010.<br />
83 Qatar Statistics Authority, 2010 census. Sourced at<br />
Qatar Information Exchange.<br />
84 High Commission for the Development of Arriyadh.<br />
85 Jeddah Municipality (2009), Jeddah Strategic Plan.<br />
‘Social services’, p.159.<br />
86 UAE Interact, ‘Tourism contributes 18% to Dubai’s<br />
GDP per year’. February 14, 2007.<br />
87 AMEInfo, ‘Abu Dhabi plans tourism makeover’.<br />
March 24, 2008.<br />
88 http://www.qatartourism.gov.qa/about/index/2<br />
89 Trofimov, Y., ‘Upon sober reflection, Bahrain<br />
reconsiders the wages of sin’. Wall Street Journal,<br />
June 9, 2009.<br />
90 “Overview.” Al Areen Holding Company. 2010.<br />
91 Richter, F., ‘Bahrain seeks UNESCO listing for pearl<br />
diving plan’. Reuters, Jan. 27, 2010.<br />
92 Kingdom of Saudi <strong>Arab</strong>ia, Central Department of<br />
Statistics and Information.<br />
93 Jeddah Municipality (2009), Jeddah Strategic Plan.<br />
‘Tourism’, p.206.<br />
94 Ministry of Hajj, Saudi <strong>Arab</strong>ia. ‘More than 3.8 million<br />
pilgrims have arrived in the Kingdom’. Sep. 4, 2010.<br />
95 UN-Habitat. (2011). State of the <strong>Cities</strong> Background<br />
Report: Saudi <strong>Arab</strong>ia. Nairobi: UN-Habitat.<br />
96 Hamouche, M., ‘The changing morphology of the<br />
Gulf cities in the age of globalisation: the case of<br />
Bahrain’. Habitat International 28: 521-540.<br />
97 Mahgoub, Y. (2007), ‘Architecture and the expression<br />
of cultural identity in Kuwait’. The Journal of<br />
Architecture, 12 (20): 165 – 182.<br />
98 Bahrain Central Informatics Organization 2010<br />
Census; Saudi <strong>Arab</strong>ia, Central Department of<br />
Statistics and Information, “Highlights of the<br />
Demographic Survey 1428H (2007)”; Oman, Ministry<br />
of National Economy Statistical Yearbook, 2010;<br />
State of Kuwait Central Statistical Bureau. “Annual
ENDNOTES<br />
Statistical Abstract: 2009.” State of Kuwait, 2009;<br />
Statistics Center - Abu Dhabi, 2009.<br />
99 Kuwait Ministry of Planning. “Annual Bulletin for Vital<br />
Statistics – Marriage & Divorce.” 2008.<br />
100 Oman, Ministry of National Economy Statistical<br />
Yearbook, 2010<br />
101 Qatar Statistics Authority. “Crude Marriage Rate.”<br />
Last estimate for 2008.<br />
102 Dubai Statistics website<br />
103 UN-Habitat. (2011). State of the <strong>Cities</strong> Background<br />
Report: Saudi <strong>Arab</strong>ia. Nairobi: UN-Habitat.<br />
104 State of Kuwait Central Statistical Bureau. “Annual<br />
Statistical Abstract: 2009.” State of Kuwait, 2009.<br />
105 Oman, Ministry of National Economy Statistical<br />
Yearbook, 2010.<br />
106 UN-Habitat, Global Urban Indicators.<br />
107 Colliers International. “GCC Real Estate Overview,<br />
Second Quarter 2009.”<br />
108 Colliers International MENA Headquarters. “MENA<br />
Real Estate Overview: First Quarter 2010.” Colliers<br />
International. 2010.<br />
109 Colliers International MENA Headquarters. “MENA<br />
Real Estate Overview: First Quarter 2010.”<br />
110 CB Richard Ellis. “MarketView: Kingdom of Bahrain,<br />
Q2, 2010.” Manama: CB Richard Ellis, 2010.<br />
111 CB Richard Ellis. “MarketView: Kingdom of Bahrain,<br />
Q4, 2010.” Manama: CB Richard Ellis, 2010.<br />
112 Kingdom of Bahrain. “Housing in Bahrain.” Kingdom<br />
of Bahrain e-government.<br />
113 Al-Maymouni, R. & Afit, N., ‘Riyadh mayor calls on<br />
government, businesses to assist home ownership’.<br />
Saudi Gazette, October 19, 2010.<br />
114 Ministry of Economy and Planning, Brief Report on<br />
the Ninth Development Plan, p.61.<br />
115 Ministry of Economy and Planning, Brief Report on<br />
the Ninth Development Plan, p.61.<br />
116 Ministry of Economy and Planning, Brief Report on<br />
the Ninth Development Plan, p.83.<br />
117 Al-Abdullah, M., ‘Mortgage options urged as realtors<br />
gather in Dammam’. Saudi Gazette, October 25,<br />
2010.<br />
118 Jeddah Municipality (2009), Jeddah Strategic Plan.<br />
‘Urban Territory and Land Use Patterns’, p.45.<br />
119 Colliers International MENA Headquarters. “MENA<br />
Real Estate Overview: First Quarter 2010.” Colliers<br />
International. 2010.<br />
120 Jeddah Municipality (2009), Jeddah Strategic Plan.<br />
‘Housing’, p.338.<br />
121 Jeddah Municipality (2009), Jeddah Strategic Plan.<br />
‘Housing’, p.337.<br />
122 Jeddah Municipality (2009), Jeddah Strategic Plan.<br />
‘Urban Territory and Land Use Patterns, p.53.<br />
123 Ar-Riyadh Development Authority (2009), Investment<br />
Climate in Ar-Riyadh City 2009, p.24.<br />
124 Bseiso, R. “Brief Report on Adequate Housing and<br />
Housing Rights in Kuwait for Low-Wage Laborers.”<br />
UN-Habitat Kuwait Office, 2010.<br />
125 Bseiso, R. “Brief Report on Adequate Housing and<br />
Housing Rights in Kuwait for Low-Wage Laborers.”<br />
UN-Habitat Kuwait Office, 2010.<br />
126 United Nations Statistics Division.<br />
127 United Nations Statistics Division.<br />
128 Jeddah Municipality (2009), Jeddah Strategic Plan.<br />
‘Urban Territory and Land Use Patterns’, p.45.<br />
129 Jeddah Municipality (2009), Jeddah Strategic Plan.<br />
‘Unplanned Settlements’, p.363, 366.<br />
130 UN-Habitat. (2011). State of the <strong>Cities</strong> Background<br />
Report: Saudi <strong>Arab</strong>ia. Nairobi: UN-Habitat.<br />
131 Jeddah Municipality (2009), Jeddah Strategic Plan.<br />
‘Urban Territory and Land Use Patterns’, p.45.<br />
132 Murphy, C., ‘Saudi <strong>Arab</strong>ians use Facebook to vent<br />
fury over Jeddah flood deaths’. The Christian<br />
Science Monitor, November 30, 2009. Kuwait Times,<br />
‘Officials grilled over floods’. Dec. 28, 2009.<br />
133 Jeddah Municipality. “Jeddah Strategic Plan:<br />
Unplanned Settlements.” Jeddah Municipality. 2009.<br />
134 Baxter, E., ‘10 facts about construction in Saudi<br />
<strong>Arab</strong>ia’. Construction Week Online, May 16, 2009.<br />
135 Jeddah Municipality (2009), Jeddah Strategic Plan.<br />
‘Urban Territory and Land Use Patterns’, p.47.<br />
136 Construction Week Online, ‘SAR3bn Jeddah slum<br />
compensation’. July 3, 2010.<br />
137 AME Info, ‘Saudi <strong>Arab</strong>ia to allow foreigners to own<br />
property’. June 3, 2010.<br />
138 Jeddah Municipality. “Jeddah Strategic Plan:<br />
Unplanned Settlements.” Jeddah Municipality.<br />
2009.<br />
139 Freedom House. “Country Report – Bahrain.”<br />
140 Freedom House (2010), Country Report – Saudi<br />
<strong>Arab</strong>ia.<br />
141 Wilson, R. “The Development of Islamic Finance<br />
in the GCC.” Kuwait Programme on Development,<br />
Governance and Globalisation in the Gulf States,<br />
2009.<br />
142 Colliers International. “GCC Real Estate Overview,<br />
Second Quarter 2009.” Colliers International, 2009.<br />
143 Jeddah Municipality (2009), Jeddah Strategic Plan.<br />
‘Housing’, p.339.<br />
144 Jeddah Municipality (2009), Jeddah Strategic Plan.<br />
‘Urban Territory and Land Use Patterns, p.45.<br />
145 Jeddah Municipality (2009), Jeddah Strategic Plan.<br />
‘Urban Territory and Land Use Patterns, p.47.<br />
146 Wilson, R. “The Development of Islamic Finance<br />
in the GCC.” Kuwait Programme on Development,<br />
Governance and Globalisation in the Gulf States,<br />
2009.<br />
147 Iman, Patrick and Kpodar, Kangni. “Working Paper:<br />
Islamic Banking: How Has It Diffused?” International<br />
Monetary Fund, 2010.<br />
148 Wilson, 2009.<br />
149 Ibrahim, A. “Housing Rights Sought for ‘Kuwaiti<br />
Women’: Plan to Raise CSB Capital.” <strong>Arab</strong> Times,<br />
Aug. 31, 2010.<br />
150 Freedom House. Women’s Rights in the Middle East<br />
and North Africa: Citizenship and Justice.<br />
151 McGinley, S., ‘Kuwait to set up $1.7bn housing fund<br />
for women’. <strong>Arab</strong>ian Business, Aug. 22, 2010.<br />
152 Ministry of National Economy, Facts & Figures 2009,<br />
p35.<br />
153 Central Informatics Organisation, 2009 Statistical<br />
Abstract.<br />
154 Abu Dhabi, Department of Transport (2009), Surface<br />
Transport Master Plan: A Vision for Connecting Abu<br />
Dhabi, p.17.<br />
155 World Bank Development Indicators<br />
156 High Commission for the Development of Arriyadh.<br />
157 Government of Dubai, General Census of Population,<br />
Housing and Establishments 2005.<br />
158 Mahgoub, Y. (200), ‘Kuwait: learning from a<br />
globalised city’. In Elsheshtawy, Y. (ed.) The<br />
Evolving <strong>Arab</strong> City: tradition, modernity and urban<br />
development, Chapter 7, pp.152-83.<br />
159 Sambidge, A., ‘Doha traffic congestion is main<br />
concern – survey’. <strong>Arab</strong>ian Business, March 20,<br />
2010.<br />
160 Government of Abu Dhabi, Department of Transport<br />
(2009), Surface Transport Master Plan: A Vision for<br />
Connecting Abu Dhabi, p.16.<br />
161 Government of Abu Dhabi, Department of Transport<br />
(2009), Shariff, O., ‘Dubai traffic woes inflict losses<br />
of Dh4.6b a year’. Gulf News, Dec. 13, 2007.<br />
162 Shariff, O., ‘Dubai traffic woes inflict losses of Dh4.6b<br />
a year’. Gulf News, Dec. 13, 2007.<br />
163 Jeddah Municipality. “Jeddah Strategic Plan:<br />
Transport.” Jeddah Municipality. 2009<br />
164 Kraemer, S. “With Peak Oil Looming, Gulf States<br />
Consider Ending Fossil Fuel Subsidies.” Green<br />
Prophet online news, Dec. 16, 2010.<br />
165 World Bank Development Indicators<br />
166 WHO. “Global Status Report on Road Safety: Time<br />
for Action.” Geneva: World Health Organization,<br />
2009.<br />
167 UN-Habitat. (2011). State of the <strong>Cities</strong> Background<br />
Report: Saudi <strong>Arab</strong>ia. Nairobi: UN-Habitat.<br />
168 Jeddah Municipality (2009), Jeddah Strategic Plan.<br />
‘Urban Land Use Patterns’, p.41.<br />
169 UN-Habitat. (2011). State of the <strong>Cities</strong> Background<br />
Report: Saudi <strong>Arab</strong>ia. Nairobi: UN-Habitat.<br />
170 Abu Dhabi, Department of Transport (2009)<br />
171 El Shammaa, D., ‘Capital will invest $68b in transport’.<br />
Gulf News, April 22, 2010. Retrieved Jan. 26,<br />
2011.<br />
172 Government of Abu Dhabi, Department of Transport<br />
(2009), Surface Transport Master Plan: A Vision for<br />
Connecting Abu Dhabi, pp.49-50. Retrieved Jan. 26,<br />
2011.<br />
173 Jeddah Municipality. “Jeddah Strategic Plan:<br />
Transport.” Jeddah Municipality. 2009<br />
174 World Health Organization. “Global Status Report on<br />
Road Safety: Time for Action.” Geneva: World Health<br />
Organization, 2009.<br />
175 Central Informatics Organization, Bahrain in Figures<br />
2007-2008. Retrieved November 8, 2010.<br />
176 Central Statistical Office, Annual Statistical Abstract<br />
2008, p.204. Retrieved Oct. 30, 2010. (Release<br />
Sector>Statistics Publishing> General Statistics><br />
Annual Statistical Abstract> Statistical Abstract<br />
2008.)<br />
177 Jeddah Municipality. “Jeddah Strategic Plan:<br />
Transport.” Jeddah Municipality. 2009<br />
178 Janahi, S., ‘Road accidents down 29% in Dubai as<br />
awareness drive makes impact’. Gulf News, Oct. 31,<br />
2010.<br />
179 Kuwait Times, ‘Consumption of water at highest<br />
levels’. September 07, 2010. Retrieved October<br />
30, 2010 at: Hajeeh, M., ‘Water conservation in<br />
Kuwait: a fuzzy analysis approach’. Paper presented<br />
at SIGEF 2006: The XIII Congress of International<br />
Association for Fuzzy-Set Management and Economy,<br />
held in Hammamet, Tunisia from Nov. 30 to Dec. 2.<br />
Reproduced in the Journal of Industrial Engineering<br />
International, Jan. 2010, 6(10): 90-105.<br />
180 UAE, National Bureau of Statistics. Retrieved<br />
January 26, 2011.<br />
181 Ministry of National Economy. Retrieved November<br />
19, 2010.<br />
182 Bahrain Central Informatics Organization, 2008<br />
Statistical Abstract. Retrieved Nov. 8, 2010.<br />
183 Ministry of Economy and Planning; UNDP; UNDESA.<br />
“Kingdom of Saudi <strong>Arab</strong>ia: Millennium Development<br />
Goals Report 5: 2010.” MEP; UNDP; UNDESA. 2010<br />
184 Jeddah Municipality (2009), Jeddah Strategic Plan.<br />
‘Infrastructure’, p.261. Retrieved October 30, 2010.<br />
185 “Sector Briefing: Environment Opportunities in Saudi<br />
<strong>Arab</strong>ia.” UK Trade & Investment, Sept. 2010.<br />
186 Ministry of Economy and Planning; UNDP; UNDESA.<br />
“Kingdom of Saudi <strong>Arab</strong>ia: Millennium Development<br />
Goals Report 5: 2010.” MEP; UNDP; UNDESA. 2010<br />
187 Jeddah Municipality (2009), Jeddah Strategic Plan.<br />
‘Infrastructure’, p.259.<br />
188 Global Water Intelligence. “Market Profile: the 2005<br />
GWI Water Tariff Survey.” Global Water Intelligence,<br />
2005.<br />
189 Hajeeh, M., ‘Water conservation in Kuwait: a fuzzy<br />
analysis approach’. Paper presented at SIGEF<br />
2006: The XIII Congress of International Association<br />
for Fuzzy-Set Management and Economy, held<br />
in Hammamet, Tunisia from November 30 to<br />
December 2. Reproduced in the Journal of Industrial<br />
Engineering International, January 2010, 6 (10):<br />
90-105. Retrieved October 30, 2010.<br />
190 World Bank. “Making the Most of Scarcity:<br />
181
182<br />
ENDNOTES<br />
Accountability for Better Water Management Results<br />
in Middle East and North Africa.” Washington, D.C.:<br />
World Bank, 2007.<br />
191 Jeddah Municipality (2009), Jeddah Strategic Plan.<br />
‘Infrastructure’, p.260. Retrieved October 30, 2010.<br />
192 Emirates 24/7, ‘UAE desalination plant spending to<br />
jump 300%’. October 12, 2010. Retrieved January 26,<br />
2011.<br />
193 The Peninsula, ‘Farmers abandon land due to water<br />
salinity’. July 29, 2008. Retrieved November 24,<br />
2010.<br />
194 UN-Habitat. (2011). State of the <strong>Cities</strong> Background<br />
Report: Saudi <strong>Arab</strong>ia. Nairobi: UN-Habitat.<br />
195 Global Water Intelligence. “Market Profile: the 2005<br />
GWI Water Tariff Survey.” Global Water Intelligence,<br />
2005.<br />
196 McGinley, S., ‘Dubai water and electricity costs to<br />
rise around 15% in 2011’. <strong>Arab</strong>ian Business, Dec. 9,<br />
2010.<br />
197 Global Information and Early Warning System<br />
for Food and Agriculture. “Saudi <strong>Arab</strong>ia.” FAO. 3<br />
February 2011.<br />
198 Tolba, M.K. and N.W. Saab. “<strong>Arab</strong> Environment<br />
Future Challenges.” Report of the <strong>Arab</strong> Forum for<br />
Environment and Development, 2008.<br />
199 Abu Dhabi Urban Planning Council (2007), Plan Abu<br />
Dhabi 2030: Urban Structure Framework Plan, p.33.<br />
200 Statistics Center – Abu Dhabi (2010), Statistical<br />
Yearbook of Abu Dhabi 2010, p.283.<br />
201 Al-Awadhi, J., Misak, R. & Omar, S. (2003), ‘Causes<br />
and consequences of desertification of Kuwait:<br />
a case study of land degradation’. Bulletin of<br />
Engineering Geology and the Environment, 62 (2):<br />
107-115. <strong>Arab</strong> Times, ‘Temperature rise above global<br />
average: Kuwait must be more concerned about<br />
phenomenon than rest of the world’. Feb. 15, 2010.<br />
202 Al-Rashidi, T., El-Gamily, H., Amos, C. & Rakha, K.,<br />
‘Sea surface temperature trends in Kuwait Bay,<br />
<strong>Arab</strong>ian Gulf’. Natural Hazards, 50 (1): 73-82.<br />
203 Tolba, M.K. and N.W. Saab, 2009.<br />
204 State of Kuwait. “Kuwait Country Report on The<br />
Millennium Development Goals: Achievements and<br />
Challenges 2010.” UNDP; General Secretariat for the<br />
Supreme Council on Development Planning. 2010.<br />
205 <strong>Arab</strong> Forum for Environment and Development<br />
(2009), <strong>Arab</strong> Environment Climate Change: Impact of<br />
Climate Change on <strong>Arab</strong> Countries, p.36.<br />
206 Tolba, M.K. and N.W. Saab, 2009.<br />
207 Gulf Daily News, ‘Build barriers to hold back sea.’<br />
May 18, 2009. Retrieved November 8, 2010 at:<br />
208 Baby, S., ‘Sea barriers’. Gulf Daily News, May 24,<br />
2010. Retrieved November 8, 2010 at:<br />
209 Hemming D., Betts R., and D. Ryall. 2007. Environmental<br />
Stresses from Detailed Climate Model Simulations<br />
for the Middle East and Gulf region. Report<br />
completed by the Met Office Hadley Center for UK<br />
Ministry of Defence project ‘Defence and Security<br />
Implications of Climate Change.’ As cited in, Brown,<br />
O. and A. Crawford. “Rising Temperatures, Rising<br />
Tensions: Climate Change and the Risk of Violent<br />
Conflict in the Middle East.” Winnipeg: International<br />
Institute for Sustainable Development, 2009.<br />
210 Environment Agency – Abu Dhabi (2009), Climate<br />
Change: Impacts, Vulnerability and Adaption, p.14.<br />
Retrieved Jan. 26, 2011.<br />
211 Environment Agency – Abu Dhabi (2009), Climate<br />
Change: Impacts, Vulnerability and Adaption, p.49.<br />
212 Abu Dhabi Urban Planning Council (2007), Plan Abu<br />
Dhabi 2030: Urban Structure Framework Plan, p.34.<br />
213 Abu Dhabi Urban Planning Council (2007), Plan<br />
Abu Dhabi 2030: Urban Structure Framework Plan,<br />
pp.166-167.<br />
214 Khaleej Times. ‘Importance of climate change to<br />
Oman coastline highlighted’. Aug. 1, 2010.<br />
215 Azaz, L.K. (2010), ‘Using remote sensing and GIS<br />
for damage assessment after flooding, the case of<br />
Muscat, Oman, after Gonu tropical cyclone 2007:<br />
urban planning perspective’. REAL CORP 2010<br />
Proceedings, Tagungsband, Vienna, 18-20 May 2010.<br />
Retrieved November 19, 2010.<br />
216 UN-Habitat Global Urban Observatory as cited in UN-<br />
Habitat, State of the World <strong>Cities</strong> 2008/09. Nairobi:<br />
UN-Habitat, 2009.<br />
217 Shah, M. “Gulf Cooperation Council Food Security:<br />
Balancing the Equation.” April 25, 2010.<br />
218 World Bank. “Improving Food Security in <strong>Arab</strong><br />
Countries.” Washington, D.C.: World Bank, 2009.<br />
219 Hall, C. and S. Vivian. “Bahrain’s King Orders<br />
Increase in Main Food Subsidies.” Bloomberg. Feb.<br />
3, 2011.<br />
220 Food and Agriculture Organization of the United<br />
Nations. 2011. FAO Food Price Index. Rome: FAO.<br />
221 “UAE Has Over 2,800 sq km in Sudan Farms.”<br />
Emirates 24/7, Oct. 13, 2010.<br />
222 Woertz, E. “The GCC, Food Security and Overseas<br />
Agro-Investments.” June, 2009.<br />
223 Taib Research. “Qatar Electricity and Water<br />
Company.” GCC First Reaction Report, April 30, 2009.<br />
224 World Bank Development Indicators database<br />
225 UAE Interact, ‘UAE keen to cut energy demand’.<br />
November 18, 2010.<br />
226 Ouroussoff, N., ‘In <strong>Arab</strong>ian Desert, a Sustainable City<br />
Rises’. New York Times, September 25, 2010.<br />
227 UNDP, ‘Regional consultative meeting on “Towards<br />
sustainable energy” under UNDP’s “<strong>Arab</strong> resilience<br />
initiative”’. October 6-7, 2010.<br />
228 Qatar Statistics Authority/Permanent Population<br />
Committee (2010), Sustainable Development<br />
Indicators in the State of Qatar, p.57. Tolba, M.K. and<br />
N.W. Saab. “<strong>Arab</strong> Environment Future Challenges.”<br />
Report of the <strong>Arab</strong> Forum for Environment and<br />
Development, 2008.<br />
229 Tolba, M.K. and N.W. Saab, 2008.<br />
230 Tolba, M.K. and N.W. Saab, 2008.<br />
231 Tolba, M.K. and N.W. Saab, 2008.<br />
232 Dubai Statistics Center, Socio-Demographic<br />
Indicators Bulletin- Dubai 2007.<br />
233 Blackman, S., ‘Construction waste destroys Bahrain’s<br />
coral reef’. Construction Week Online, June 15, 2010.<br />
234 Khaleej Times, ‘Dubai plans waste-to-energy<br />
project’. September 28, 2010.<br />
235 Al-Sahhaf, N.A., (2000), The use of remote sensing<br />
and geographic information system technologies to<br />
detect, monitor, and model urban change in Riyadh,<br />
Saudi <strong>Arab</strong>ia, p.150. Unpublished thesis of University<br />
of California, Santa Barbara, California.<br />
236 Sambidge, A., ‘Doha traffic congestion is main<br />
concern – survey’. <strong>Arab</strong>ian Business, March 20,<br />
2010.<br />
237 Jeddah Municipality (2009), Jeddah Strategic Plan.<br />
‘Urban Territory and Land Use Patterns’, p,63.<br />
238 UNDP-Kingdom of Saudi <strong>Arab</strong>ia. “Launch of Urban<br />
Planning Programme.” Aug. 28, 2010.<br />
239 UN-Habitat. (2011). State of the <strong>Cities</strong> Background<br />
Report: Saudi <strong>Arab</strong>ia. Nairobi: UN-Habitat.<br />
240 UN-Habitat. (2011). State of the <strong>Cities</strong> Background<br />
Report: Saudi <strong>Arab</strong>ia. Nairobi: UN-Habitat.<br />
241 UN-Habitat. (2011). State of the <strong>Cities</strong> Background<br />
Report: Saudi <strong>Arab</strong>ia. Nairobi: UN-Habitat.<br />
242 Mubarak, F. (2004), ‘Urban growth boundary policy<br />
and residential suburbanisation: Riyadh, Saudi<br />
<strong>Arab</strong>ia’.<br />
243 UN Human Rights Council (2009), Promotion<br />
and protection of all human rights, civil, political,<br />
economic, social, and cultural human rights,<br />
including the right to development: mission to Saudi<br />
<strong>Arab</strong>ia. Presented at the 11 th session of the Human<br />
Rights Council.<br />
244 Freedom House (2010), ‘Freedom in the World 2010:<br />
Saudi <strong>Arab</strong>ia’.<br />
245 Al-Najjar, S.M. Country Reports: Oman. Chapter in<br />
Women’s Rights in the Middle East and North Africa:<br />
Citizenship and Justice Special Report. Washington,<br />
D.C.: Freedom House, 2010.<br />
246 UNDP-POGAR. “Elections: Qatar.”<br />
247 The Permanent Population Committee (2010),<br />
Annual Report 2009, p17.<br />
248 UNDP. “Local Government: Bahrain.”<br />
249 Kingdom of Bahrain (2002), Decree-Law No. (17).<br />
250 UNDP. “Local Government: Bahrain.”<br />
251 Bahrain Economic Development Board (2008), From<br />
Regional Pioneer to Global Contender: the Economic<br />
Vision 2030 for Bahrain.<br />
252 Freedom House. “Country Report: Bahrain.”<br />
Countries at the Crossroads 2010. Department of<br />
State, United States Government (2010), 2009<br />
Human Rights Report: Bahrain.<br />
253 Freedom House. “Country Report: Bahrain.”<br />
Countries at the Crossroads 2010.<br />
254 UN POGAR. “Local Government: United <strong>Arab</strong><br />
Emirates.”<br />
255 UN POGAR. “Local Government: United <strong>Arab</strong><br />
Emirates.”<br />
256 Freedom House. Freedom in the World 2010, United<br />
<strong>Arab</strong> Emirates.<br />
257 Mubarak, F. (2004), ‘Urban growth boundary policy<br />
and residential suburbanisation: Riyadh, Saudi<br />
<strong>Arab</strong>ia’.<br />
258 UN POGAR. “Local Government: United <strong>Arab</strong><br />
Emirates.”<br />
259 United States Government, Department of State,<br />
2009 Human Rights Report: Kuwait. Mar. 11, 2010.<br />
260 Human Rights Watch (2009), “The Island of<br />
Happiness”: Exploitation of Migrant Workers on<br />
Saadiyat Island, Abu Dhabi, pp.4-5.<br />
261 Department of State, United States Government<br />
(2010), Human Rights Report 2009: Qatar.<br />
262 Al-Najjar, S.M. Country Reports: Oman. Chapter in<br />
Women’s Rights in the Middle East and North Africa:<br />
Citizenship and Justice Special Report. Washington,<br />
D.C.: Freedom House, 2010.<br />
263 Doumato, E.A. “Saudi <strong>Arab</strong>ia.” Chapter in Women’s<br />
Rights in the Middle East and North Africa:<br />
Citizenship and Justice. Washington, D.C.: Freedom<br />
House, 2010.<br />
264 The Government of Abu Dhabi (2008), The Abu<br />
Dhabi Economic Vision 2030, p.37.<br />
265 United Nations / Kingdom of Bahrain (2010), Human<br />
Development Achievements of the Kingdom of<br />
Bahrain: a Ten Year Review.<br />
266 Freedom House, Inc. “Freedom in the World 2010:<br />
Bahrain.” Freedom House, Inc. 2010.<br />
267 Freedom House, Inc. “Freedom in the World 2010:<br />
Oman.” Freedom House, Inc. 2010.<br />
268 Doumato, E.A. “Saudi <strong>Arab</strong>ia.” Chapter in Women’s<br />
Rights in the Middle East and North Africa:<br />
Citizenship and Justice. Washington, D.C.: Freedom<br />
House, 2010.<br />
269 Freedom House (2010), ‘Freedom in the World 2010:<br />
Saudi <strong>Arab</strong>ia.’<br />
270 World Bank Development Indicators<br />
271 World Bank Development Indicators<br />
272 Migration.”Middle East: GCC, SA, UAE.” UC Davis.<br />
January 2009.<br />
273 UN DESA, Trends in international migrant stock: the<br />
2008 revision.<br />
274 United Nations, Department of Economic and Social<br />
Affairs, Population Division (2009). International<br />
Migration, 2009 Wallchart (United Nations<br />
publication, Sales No. E.09.XIII.8).<br />
275 International Organization for Migration. Bahrain<br />
Facts and Figures.
ENDNOTES<br />
276 ITUC CSI IGB (2009), 2009 Annual Survey of<br />
violations of trade union rights – Saudi <strong>Arab</strong>ia.<br />
277 High Commission for the Development of Arriyadh.<br />
278 World Bank (2009), 2008 Economic Development<br />
and Prospects: MENA Region.<br />
279 Central Statistical Office, Annual Statistical<br />
Abstract 2008. Release Sector>Statistics<br />
Publishing> General Statistics> Annual Statistical<br />
Abstract> Statistical Abstract 2008.<br />
280 Central Department of Statistics and Information.<br />
281 Human Rights Watch (2010), Walls at Every Turn.<br />
Kuwait Times, ‘Latest population and the labor<br />
force’. May 16, 2010.<br />
282 Kuwait Times, ‘Latest population and the labor<br />
force’. May 16, 2010.<br />
283 Human Rights Watch (2010), World Report 2011,<br />
pp.597-599.<br />
284 IANS, ‘Bahrain labor camps unsafe: India, Pakistan<br />
diplomats’. August 22, 2008. The Times of India, ’16<br />
Indians killed in Bahrain’. July 30, 2006. Millington,<br />
B., ‘Camp conditions in Bahrain questioned’.<br />
ConstructionWeekOnline, March 28, 2009.<br />
285 Human Rights Watch (2009), “The Island of<br />
Happiness: Exploitation of Migrant Workers on<br />
Saadiyat Island, Abu Dhabi”, p.6.<br />
286 Ellis, E., ‘Dubai’s rags-to-riches miracle built on the<br />
toil of exploited foreign workers’. The Age, February<br />
9, 2008.<br />
287 Human Rights Watch (2008), “As If I Am Not<br />
Human”: abuses against Asian domestic workers in<br />
Saudi <strong>Arab</strong>ia.”<br />
288 Silvey, R. (2008), ‘In the margins of Riyadh:<br />
Indonesian domestic workers in Saudi <strong>Arab</strong>ia’, pp.<br />
283-300 in Price, M. and Benton-Short, L.<br />
(Eds.), Migrants to the Metropolis: The Rise of<br />
Immigrant Gateway <strong>Cities</strong>. Syracuse, NY: Syracuse<br />
University Press.<br />
289 Trade<strong>Arab</strong>ia, ‘Bahrain plans “labor town” for<br />
workers’. April 3, 2010.<br />
290 Abu Dhabi Urban Planning Council (2007), Plan Abu<br />
Dhabi 2030: Urban Structure Framework Plan, p.159.<br />
291 Freedom House. 2010 Country Report – Qatar.<br />
292 Hasan, O., ‘Kuwait MPs pass privatisation law,<br />
exclude energy production’. AFP, May 12, 2010.<br />
293 Kingdom of Saudi <strong>Arab</strong>ia, Ministry of Economy and<br />
Planning. “Brief Report on the Ninth Development<br />
Plan 2010-2014.” Riyadh, 2010.<br />
294 Oman Ministry of Information. “Omanisation Policy.”<br />
295 Bahrain Economic Development Board. “Economic<br />
Vision 2030.” Bahrain, 2008.<br />
296 Winckler, Onn. “Labor Migration to the GCC States:<br />
Patterns, Scales, and Policies.” Middle East Institute<br />
Viewpoints. Feb. 2010.<br />
297 Mahdi, M. “Bahrain Ends Sponsor System.” The<br />
National, May 5, 2009.<br />
298 Human Rights Watch (2010), Slow Reform:<br />
Protection of Migrant Domestic Workers in Asia and<br />
the Middle East.<br />
299 Human Rights Watch (2010), Slow Reform: Protection<br />
of Migrant Domestic Workers in Asia and the<br />
Middle East.<br />
300 National Bureau of Statistics (2010), Analytical<br />
Report on Economic and Social Dimensions in the<br />
United <strong>Arab</strong> Emirates 2009, pp.57-58.<br />
301 Toumi, H., ‘Qatar considers move to secure financial<br />
protection for laborers’. Gulf News, October 5, 2010.<br />
302 Toumi, M., ‘Qatar to draft law on domestic workers’.<br />
Gulf News, Nov. 23, 2010. Retrieved November 24,<br />
2010.<br />
303 Human Rights Watch (2010), Slow Reform:<br />
protection of migrant domestic workers in Asia and<br />
the Middle East.<br />
304 United Nations, Department of Economic and Social<br />
Affairs, Population Division (2009). International<br />
Migration, 2009 Wall Chart (United Nations<br />
publication, Sales No. E.09.XIII.8).<br />
305 UNHCR. “As Fighting Escalates in Mogadishu,<br />
Deportations to the Capital Continue.” Jul. 30, 2010.<br />
306 IOM. “Increasing Numbers of Stranded Migrants<br />
Dying on Yemeni-Saudi Border.” Mar. 12, 2010.<br />
307 United States Government, Department of States<br />
(2010), 2009 Human Rights Report: 2009.<br />
308 Southwick, K. and M. Lynch. “Nationality Rights<br />
for All: a Progress Report and Global Survey on<br />
Statelessness.” Washington, D.C.: Refugees<br />
International, 2010.<br />
309 Freedom House. “Freedom in the World 2010, United<br />
<strong>Arab</strong> Emirates”.<br />
310 Department of State, United States Government,<br />
‘2009 Human Rights Report: Saudi <strong>Arab</strong>ia’. Mar. 11,<br />
2010.<br />
311 Sorel, M., ‘Statelessness in Kuwait: Kuwait’s bidoon’.<br />
Foreign Policy Digest, June 2010.<br />
312 Refugees International , ‘Kuwait: Still Stalling on<br />
Statelessness’. May 11, 2010.<br />
313 Department of State, United States Government<br />
(2010), 2009 Human Rights Report: Bahrain.<br />
314 Naufal, G., and A. Termos. “Remittances from<br />
the GCC: a Brief Outlook.” Middle East Institute<br />
Viewpoints. Feb. 2010.<br />
315 World Bank Development Indicators Database<br />
316 World Bank. Migration and Remittances Factbook,<br />
2008. Washington, D.C.: World Bank, 2008.<br />
317 Qatar Statistics Authority/Permanent Population<br />
Committee (2010), Sustainable Development<br />
Indicators in the State of Qatar, p.46.<br />
318 Naufal, G., and A. Termos. “Remittances from<br />
the GCC: a Brief Outlook.” Middle East Institute<br />
Viewpoints. 2010. The Hawala system in an informal<br />
network used by many migrant workers to transfer<br />
funds.<br />
319 World Bank. “Economic Integration in the GCC.”<br />
Washington, D.C.: World Bank, 2010.<br />
320 World Bank. “Economic Integration in the GCC.”<br />
Washington, D.C.: World Bank, 2010.<br />
321 Future Urban Development in Kuwait: an overview<br />
of the third Kuwait master plan review. Presentation<br />
at the Planning Sustainable <strong>Arab</strong> <strong>Cities</strong> Networking<br />
Event, World Urban Forum V, Rio de Janeiro, March<br />
22, 2010.<br />
322 International Airport Review, ‘Creating a Bright<br />
Future’, Air Port Profile. Issue 4, 2008.<br />
323 World Bank. “Economic Integration in the GCC.”<br />
Washington, D.C.: World Bank, 2010.<br />
324 World Bank. “Economic Integration in the GCC.”<br />
Washington, D.C.: World Bank, 2010.<br />
325 World Bank. “Economic Integration in the GCC.”<br />
Washington, D.C.: World Bank, 2010.<br />
326 Halabi, S. “Running out of Steam.” Executive<br />
Magazine, July 2, 2010.<br />
327 Bitar, Z. “Gulf Rail Network Awaits Approval.”<br />
Zawya, December 1, 2010.<br />
328 “Gulf Rail Network ‘Will Start in 2017.’” The Saudi<br />
Gazette, January 10, 2009.<br />
329 Ministry of National Economy (2010), Economic<br />
Review 2009, p.22.<br />
330 Qatar Statistics Authority, 2010 census. Sourced at<br />
Qatar Information Exchange. Retrieved November<br />
24, 2010.<br />
331 Qatar Statistics Authority, 2010 census. Sourced at<br />
Qatar Information Exchange. Retrieved November<br />
24, 2010.<br />
332 Bahrain Economic Development Board. Retrieved<br />
November 8, 2010 at: http://www.bahrainedb.com/<br />
quarterly-review.aspx<br />
333 Bahrain Economic Development Board. Retrieved<br />
November 8, 2010 at: http://www.bahrainedb.com/<br />
quarterly-review.aspx<br />
334 National Bureau of Statistics, Employment, Wages<br />
and Hours of Work Survey 2008. Retrieved January<br />
26, 2011 at: http://www.uaestatistics.gov.ae:85/<br />
default.aspx<br />
335 UN-Habitat. (2011). State of the <strong>Cities</strong> Background<br />
Report: Saudi <strong>Arab</strong>ia. Nairobi: UN-Habitat, data from<br />
2009.<br />
336 2008. Saudi Statistical Annex. Get full citation.<br />
337 Sambidge, A., ‘Expat remittances from Qatar soar to<br />
nearly $7 bn’. <strong>Arab</strong>ian Business, Jul. 27, 2010.<br />
338 Qatar Statistics Authority/Permanent Population<br />
Committee (2010), Sustainable Development<br />
Indicators in the State of Qatar, p.46. Retrieved<br />
November 24, 2010.<br />
183
184<br />
CHAPTER FIVE<br />
THE STATE OF SOUTHERN TIER CITIES<br />
Juba, South Sudan. South Sudan will have to make up for thirty years of postponed urbanization. ©Frontpage/Shutterstock
5.1<br />
The Southern Tier countries of Comoros, Djibouti,<br />
Somalia, Sudan 1 and Yemen are home to approximately<br />
80 million people.<br />
Sudan represents over 50 per cent of that population with<br />
44 million inhabitants and Yemen is the next largest with 25<br />
million. 2 In recent years, total population growth rates have<br />
been relatively high to moderate (2 to 3 per cent) but it is<br />
anticipated that they will decline by 2030.<br />
With the exception of Somalia, the total population growth<br />
rates have been declining quite rapidly since the early to mid<br />
1980s. The fluctuations recorded in population growth are<br />
indicative of the absence of reliable information and the<br />
difficult field conditions that hamper enumeration. Political<br />
instability and civil strife further complicate matters.<br />
The Southern Tier countries’ population is very young,<br />
with 35 to 45 per cent under the age of 14. In Somalia, they<br />
accounted for 44.9 per cent of the population in 2010. 3<br />
This underscores the region’s need to create employment<br />
opportunities and meet large demands for housing,<br />
infrastructure and public services for expectant high<br />
household formation rates.<br />
The Southern Tier countries have low to moderate levels<br />
of urbanization (30-40 per cent) with the notable exception<br />
of Djibouti where 76 per cent of the population lives in<br />
and on the periphery of Djibouti City (estimates vary<br />
from approximately 60 to 80 per cent of the total urban<br />
population). 4<br />
Urban population growth in the Southern Tier countries<br />
has been moderate to high. Most urban areas have been<br />
FIGURE 53: PERCENTAGE OF URBAN POPULATION<br />
100<br />
90<br />
80<br />
70<br />
60<br />
50<br />
40<br />
30<br />
20<br />
10<br />
0<br />
Population and Urbanization<br />
Comoros<br />
Source: UN-DESA, 2008 and 2009<br />
Djibouti<br />
Somalia<br />
expanding at around 2 to 5 per cent. In recent years, Djibouti<br />
has experienced the lowest rate at just under 2 per cent,<br />
primarily because of its already high rate of urbanization<br />
(76.2 per cent in 2010). In the past decade, urban growth<br />
was highest in Yemen (around 5 per cent) and Sudan<br />
(approximately 4 per cent). With the exception of Somalia<br />
and Comoros, urban growth rates have been declining and are<br />
projected to continue to fall. In Comoros, however, they will<br />
likely increase through 2030. In Somalia they will be in the<br />
order of 4 per cent. 5<br />
With the exception of Somalia, urban growth rates were<br />
highest in the period of 1980-1990 and have declined sharply<br />
since then. In Djibouti, growth peaked in the mid- to late-<br />
1980s when a large informal settlement on the perimeter<br />
of Djibouti City was incorporated into the city boundary. 6<br />
Yemen experienced its highest rate of growth from 1990-1995,<br />
shortly after the country was unified. Comoros witnessed a<br />
peak just after independence in 1975.<br />
Southern Tier large cities have been growing at moderate to<br />
high rates and are expected to continue to expand at around<br />
3-4 per cent. 7<br />
Urban Concentrations<br />
The sub-region’s rapid urbanization has been driven by<br />
conflict, environmental degradation and rural poverty. With<br />
the exception of Djibouti, where most of the population<br />
lives in the capital city, 8 most of the region’s population still<br />
lives in rural areas. 9<br />
Sudan<br />
Yemen<br />
1990<br />
1995<br />
2000<br />
2005<br />
2010<br />
2015<br />
2020<br />
2025<br />
2030<br />
185
186<br />
FIGURE 54: ANNUAL URBAN GROWTH RATES<br />
8<br />
7<br />
6<br />
5<br />
4<br />
3<br />
2<br />
1<br />
0<br />
Source: UN-DESA, 2009<br />
FIGURE 55: URBAN POPULATION (IN ‘000S)<br />
35,000<br />
30,000<br />
25,000<br />
20,000<br />
15,000<br />
10,000<br />
5,000<br />
0<br />
Comoros<br />
Source: UN-DESA, 2008 and 2009<br />
FIGURE 56: ANNUAL TOTAL POPULATION GROWTH RATES<br />
5<br />
4<br />
3<br />
2<br />
1<br />
0<br />
-1<br />
1990<br />
Comoros<br />
Source: UN-DESA, 2008<br />
1995<br />
Djibouti<br />
2000<br />
Djibouti<br />
2005<br />
Somalia<br />
2010<br />
Somalia<br />
2015<br />
Sudan<br />
Sudan<br />
2020<br />
2025<br />
Yemen<br />
Yemen<br />
2030<br />
1990-1995<br />
1995-2000<br />
2000-2005<br />
2005-2010<br />
2010-2015<br />
2015-2020<br />
2020-2025<br />
2025-2030<br />
Comoros<br />
Djibouti<br />
Somalia<br />
Sudan<br />
Yemen<br />
1990-1995<br />
1995-2000<br />
2000-2005<br />
2005-2010<br />
2010-2015<br />
2015-2020<br />
2020-2025<br />
2025-2030
FIGURE 57: TOTAL POPULATION (IN ‘000S)<br />
70,000<br />
65,000<br />
60,000<br />
55,000<br />
50,000<br />
45,000<br />
40,000<br />
35,000<br />
30,000<br />
25,000<br />
20,000<br />
15,000<br />
10,000<br />
5,000<br />
0<br />
1990<br />
Source: UN-DESA, 2008 and 2009<br />
1995<br />
2000<br />
2005<br />
2010<br />
In Sudan, severe drought, civil strife, mechanised<br />
agricultural schemes and better economic opportunities in<br />
the cities have all been key drivers of rapid urbanization. 10<br />
Limited infrastructure, poor transport and the vast size of<br />
Sudan have resulted in a concentration of urban growth in the<br />
capital and a few regional centres. 11 Khartoum has expanded<br />
significantly over the past century: 250 times in area and 114<br />
times in population. It is a sprawling city with a population<br />
density of 163 persons per km 2 (2004). 12<br />
In the Southern Sudan, the largest cities are Juba, Wau<br />
and Malakal. 13 They have expanded with the return of<br />
internally displaced people (IDPs) after the 2005 peace<br />
agreement. While the greatest urban concentrations have<br />
been in the Khartoum region and in the Northern provinces,<br />
the partition of the country into North and South Sudan<br />
will generate further population movements. The peace<br />
agreements have prompted the return of nearly 2 million<br />
migrants back to Southern Sudan. 14<br />
In Somalia, urbanization has been driven by conflict and<br />
environmental challenges. In the 1970s and 1980s, there<br />
was a mass movement of rural pastoralists to urban centres<br />
searching for economic opportunities. 15 As a result, the<br />
population of the major Somali towns have increased by 300<br />
to 500 per cent over the past 15 years. 16<br />
More recently, urban migration has been driven by<br />
civil strife and terrorist attacks. 17 The Afgooye Corridor,<br />
northwest of Mogadishu, has been receiving IDPs from<br />
Mogadishu throughout the conflict and is now the thirdlargest<br />
concentration within Somalia and the most denselypopulated<br />
area. 18<br />
Most of the country’s growth has been in the Somaliland<br />
region, the most stable part of the country where better<br />
economic opportunities have made it an attractive place<br />
to settle in the midst of the violence and environmental<br />
2015<br />
2020<br />
2025<br />
2030<br />
degradation in the surrounding areas. The trade routes from<br />
Berbera to Ethiopia and the international airport in Hargeisa<br />
have contributed to the area’s economic development and<br />
it is expected that the area will continue to expand through<br />
natural increase and in-migration. 19 Similarly, the Puntland<br />
region attracted displaced populations from other areas during<br />
civil war and has urbanised rapidly, stressing the capacity of<br />
Bosasso’s infrastructure and services. 20 (See also The State of<br />
African <strong>Cities</strong> 2010, p.146, free pdf download available from<br />
www.unhabitat.org).<br />
In Yemen, rapid population growth over the past four<br />
decades and limited rural development has increased ruralurban<br />
migration, especially to the larger cities. Unplanned<br />
urban expansion has accelerated and pressures on the<br />
provision of services have increased, particularly in Sana’a. 21<br />
The municipality’s population increased more than tenfold in<br />
less than three decades, from 162,000 in 1977 to 1.7 million<br />
in 2004. Much of this expansion has been in through informal<br />
settlements on the city’s periphery. 22<br />
Plans to Manage Urban Growth<br />
Comoros<br />
Djibouti<br />
Somalia<br />
Sudan<br />
Yemen<br />
Most of the Southern Tier countries do not have<br />
comprehensive national or urban spatial strategies to manage<br />
growth, although they are likely to have poverty reduction<br />
strategies that include such objectives as economic growth,<br />
better governance and mechanisms for increasing human<br />
capital. Many also have infrastructure improvement plans<br />
to promote economic development in the ports and major<br />
urban centres as in the Comoros and Djibouti. Only some<br />
countries have developed master plans at the city level.<br />
In Djibouti, the challenge is to balance the growth and<br />
development of the capital city with other areas in the country.<br />
Djibouti has a strategic plan to shift a portion of the urban<br />
187
188<br />
<br />
Street scene in Mogadishu, Somalia. ©Mohamed Amin Jibril/IRIN<br />
population from Djibouti City to secondary cities. 23 Plans for<br />
the regions, sub-regions and localities are to be prepared to<br />
further this objective. 24<br />
The government is currently undertaking a comprehensive<br />
review of the plan for Djibouti City as part of its next fiveyear<br />
integrated urban strategy. Its purpose is to provide<br />
better access and infrastructure services in the city and its<br />
periphery, improve local governance and civic participation,<br />
and create public spaces and parking. 25<br />
In Somalia, UN-Habitat is currently developing a<br />
Mogadishu Community-Based District Rehabilitation<br />
and Upgrading Programme, with a planned three- to<br />
five-year timeframe, incorporating housing development,<br />
urban improvement, basic service provision, resettlement<br />
of returnees, economic recovery and job creation,<br />
neighbourhood protection and grassroots reconciliation. 26<br />
In Hargeisa, Somaliland, the government has developed<br />
an integrated urban strategy, highlighting challenges and<br />
outlining programs to promote development and organized<br />
growth. 27<br />
Historically, urban planning in Sudan has been focused<br />
primarily on Khartoum. 28 The most recent urban plan for<br />
greater Khartoum was prepared in 2007 and focuses on the<br />
improvement of roads, public transport and services. Plans<br />
are also being created for provincial capitals. 29<br />
In 2006, the government launched the Village Development<br />
Strategy and Structural Plan for the Khartoum Governorate<br />
to increase the economic self-sufficiency of villages in order<br />
to reduce migration into the cities and to increase food<br />
production. The scheme will elevate villages to locality status<br />
and provide land for their expansion depending over a 10year<br />
development forecast. Each of the 538 villages in the<br />
region would ultimately be connected to Khartoum by a<br />
network of roads. 30<br />
In South Sudan, the challenge of providing housing to the<br />
influx of returnees following the 2005 peace agreement has<br />
prompted local governments to prepare growth management<br />
plans. While most cities have planned urban extensions,<br />
Unity State has developed a 2006-2025 comprehensive<br />
structure plan focussing on housing returnees in an integrated<br />
functional and economic hierarchy of towns and villages.<br />
As part of the Integrated Urban Development Project,<br />
started in 2009 with support from the World Bank, Yemen’s<br />
national government will develop a national plan for<br />
urban development that will be implemented by the local<br />
authorities. The plan aims to improve the living conditions<br />
of slum dwellers and squatters. 31 In addition, the World Bank<br />
is currently supporting a Second Port <strong>Cities</strong> Development<br />
Project to improve the port cities of Aden, Hodeida and<br />
Mukallah. 32 Beginning in Aden, the project initially focuses<br />
on small-scale infrastructure improvements to foster small<br />
business activity and create transport connections. 33<br />
An Integrated Urban Development Project is being<br />
prepared for the city of Taiz, where the proportion of<br />
informal settlements is particularly high, to upgrade the<br />
settlements and improve the delivery of services. 34 In Sana’a,<br />
the government has prepared a city development strategy that<br />
identifies planning challenges and makes recommendations<br />
for its economic development, enhance urban planning and<br />
improve financial management. 35
5.2<br />
The Growing Economic Role of <strong>Cities</strong><br />
In comparison to the remainder of the <strong>Arab</strong> world, the<br />
economic activities in the Southern Tier tend to be more<br />
rural, with the exception of Djibouti, per capita GDPs<br />
are lower and there is a higher incidence of poverty. GDP<br />
growth rates vary significantly by country. Djibouti and<br />
Sudan have experienced the highest rate of economic growth<br />
at around 4 to 5 per cent while other countries are growing<br />
at more moderate rates. Comoros has been expanding most<br />
slowly due to political instability and a slow recovery from the<br />
recent financial crisis. In Sudan, the high growth rate can be<br />
attributed to increases in oil production and expansion in the<br />
non-oil sectors.<br />
Economic activities differ across the Southern Tier countries.<br />
The economies of Comoros and Somalia are dominated by<br />
agriculture, fisheries and services, whereas Djibouti focuses on<br />
transportation, communications, trade and services. Sudan<br />
extracts much of its income from oil resources. In Yemen,<br />
services make up the largest segment of the economy (53 per<br />
cent), followed by industry (approximately 39 per cent), but<br />
employment in agriculture and herding employs more than<br />
75 per cent of the labour force. 36<br />
In Comoros, fishing and agriculture account for over 57<br />
per cent of employment 37 but services contributed 45.2 per<br />
cent of GDP in 2010. 38 Remittances from abroad play a<br />
significant part in household incomes. Most expatriates work<br />
in restaurants or caretaking, which have been secure during<br />
the financial crisis. 39<br />
Recently, government policy has emphasised developing<br />
the agricultural foods industry and the <strong>Arab</strong> Authority for<br />
Agricultural Investment and Development, with funding<br />
from the European Union, has invested in potato and banana<br />
planting. 40 There is also potential to expand the fishing<br />
industry but the existing port and processing infrastructure is<br />
inadequate. 41 The government recently received funding from<br />
the European Union to improve the institutional framework<br />
related to the fishing industry and has also signed an agreement<br />
with Japan to re-open the national fisheries school in Anjouan. 42<br />
To promote foreign trade and commerce within the islands,<br />
the government plans to upgrade the port in Ngazidja, which<br />
handles 80 per cent of the country’s commercial activities, and<br />
to dredge the ports of Mutsamudu and Moroni, 43 construct<br />
small fishing ports with proper storage facilities and increase<br />
security and management of port facilities. 44<br />
In Djibouti, the bulk of economic activities are concentrated<br />
in Djibouti City. With its strategic location between the Gulf<br />
of Aden and the Red Sea, along the main east-west shipping<br />
lane and its designation as a free trade zone, Djibouti City<br />
provides mostly transportation and communication services.<br />
Djibouti City serves as a refuelling and transhipment<br />
location and a transit port. 45 To expand existing activities<br />
and facilitate new growth, the government has invested in<br />
infrastructure to upgrade the port, improve the road network,<br />
particularly to Ethiopia and Eritrea. 46 The construction<br />
of a container terminal in Doraleh and the exploitation of<br />
geothermal energy from Lake Assal have attracted foreign<br />
direct investment. 47 In response to the decline in its port<br />
operations in 2010 as a result of the financial crisis, Djibouti<br />
is encouraging the development of the financial sector<br />
with legislation to improve regulation of banks, investing<br />
in tourism and providing tax and non-tax incentives for<br />
businesses to settle in Djibouti.<br />
Despite its investments in infrastructure, Djibouti’s<br />
economy is still constrained by the lack of own sources of<br />
energy and water. The supply of energy hovers around 57<br />
megawatts (MW), but the demand is 75 MV and could<br />
increase to 138 MW by 2015. To reduce its dependence<br />
on foreign oil, Djibouti is working with Ethiopia to import<br />
electricity and plans to develop its geothermal energy, which<br />
has significant potential. 48<br />
Somalia’s traditionally nomadic pastoral economy has<br />
been significantly disrupted by the civil war. The economic<br />
base of Somaliland, where most of the population is nomadic<br />
and depends on livestock, has been completely devastated<br />
and the lack of infrastructure, substantial illegal overfishing<br />
by foreign fleets and the dumping of toxic waste into some<br />
fishing areas 49 has prevented the development of the region’s<br />
potential for fishing.<br />
In Puntland, most of the workers are employed in the<br />
livestock sector. The drought and the resettlement of<br />
internally-displaced persons from the south have caused a<br />
rapid expansion of the region’s urban areas. In south central<br />
Somalia, most of the residents work in the agricultural,<br />
mining or livestock sectors. Armed conflict, the deterioration<br />
of infrastructure and insufficient investments have adversely<br />
affected the agricultural activities and caused migration to the<br />
cities and other parts of the country. 50<br />
In urban areas, 53.6 per cent of the population is<br />
economically active and mostly employed in services and<br />
industry. 51 Investments by United Nations operations in<br />
Somalia and the growth in remittances have generated more<br />
urban employment opportunities, even in the unstable areas<br />
of south central Somalia. Further expansion is expected to<br />
occur in telecommunications, airlines and trade as well as small<br />
manufacturing. 52 The private sector has made investments in<br />
roads, water supply, sanitation, ports and energy as well as<br />
education and health with support from the diaspora and<br />
Islamic funds. 53<br />
In Sudan, the economy is dominated by oil revenues but<br />
production is to peak in 2012 and will run out in another<br />
20 to 30 years. 54 Sudan’s non-oil economic sectors are<br />
agriculture, mining and livestock, the latter being basic to<br />
the stability in the rural areas; 55 services make up close to 43<br />
per cent of GDP. Recent government policy has promoted<br />
manufacturing by liberalizing the labour laws, improving<br />
189
190<br />
<br />
Well casings lined up beneath a Heglig drilling rig in South Kordufan, Sudan. ©UNEP<br />
the legal system and agriculture by continuing its Green<br />
Mobilization Program. It is expected that manufacturing<br />
and agriculture will reinforce one another through agroprocessing<br />
industries. 56 The government is also developing<br />
the agricultural sector through better access to credit and<br />
strong partnerships with private investors. 57<br />
As is the case with most primary cities, Khartoum generates<br />
a major share of the country’s GDP. In 1990, greater<br />
Khartoum contained 73 per cent of Sudan’s industries, 85 per<br />
cent of its commercial enterprises, 70 per cent of taxpayers,<br />
70 per cent of its hospitals and health centres and produced<br />
81 per cent of taxes collected. It also consumed 67 per cent of<br />
the power from the national grid. 58<br />
The partition of the country is expected to have a significant<br />
impact on Khartoum as the north will be deprived of much<br />
of the oil revenues as the wells are predominantly located<br />
in the south. To remedy the deficit in infrastructure, the<br />
government is investing in roads and electricity to support<br />
the non-oil sectors.<br />
In Yemen, agriculture and herding employ most of the<br />
labour force even though industry and services generate most<br />
the GDP. Seventy per cent of export earnings and government<br />
revenue are derived from oil, which could be depleted in five<br />
to 14 years. 59 The country’s strategic location along the Babel-Mandeb<br />
strait should allow it to develop other economic<br />
activities and its two strategic ports, Aden and Hodeida,<br />
could become shipping hubs. 60<br />
Although the equipment and capacity of the ports are<br />
currently insufficient, the government plans to improve them<br />
and create a maritime planning institute. 61 There are also<br />
opportunities to expand mining for resources like limestone,<br />
gypsum, marble, rock salt, granite and basalt as well as the<br />
fishing industry. 62 There is potential to expand tourism,<br />
handicrafts, private health care, education and real estate. 63<br />
Urban activities are concentrated in Sana’a, which<br />
accounts for 21.6 per cent of total employment and 30 per<br />
cent of industrial establishments, 64 with smaller industrial<br />
concentrations in Taiz and Ibb. 65 The capital is also the<br />
country’s hub for formal employment generation, with 39 per<br />
cent of all new formal jobs between 1992 and 2006 and 33<br />
per cent of new formal establishments. 66<br />
Inequality and Poverty<br />
With the exception of Sudan, were inequality is<br />
approximately equal in urban and rural areas, 67 inequality<br />
rates are higher in urban areas and are increasing. In<br />
Djibouti, most of the wealth is concentrated in the 1 st , 2 nd<br />
and 3 rd Arrondissements of Djibouti City. 68 In Yemen, the<br />
highest rates are in Sana’a and the Hajjah, and Almahwet-<br />
Alhodeidah-Dhamar areas. 69<br />
In most of the countries, poverty is higher in rural than<br />
urban areas. In Djibouti, poverty rates have been very high,<br />
particularly in Djibouti City, where close to 69 per cent of<br />
households live below the relative national poverty line of<br />
USD 3/day/adult household member. Relative poverty has<br />
also been very high in Ali Sabieh (92.4 per cent), Obock (88.1<br />
per cent) and Tadjourah (88.9 per cent). 70<br />
In an effort to combat poverty, Djibouti’s Urban Poverty<br />
Reduction programme, which is supported by the World<br />
Bank, emphasizes improvements to social and economic<br />
services through technical assistance, community projects,
infrastructure development, 71 access to microfinance and<br />
targeted economic development. The programme is focused<br />
on the poorest neighbourhoods. 72<br />
In Somalia, extreme poverty, as defined as the proportion<br />
of the population living on less than USD 1/day Purchasing<br />
Power Parity (PPP), is highest in rural and nomadic areas<br />
(53.4 per cent) and lower in urban locations (23.5 per cent).<br />
General poverty, defined as the number of people living on<br />
USD 2/day, is also lower in urban areas. 73<br />
In Sudan, poverty rates have been higher in the South (50.6<br />
per cent of individuals living below the national poverty line)<br />
than in the North (46.55 per cent) 74 and greater in rural areas<br />
(55.4 %) than in cities (14.4%). 75<br />
In Yemen, spatially, the highest rates of urban and rural<br />
poverty are in Shabwah, Al-Jawf, Hadramout and Amran<br />
governorates. 76<br />
Marketing<br />
There are specific constraints to business development in the<br />
Southern Tier countries. In addition to general institutional<br />
and economic constraints, marketing the sub-region’s<br />
potential has been made difficult by political instability and<br />
civil strife as well as by continuing incidents of piracy by<br />
Somali pirates.<br />
In Yemen, where the government has been trying to<br />
attract investment by focusing on infrastructure upgrading<br />
and investment in the three major ports of Aden, Al-<br />
Hodeidah and Al-Mukallah, they include cumbersome<br />
administrative processes, a difficult business environment,<br />
lack of transparency, the high cost of credit, the difficulty in<br />
acquiring securely-titled serviced land for development and<br />
degraded infrastructure and unreliable electricity and water<br />
supplies. 77<br />
The government of Djibouti has been proactive in<br />
creating a good investment environment and has developed<br />
its road network and expanded the port. It is attempting<br />
to attract foreign investment to develop a new terminal in<br />
Doraleh and a free trade zone with incentives including<br />
exemptions from profit taxes and the repatriation of capital<br />
and benefits. 78 It is also reforming the financial sector and<br />
restructuring the tax system prior to joining the Common<br />
Market for Eastern and Southern Africa. Trade has been<br />
fully liberalised to attract investment. 79<br />
In Sudan, the business environment has generally been<br />
poor. However, the government has been investing in<br />
infrastructure and created a Ministry to serve as a one-stopshop<br />
for administrative issues. Its oil revenues attracted many<br />
foreign investors from China, India and Malaysia to invest in<br />
railways, power generation and industries such as plastic and<br />
furniture. 80<br />
Unemployment<br />
As in other regions in the <strong>Arab</strong> world, unemployment<br />
disproportionately affects youth and female populations. In<br />
Comoros, unemployment among youth accounts for nearly<br />
65 per cent of the total. 81 In Djibouti, it was 83.8 per cent<br />
among the 15-19 age group and 69.4 per cent among the<br />
20-24 year age group. 82 In Yemen, urban unemployment has<br />
been much higher for females (36 per cent) than males (15.9<br />
per cent). 83<br />
Policies targeted to improve employment opportunities,<br />
particularly for urban residents, youths and women will be<br />
critical for the future. In Sudan, the 2008 unemployment<br />
rate in the 15-24 year age group was 25.4 per cent as opposed<br />
to 17 per cent for the population as a whole. 84<br />
In the Comoros, unemployment in the urban areas of<br />
Ngazidja, Ndzouani and Mwali has varied from 15 to 22<br />
per cent. The exception is the other urban area of Moroni<br />
with a relatively low rate of 7.3 per cent. Rural rates have<br />
been significantly lower at 11 to 15 per cent. 85<br />
In Somalia, urban unemployment is estimated to be<br />
around 65.1 per cent and as high as 80 per cent in some<br />
cities if underemployment is taken into consideration. 86<br />
The higher labour force participation rates in urban areas<br />
contribute to their higher unemployment rates. In Djibouti,<br />
a predominantly urban country, unemployment has<br />
vacillated around 40-50 per cent recently. Employment has<br />
been hampered by the limited availability of labour intensive<br />
industries, low labour productivity and lack of credit for<br />
start-up or expansion of self-employment activities. 87<br />
Education<br />
Educational attainment and enrolment rates vary<br />
significantly but are generally much lower than in other<br />
<strong>Arab</strong> countries. In Sudan, they were 71.1 per cent in 2007,<br />
varying between 93.6 per cent in Khartoum State and 36.1<br />
per cent in Red Sea State. The rates of completion of the<br />
primary cycle were 72 per cent for males and 62 per cent<br />
for females. 88 In Djibouti, gross participation rates are just<br />
under 37 per cent for primary education and 17 per cent for<br />
secondary and 1 per cent for tertiary education. 89 The wars<br />
in Somalia have severely limited educational attainment.<br />
By 2004, after a 50 per cent growth in enrolment rates in<br />
the previous five years, primary enrolment rates reached<br />
19.9 per cent. 90 In Comoros, attendance rates in primary<br />
school range from 62 per cent to 85 per cent depending<br />
on the island and economic status. Secondary education<br />
enrolments are relatively good and range from 56 per cent<br />
to nearly 76 per cent. 91 In Yemen, at 85 per cent, overall<br />
enrolment rates are relatively high for primary education<br />
and moderate to low for secondary (41 per cent) and tertiary<br />
education (10 per cent). 92<br />
In all countries, urban enrolment and attainment rates<br />
are higher in urban areas. In Djibouti, the urban primary<br />
school enrolment rate was 67.1 per cent compared to 49 per<br />
cent for rural locations in 2006. 93 Urban literacy rates (48.4<br />
per cent) are much higher than rural rates (14.2 per cent). 94<br />
In Yemen, Sana’a had higher rates of attainment than the<br />
country as whole or other urban areas. 95<br />
191
192<br />
<br />
Djibouti. Children in a Koranic class at school. ©Giacomo Pirozzi/Panos Pictures<br />
Health<br />
The overall state of health in the Southern Tier countries<br />
is relatively poor, compared to other countries in the <strong>Arab</strong><br />
world. In Djibouti, health services are also more accessible<br />
in urban areas (100 per cent) than in rural locations (95 per<br />
cent). 96 In Comoros, health attendants assisted in nearly 79<br />
per cent of urban births as compared to only 43 per cent in<br />
rural areas. 97 In Somalia, the comparable figures are 65 per<br />
cent and 15 per cent, respectively. 98 Vaccination rates were<br />
also much higher in urban areas 99 as was access to hospitals. 100<br />
In Sudan, health services are concentrated in Khartoum and<br />
the surrounding states. 101 In Yemen, access to health services<br />
is significantly higher in urban areas (80 per cent) as compared<br />
to rural (25 per cent). 102<br />
Improving the provision of adequate hospital services in<br />
urban areas and investments in primary care programmes<br />
in rural areas are major challenges to the Southern Tier<br />
countries.<br />
Despite the civil conflicts, Somalia has been focusing<br />
on improving urban health by participating in the WHO<br />
“1000 cities, 1000 lives” campaign and disseminating<br />
health awareness tips through text messaging in the cities of<br />
Burao, Berbera, Bosasso, Galkayo, Garowe, Hargeisa, Merka<br />
and Mogadishu. 103 Hargeisa has also created a healthy city<br />
programme, which emphasizes education, healthy lifestyles<br />
and better access to water, green space and recreational<br />
facilities. 104<br />
Tourism<br />
Although many of the countries are attempting to diversify<br />
their economies and promote the tourism sector, inadequate<br />
infrastructure and limited accommodation are severe<br />
constraints. In Somalia, Yemen and Sudan, tourism has been<br />
limited by security challenges. 105<br />
In Comoros, the government is promoting eco-tourism and<br />
seaside tourism through the improvement of infrastructure<br />
(roads, water, sanitation and energy), workforce training in<br />
the hospitality sectors, liberalization of the airline industry<br />
and marketing. 106 The government has signed agreements<br />
with international tourism groups to develop hotels 107 and the<br />
number of arrivals and revenues from international tourism<br />
has increased in recent years. 108<br />
Djibouti has attempted to promote tourism, but the<br />
progress has been limited and will require additional<br />
investments. 109 The government has prepared a strategic<br />
tourism development plan with a focus on Lake Assal, Lake<br />
Abbe, Day Forest, Le Goubet, the Seven Brothers islands,<br />
Moucha Island and Maskali Island. 110 The number of arrivals<br />
has been increasing but tourism revenue has fluctuated. 111<br />
Yemen has the potential to expand its tourism industry<br />
as it has important cultural attractions 112 which include two<br />
UNESCO World Heritage Sites in the cities of Zabid and<br />
Shibam 113 as well as beautiful beaches. The focus has been<br />
placed on the cities of Aden, Mukalla, Sana’a, Shibam-<br />
Hadramout and Taiz. 114<br />
The government is trying to promote and support the<br />
industry through improvements in infrastructure and the<br />
creation of a tourism and hotel institute. 115 Inadequate<br />
infrastructure, an insufficiently trained workforce, a lack<br />
of high-quality hotels and restaurants and safety challenges<br />
are all serious constraints. 116 Before the recent unrest, the<br />
number of arrivals had increased significantly, as had receipts,<br />
growing by more than a factor of 10 from USD 73 million in<br />
2000 to USD 886 million in 2008. 117
5.3<br />
Urban Development and Housing Conditions<br />
<br />
A residential area in Mogadishu, Somalia. ©Kate Holt/IRIN<br />
Growth Patterns of Southern Tier <strong>Cities</strong><br />
The rapid growth of cities in the Southern Tier<br />
in recent decades has superseded the capacity of<br />
local governments to provide adequate services.<br />
Furthermore, the prolonged and, in some cases, continued<br />
conflict has led to the destruction of infrastructure and<br />
housing, as well as the displacement of millions of people.<br />
At the same time, a series of droughts have wracked the<br />
region, creating an exodus of people from rural and pastoral<br />
communities to the cities. The concentration of many people<br />
in a few, safe cities has driven up land prices and increased the<br />
cost of housing. The contested national and local governments<br />
in the Southern Tier countries have been largely unable to<br />
provide basic physical and social services or to establish the<br />
enabling factors for a strong private sector response. As a<br />
result, many cities that are the recipients of migratory flows<br />
are composed almost entirely of informal settlements, slums<br />
and refugee camps that suffer not only from severe housing<br />
deprivations but social and physical trauma. Outside of the<br />
primary cities, most urban areas have not received significant<br />
investments in infrastructure and lack most basic services.<br />
The region’s typical urban development pattern features an<br />
old historic quarter of compact one- to two-storey buildings,<br />
surrounded by loosely-organized urbanised areas, informal<br />
settlements, refugee camps and industrial zones. Khartoum’s<br />
development strategy of incorporating surrounding villages<br />
has engendered a pattern of speculative squatter settlements<br />
in increasingly remote villages with the aim of eventually<br />
capitalizing upon the value of incorporated city status. 118 This<br />
has created an actively-brokered process of speculation.<br />
Informal Settlements and the Challenge of<br />
Affordable Housing<br />
In addition to natural disasters and political conflicts, the<br />
Southern Tier has some of the highest fertility rates in the <strong>Arab</strong><br />
world. An estimated 57 to 65 per cent of the population in<br />
each country is between the ages of 0 and 24, comprising one<br />
of the largest youth bulges in the <strong>Arab</strong> region. 119<br />
From 1990 to 2009, urban populations grew by 150,<br />
172, 179, 260 and 286 per cent in the Comoros, Somalia,<br />
Djibouti, Sudan and Yemen, respectively. By 2009, 28 to 44<br />
per cent of the population lived in cities, except Djibouti,<br />
193
194<br />
BOX 25: SUDAN - MIGRATION TO KHARTOUM AND THE DAR ALSALAM APPROACH<br />
Khartoum is historically the main destination<br />
of migration in Sudan. It hosts 45 per cent of<br />
total rural-urban migration and 50 per cent of<br />
the IDPs. Khartoum hosted 79 per cent of all<br />
migrants between 1983 and 1993 and about<br />
83 per cent between 1993 and 2008.<br />
IDPs were accommodated in the four huge<br />
camps of Wad Elbashir, Mayo, Dar Alasalam<br />
and Jabal Awlya. The combined population of<br />
these camps reached 1,284,340 in 1995, with<br />
76 per cent from South Sudan. After the CPA in<br />
2005, which established peace in Sudan, half<br />
of Khartoum’s IDPs returned to South Sudan<br />
(UNEP 2007).<br />
There is a long history of spatial planning<br />
regulation in Sudan, dating back to McLean’s<br />
plan of 1912 and it is currently based on a<br />
new structure plan of Khartoum State 2007-<br />
2033. Government responses towards dire<br />
urban issues like migration, squatters and<br />
illegality, however, are trailing behind and not<br />
addressing problem when they arose. The<br />
National Quarter Strategy (2007-2031) too<br />
does not give guidance on these important<br />
urban issues.<br />
where 88 per cent of the population was urbanized, with<br />
two-thirds living in Djibouti City. 120<br />
Yemen, which has the second highest fertility rate in<br />
the <strong>Arab</strong> world after Somalia, is estimated to require an<br />
additional 80,000 units of housing each year to keep up with<br />
demand. 121 UN-Habitat predicts that Khartoum requires<br />
60,000 units per year since the city’s unmet housing demand<br />
is estimated at 22 per cent of existing stock while 60 per cent<br />
of the existing stock is in poor condition. 122<br />
Governments in the Southern Tier countries have been<br />
unable to build enough affordable housing or establish<br />
conditions that enable private sector investment in mediumincome<br />
housing. From 2005 to 2008, Djibouti’s government<br />
built on average 2,500 units of social housing per year, 123 a<br />
fraction of the number needed to meet the 2008 estimated<br />
housing gap of 140,000 units. 124 In Yemen, an estimated<br />
95 per cent of housing is built by the private sector, most<br />
of which is incremental construction by households in<br />
informal settlements. 125<br />
In Khartoum, the government’s response to rapid<br />
immigration into the city in the 1990s was the widespread<br />
deployment of sites and services schemes, which initially<br />
helped to settle low-income communities fleeing war-torn<br />
regions but eventually became the foundation for extensive<br />
urban sprawl. 126 From 1956 to 2005, Khartoum provided<br />
In 1993, the highly primate city of Khartoum<br />
had 9.5 times the population of the country’s<br />
second-largest city of Port Sudan. In 2008 it is<br />
8.7 times the now second-largest city of Nyala<br />
(Darfur).<br />
Illegal and squatter housing proliferated,<br />
reaching its apex in 1989 when these<br />
constituted 60 per cent of the Khartoum city<br />
population in about 96 separate settlements.<br />
Four major attempts between 1960 and 1989<br />
to address these problems all failed because of<br />
erroneous approaches:<br />
The forced slum eradication practices of<br />
the 1970s and 1980s merely led to squatters<br />
changing their location around the city. Land<br />
price controls levying high taxes for land<br />
exchange only brought higher land prices<br />
and land speculations. Rent control acts in<br />
favour of low-income households discouraged<br />
developers and increased demand, prices and<br />
speculations. The creation of a huge green belt<br />
around the city to stop the proliferation of periurban<br />
squatting, failed because the squatters<br />
simply leap-frogged across the belt in new<br />
settlements.<br />
The Dar Alsalam concept was introduced<br />
in 1991 to address the problems of the huge<br />
squatting and IDP communities. It adopted a site<br />
and services approach, providing 200m2 plots<br />
with title deeds and communal basic services<br />
against 10 per cent of the market price. Building<br />
by-laws were suspended in these areas to allow<br />
for low-cost construction and share facilities.<br />
It commenced with a replicable module of<br />
10,000 plots in three areas at the fringe of the<br />
city. The new approach has shown positive results<br />
and has a relatively short consolidation time of<br />
around ten years. The Dar Alsalam project was<br />
replicated around the seven localities of Khartoum<br />
State and 273,711 squatter and IDP households<br />
had been resettled in 2005. (UN-Habitat 2009).<br />
Through this new approach, squatter housing in<br />
Khartoum fell from 60 per cent in 1989 to a mere<br />
of 17 per cent in 2008. It secured tenure for the<br />
urban poor and IDPs but, on the other hand, this<br />
process prompted further migration to Khartoum<br />
and contributed to the sheer unlimited horizontal<br />
expansion of the city. Khartoum, with a 2008<br />
census population of 5.27 million is now 45 times<br />
as large as in 1956.<br />
300,000 plots at cost that were distributed at to all categories<br />
of beneficiaries in the hope that lower-income households<br />
that had obtained legal title to land and had access to basic<br />
services would build their own homes. Due to the high cost<br />
of construction materials and taxes on construction, most<br />
families needed four years to build a single room and had<br />
instead settled in rental properties elsewhere. As a result,<br />
51.7 per cent of plots remained vacant, with only 40 per cent<br />
completed and eight per cent under construction. 127<br />
The government’s response to informal settlements built<br />
by squatted and internally displaced people’s fleeing wartorn<br />
regions in the 1990s was the construction of sites and<br />
services schemes. In the 2000s, existing informal settlements<br />
were combined into satellite settlements encompassing<br />
10,000 plots each in Khartoum and 20,000 plots in<br />
Omdurman. By 2005, 273,711 families had moved to these<br />
areas, where infrastructure services were provided at 10 per<br />
cent of the plot value.<br />
The city has also surveyed nearby villages and prepared<br />
plans for their integration into the urban fabric. Six districts<br />
have been completed to date, benefiting 160,900 families. 128<br />
In 2009, the government halted the provision of serviced<br />
plots to all but current dwellers of informal settlements and<br />
is exploring public private partnerships for the development<br />
of middle-income housing. 129
In Djibouti, where almost all materials are imported,<br />
housing construction costs are as high as six times the average<br />
annual household income. 130 With the recovery of the<br />
economy, landlords have raised rents and speculators have<br />
obtained attractive parcels for future development. 131 The rise<br />
of housing costs in the city centre has pushed development<br />
outwards, particularly towards the Balbala suburbs, which<br />
lack basic services provision.<br />
In Sudan, the rise of oil wealth has led to speculative luxury<br />
private developments in Khartoum that cater to expatriate<br />
communities and are fuelled by foreign investment from the<br />
Gulf States, eliciting the nickname “Dubai on the Nile”. 132<br />
These developments, which neither serve local residents nor<br />
are in line with the level of development of the country,<br />
have effectively driven up the cost of land and construction<br />
materials and pushed residents out. 133 In a 2008 survey of<br />
Khartoum residents that had experienced an eviction, 51 per<br />
cent moved due to government relocation and 30 per cent due<br />
to the rise in rents. 134 The rise in rents has negatively impacted<br />
both the middle class and the most vulnerable groups.<br />
In Somalia, 12 per cent of urban households are migrants<br />
and 14 per cent are displaced persons and returnees. 135<br />
Displaced and refugee populations are typically poorer and<br />
more vulnerable than other low-income households and<br />
rising land prices and construction costs have trapped them<br />
in cycles of poverty and housing deprivation.<br />
Informal and slum settlements have grown rapidly in the<br />
Southern Tier countries. From 1990 to 2005, Yemen’s slum<br />
population in urban areas grew by 229 per cent, concentrated<br />
in Aden, Hodeidah, Sana’a and Taiz. 136 An estimated 67<br />
per cent of urban residents live in slum and informal<br />
settlements. 137 These settlements often encroach upon wadi<br />
beds or are built on steep slopes; 138 they typically lack basic<br />
services such as water, sanitation, and solid waste collection.<br />
A 2010 World Bank study of Taiz found that in situ<br />
upgrading through the provision of basic services would cost<br />
USD 1,000 per household and was the economically viable<br />
option for the government, as compared to resettlement,<br />
which would cost USD 13,000 per household.<br />
The lack of secure land tenure poses significant challenges<br />
in implementing either strategy. 139 In Sana’a, some<br />
communities have drafted neighbourhood development<br />
plans after informal settlements have been established yet<br />
these plans neither address modern development patterns nor<br />
are implementable because they fail to address the underlying<br />
ownership issues. 140 Sana’a’s City Development Strategy<br />
proposes to resolve these challenges through greater efforts<br />
in participatory consultation and holistic planning based on<br />
community concerns. 141<br />
In countries for which there is data, the great majority<br />
of homes suffer at least one housing deprivation – most<br />
commonly improved sanitation – and a large proportion<br />
also lack water, housing durability and/or sufficient living<br />
area. In Djibouti, according to the 2002/03 household<br />
budget survey, 65 per cent of urban homes (not including<br />
refugee and homeless populations) were made of wood<br />
and sheet metal; 24 per cent were individual houses; 6 per<br />
cent, tents; and 4 per cent apartments. 142 In Somalia, as of<br />
2002, only 60 per cent of urban families had a permanent<br />
residence, 32 per cent a semi-permanent residence and 7 per<br />
cent a temporary residence; 19 per cent of urban households<br />
had only one room, and 38 per cent had two rooms. 143 In<br />
Puntland, 78 per cent of urban households had a home made<br />
of stone and 22 per cent lived in huts or makeshift homes<br />
used by IDPs. 144 Slum settlements are rapidly growing on<br />
the periphery of Berbera in Somaliland and these areas are<br />
undergoing a process of formalization as some households<br />
begin to transform makeshift houses to durable construction.<br />
IDP communities have been assigned subdivided areas with<br />
only an emergency water supply. 145 In Sudan, an estimated<br />
391,000 IDPs lived in formal camps as of 2008 and 1 million<br />
to 1.28 million live outside the formal camps; in either case,<br />
residents often live under deplorable housing conditions. 146<br />
Land Tenure, Property Rights and Titling<br />
Land tenure in the Southern Tier countries comprises<br />
several layers of legal systems. Customary rights govern<br />
communal and grazing land; Shari’a law governs much of<br />
private, state and waqf land and Western-inspired legislation<br />
applies to the registration of private property.<br />
While overlaps in land laws occur in all <strong>Arab</strong> countries, the<br />
lack of clear land laws, registration procedures and records in<br />
the Southern Tier countries make for particularly confusing<br />
ownership patterns that have been a continued source of<br />
conflict. The lack of clarity of ownership has depressed land<br />
and property markets, slowing private sector investment in<br />
affordable housing.<br />
Sudan’s 1947 Town Land Regulation Act, inherited<br />
from the British colonial period, is the most robust land<br />
registry system in the region. All unregistered land became<br />
government property in 1970 147 and the government owns 98<br />
per cent of the country. As a result, the government is able to<br />
supply leasehold land to individuals at a nominal price.<br />
In Somalia, the 1975 land law that recognized only stateregistered<br />
ownership instead of customary tenure favoured<br />
those with access to the registration systems and helped to<br />
trigger the conflict that ensued. 148 Deed registers in municipal<br />
offices were looted during the civil war, particularly south<br />
central Somalia and Mogadishu, where almost nothing<br />
is known about actual property ownership today and, as a<br />
result, property tax is neither levied nor collected.<br />
Strong clans, warlords and militias in Mogadishu,<br />
Puntland and Somaliland have at times seized land without<br />
compensation. 149 In some areas of Mogadishu, land allocation<br />
for public services is conducted at the neighbourhood level<br />
and mediated by the community leaders. Until a legitimate<br />
and stable government is established in Somalia, it will not<br />
be possible to conduct land registration without legitimizing<br />
land acquired through violence and seizure. 150<br />
Land-titling initiatives are limited and competing land<br />
claims are common in urban areas – particularly over<br />
195
196<br />
formerly public land, resulting in land-related conflicts at the<br />
local level. 151 In Somaliland and Puntland, land registration<br />
is a paper-based system run by under-staffed municipal<br />
departments with limited resources that cannot keep up with<br />
the growth of cities. Building permits are required but title<br />
registration is not; in Hargeisa in 2006, there were 60,000<br />
developed properties and only 3,000 registered titles. 152<br />
In Djibouti District, 44 per cent of households lacked<br />
tenure security in 2006, with 19 per cent of these households<br />
believing that they would soon be expelled due to lack of<br />
tenure and 10 per cent having been expelled from a previous<br />
home in the past five years. 153<br />
Yemen has no official system of land registration, leading<br />
to frequent disputes over land ownership that account for<br />
30 to 50 per cent of all cases heard at local courts. 154 Violent<br />
conflict over land disputes is common in Sana’a and, to a<br />
lesser extent, in Aden. 155<br />
Overlays of land ownership claims exist in Comoros, where<br />
only a small proportion of properties are titled. To promote<br />
economic productivity and investments, the government<br />
established a property registry in 2007 and made land reform<br />
a primary goal of its 2010-14 poverty eradication strategy. 156 It<br />
has established the ambitious targets of registering 15 per cent<br />
of agricultural land by 2010 and 65 per cent by 2014. During<br />
this period, the government hopes to clarify land ownership<br />
laws and rights, significantly reduce property registration<br />
costs and make the procedure more accessible.<br />
Urban Land and Fiscal Policies<br />
During the colonial period, the British established four<br />
categories of plot sizes permitted for land registration in<br />
Sudan. The first, second and third classes had different plot<br />
sizes and lease terms depending on income. For instance,<br />
in Juba, the downtown area with permanent structures and<br />
colonial style buildings consists of Class One plots; further<br />
from downtown, Class Two plots contain fewer permanent<br />
structures and more huts while Class Three settlements are<br />
huts built on the grid plan. 157 On the periphery, villages<br />
built without a plan were classified as a fourth class known<br />
as “native lodging areas” reserved for migrants who could<br />
upgrade their plot status into a higher class if they built a<br />
permanent building. 158 These colonial era zoning guidelines<br />
remain in place throughout Sudan, with the exception of<br />
the fourth class category which was abolished in 1957 to<br />
discourage temporary construction.<br />
The government has sought to manage Khartoum’s growth<br />
through successive master plans that comprised this strict<br />
zoning code within fixed municipal boundaries. The Third<br />
Class plot with a minimum of 200m 2 is the smallest permitted<br />
registered version but it is unaffordable to the poor, effectively<br />
excluding them from obtaining secure land tenure. 159 It<br />
took the 2000-2033 Master Plan to expand the municipal<br />
boundaries for the first time and begin to address the need<br />
for a metropolitan-scale infrastructure – including highways,<br />
road networks and flood control – required of a city of more<br />
than 5 million people.<br />
In Yemen, land markets tend to function poorly due to the<br />
lack of clear land records and speculative land hoarding. It is<br />
not uncommon for private investors who have bought state<br />
land to also pay tribal or private parties using the parcel to gain<br />
access to the property. 160 Local regulations mandating large<br />
minimum lots sizes and land contributions for circulation and<br />
recreation have also pushed prices above an affordable level<br />
for the middle class. Land prices throughout the country have<br />
risen as a result of speculators who took advantage of low<br />
prices in the years following unification in 1990. 161<br />
Housing Finance<br />
The banking sectors of the Southern Tier countries are not<br />
well developed. In Somalia, the number of banking institutions<br />
operating in the country has declined from six, prior to the<br />
civil war, to one public bank and a few remittance companies<br />
and microfinance networks. The formal banks mostly finance<br />
short-term commercial and seasonal cash crop activities. Due<br />
to the unstable economic and political outlook, they are<br />
unwilling to invest in longer-term, more productive activities.<br />
The lack of a developed financial system has restricted credit<br />
liquidity for all sectors and the lack of competing banks allows<br />
interest rates to remain prohibitively high. 162<br />
By one report, only 4 per cent of Yemenis have bank<br />
accounts. 163 In the Comoros, aside from two microfinance<br />
networks, there was only one general private bank in 2007<br />
and three in 2008.<br />
Microfinance networks are growing in the Southern Tier<br />
countries, although for the most part these do not directly<br />
impact housing. For instance, in the Comoros, the national<br />
bank and two decentralized networks offering microcredit<br />
loans cater mostly to small- and medium-sized businesses. 164<br />
As a result, households in Southern Tier countries tend to<br />
incrementally invest in and upgrade their homes through a<br />
cash economy through limited savings, loans from friends<br />
and family, and remittances. Only in Djibouti has there been<br />
an improvement in the financial and banking sectors, with an<br />
expansion in domestic credit by 8 per cent from 2005 to 2006<br />
and a decline in interest rates. 165<br />
The importance of remittances in housing construction<br />
varies by country. In the Comoros, recipients of remittances<br />
spend most of the funds on consumption rather than investing<br />
in housing, prompting the IMF to recommend changes<br />
to economic policies that would incentivize productive<br />
investments. 166 In Somalia, the diaspora sends an estimated<br />
USD 1 billion in remittances each year, much of which<br />
is believed to be spent on basic needs, housing, and small<br />
enterprises in cities around the country. 167 Given the magnitude<br />
of remittances, Somalia’s remittance companies underpin the<br />
country’s financial structures by funding trade and commerce.<br />
They are considering launching commercial banks, particularly<br />
those geared towards lower-income segments. 168
5.4<br />
Urban Mobility<br />
The Challenge of Urban Transportation<br />
Transportation infrastructure is critical to a country’s<br />
economic and social development; when linked<br />
with the networks of other countries, transport<br />
systems can also help increase the countries’ openness and<br />
development.<br />
The Southern Tier countries rely mainly on a limited road<br />
network that is often poorly maintained, particularly in<br />
Somalia, Sudan and Yemen. Given their limited resources, the<br />
countries have a limited network of paved roads connecting<br />
major cities. The Comoros has the best-developed national<br />
road network, with 47 km of roads per 100 km 2 and 77 per<br />
cent of all roads paved, although many rural areas lack access<br />
roads. Sudan has the lowest road density in Africa and most<br />
roads are in greater Khartoum and Port Sudan 169 or northsouth<br />
roads serving the oil fields. In Somalia, prior to the<br />
internal conflict, 2,757 km out of 21,830 km of roads were<br />
paved in 1989, only 600 km of roads were still paved in<br />
2006. 170<br />
With the help of donor countries and organizations,<br />
major investments are being made to improve transport<br />
infrastructures. From 2000 to 2008, Sudan used its oil<br />
wealth to increase its paved road network by 150 per cent<br />
and launched a programme to rehabilitate and extend its<br />
railway network which is Africa’s second longest. 171 Yemen<br />
has been constructing and paving 1,000 to 1,400 km of<br />
roads each year, increasing its paved roads to 15,300 km in<br />
2009. 172 A USD 1.6 billion highway is under consideration<br />
to link Aden in the south with Amran in the north, halving<br />
the travel time from the southern coast to the border with<br />
Saudi <strong>Arab</strong>ia. 173<br />
Use of motorized transport remains limited, with 28 to 35<br />
motor vehicles per 1,000 people in the region.<br />
FIGURE 58: PERCENTAGE OF REGISTERED MOTOR VEHICLES BY CATEGORY (2007) 174<br />
Sudan<br />
Comoros<br />
<br />
Merca, Somalia. ©COSV.<br />
Licensed under the Creative Commons Attribution-Share Alike 3.0 Unported license.<br />
0% 10% 20% 30% 40% 50% 60% 70% 80% 90% 100%<br />
Motorcars Minibuses/vans (
198<br />
Mass Transportation<br />
None of the Southern Tier countries has adopted national<br />
public transportation policies or operated a public transport<br />
service. In all countries, private and informal providers operate<br />
minibuses, trucks, pickups and taxis to move passengers.<br />
Government participation is limited to tariff setting, licensing<br />
and enforcing traffic rules. As a result, the transportation<br />
system is fragmented and limited in geographic scope and<br />
operating hours.<br />
Minibuses provide services within Djibouti City and<br />
buses connect the city with peripheral areas and villages. In<br />
2002, the government implemented important reforms of<br />
the transport sector when the Ministry of Equipment and<br />
Transport created a national advisory board on comprised<br />
of experts, user associations, government agencies and the<br />
District of Djibouti. 175<br />
The Ministry sought to regularize the informal operators,<br />
establish a fee to maintain and develop the roads used<br />
by minibuses and buses, require compulsory licences<br />
for passenger transport vehicles and establish technical<br />
requirements for vehicle inspections and operator<br />
responsibilities. In 2006, the Ministry reorganized routes<br />
and stops in Djibouti City and issued a concession to a<br />
private party to build bus shelters and signs.<br />
In Sudan, urban transportation is primarily provided<br />
by the private sector and 67.5 per cent of urban riders use<br />
minibuses, 22.8 per cent taxis and 8 per cent small pickups.<br />
Inter-city buses run mainly between Khartoum and the 15<br />
state capitals. Tariffs are high relative to income and, on the<br />
periphery of Khartoum, for example, relocatees from Soba<br />
to El Fatih, where 95 per cent of the working population<br />
commutes to work, now spend on average 20 to 40 per cent<br />
of their daily income on transport. 176<br />
In more remote areas, lorries carrying cargo from one city<br />
to another will also take passengers. Pick-ups, known locally<br />
as boksi, are the main form of local transport between villages,<br />
as well as trans-desert routes from Dongola to Karima and<br />
Atbara. Camels are widely used in the west and north of the<br />
country and donkeys are used throughout. 177<br />
Similarly, in Somalia, public transport services are provided<br />
informal providers in Mogadishu and other main cities. A<br />
few inter-city minibus services connect major centres in the<br />
south of the country, while the use of camels and donkeys for<br />
transport are widespread in rural and nomadic areas. 178<br />
In the Comoros, the Ministry of Transport, Posts and<br />
Telecommunications and Tourism supervises transport<br />
nationally, with Directorates of Transport overseeing services<br />
on each island. 179 The central government is responsible<br />
for setting fares and the national police is responsible for<br />
enforcing road safety regulations.<br />
According to vehicle registration data, 85 per cent of motor<br />
vehicles are private passenger cars. The remainder comprise<br />
a mix of minibuses, trucks and motorized two- and threewheelers.<br />
Since any citizen may obtain a licence for a vehicle<br />
to transport passengers, and the government does not monitor<br />
<br />
Minibuses in Sana’a, Yemen. ©Gryshchuk Yuriy. Licensed under the Creative Commons<br />
Attribution 3.0 Unported license.<br />
these licenses, the actual number of vehicles offering public<br />
transport services is not recorded.<br />
In Yemen, responsibility for transportation planning is<br />
divided among the Municipality of Sana’a, the Ministry of<br />
Transport and the Ministry of Interior, with little coordination<br />
between them and no clear responsibility for urban transport<br />
planning. Sana’a’s recent Comprehensive Traffic Management<br />
Study did not analyze multi-modal public transport options<br />
and strategies. 180 The significant investments in roads in recent<br />
years have favoured peri-urban and inter-city connections<br />
and neglected inner-city arterials that have become highly<br />
congested. Competing minibus and taxis clog the main routes<br />
while other areas remain underserved.<br />
Road Safety<br />
Given the increasing number of vehicles in the Southern<br />
Tier countries, the dearth of traffic regulations and the<br />
laxity of their enforcement are undermining road safety. The<br />
Comoros and Yemen both lack regulations governing speed<br />
limits, mandating the use of motorcycle helmets and child<br />
restraints and prohibiting drunk driving.<br />
In Sudan, where such vehicle safety laws do exist, a lack of<br />
enforcement and poorly-maintained roads contribute to poor<br />
road safety. WHO estimates that 34.7 persons out of 100,000<br />
die in traffic accidents each year, one of the highest rates in<br />
the world. 181<br />
In Yemen, 10 per cent traffic-related deaths and 20 per<br />
cent of injuries occur in Sana’a. 182 WHO estimates that the<br />
number of road traffic deaths per 100,000 residents is 29.3<br />
for Yemen and 30.3 for the Comoros. Most fatalities are<br />
drivers and occupants of four-wheelers and roughly one in six<br />
are pedestrians.
5.5<br />
Urban Environmental Challenges<br />
Managing Scarce Water Resources<br />
With the exception of Djibouti and Yemen, the<br />
Southern Tier countries do not suffer from<br />
physical water scarcity but they rather lack the<br />
infrastructure to capture, treat and distribute water resources.<br />
Without reservoirs, irrigation canals, water abstraction<br />
pumps, purification facilities and distribution networks, cities<br />
cannot supply adequate water to residents.<br />
With only 360 cubic metres of renewable water supply per<br />
capita, Djibouti is one of the most water-scarce countries<br />
in the world. However, it uses only 6 per cent of its actual<br />
renewable supply. A semi-desert country, its water resources<br />
lie in deep aquifers and water shortages could worsen over<br />
time since the population grows by three per cent per year,<br />
while its renewable surface water supply is estimated to have<br />
fallen by 28 per cent between 2007 and 2015 due to climate<br />
change.<br />
Unlike other Southern Tier countries, 86 per cent of water<br />
used in Djibouti is for domestic rather than agricultural<br />
use, and Djibouti City is projected to have to cope with a<br />
water deficit of 18 million cubic meters by 2015 as threequarters<br />
of the city depends on a single aquifer that is being<br />
depleted faster than it can be replenished. 183 The government<br />
has invited a Chinese company to build a new desalination<br />
plant in the city and the <strong>Arab</strong> Fund for Economic and Social<br />
Development is helping finance the rehabilitation of the city’s<br />
water supply network, as systemic water loss has reached 44<br />
per cent. 184<br />
In Somalia, water demand is expected to increase when<br />
stability is restored and refugees and IDPs return to their<br />
homes. Use of water is well within the range of water<br />
resources although Somalia lacks the reservoir infrastructure<br />
on its two main rivers to capture annual floodwaters for use<br />
in the dry season and during cyclical droughts. Moderate<br />
droughts happen every three to four years and severe ones<br />
every seven to nine years. Traditional community-based water<br />
management systems have deteriorated during the civil war.<br />
In Somaliland, the rehabilitation and development of dam<br />
and irrigation infrastructure is a priority. However, because<br />
it is not an internationally recognized country, it lacks the<br />
authority to negotiate with neighbouring Ethiopia to develop<br />
the necessary infrastructure on trans-border rivers. 185<br />
The five upstream Nile countries signed a Cooperative<br />
Framework Agreement in 2010 demanding a greater share<br />
of the river. North and South Sudan use 57 per cent of their<br />
renewable water supplies, most of which is from the Nile<br />
watershed. Water resources are concentrated in South Sudan,<br />
and subject to significant year-to-year variability. Municipal<br />
water, which accounts for less than 3 per cent of total water<br />
use, relies on a combination of groundwater and river<br />
pumping. Traditional agreements for water access may change<br />
following Southern Sudan’s independence and shifts in access<br />
for nomadic and pastoral communities over water use could<br />
lead to new conflict. (See also The State of African <strong>Cities</strong> 2010,<br />
p.165, free pdf download from www.unhabitat.org).<br />
Sana’a and Yemen are consistently projected to be the<br />
first city and country in the world to run out of water.<br />
Regardless of climate change, Yemen is expected to deplete its<br />
groundwater reserves by 2030 or 2040. 186 Over 90 per cent of<br />
the country’s ground and surface water is used for agriculture,<br />
predominantly the production of qat. 187 In Sana’a, households<br />
connected to the public water distribution network receive<br />
water once every 15 days due to limited supplies and private<br />
tankers fill the gap in service. 188 Around 80 per cent of Sana’a’s<br />
water comes from an aquifer northwest of the city that drops<br />
six to eight metres each year and will be depleted within ten<br />
to 15 years. 189<br />
Water authorities face significant challenges in management<br />
and technical capacity, with systemic water loss from leaky<br />
pipes amounting to 40 per cent. To date, Yemen lacks a<br />
comprehensive water management strategy. Sana’a’s City<br />
Development Strategy has recommended that qat agriculture<br />
and industries requiring large amounts of water be limited in<br />
the surrounding areas. 190 (See Box 26)<br />
Urban Access to Domestic Water<br />
Primary cities tend to have better access to services than<br />
secondary cities. Comoros and Djibouti have achieved nearly<br />
universal access to water in urban areas, while Somalia, Sudan<br />
and Yemen provide 64 to 72 per cent of urban residents with<br />
water. The Comoros has launched the Clean Water and<br />
Sanitation Project in 2009 to provide 180,000 people with<br />
clean water and 20,000 people with improved sanitation<br />
FIGURE 59: AVAILABLE AND WITHDRAWN WATER RESOURCES PER CAPITA<br />
Cubic meters of water per year<br />
2,000<br />
1,500<br />
1,000<br />
500<br />
0<br />
Comoros<br />
Djibouti<br />
Somalia<br />
Total Actual Renewable Supply m 3 /capita (2008)<br />
Total Consumption m 3 /capita (2002 or 2007)<br />
Sudan<br />
Yemen<br />
199
200<br />
BOX 26: YEMEN – URBAN WATER SECURITY<br />
<br />
Kawkaban City, Yemen. A woman collects water from a reservoir. ©Adriano Bassignana.<br />
Licensed under the Creative Commons Attribution-Share Alike 2.5 Generic license.<br />
THE SANA’A BASIN<br />
Boundary of<br />
Sana’a area<br />
3000<br />
2500<br />
Q al Qabil<br />
Wadi Zahr<br />
2500<br />
3000<br />
Rawdah<br />
Sana’a<br />
2500<br />
Wadi Kharid<br />
Wadi as Sik<br />
2000<br />
Wadi al<br />
Mahajir<br />
2500<br />
Wadi Sawah<br />
Wadi al Aibar<br />
Wadi Ghayman<br />
3000<br />
Source: Sustainable City Development Strategy/ Municipality of Sana’a 2007<br />
3000<br />
2500<br />
N<br />
2000<br />
2000<br />
3000<br />
20 km<br />
Streams<br />
Towns<br />
Sana’a plain<br />
Contours<br />
(masl)<br />
Yemen is the most water-stressed country in<br />
the world and one of the ten poorest countries in<br />
water resources with a water per capita share<br />
of less than 120 cubic metres per year. Ground<br />
water tables, which are the main water source,<br />
are depleting at a very fast pace, especially<br />
in Sana’a and other major towns such as Tiaz,<br />
Abyan and Hadhramout. The increasing demand<br />
for water caused by constant high population<br />
growth presents enormous stress on the<br />
already scarce water resources due to the high<br />
rates of ground water extraction which outstrip<br />
replenishment ability.<br />
It threatens food security by reducing<br />
agricultural productivity, as well as hindering<br />
human health and economic development. Water<br />
scarcity can also lead to additional environmental<br />
stress and increased suffering of the poor while<br />
widening the poverty map of the country.<br />
The water supply of Sana’a is approaching<br />
a critical point. More than 80 per cent of the<br />
national water supply comes from fossil reserves<br />
in the geological Sana’a Basin which covers an<br />
approximate area of 70 km by 40 km on the<br />
North West side of the city. It is estimated that<br />
the basin will be depleted within ten to 15 years.<br />
This is mainly due to the rapid population growth<br />
and ad hoc abstraction of water. The annual<br />
consumption of water has hit a record of 260<br />
million m 3 and potable water of questionable<br />
quality is increasingly being pumped from<br />
underneath the city. The public water network is<br />
estimated to cover only 55 per cent of the city’s<br />
households.<br />
The problem of undersupply is exacerbated by<br />
the physical deterioration of the network which<br />
results in serious leakages (estimated at 30 to<br />
40 per cent). As a result, water supply in Sana’a<br />
has been rationed - not just posing problems<br />
in residential areas but also posing severe<br />
constraints for industry. The issue is crucial for<br />
determining the future spatial development<br />
trends of the city and its population growth<br />
pattern.<br />
It is therefore essential to seek and evaluate<br />
other conventional and unconventional<br />
alternatives to utilize the available water<br />
resources in the most economic manner and<br />
hence try to mitigate the imminent future water<br />
crisis in the area.
Water vendor in Khartoum, Sudan. ©UN-Habitat<br />
in Fomboni, Mbéni, Moroni, Mutsamudu, Oichili and<br />
Ouani. 191 Continued conflict in Somalia and Sudan has<br />
eroded gains in access to services over the past two decades.<br />
In Sudan, urban access to potable water fell from 85 per cent<br />
in 1990 to 59.4 per cent in 2009, mainly due to unserviced<br />
urban expansion.<br />
In Somalia, while urban access has improved, rural access<br />
to water fell to 9 per cent in 2008 from 20 per cent in 1990<br />
and access to sanitation fell to 6 per cent from 12 per cent. 192<br />
Due to ongoing conflicts and lack of investment, Somalia,<br />
Yemen and Sudan are not expected to reach the Millennium<br />
Development Goals targets for water and sanitation.<br />
In Djibouti City, 95.5 per cent of residents have access<br />
to clean water supply, compared with 83 per cent in other<br />
urban districts. 193 In the Comoros, where about 33 per cent<br />
of households obtain water from public standpipes (rising<br />
to more than half of households in Grand Comoro), 25 per<br />
cent obtain water from rainwater fed cisterns and only 17<br />
per cent from house connections. 194 In Yemen, 70 per cent<br />
of the poor have access to improved water, compared to 80<br />
per cent of non-poor. 195 In Sana’a an estimated 59 per cent<br />
of households are connected to the public supply network,<br />
4.5 per cent to private networks and 32 per cent purchase<br />
water from water tankers at a significant price mark-up and<br />
health risk. 196<br />
Among the Southern Tier countries, Somalia has the<br />
least developed water and sanitation infrastructure which,<br />
underfunded before the conflict, has since been degraded or<br />
destroyed, particularly in the central and southern regions.<br />
Investments in water supply infrastructure are limited<br />
almost exclusively to UN and other international agencies in<br />
Somaliland and Puntland.<br />
Local private sector operators serve as the main providers,<br />
drilling uncontrolled boreholes or transporting water from<br />
public urban systems. In Somaliland and Puntland, local<br />
urban water services have been reorganized as public-private<br />
partnerships, some of which have made small extensions in<br />
their services areas. The southern town of Jowhar established<br />
a successful example of this model, which has been replicated<br />
in other towns in Somaliland and Puntland. 197 The UN has<br />
funded the installation of two water systems in Somaliland. 198<br />
The World Bank provided support to Yemen’s port cities<br />
in 2002 to upgrade their water supply, reduce water loss,<br />
and build sewerage facilities with wastewater reuse systems.<br />
In 2009, it provided additional funding to support the<br />
implementation of the national water and sanitation strategy,<br />
which aims to increase access to water and sanitation services,<br />
stabilize groundwater abstraction and strengthen local<br />
institutions and community-based management. 199 The<br />
limited capacity of existing institutions, weak enforcement<br />
mechanisms and lack of clarity in role delineation, however,<br />
continue to hamper project implementation. 200<br />
All Southern Tier countries lag in providing urban residents<br />
with access to improved sanitation. In Sudan, most major<br />
cities lack wastewater treatment facilities and sewer networks<br />
service less than 15 per cent of urban centres. Instead, septic<br />
systems and pit latrines are used by 65 per cent of urban<br />
households. 201 Most major cities have stormwater drainage<br />
systems but poorly-designed drainage channels, lack of<br />
maintenance and the mushrooming of squatter settlements<br />
on the main drainage courses contribute to heavy flooding. 202<br />
The sewer network in Khartoum covers only 25 per cent of<br />
the city and is overloaded, resulting in significant volumes of<br />
untreated sewage flowing back into the Nile. In the Comoros,<br />
the Clean Water and Sanitation Project, sponsored by the<br />
African Development Bank, will provide 20,000 people with<br />
improved sanitation in major cities.<br />
203, 204<br />
In Yemen, about 40 per cent of the residents of Sana’a<br />
are connected to the sewer system and the remainder rely<br />
on onsite cesspits and septic tanks. Inadequate wastewater<br />
treatment has resulted in the pollution of Sana’a Basin, the<br />
city’s primary water source. 205 The lack of wastewater treatment<br />
and recycling infrastructure in Yemen is particularly alarming<br />
given the country’s rapidly declining water resources.<br />
Climate Change<br />
Although climate change models and scenarios vary,<br />
they forecast a reduction of rainfall and increased volatility.<br />
According to a 2010 ranking of countries’ vulnerability to<br />
climate change based on their ability to adapt to changing<br />
conditions, the Comoros, Somalia and Yemen are among the<br />
top most vulnerable countries in the world. 206<br />
As an island nation, the Comoros will is susceptible to<br />
sea-level rise, which is expected to displace 10 per cent of<br />
201
202<br />
<br />
Mutsamudu, Comoros. The Comoros is very susceptible to the risks of rising sea levels. ©Peioma. Licensed under the Creative Commons Attribution-Share Alike 3.0 Unported license.<br />
the country’s coastal areas residents in the next 100 years. 207<br />
In Somalia, rural residents have been migrating to the<br />
settlements around Mogadishu as a result of drought. 208 In<br />
Sudan, the line of semi-desert and desert areas has moved<br />
southwards 50 to 200 kilometres since 1930 and is projected<br />
to continue moving southwards, threatening 25 per cent of<br />
the country’s agricultural land and reducing food production<br />
by 20 per cent. 209<br />
Climate change to date has already changed pastoral<br />
practices and contributed to ongoing conflict in Darfur and<br />
Kordofan. Djibouti will experience increased flash floods,<br />
including in Ambouli Wadi near Djibouti City, as well as<br />
reduced groundwater recharge, increasing salinity of aquifers,<br />
desertification and loss of forests and marine resources.<br />
Southern Tier countries are eligible for UNDP funding to<br />
develop climate change National Adaptation Programmes of<br />
Action (NAPAs). Comoros, Djibouti, Sudan and Yemen have<br />
developed NAPAs as of 2010.<br />
The majority of priority projects address agricultural<br />
productivity, soil rehabilitation, and water use efficiency.<br />
For instance, the United Nations is financing 15 projects<br />
in the Comoros to address food security through adapted<br />
agricultural practices, fisheries management, increasing<br />
water supply and quality, restoring soils and stabilizing<br />
slopes, as well as building institutional capacity for dealing<br />
with climate change. 210 As part of these initiatives, 22 towns<br />
in Grand Comoro and Anjouan have agreed to regulate<br />
environmentally damaging activities, including illegal<br />
hunting and deforestation for charcoal, and indiscriminate<br />
solid waste dumping. In view of the lack of stability of the<br />
national government, these local actions are an important<br />
step towards building adaptation capacity. 211<br />
Food Security<br />
Many Southern Tier countries have traditionally faced<br />
challenges in producing sufficient food due to the scarcity of<br />
water and arable land, high population growth rates, persistent<br />
droughts, and continued conflict. Continued droughts in the<br />
Horn of Africa have kept people at or below the poverty line<br />
and frequently lead to humanitarian crises.<br />
As of 2011, an estimated 60,000 urban households in<br />
Djibouti were reported to suffer from severe food insecurity<br />
due to high food prices, high unemployment and reduced<br />
remittances, in addition to 140,000 persons in rural areas<br />
that require food assistance. Wholesale rice prices at the<br />
end of 2010 were 150 per cent higher than in mid-2007.<br />
According to UNICEF, malnutrition has become a serious<br />
problem in and around Djibouti City, home to two-thirds of<br />
the country’s population. 212<br />
In Somalia, where 60 per cent of the people relies on<br />
herding, droughts have shrunk pastures and water supply,<br />
causing the migration of pastoralist and livestock. 213 The 2008<br />
to 2010 retail prices of domestically produced grains sold in<br />
Mogadishu are three to seven times the pre-2008 prices.<br />
Decades of droughts in Sudan, caused mainly by longterm<br />
changes in weather patterns, along with population<br />
growth, have led to changes in agricultural practices which<br />
include increased land clearing, expansion into the desert,<br />
overstocking and overgrazing. As of 2011, 4 million to 4.5
million people in Sudan, particularly in the Darfur, the Red<br />
Sea and the North and South Kordofan States are vulnerable<br />
to food shortages. 214<br />
In the three-month lead-up to the January 2011 referendum,<br />
over 200,000 people migrated from Sudan to South Sudan.<br />
If these migratory trends continue, the number of people<br />
needing food assistance could increase to 1.4 million under<br />
peaceful conditions. If trade flows are disrupted, the food<br />
security of as many as 2.7 million people could be threatened.<br />
Water shortages underlie Yemen’s food security crisis. As of<br />
2009, as much as one-third of the country is moderately to<br />
severely food insecure, a figure that has since increased due<br />
to rising food prices in 2010 and political unrest in 2011. 215<br />
As of 2009, food subsidies amounted to 0.5 per cent of<br />
GDP but given the country’s fiscal deficit and civil unrest,<br />
the government is unlikely to be able to significantly increase<br />
spending on food subsidies if prices continue to increase. 216<br />
In 2010, the UN World Food Programme implemented an<br />
Emergency Seasonal Safety Net program in Yemen aiming to<br />
provide 700,000 people in the least food secure governorates,<br />
namely Amran, Al-Dhala, Hajjah, Ibb, Raima and Sana’a. As<br />
of January 2011, an estimated 250,000 internally-displaced<br />
persons and 170,000 refugees, mostly from Somalia, required<br />
food assistance.<br />
As a small island nation with one of the highest population<br />
densities in Africa, the Comoros is only able to produce 49<br />
per cent of its food domestically, and its food import to export<br />
price ratio is 3.8. 217<br />
Energy and Air Pollution<br />
In the Southern Tier countries, the significant reliance on<br />
wood and charcoal for energy has environmental implications.<br />
In Comoros, Somalia and Sudan, wood-based fuels supply<br />
78, 87 and 90 per cent of energy needs, respectively, while<br />
hydrocarbons supply only 2 per cent of energy consumed in<br />
Comoros and 13 per cent in Somalia. 218,219,220<br />
This has led to widespread deforestation and erosion,<br />
particularly in Comoros and north and central Sudan, where<br />
8.8 million hectares of forest cover have been lost from<br />
1990 to 2005. 221 In Djibouti, 81 per cent of households use<br />
kerosene for cooking and only 13 per cent use wood fuel – 10<br />
per cent in urban areas and 79 per cent in rural areas. 222<br />
Yemen has an estimated 1,000 MW of electricity generation<br />
capacity, one-third of which is in Mareb Governorate. Civil<br />
strife and attacks on the gas power station there have led to<br />
blackouts and highlight the vulnerability of the network.<br />
Comoros has a total generation capacity of 24 MW from<br />
its thermal power plants, 223 but an estimated 55 per cent<br />
of generated electricity is lost to fraud, illegal connections,<br />
network deficiencies and poor tariff collection. 224<br />
As with other forms of infrastructure, conflict situations<br />
have reduced access. The mass urbanization engendered by<br />
land degradation and the conflict in Darfur has left twothirds<br />
of people in Al Fashir, Al Genaina and Nyala without<br />
electricity. 225<br />
Electricity grids are restricted to the major cities. In the<br />
Comoros, where all petroleum products are imported, energy<br />
prices are among the highest in Africa. 226 Limited access to<br />
the grid and the high costs of electricity constrain access<br />
and consumption for lower-income households. The cost of<br />
electricity in Djibouti is more than two times higher than<br />
in Ethiopia and constitutes a major constraint on businesses;<br />
67 per cent of residents in Djibouti City have electricity,<br />
compared with 43 per cent in other urban districts and 10 per<br />
cent in rural areas. 227 In Somalia, the majority of electricity<br />
in the country is supplied through private providers, whose<br />
volatile rates are higher than those of the public sector.<br />
The cost of electricity in Hargeisa ranges from USD 0.60<br />
to USD 1.00 per kilowatt-hour. 228 In Sudan, 15 per cent<br />
of the population has electricity 229 mostly concentrated in<br />
urban areas and Khartoum, with 12 per cent of the country’s<br />
population, consumes 33 per cent of Sudan’s electricity. 230 In<br />
Sana’a 85 per cent of residents have electricity, compared with<br />
50 per cent of urban residents in general and 20 per cent in<br />
rural areas. 231<br />
Despite a significant potential for renewable energy, the<br />
continued instability has impeded investments in the Southern<br />
Tier countries. 232 The Comoros has potential to develop<br />
hydroelectricity in Anjouan and Mohéli and from biomass,<br />
solar, wind and tidal sources. 233 It has begun investigating<br />
the potential for geothermal energy on the three volcanic<br />
islands. 234 Liquefied petroleum gas is being introduced in<br />
Sudan and particularly Khartoum. The Merowe dam is also<br />
expected to double the country’s electricity generation, lower<br />
prices, expand the national grid and hopefully foster an<br />
accelerated switch away from charcoal. 235<br />
Given the low level of energy consumption, air pollution<br />
has not yet become a regional challenge and is localized near<br />
specific industries or transportation hubs. Carbon dioxide<br />
emissions are among the lowest in the world and far below<br />
the average for <strong>Arab</strong> countries. Dust is a challenge in Sudan,<br />
where dust storms, exacerbated by deforestation and erosion,<br />
regularly cover the country with adverse respiratory health<br />
consequences.<br />
FIGURE 60: PARTICULATE MATTER (PM10) AS A WEIGHTED AVERAGE OF THE<br />
URBAN POPULATION<br />
PM10 μg/m3<br />
250<br />
200<br />
150<br />
100<br />
50<br />
0<br />
Comoros<br />
1996<br />
2006<br />
Djibouti<br />
Source: World Bank Development Indicators<br />
Somalia<br />
Sudan<br />
203
204<br />
Solid Waste Management<br />
The collection and proper disposal of solid waste pose<br />
significant challenges to local governments. In tandem with<br />
urbanization, per capita solid waste generation is growing<br />
and, throughout the region, cities lack collection management<br />
systems and no sanitary landfills exist in any of the countries.<br />
Except for affluent urban areas that have organized private<br />
collection, trash typically accumulates in open dumps and<br />
vacant lots and is periodically burned. Waste is also disposed<br />
of in waterways and the ocean.<br />
In Sudan, only Khartoum has disposal sites in suitable<br />
locations while municipal dump sites in El Geneina, El<br />
Obeida, Port Sudan and smaller towns and villages are located<br />
in peri-urban informal areas and along wadis. 236 Waste from<br />
slaughterhouses, medical facilities, industries and sludge are<br />
typically mixed together. In the Comoros, household waste<br />
<br />
Ali and his friends play in the rubbish in the Al-Basatree slum area of Aden, Yemen. ©Abbie Trayler-Smith/Panos Pictures<br />
production has increased to one cubic meter per person per<br />
day. 237 Djibouti City produces 240 tons of waste each day,<br />
62 per cent of which is disposed of without treatment. 238 In<br />
Somalia, the United Nations funded two garbage stations in<br />
Garowe; however, Puntland and Mogadishu lack a solid waste<br />
management policy. Waste pickers often live in degrading<br />
conditions to recover sellable materials from landfills, and are<br />
subject to numerous health hazards.<br />
Yemen published two laws in 1999 that enabled local<br />
authorities to fund their own solid waste services. 239 In<br />
2010, Yemen drafted a National Strategy for Solid Waste<br />
Management, 240 which creates a framework for goals and<br />
targets, institutional responsibilities and donor support.<br />
The national investment plan for solid waste is based on<br />
this strategy. Pilot cities and governorates have implemented<br />
integrated solid waste management systems that have affected<br />
four million people.
5.6<br />
Urban Governance System<br />
<br />
Bab al Yemen (The Gate to Yemen) in Sana’a. None of the Southern Tier countries have a national urban policy. ©Vladimir Melnik/Shutterstock<br />
Governance in Conflict and Post-Conflict<br />
Situations<br />
The Southern Tier <strong>Arab</strong> countries share a recent history<br />
of civil unrest, violent conflict and political instability.<br />
These conflicts are rooted in colonial decisions on<br />
political boundaries that have led to struggles for power<br />
and resources between ethnic or tribal groups following<br />
independence. 241<br />
In conflict situations, the central government’s capacity<br />
to implement state functions is the first to collapse. Where<br />
central agencies remain in place, they often lack the<br />
authority and credibility to collect funds and coordinate local<br />
government activities. At the same time, local authorities<br />
lacking central support are weakened and local communities<br />
become fragmented along ethnic and religious ties with some<br />
of these cleavages dating back to colonial times. In the face<br />
of the destruction of infrastructure and collapse of public<br />
services, leadership devolves to respected local community<br />
leaders and services are provided almost exclusively through<br />
private, often informal, providers.<br />
The Comoros, Djibouti, Sudan and Yemen have emerged<br />
from a conflict stage in which establishing and strengthening<br />
political stability, security and the restoration of basic services<br />
are the priorities. During this stage, the allocation of power<br />
and resources can reignite old confrontations, particularly<br />
tribal conflicts.<br />
National Urban Policy<br />
All Southern Tier countries have ministries that are in<br />
charge of urban planning and infrastructure development. In<br />
the Comoros, these responsibilities are shared by the Ministry<br />
of Development, Infrastructure Urbanism and Housing<br />
and the Ministry of Agriculture, Fishing, the Environment<br />
and Energy. In Sudan, the Ministry of Physical Planning<br />
and Public Utilities is charged with spatial planning and<br />
infrastructure development.<br />
In Yemen, the Ministry of Planning and International<br />
Cooperation is charged with planning for the country’s<br />
development and mobilizing external resources to implement<br />
these plans. The Ministry of Finance’s Department of Public<br />
Domain and the Ministry of Public Works and Highways<br />
administer urban land. In addition, the General Authority of<br />
Lands, Survey and Urban Planning (GALSUP) is responsible<br />
for urban and rural land inspections and surveys, layouts,<br />
and planning; management of state, private, and waqf<br />
land; administration and registration of land, including<br />
maintaining land records; and valuation of land and oversight<br />
of land expropriation. 242<br />
205
206<br />
However, due to the relative weakness of these ministries,<br />
they often have difficulty coordinating action at either the<br />
inter-agency or the local government level. 243 None of the<br />
Southern Tier countries has a national urban policy, and<br />
many cities lack the capacity to implement urban plans where<br />
they exist. 244<br />
In Sudan, Khartoum has a Structural Plan 2007-2033,<br />
which proposes improved road networks and transportation<br />
systems to better connect neighbourhoods. Though approved<br />
by the State Cabinet, it has already proven difficult to<br />
implement due to issues of land use and inter-agency<br />
conflicts. 245<br />
Nyala’s 2006-2021 master plan, which was passed by the<br />
South Darfur Legislative Council after nearly 20 years of<br />
development, takes a highly technical approach to modernizing<br />
the city’s commercial centre. Actual implementation remains<br />
uncertain given the state of post-conflict resolution. 246 Port<br />
Sudan’s latest master plan dates back to the 1970s.<br />
Since 2000, in tandem with decentralization efforts, the<br />
World Bank and <strong>Cities</strong> <strong>Alliance</strong> have assisted the Yemeni<br />
cities of Aden, Hodeida, Mukallah and Sana’a in drafting<br />
city development strategies, bringing together public, private<br />
and citizen stakeholders to revise city master plans and<br />
address social, economic and environmental challenges and<br />
opportunities. 247<br />
Decentralization and Local Government<br />
Systems<br />
Many of the conflicts in Southern Tier countries can be<br />
attributed to the efforts to impose centralized legal and<br />
administrative frameworks on traditionally different tribes<br />
and clans. In spite of attempts to implement decentralization<br />
reforms, local authorities lack adequate funding to discharge<br />
their responsibilities. With higher levels of government<br />
controlled by traditional power elites, the development of<br />
local capacity and improved service delivery are key areas<br />
requiring international and donor support.<br />
In 2000, Yemen launched one of the most ambitious<br />
decentralization programs in the <strong>Arab</strong> world in a widelysupported<br />
move to return the highly-centralized government<br />
to traditional decentralized practices.<br />
The country is divided into 21 governorates, which<br />
comprise 21 provincial municipalities and 326 district<br />
municipalities. The Local Authority Law delegated planning,<br />
development and administrative responsibilities to municipal<br />
and district councils.<br />
A significant challenge posed by the decentralization law is<br />
the overlap of municipal and district councils; for example,<br />
the cities of Taiz and Hodeidah each overlaps with three<br />
district boundaries and Sana’a has a municipal council as<br />
well as ten district councils, each of which operates its own<br />
services, resulting in confusion over roles, responsibilities and<br />
revenue collection, as well as duplicated departments. 248<br />
In 2008, the country held its first elections for governors<br />
by council members; however, 17 out of 20 seats were won<br />
by the ruling party, further consolidating the ruling elite’s<br />
control over a tribal society that was bound to reject it. 249<br />
Indeed, in January 2011, violent demonstrations erupted in<br />
Sana’a bringing the country to the brink of civil war.<br />
Following 20 coups in 25 years, the Comoros adopted a<br />
new governance system under the 2001 Constitution based<br />
on the principle of subsidiarity and established four levels<br />
of government: federal, island, regional and local. 250 The<br />
presidency rotates between the three islands on a five-year<br />
basis.<br />
Although these reforms aimed to provide each island<br />
with semi-autonomy and reduce the violence and frequency<br />
of coups, they have effectively created duplicative layers of<br />
government that consume 80 per cent of the country’s GDP.<br />
In 2009, 52 per cent of eligible voters went to the polls,<br />
with 94 per cent approving a referendum to streamline<br />
the government system. The referendum reduced island<br />
presidents to governor status, ministers to councillor status,<br />
and government expenditures by 10 to 15 per cent. 251<br />
After Djibouti’s first regional elections in 2006, the central<br />
government in 2008 formally transferred key basic services<br />
to regional governments, including waste management<br />
and supervision of local markets. 252 Building on these<br />
decentralization efforts, UNDP and the African Development<br />
Bank (AfDB) are financing a series of projects to help build<br />
the capacity of local agencies to plan, collect revenues, manage<br />
fiscal resources, and implement projects. One component of<br />
the Urban Poverty Reduction Project funded by AfDB seeks<br />
to build capacity to access funding and establish a system of<br />
microfinance in five major towns outside of Djibouti City. 253<br />
In Sudan, local government comprises four levels<br />
– wilaya (governorate), mahalya (locality), alwihda alidaria<br />
(administrative unit), and lajna sha’biya (popular<br />
committees). The popular committees are elected volunteers,<br />
usually tribal leaders, who monitor programmes operating in<br />
their jurisdictions, provide services, collect taxes, distribute<br />
zakat, and mobilize local communities. These responsibilities<br />
overlap with those of the administrative units and localities,<br />
and many residents perceive the committees as being corrupt<br />
extensions of political parties.<br />
A 2007 review of selected local authorities in Sudan found<br />
varying levels of capacity to provide basic services and a<br />
general lack of transparency, limited public participation, and<br />
poor planning capacity. Urban agencies had more resources<br />
and better fiscal management, but rural communities tended<br />
to be more accountable and participatory. 254<br />
Internally-displaced population camps lack any government<br />
presence and essentially run themselves, and Native<br />
Administrations still exist and play an important role when the<br />
normal governance system fails. Overlapping responsibilities,<br />
exacerbated by uncoordinated aid interventions has delayed<br />
or worsened service delivery, with the severest impact on the<br />
poorest and IDP communities. Local elections were held in<br />
April 2011 and will be held next in 2016. 255<br />
The 2005 Comprehensive Peace Agreement (CPA) allowed<br />
South Sudan to operate as an autonomous region and
A blind voter at a Southern Sudan referendum polling center. ©USAID Africa Bureau.<br />
Licensed under the Creative Commons Attribution 2.0 Generic license.<br />
institute reforms to improve the decentralization process.<br />
The CPA delegated significant responsibilities in revenue<br />
collection, expenditure management, urban development<br />
and basic services to state governments, which further<br />
delegate responsibilities to county and city governments. 256<br />
In 2011, South Sudan’s residents overwhelming voted to<br />
become independent from the north and in July 2011 the<br />
country formally became the Republic of South Sudan. The<br />
oil-rich new country has been invited to join the East Africa<br />
community.<br />
Somalia lacks a national government and its society is<br />
better characterized by tribal and clan affiliations. 257 A key<br />
instigator of the current conflict was the imposition of a<br />
central government on a traditionally fragmented society that<br />
was further divided under colonization by the French, British<br />
and Italians.<br />
Of the three regions, Somaliland has the most functional<br />
though still limited government. It has a bicameral parliament<br />
with proportional clan representation. The Association of<br />
Local Government Authorities established by mayors from<br />
Berbera, Borama, Burao, Dhahar, Erigavo, Gabilai, Hargeisa<br />
and Sheikh districts supports democratic institutions,<br />
conducts trainings on financial accountability, provides<br />
feedback on draft strategic plans and operating procedures. 258<br />
Puntland is more stable than south central Somalia, but<br />
suffers from security breakdowns and lacks a functional<br />
system of governance. 259 south central Somalia continues<br />
to be a battleground between the Transitional Federal<br />
Government (TGF), the Islamic Courts Union and Al<br />
Shebaab group. After the withdrawal of invading Ethiopian<br />
troops in 2009, the conflict has displaced an estimated<br />
200,000 people from Mogadishu, with violence spreading to<br />
Kismayo and several ministers being assassinated. 260 A new<br />
United Nations 2008 to 2021 programme will assist rural<br />
and urban districts throughout Somalia in building local<br />
government institutions, shoring up most importantly their<br />
ability to deliver basic services, strengthen local participation<br />
in decision-making and, most important, resolve conflicts<br />
around land and housing.<br />
Local Government Finance<br />
In line with the low level of economic development,<br />
the local revenue generation base and receipts fall short of<br />
meeting the needs. In the Southern Tier countries, central<br />
government revenues are bolstered by donor aid, United<br />
Nations funds, foreign direct investment and migrant<br />
remittances. In Somalia, the bulk of government revenues<br />
come from trade taxes which, by the end of the 2000s,<br />
equalled USD 22 million in Somaliland and USD 16 million<br />
in Puntland.<br />
As in the pre-war years, however, the majority of funds are<br />
spent on the military and security forces with small amounts<br />
channelled towards service provision and infrastructure<br />
development. In Puntland, the government’s budget covers<br />
only staff salaries and limited operations costs. 261 Throughout<br />
Somalia, state governments have shifted responsibilities to<br />
district authorities without providing them with funds. As a<br />
result, private providers deliver most of the basic services.<br />
In Yemen before 2002, all local revenues were transferred<br />
to the central government then redistributed to local<br />
authorities. Following the passage of the Local Authority<br />
Law, local governments can retain locally-collected taxes in<br />
addition to receiving some portion of the centrally-collected<br />
taxes proportional to the size of the municipal population. 262<br />
However, the local revenue base is weak and central transfers<br />
provide the bulk of local government funding (73 per cent of<br />
Sana’a’s budget in 2006/07). 263<br />
The country’s oil sector, which funds 75 per cent of the<br />
central government’s budget, is projected to become depleted<br />
by 2017. 264 To reduce dependence on central transfers, the<br />
2009 Sana’a City Development Strategy sets forth a series of<br />
207
208<br />
BOX 27: SOMALIA - CADASTRAL DEVELOPMENT, PROPERTY TAXATION & FINANCING URBAN IMPROVEMENTS<br />
Rapid urbanization puts pressure on local<br />
authorities to maintain and expand delivery<br />
of basic services. In a post-conflict context,<br />
stable and responsive local governments<br />
are extremely important for taking up urban<br />
challenges and contributing to stability and<br />
peaceful development.<br />
Hargeisa, the capital of Somaliland, was<br />
the first Somali town where a Geographic<br />
Information System (GIS) was established<br />
for property taxation and planning in 2005,<br />
with a plan to expand the technology towards<br />
resolving land conflicts and supporting land<br />
management practices.<br />
A database includes key property<br />
attributes (construction quality, building size,<br />
infrastructure, number of occupants and<br />
access to services) and a digital photograph<br />
of each property. The database also includes<br />
geo-referenced spatial data collected through<br />
field surveys using laptops.<br />
Database development consisted of three<br />
main steps:<br />
1. Acquisition of a high-resolution satellite<br />
image (Quickbird);<br />
2. On-screen vectorization of the image to<br />
create a base map; and<br />
3. Field verification of the base map and the<br />
collection of attribute data.<br />
The reliability of a spatial database depends<br />
on data source (aerial photographs and<br />
field measurements or satellite images),<br />
spatial resolution, distortion, field checks and<br />
measurements, experience and quality of<br />
HARGEISA PROPERTY TAX REVENUES<br />
digitizing personnel. The degree of accuracy<br />
must be related to the project objectives,<br />
financial resources, time and staff capacities<br />
and considerations of sustainability.<br />
The objective was to collect information<br />
useful for property taxation, urban planning and<br />
service delivery. The survey has produced two<br />
interlinked data sets:<br />
1. Spatial data - Vectorization of georeferenced<br />
high resolution satellite images<br />
produced a base map with data on the<br />
properties digitized on the satellite image<br />
and verified through the field survey.<br />
Additional layers for roads, informal areas,<br />
administrative boundaries and so on.<br />
can produce thematic maps, if required.<br />
Future data layers will include land parcel<br />
boundaries, road names, infrastructure and<br />
son on.<br />
2. Attribute data: The property survey<br />
reflects the 2005 property characteristics of<br />
Hargeisa. The development of databases is<br />
time-consuming and costly. Donor support,<br />
however, helped produce the database but<br />
maintenance and operational costs should<br />
be borne locally through a percentage of the<br />
tax revenues.<br />
Effective consultations and awareness<br />
campaigns were essential for implementing<br />
the property survey and assuring data/system<br />
compatibility. Database variables should be<br />
non-ambiguous, informative and useful in<br />
wider applications. Skills and experience to<br />
maintain the property taxation system after<br />
transfer to the municipality has been lacking<br />
since the office personnel and surveyors were<br />
not municipal staff.<br />
To use a GIS-based property database<br />
for taxation, decisions had to be taken on<br />
who is paying what. Owners and occupants<br />
should pay tax based on property value and<br />
type of use (commercial, residential and so<br />
on). Current tax calculations in Hargeisa only<br />
consider plot area rather than building size,<br />
location or number of floors and tax levels<br />
are based on a flat rate that does not reflect<br />
property value.<br />
A major risk of property surveys is that<br />
the potential municipal revenues will not be<br />
realized unless the GIS database is simple,<br />
focused and quickly produces income. It<br />
is equally important that the database can<br />
be maintained and easily expanded with<br />
additional data sets.<br />
To minimize property tax evasion, the<br />
taxation must be clearly linked to public<br />
works upgrades and visibly improved local<br />
environments. A small portion of the collected<br />
taxes must be used to pay for salaries,<br />
administration, database maintenance and<br />
updates and for collection, registration and<br />
enforcing the payments of taxes.<br />
Other application of the GIS database in<br />
Hargeisa include commercial licence revenue<br />
collection by the Municipality, mapping<br />
of public properties, road classification,<br />
expansion of electricity main grid and<br />
expansion of water network.<br />
Year Revenue (USD) Taxable properties Increase (%)<br />
2004 144,417 15,850 ---<br />
2005 169,062 17<br />
2006 241,983 47,323 43<br />
2007 412,179 “ 70<br />
2008 588,754 “ 42<br />
2009 678,584 60,312 15<br />
2010 697,708 60,826 3
measures to strengthen institutions and financial management<br />
as well as improve local revenue collection.<br />
Following the discovery of oil in 1999, Sudan’s GDP<br />
has grown fivefold to USD 53 billion in 2008, allowing<br />
investment in social and physical infrastructure. Irrigation<br />
projects absorbed as much as 41 per cent of development<br />
spending. 265 However, despite decentralization policies,<br />
the rise of oil wealth has not translated into proportionate<br />
increases in local government budgets. Local authorities must<br />
finance their projects from their own sources and grants from<br />
the provincial resource allocation council. Following the<br />
partition, the bulk of the oil fields will be located in South<br />
Sudan and Sudan’s oil earnings will be limited.<br />
In 2007, in collaboration with its residents, the<br />
municipality of Hargeisa started a capital investment<br />
programme to develop its infrastructure and public services.<br />
To improve tax collection, UN-Habitat helped Hargeisa<br />
implement a property tax collection system that included<br />
a geographic information system database of all buildings<br />
linked to household surveys. (See Box 27). By 2008,<br />
property tax revenues had increased 250 per cent from<br />
2005, allowing the city to begin investing USD 320,000<br />
in paving roads and USD 80,000 to construct a bridge. 266<br />
Hargeisa is expanding rapidly and has been able to maintain<br />
and update the property database. Further technical support<br />
from development partners is needed. 267<br />
The Role of Civil Society<br />
In principle, the rights to assemble and to form civil society<br />
organizations (CSOs) are protected by law in Southern Tier<br />
countries. Where they are allowed to operate, CSOs have an<br />
important effect in providing humanitarian and basic services,<br />
moderating conservative traditions, and introducing modern<br />
technology.<br />
Attitudes towards civil society are perhaps most open in<br />
Comoros and Yemen. Only a few CSOs and human rights<br />
organizations, mostly international, operate in the Comoros<br />
but they are able to work without disturbance. 268<br />
In the other Southern Tier countries, however, years of<br />
conflict have eroded the public trust and the development of<br />
civil society remains limited. Political groups face particular<br />
controls, or are prohibited outright, as in Yemen. 269 Higher<br />
education institutions, which are often the seeds of civil<br />
society development, are underdeveloped in Southern Tier<br />
countries. Djibouti recently established the country’s first<br />
university but maintains government controls over the<br />
media outlets. 270<br />
In Somalia, due in part to the absence of a functional<br />
government, domestic civil society groups blossomed in<br />
1991 to meet the population’s needs. Many of these groups,<br />
composed of businessmen, women, community elders,<br />
remain in operation particularly in Somaliland. 271<br />
In Puntland, CSOs suffer both from harassment by the<br />
government and opposition groups, discouraging popular<br />
participation. Ongoing security concerns and violence<br />
towards civil society leaders, human rights activists, aid<br />
workers and journalists 272 have prevented humanitarian teams<br />
from reaching Mogadishu; other international NGOs have<br />
been expelled by Al Shebaab in 2010. 273<br />
According to UN OCHA in 2010, Mogadishu’s accessibility<br />
for humanitarian efforts was 1 out of 100 possible points,<br />
compared with Baidoa (10), Bosasso (69) and Hargeisa<br />
(88). 274 This is unfortunate because humanitarian aid is badly<br />
needed given the prevailing situation of drought and famine.<br />
Women in Politics and Governance<br />
Constitutional laws in the Southern Tier countries protect<br />
the rights of women to vote and hold elected offices. In reality,<br />
deeply ingrained traditions govern property transactions,<br />
business dealings and family relations, particularly in rural<br />
areas. Women routinely have fewer opportunities to gain<br />
education, employment and political office, particularly in<br />
Yemen and Somalia.<br />
To improve conditions for women, countries are slowly<br />
trying to change old laws, establish ministries on women’s<br />
affairs and quotas for female representation in elected bodies,<br />
including 25 per cent in parliament in Sudan. 275<br />
In 2002, Djibouti passed a new Family Law that replaced<br />
Shari’a as the national code and provides strong protection<br />
for the rights of women and children. The government<br />
has promoted girls’ education and reserved 10 per cent of<br />
elected offices for women, who in 2008 gained their largest<br />
representation in office ever, with nine legislators – or 14 per<br />
cent – in the 65-person legislative assembly. 276<br />
In Puntland, Somalia, 30 per cent of district councillor<br />
positions are allocated to women as of 2007. 277 In 2010,<br />
Somaliland reduced the number of ministries from 26 to<br />
20, and welcomed two women ministers. The same year,<br />
four women were selected as councillors in Burtinle, Gardo,<br />
Garowe and Jariban. In Sudan, women are allocated 25 per<br />
cent of the seats in the National Assembly, and 10 per cent of<br />
the seats in Council of States. 278<br />
Despite these improvements, discriminatory customs<br />
persist, particularly in Somalia and Yemen.<br />
In Somalia, while gender discrimination is illegal, society<br />
is strongly patriarchal and women have few rights, including<br />
that of determining their fertility and state of dress. Along with<br />
escalating urban violence, rape is on the increase. 279 Although<br />
the Transitional Federal Government constitution requires<br />
12 per cent representation by women in parliament, women<br />
occupied only 2.5 per cent of the seats following the expansion<br />
of the number of parliamentary seats in 2009. 280 The 2002<br />
household survey found that only 4 per cent of women<br />
participate regularly in local councils, 8 per cent occasionally. 281<br />
Women’s groups in Bosasso, Hargeisa, Mogadishu and smaller<br />
towns continue to lobby for women’s rights.<br />
In Yemen, consistently ranked as one of the countries with<br />
the highest gender disparities, there are only three women<br />
among 412 national representatives. 282 Women suffer from<br />
illiteracy, lower wages and employment discrimination.<br />
209
210 5.7 Migration and Remittances<br />
<br />
Dadaab, in Northern Kenya: the world’s largest refugee camp. ©Homeros/Shutterstock<br />
Many of the Southern Tier countries and their<br />
neighbours have been affected by civil strife,<br />
environmental degradation and poverty. These<br />
circumstances have had a significant impact on migration<br />
and urbanization through both internal and trans-boundary<br />
population movements. Migrants, including refugees, often<br />
settle in urban areas and this increases informal urbanization<br />
and the demand on services.<br />
Most countries have experienced a net outmigration,<br />
with Somalia and Yemen having the largest emigrant<br />
populations. An estimated 50,000 migrants left Somalia<br />
annually from 2005 to 2010 or 8.7 per cent of the<br />
population. Migrants from other countries also cross<br />
Somalia with the hope of reaching Yemen across the Gulf of<br />
Aden. 283 These numbers are the outcome of four categories<br />
of population movements:<br />
1. Emigrants seeking better economic opportunities in<br />
the rich countries and sending remittances back to their<br />
families in their home countries;<br />
2. Emigrants leaving the country more or less permanently<br />
in search of a better future elsewhere, remitting for short<br />
periods until the rest of the family can join them;<br />
3. Refugees displaced by violent conflicts and droughts who<br />
cross into neighbouring countries for safety and survival,<br />
and who often settle in large refugee camps where they<br />
receive humanitarian aid; and<br />
4. Immigrants moving into the country, who can either be<br />
returnees, migrants looking for employment or refugees<br />
from neighbouring countries.<br />
Internally-displaced persons are not reflected in these figures<br />
but have a significant impact on urban areas.<br />
Sudan is both a transit country, and the region’s only net<br />
receiver of migrants in search of economic opportunities as<br />
the country developed its oil production. Migrants come<br />
from Chad, the Democratic Republic of Congo, Egypt,<br />
Eritrea, Ethiopia, India, Nigeria, Somalia, the West Bank and<br />
Gaza, and Yemen.<br />
International Migration and Remittances<br />
Djibouti’s relatively stable political and economic climate<br />
and its strategic location close to the Gulf and international<br />
transportation links makes it attractive for migrants. 284 Many<br />
settle in Djibouti City, while others go on to Europe, the<br />
Gulf, North America, and Australia. Yemen is used as a<br />
transit country by international migrants while also some<br />
1.7 million Yemenis have emigrated to wealthier countries<br />
like Saudi <strong>Arab</strong>ia (800,000 Yemenis alone are here) and<br />
other Gulf States. 285 286 In the Comoros, where employment<br />
opportunities are limited, the prime destinations for<br />
emigrants are Europe, North America and Africa. 287<br />
Remittances have become a significant source of household<br />
income in the region. In 2008, Sudan and Yemen received<br />
just over USD 2.1 billion and USD 1.2 billion, equal to 3.9<br />
per cent and 4.4 per cent of GDP respectively. Remittances<br />
have had a positive impact on urban household incomes. In<br />
Yemen, international remittances contribute to 4 per cent<br />
of household incomes. 288 In Somalia, remittances support<br />
consumption as well as real estate investments and the<br />
creation of small businesses. 289
International Migration of Refugees<br />
Many of the Southern Tier countries are receivers of<br />
refugees. A significant proportion of the immigrants in<br />
Sudan (27.80 per cent), Yemen (20.60 per cent) and, to a<br />
lesser extent, Djibouti (7 per cent) were refugees in 2010,<br />
with many coming from Somalia and Ethiopia. 290 Somali<br />
refugees displaced by internal conflict have resettled in<br />
Bosasso, Puntland, the Al Kharaz Camp in Yemen, the Ali<br />
Addeh camp in Djibouti, the Dadaab and Kakuma camps in<br />
Kenya and the Shedder camp in Ethiopia. 291<br />
Yemen receives migrants from Somalia, Iraq, Ethiopia,<br />
Sudan and Eritrea, most settling in Aden, Sana’a and other<br />
urban areas. 292 The government of Comoros has offered<br />
protection to refugees that are in danger as a result of<br />
political, ethnic or religious persecution. 293 Sudan continues<br />
to receive refugees from the Democratic Republic of Congo,<br />
the Central African Republic, Eritrea, 294 Ethiopia and Chad.<br />
Approximately 30,000 refugees, mostly from Ethiopia and<br />
Eritrea, live in Khartoum. 295<br />
Internally Displaced People<br />
The movements of internally displaced people (IDPs)<br />
as a result of conflict and environmental change have had<br />
a significant impact on the urbanization and demand<br />
for services in many of the Southern Tier countries.<br />
Accommodating and integrating these populations is a<br />
serious challenge.<br />
Civil strife in Sudan has shaped population movements.<br />
Over 4 million residents have been displaced over the past<br />
20 years due to conflicts over resources (primarily oil), intertribal<br />
and ethnic violence and attacks from Uganda’s Lord’s<br />
Resistance Army on the civilian population. 296 With the<br />
signing of the peace agreement in 2005, 2 million residents<br />
<br />
Children play in a returnee camp on the outskirts of Aweil in Northern Bar El Ghazal, South Sudan. ©Siegfried Modola/IRIN<br />
returned to South Sudan, putting additional pressure on<br />
housing, employment opportunities and services. Although<br />
the Comprehensive Peace Agreement ended the civil war in<br />
2005, violence broke out again in 2009, killing 2,500 people<br />
and displacing 350,000 more. 297 With the partition of the<br />
country in July 2011, there have been additional population<br />
movements: 3.5 million migrants and refugees from the<br />
south have started to return to their villages and an estimated<br />
800,000 persons in the south are travelling to the north. 298<br />
To the west in Darfur, conflict has continued between<br />
the government and rebel groups, among rebel factions<br />
and between tribes. As a result of land occupation and the<br />
destruction of agricultural crops, many residents have fled<br />
the region and settled in urban areas, transforming Darfur<br />
from a primarily agricultural area to an urban one. 299 There<br />
are approximately 1.7 million IDPs in Khartoum State of<br />
whom 1.3 million live in informal squatter camps around the<br />
city and the remaining 400,000 reside in official camps. 300<br />
Once in the cities, they often segregate themselves spatially<br />
according to tribal affiliations. 301<br />
Years of internal conflict and severe droughts in Somalia<br />
have spurred internal and external migration 302 many seeking<br />
refuge in Puntland and Somaliland, others in the Afgooye<br />
Corridor in very dense, makeshift settlements without<br />
access to basic services. 303 As fighting between the Transition<br />
Federal Government and the armed militia groups in<br />
Mogadishu continues, the unrest has led to food shortages<br />
and the interruption of trade activities, further increasing<br />
displacement. 304<br />
Yemen has had to deal with 150,000 IDPs from 2009 to<br />
2010 as a result of ongoing political conflicts. 305 There has<br />
also been internal displacement of an estimated 700,000<br />
persons as a result of severe flooding in the Governorates of<br />
Hadramout and Al-Mahra. 306 In Comoros, residents have<br />
displaced as a result of volcanic eruptions and flooding.<br />
211
212 5.8 Regional Corridors and Cooperation<br />
<br />
Khartoum, Sudan. Khartoum is expected to reach megacity size of 10 million in 2045. ©Bruno Gilissen/iStockPhoto<br />
Each of the Southern Tier Countries is witnessing the<br />
emergence of dominant cities, the largest of which are<br />
Khartoum, Sana’a, Aden and Mogadishu. Although<br />
warfare and violence have disrupted settlement patterns in<br />
some cities and distorted their normal expansion through<br />
population displacements and the development of large<br />
informal settlements in outlying areas, these areas have been<br />
integrated in the urban fabric as cities expand, and have<br />
developed into strong subsidiary nodes.<br />
The massive population movements that followed<br />
the partition of Sudan affected cities in the North and<br />
South. Despite the loss of some residents, Khartoum is<br />
expected to reach megacity size of 10 million in 2045.<br />
More importantly is the reshaping of the urban region. The<br />
most recent master plan calls for dividing the 538 villages<br />
in the Khartoum province into clusters linked to the city<br />
of Khartoum for which planned housing extensions will<br />
be developed. This scheme in effect lays out the spatial<br />
framework for the emergence of an urban region extending<br />
along the axis connecting Khartoum to the clusters in<br />
addition to the traditional growth corridors along the course<br />
of the Nile branches. Over time, some of the village clusters<br />
may coalesce to form significant growth nodes or satellite<br />
settlements. In Sudan, the road linking Khartoum to Port<br />
Sudan has the potential of becoming an urban development<br />
corridor.<br />
In Yemen, topography, history and the tribal structure of<br />
society have resulted in an inadequate transport infrastructure<br />
with disruptions in the interconnections between its cities.<br />
Sana’a, which has grown more or less organically, is extending<br />
along the six major roads radiating out of the city. As it grows,<br />
it will eventually form an Extended Metropolitan Region<br />
(EMR). The major road linking Sana’a to the port city of<br />
Hodeida may in time become a development corridor. Rough<br />
topography, however, constitutes the major constraint.<br />
In Somalia, a region with extensive coastline, the absence<br />
of any coastal corridors is striking. The only incipient<br />
corridor is the coastal road linking Mogadishu to Kismayo<br />
through smaller coastal settlements. The road then turns<br />
sharply inland to cross into Kenya and reach Nairobi. This<br />
transnational corridor could benefit from the economic links<br />
between Kenyan and Somali businesses and investors once<br />
stability is restored in Somalia.<br />
Djibouti’s strategic location will continue to shape its<br />
growth patterns. The transnational coastal road leading<br />
to the international airport and then continuing on to<br />
Somaliland has the potential of attracting development along<br />
the alignment starting in the section south of the airport.
Southern Tier Statistical Annex<br />
TABLE 78: TOTAL AND URBAN POPULATION (‘000S) AND PERCENTAGE POPULATION URBAN<br />
1990 1995 2000 2005 2010 2015 2020 2025 2030<br />
Total Population (‘000s)<br />
Comoros 438 494 562 643 735 832 933 1,041 1,160<br />
Djibouti 562 627 732 808 889 975 1,066 1,166 1,263<br />
Somalia 6,599 6,525 7,399 8,360 9,331 10,607 12,237 14,152 16,360<br />
Sudan 26,494 30,141 34,188 38,410 43,552 49,072 54,919 60,811 66,856<br />
Yemen<br />
Urban Population (‘000s)<br />
11,948 15,148 17,723 20,649 24,053 27,980 32,232 36,698 41,342<br />
Comoros 122 140 155 172 195 224 259 302 356<br />
Djibouti 424 475 555 612 670 732 798 875 956<br />
Somalia 1,956 2,049 2,458 2,939 3,505 4,299 5,268 6,451 7,851<br />
Sudan 7,211 9,393 11,661 14,128 17,322 20,889 24,804 28,924 33,267<br />
Yemen 2,577 3,688 4,776 6,083 7,714 9,707 12,082 14,803 17,844<br />
Percentage Population Urban (%)<br />
Comoros 27.87 28.30 28.08 27.89 28.19 29.17 30.85 33.30 36.51<br />
Djibouti 75.65 76.07 76.03 76.01 76.23 76.79 77.65 78.80 80.15<br />
Somalia 29.66 31.43 33.25 35.19 37.45 40.06 43.02 46.33 49.86<br />
Sudan 26.62 30.46 33.41 36.51 40.10 43.77 47.42 51.02 54.54<br />
Yemen 20.93 23.76 26.27 28.94 31.80 34.89 38.19 41.69 45.35<br />
Source: UN-DESA, WPP 2008 and WUP 2009<br />
TABLE 79: NATIONAL AND URBAN POPULATION ANNUAL GROWTH RATES<br />
1990<br />
-1995<br />
1995<br />
-2000<br />
2000<br />
-2005<br />
National Population Growth Rates (%)<br />
Comoros 2.39 2.24 2.21 2.29 2.07 1.78 1.57 1.46<br />
Djibouti 2.15 3.13 1.97 1.76 1.61 1.51 1.57 1.41<br />
Somalia -0.23 2.51 2.44 2.27 2.74 2.64 2.57 2.46<br />
Sudan 2.59 2.48 2.06 2.2 2 1.83 1.61 1.47<br />
Yemen<br />
Urban Growth Rates (%)<br />
4.63 3.16 2.91 2.86 2.74 2.57 2.31 2.05<br />
Comoros 2.70 2.08 2.07 2.51 2.75 2.90 3.10 3.30<br />
Djibouti 2.26 3.12 1.96 1.82 1.76 1.73 1.86 1.75<br />
Somalia 0.93 3.64 3.57 3.52 4.08 4.07 4.05 3.93<br />
Sudan 5.29 4.32 3.84 4.08 3.74 3.44 3.07 2.80<br />
Yemen 7.17 5.17 4.84 4.75 4.59 4.38 4.06 3.74<br />
Source: UN-DESA, WUP 2009 and WPP 2008<br />
2005<br />
-2010<br />
2010<br />
-2015<br />
2015<br />
-2020<br />
TABLE 80: AVERAGE ANNUAL RATE OF CHANGE OF URBAN AGGLOMERATIONS WITH 750,000 INHABITANTS OR MORE (PER CENT)<br />
City<br />
1990<br />
-1995<br />
1995<br />
-2000<br />
Mogadishu 2.04 0.92 3.28 1.17 3.59 3.67 3.66<br />
Khartoum 6.35 3.95 2.69 2.70 3.12 2.95 2.54<br />
Sana’a 9.18 5.55 5.54 5.26 4.51 4.01 3.62<br />
Source: UN-DESA. (2010). The World Population Prospects: The 2009 Revision. New York: UN-DESA.<br />
2000<br />
-2005<br />
2005<br />
-2010<br />
2010<br />
-2015<br />
2020<br />
-2025<br />
2015<br />
-2020<br />
2025<br />
-2030<br />
2020<br />
-2025<br />
213
214<br />
TABLE 81: GDP PER CAPITA IN CURRENT USD<br />
Country 2006 2007 2008 2009<br />
Comoros 657 740 824 833<br />
Djibouti 938 1,016 1,157 1,214<br />
Sudan 921 1,151 1,404 1,294<br />
Yemen 882 972 1,175 1,118<br />
Source: World Bank Development Indicators, 2010<br />
TABLE 82: REAL GDP GROWTH RATES (%)<br />
Country 2008 2009 2010 2011<br />
Comoros 0.6 1.1 2.1 2.5<br />
Djibouti 5.8 5.0 4.5 4.6<br />
Somalia N/A N/A 2.6 N/A<br />
Sudan 7.0 4.5 5.0 5.1<br />
Yemen 3.7 3.8 N/A N/A<br />
Sources: African Economic Outlook for Comoros, Djibouti and Sudan; CIA World Factbook for Somalia and World Bank Indicators for Yemen<br />
TABLE 83: CONCENTRATION OF ECONOMIC ACTIVITIES IN YEMEN (AS %) 307<br />
Sana’a<br />
Sector Establishments Employment<br />
Commerce and Small Services 58.9 31.1<br />
Manufacturing 12.1 12.5<br />
Hotels and Restaurants 7.1 7.4<br />
Transportation 4.8 4.0<br />
Other Activities 11.2 10.8<br />
TABLE 84: SLUM POPULATIONS AS A PERCENTAGE OF URBAN POPULATIONS (2000S DATA)<br />
Comoros Djibouti Somalia Sudan Yemen<br />
Urban Population 234,000 .. 3,136,000 17,012,800 6,729,000<br />
Slum Population 162,000 .. 2,120,000 2,892,176 4,102,000<br />
% Living in Slum 69 .. 74 17 67<br />
TABLE 85: PERCENTAGE OF HOUSEHOLDS EXPERIENCING HOUSING DEPRIVATIONS BY COUNTRY 308<br />
One Two Three Four<br />
Comoros 43.9 20.8 4.3 0<br />
Djibouti .. .. .. ..<br />
Sudan 17.8 35.8 31.0 9.6<br />
Somalia .. .. .. ..<br />
Yemen 39.9 18.1 7.9 1.4
TABLE 86: LEVEL OF MOTORIZATION IN THE SOUTHERN TIER COUNTRIES<br />
Comoros Djibouti Somalia Sudan Yemen<br />
Roads (km, 2000) 880 3,065 22,100 11,900 65,144<br />
% Roads paved (2000) 77 45 12 36 9<br />
Km of Roads per 100 km2 47* 13* 35* 0.5* 15^<br />
Motor Vehicles (per 1,000 people) (2007) 33 .. .. 28 35<br />
Passenger Cars (per 1,000 people) (2007) 31 .. .. 20 ..<br />
Source: World Bank Development Indicators; * estimated for 2000; ^ actual 2005<br />
TABLE 87: WATER AVAILABILITY AND USAGE<br />
Country<br />
Actual Renewable<br />
Resource<br />
Bm 3 /yr<br />
Desalinated<br />
End Water<br />
Bm 3 /yr*<br />
Annual Availability Annual Water Usage % Use by Sector<br />
Waste-water<br />
Reuse Bm 3 /yr*<br />
Per Capita Renewable<br />
Availability (m 3 )<br />
Bm3 /yr As a % of<br />
total water<br />
resources Domestic<br />
2007 2015* 2025*<br />
Comoros 1.2 1446 0.01 0.8 48 5 47<br />
Djibouti 0.3 0.0 Neg. 360 306 260 0.02 6 84 0 16<br />
Somalia 14.7 1683 3.3 22 0.45 0.05 99.5<br />
Sudan 65 0.0 0.0 1020 1369 1122 37 57 2.3 0.6 97.1<br />
Yemen 2.1 0.02 0.03 94 70 50 3.4 160 8 2 90<br />
Source: AFED 2010 Water Report; FAO Aquastat Database; UNESCO 309<br />
TABLE 88: 2008 ACCESS TO IMPROVED WATER AND SANITATION, %<br />
Improved Water Access Improved Sanitation Access<br />
Total Urban Rural Total Urban Rural<br />
Comoros 95 91 97 36 50 30<br />
Djibouti 92 98 52 56 63 10<br />
Somalia 30 67 9 23 52 6<br />
Sudan* 62 59 64 42 65 25<br />
Yemen 62 72 57 52 94 33<br />
(Source: WHO/GHO Database) *Public Water Corporation of Sudan 2009<br />
TABLE 89: 2007 NATIONAL ANNUAL EMISSIONS OF CARBON DIOXIDE<br />
Comoros Djibouti Somalia Sudan Yemen <strong>Arab</strong> Countries World<br />
Total (kt of CO ) 2 121 487 601 11,512 21,958 1,441,989 30,649,360<br />
Per Cap (t) 0.19 0.58 0.07 0.28 0.99 4.3 4.6<br />
% Growth (1990-2007) 57 22 3,180 107 .. 105 36<br />
Source: World Bank Development Indicators<br />
Industry<br />
Agriculture<br />
215
216<br />
TABLE 90: PARTICIPATION IN THE WORKFORCE AND NATIONAL POLITICS BY WOMEN / MEN<br />
Comoros Djibouti Somalia Sudan Yemen<br />
<br />
Literacy rate of Women / Men (% literate aged 15 and above, 2008) 68 79 60 79 43 79<br />
Labour Force Participation Rate by Women / Men (% of those aged 15-64<br />
employed, 2008)<br />
75 86 63 80 58 86 32 74 20 74<br />
Year Women Received Right to Vote and (/) Stand for Election 1956 1946 / 1986 1956 1964 1967<br />
Year First Woman Elected (E) or Appointed (A) to Parliament 1993 E 2003 E 1979 E 1964 E 1990 E<br />
% of parliament (single or lower house) seats held by women (2010) 3 14 6.9 18.9 0.3<br />
% of parliament (upper house or senate) seats held by women (2007) 4 1.8<br />
% of ministerial positions held by women (2005) .. 5 .. 3 3<br />
Sources: World Bank Gender Statistics, UN HDR 2007/08, MDG Indicators Database.<br />
TABLE 91: IMMIGRATION DATA BY COUNTRY<br />
# of International Migrants<br />
in Country (2010)<br />
# of Refugees in<br />
Country (2008)<br />
% Population Foreign<br />
Born (2010)<br />
Average Annual Net<br />
Migration (2005-2010)<br />
Comoros 14,000 .. 1.9 -2,000<br />
Djibouti 114,000 9,200 12.8 ..<br />
Somalia 23,000 1,800 0.2 -50,000<br />
Sudan 753,000 181,600 1.7 27,000<br />
Yemen 518,000 140,200 2.2 -27,000<br />
Source: UN DESA International Migration Wall Chart 2009<br />
TABLE 92: REMITTANCES PAID AND RECEIVED IN THE SOUTHERN TIER, 2009 DATA<br />
Country<br />
Net ODA and Official Aid<br />
Received (in constant USD)<br />
Comoros 50,670,000<br />
Remittances Received<br />
(current USD)<br />
Remittances Received as<br />
a Percentage of GDP<br />
Djibouti 162,170,000 4,276,366 3.1<br />
Somalia 661,650,000<br />
Sudan 2,288,890,000 2,106,143,455 3.9<br />
Yemen 499,690,000 1,160,000,000 4.4<br />
Source: World Bank Development Indicators, 2009
TABLE 93: EMIGRATION AND IMMIGRATION STOCKS AND COUNTRIES<br />
Country Stock of emigrants<br />
as % of population<br />
Comoros 5.60<br />
Djibouti 1.50<br />
Somalia 8.70<br />
Sudan 2.20<br />
Yemen 4.70<br />
Source: World Bank. Migration and Remittances Factbook 2011.<br />
ENDNOTES<br />
1 Unless specifically noted as data from North or<br />
South Sudan, all data in this chapter on Sudan<br />
pertains to the formerly united country.<br />
2 UN-DESA. (2009). The World Population Prospects:<br />
The 2008 Revision. New York: UN-DESA.<br />
3 UN-DESA. (2011). The World Population Prospects:<br />
The 2010 Revision. New York: UN-DESA.<br />
4 Population Division of the Department of Economic<br />
and Social Affairs of the United Nations Secretariat,<br />
World Population Prospects: The 2008 Revision and<br />
World Urbanization Prospects: The 2009 Revision.<br />
5 UN-DESA. (2010). The World Urbanization<br />
Prospects: The 2009 Revision. New York: UN-DESA.<br />
6 Encyclopaedia Britannica. (2011). Djibouti. Chicago :<br />
Encyclopaedia Britannica.<br />
7 UN-DESA. (2010). The World Urbanization<br />
Prospects: The 2009 Revision. New York: UN-DESA.<br />
8 World Bank. Djibouti Urban Poverty Reduction<br />
Project. Project Paper on a Proposed Additional<br />
Grant. May 2010.<br />
9 Union of Comoros, IMF - Comoros Poverty and<br />
Growth Strategy. 2010.<br />
10 UNEP (2007), Sudan: post-conflict Environmental Assessment,<br />
p.122.<br />
11 Eltayab, GE. (2003), The Case of Khartoum, Sudan,<br />
pp.1-2.<br />
12 UNEP (2007), Sudan: post-conflict Environmental Assessment,<br />
p.124.<br />
13 UNEP (2007), Sudan: post-conflict Environmental<br />
Assessment, p.122.<br />
14 UN-Habitat. (2011). State of the <strong>Cities</strong> Background<br />
Paper: Sudan. Nairobi: UN-Habitat.<br />
15 UNDP, 2001 National Human Development Report for<br />
Somalia, p.142.<br />
16 UNDP/World Bank (2006), Somalia Joint Needs<br />
Assessment: Infrastructure Cluster Report, p.xvi.<br />
17 UNHCR country operations profile – Somalia<br />
18 Morooka, I., ‘Child Health Days reach displaced<br />
communities in Somalia’s Afgoye Corridor’. UNICEF,<br />
November 24, 2009.<br />
19 EU, UN-Habitat. Somalia Urban Sector Profile. 2002.<br />
20 WHO (2010), A Situation Analysis of Mental Health in<br />
Somalia, p.12. Retrieved February 10, 2011 at:<br />
21 UNDP/Government of Yemen (2010), Millennium<br />
Emigration Immigration<br />
Top destination countries Stock of immigrants<br />
as % of population<br />
France, Madagascar, Tanzania,<br />
Egypt, U.S., U.K., Germany, Belgium,<br />
Canada and Bahrain<br />
France, Ethiopia, Canada, Egypt,<br />
U.K., U.S., Belgium, Germany,<br />
Australia and Italy<br />
Ethiopia, U.K., U.S., Yemen, Djibouti,<br />
Kenya, Egypt, Saudi <strong>Arab</strong>ia, Canada<br />
and Sweden<br />
Saudi <strong>Arab</strong>ia, Uganda, Yemen,<br />
Kenya, U.S., Chad, UAE, Australia,<br />
Jordan and Canada<br />
Saudi <strong>Arab</strong>ia, UAE, U.S., Israel,<br />
Jordan, U.K., West Bank and Gaza,<br />
Sudan, Germany and France<br />
Refugees as a percentage<br />
of immigrants<br />
2 0<br />
Top source countries<br />
Madagascar, Mayotte, France<br />
and Tanzania<br />
13 7 Somalia, Ethiopia and Yemen<br />
0.2 3 Not available<br />
1.7 27.8<br />
2.1 20.6<br />
Development Goals 2010: Yemen Report, p.45.<br />
22 <strong>Cities</strong> <strong>Alliance</strong>/World Bank/Government of Yemen/<br />
Secretariat Capital of Sana’a (2010), Sana’a: a City<br />
Development Strategy, pp.12-13.<br />
23 African Development Bank. “Urban Poverty<br />
Reduction Project Overview.” 2008.<br />
24 Ministère de l’Habitat, de l’Urbanisme, de<br />
l’Environnement et de l’Aménagement du Territoire .<br />
25 Agence Djiboutienne d’Information, ‘Le conseil<br />
municipal de Djibouti planche sur les questions<br />
de l’état-civil et du développement intégré de la<br />
capitale’. November 11, 2010.<br />
26 UN-Habitat, ‘Mogadishu Community-Based District<br />
Rehabilitation and Upgrading Programme’. 2010.<br />
27 UN-Habitat (2007), Hargeisa: First Steps Towards<br />
Strategic Urban Development Planning.<br />
28 UNEP (2007), Sudan: post-conflict Environmental Assessment,<br />
p.123.<br />
29 UN-Habitat. (2011). State of the <strong>Cities</strong> Background<br />
Paper: Sudan. Nairobi: UN-Habitat.<br />
30 Humanitarian Policy Group, Overseas Development<br />
Institute (2008), The Long Road Home: Opportunities<br />
and obstacles to the reintegration of IDPs and refugees<br />
returning to Southern Sudan and the Three Rivers.<br />
Report of phase II, Conflict urbanisation and land.<br />
31 USAID, 2010.<br />
32 World Bank, Second Port <strong>Cities</strong> Development Project.<br />
33 World Bank, ‘Sector brief: Urban development in<br />
MENA’. September 2008.<br />
34 World Bank, Project Appraisal Document on a<br />
Proposed Grant in the Amount of SDR 14.5 Million<br />
(US$22 Equivalent) to the Republic of Yemen for<br />
an Integrated Urban Development Project. April 22,<br />
2010.<br />
35 <strong>Cities</strong> <strong>Alliance</strong>/World Bank/Government of Yemen/<br />
Secretariat Capital of Sana’a (2010), Sana’a: a City<br />
Development Strategy, pp.42-47.<br />
36 Central Intelligence Agency. (2010). CIA World<br />
Factbook : Yemen. Washington D.C.: CIA.<br />
37 Poverty Reduction and Growth Strategy Paper<br />
(2009). Office of the Commissioner General for<br />
Planning, Presidency of the Union of Comoros.<br />
38 OECD. 2011. Africa Economic Outlook: Comoros.<br />
Washington D.C.: OECD.<br />
Eritrea, Ethiopia, Chad, Nigeria,<br />
Egypt, Yemen, India, West Bank<br />
and Gaza, DRC and Somalia<br />
Sudan, Somalia, Egypt, Iraq,<br />
West Bank and Gaza, Syria<br />
39 OECD. 2011. Africa Economic Outlook: Comoros.<br />
Washington D.C.: OECD.<br />
40 OECD. 2011. Africa Economic Outlook: Comoros.<br />
Washington D.C.: OECD.<br />
41 IMF. IMF Comoros Poverty Reduction and Growth<br />
Strategy 2009.<br />
42 OECD. 2011. Africa Economic Outlook: Comoros.<br />
Washington D.C.: OECD.<br />
43 OECD. 2011. Africa Economic Outlook: Comoros.<br />
Washington D.C.: OECD.<br />
44 IMF. IMF Comoros Poverty Reduction and Growth<br />
Strategy 2009.<br />
45 World Bank Document for the Urban Poverty<br />
Reduction Project – 2009.<br />
46 IMF Poverty Reduction Strategy Paper. 2009<br />
47 OECD. 2011. Africa Economic Outlook: Djibouti.<br />
Washington D.C.: OECD.<br />
48 OECD. 2011. Africa Economic Outlook: Djibouti.<br />
Washington D.C.: OECD.<br />
49 The European Commission. Joint Strategy Paper - for<br />
the period 2008 – 2013. 2009<br />
50 WB Somalia From Resilience to Development.2006<br />
51 UNDP/World Bank (2003), Socio-Economic Survey<br />
2002, p.68.<br />
52 WB Somalia From Resilience to Development.2006<br />
53 The European Commission. Joint Strategy Paper - for<br />
the period 2008 – 2013. 2009<br />
54 World Bank (2009), Sudan: the Road Toward Sustainable<br />
and Broad-Based Growth, p.3.<br />
55 UN-Habitat. (2011). State of the <strong>Cities</strong> Background<br />
Paper: Sudan. Nairobi: UN-Habitat.<br />
56 OECD. 2011. Africa Economic Outlook: Sudan.<br />
Washington D.C.: OECD.<br />
57 OECD. 2011. Africa Economic Outlook: Sudan.<br />
Washington D.C.: OECD.<br />
58 Cited in Eltayab, GE. (2003), The Case of Khartoum,<br />
Sudan.<br />
59 EU. Yemen-European Union Strategy Paper for the<br />
Period 2007-2013. 2007<br />
60 GTZ. Identification and Benchmarking of Promising<br />
Sectors in Yemen. 2008<br />
61 GTZ. Identification and Benchmarking of Promising<br />
Sectors in Yemen. 2008<br />
62 GTZ. Identification and Benchmarking of Promising<br />
217
218<br />
ENDNOTES<br />
Sectors in Yemen. 2008<br />
63 <strong>Cities</strong> <strong>Alliance</strong>/World Bank/Government of Yemen/<br />
Secretariat Capital of Sana’a (2010), Sana’a: a City<br />
Development Strategy, p.22-24.<br />
64 <strong>Cities</strong> <strong>Alliance</strong>/World Bank/Government of Yemen/<br />
Secretariat Capital of Sana’a (2010), Sana’a: a City<br />
Development Strategy, pp.13-14.<br />
65 GTZ. Identification and Benchmarking of Promising<br />
Sectors in Yemen. 2008<br />
66 <strong>Cities</strong> <strong>Alliance</strong>/World Bank/Government of Yemen/<br />
Secretariat Capital of Sana’a (2010)<br />
67 SSCCSE (2010), Food and Nutrition Security<br />
Assessment: Analysis of 2009 National Baseline<br />
Household Survey.<br />
68 USAID Djibouti-Ville Urban Baseline Study. 2003.<br />
69 Government of Yemen, WB, UNDP. Yemen Poverty<br />
Assessment. 2007. Volume 1<br />
70 UNDP. Profil de la pauvreté à Djibouti. 2002<br />
71 African Economic Outlook. Djibouti Overview.<br />
72 World Bank. Country Brief.<br />
73 World Bank. Somalia Socio-Economic Survey 2002.<br />
74 OECD. 2011. Africa Economic Outlook: Sudan.<br />
Washington D.C.: OECD.<br />
75 UN-Habitat. (2011). State of the <strong>Cities</strong> Background<br />
Paper: Sudan. Nairobi: UN-Habitat.<br />
76 Government of Yemen, WB, UNDP. Yemen Poverty<br />
Assessment. 2007. Volume 1<br />
77 <strong>Cities</strong> <strong>Alliance</strong>/World Bank/Government of Yemen/<br />
Secretariat Capital of Sana’a (2010), Sana’a: a City<br />
Development Strategy, pp.22-24.<br />
78 World Bank. Djibouti Country Brief.<br />
79 African Economic Outlook. Djibouti Overview.<br />
80 OECD. 2011. Africa Economic Outlook: Sudan.<br />
Washington D.C.: OECD.<br />
81 UNDP/Union of Comoros. (2006). Genre et<br />
Developpement Humain, p. 19.<br />
82 Ministère de l’Economie, des Finances, et de la<br />
Planification, chargé de la Privatisation/UNDP, Profil<br />
de la pauvreté à Djibouti, p.78 December 2002.<br />
83 IIUD calculation based on Government of Yemen,<br />
WB, UNDP. Yemen Poverty Assessment. 2007.<br />
Volume 4<br />
84 Sudan, Population and Housing Census, 2008.<br />
85 UNDP and Ministère du Plan et de l’Aménagement<br />
du Territoire. Union of Comoros Pauvreté, inégalité<br />
et marché du travail dans l’Union des Comores.<br />
2005<br />
86 UNDP/World Bank (2006), Somalia Joint Needs<br />
Assessment: Infrastructure Cluster Report, p.xvi.<br />
87 World Bank. Djibouti Country Brief.<br />
88 .<br />
National Council for Population, 2007<br />
89 UNESCO. “UIS Statistics in Brief: Education (all<br />
levels) Profile – Djibouti.”<br />
90 World Bank. “Somalia: from Resilience towards<br />
Recovery and Development.” Washington, D.C.:<br />
World Bank, 2006.<br />
91 UNDP and Ministère du Plan et de l’Aménagement<br />
du Territoire. Union of Comoros Pauvreté, inégalité<br />
et marché du travail dans l’Union des Comores.<br />
2005<br />
92 UNESCO. “UIS Statistics in Brief: Education (all<br />
levels) Profile – Djibouti.”<br />
93 OECD. 2011. Africa Economic Outlook: Djibouti.<br />
Washington D.C.: OECD.<br />
94 UNDP, Djibouti Govt. ENQUETE DJIBOUTIENNE A<br />
INDICATEURS MULTIPLES. 2007<br />
95 <strong>Cities</strong> <strong>Alliance</strong>/World Bank/Government of Yemen/<br />
Secretariat Capital of Sana’a (2010), Sana’a: a City<br />
Development Strategy, p.16.<br />
96 WHO. Djibouti Country Profile. 2010.<br />
97 WHO. Maternal health Comoros Profile. 2007<br />
98 WHO. Somalia Health Profile. 2010. http://www.<br />
who.int/gho/countries/som.pdf<br />
99 UNICEF, Somalia: Multiple Indicator Cluster Survey<br />
2006, p.40.<br />
100 UNDP/World Bank (2003), Socio-Economic Survey<br />
2002, p.78.<br />
101 OECD. 2011. Africa Economic Outlook: Sudan.<br />
Washington D.C.: OECD.<br />
102 WHO. Yemen Country Profile. 2010. http://www.<br />
emro.who.int/emrinfo/index.aspx?Ctry=yem<br />
103 WHO. Retrieved February 10, 2011 at http://www.<br />
emro.who.int/somalia/<br />
104 WHO. ‘Somalia Country Profile.’<br />
105 WB Somalia From Resilience to Development.2006<br />
106 IMF. IMF Comoros Poverty Reduction and Growth<br />
Strategy 2009.<br />
107 Poverty Reduction and Growth Strategy Paper<br />
(2009). Office of the Commissioner General for<br />
Planning, Presidency of the Union of Comoros.<br />
108 WB database – international tourism indicators<br />
2000-2009<br />
109 IMF Poverty Reduction Strategy Paper. 2009<br />
110 OECD. 2011. Africa Economic Outlook: Djibouti.<br />
Washington D.C.: OECD.<br />
111 WB database – international tourism indicators<br />
2000-2009<br />
112 GTZ. Identification and Benchmarking of Promising<br />
Sectors in Yemen. 2008<br />
113 UNESCO. Retrieved January 31, 2011 at http://whc.<br />
unesco.org/en/254<br />
114 GTZ. Identification and Benchmarking of Promising<br />
Sectors in Yemen. 2008<br />
115 Yemen Ministry of Planning and International<br />
Cooperation Website. Tourism Sector Background<br />
Info. http://www.mpic-yemen.org/new1/strategies.<br />
asp?contantmain=6&key=17&stratigy=71<br />
116 GTZ. Identification and Benchmarking of Promising<br />
Sectors in Yemen. 2008<br />
117 WB database – international tourism indicators<br />
2000-2009<br />
118 UN Human Settlements Programme. “Urban Sector<br />
Studies and Capacity Building for Khartoum State.”<br />
United Nations Habitat. 2009.<br />
119 UN Population Division, World Population Prospects:<br />
the 2008 Revision.<br />
120 World Bank Development Indicators<br />
121 World Bank. “Project Appraisal Document on a<br />
Proposed Grant in the Amount of SDR 14.5 Million<br />
(US$22 Equivalent) to the Republic of Yemen for an<br />
Integrated Urban Development Project.” April 22,<br />
2010.<br />
122 UN Human Settlements Programme, 2009.<br />
123 UN General Assembly. “Rapport National Présenté<br />
Conformément au Paragraphe 15 A) de l’Annexe à<br />
la Resolution 5/1 du Conseil des Droits de l’Homme:<br />
Djibouti.” Geneva, 2009.<br />
124 Al-Awadhi, Yasmeen. “Informal Settlements in<br />
Sana’a.” Presentation made by the Assistant Deputy<br />
Minister for Housing and Urban Development,<br />
Ministry of Public Works and Highways at the<br />
UN ESCWA Expert Group Meeting on “Bridging<br />
the Urban Divide in the ESCWA Region: Towards<br />
Inclusive <strong>Cities</strong>” in Beirut, Lebanon, November 25-<br />
26, 2010.<br />
125 World Bank. “The Macroeconomic and Sectoral<br />
Performance of Housing Supply Policies in Selected<br />
MENA Countries: a Comparative Analysis of Algeria,<br />
Egypt, Iran, Jordan, Lebanon, Morocco, Tunisia and<br />
Yemen.” Washington, D.C.: World Bank, 2005.<br />
126 UN Human Settlements Programme, 2009.<br />
127 UN Human Settlements Programme, 2009.<br />
128 UN-Habitat. “State of <strong>Cities</strong> Background Report:<br />
Sudan.” Nairobi: UN-Habitat, 2011.<br />
129 UN-Habitat. “State of <strong>Cities</strong> Background Report:<br />
Sudan.” Nairobi: UN-Habitat, 2011.<br />
130 United Nations Development Program.<br />
“Republique de Djibouti: Initiative Nationale pour le<br />
Développement Social (INDS 2008-2012).” United<br />
Nations Development Program. Djibouti, February<br />
2010.<br />
131 Abdillahi, H.Y., ‘Maîtriser la gestion urbaine’. La<br />
Nation, April 29, 2010. Retrieved December 12,<br />
2010 at:<br />
132 UNDP. Retrieved October 20, 2010 at: http://www.<br />
sd.undp.org/focus_poverty_reduction.htm<br />
133 De Geoffroy, A. (2009) ‘Fleeing war and relocating<br />
to the urban fringe – issues and actors: the cases of<br />
Khartoum and Bogota.’ International Review of the<br />
Red Cross: 91/875, p.514.<br />
134 Jacobsen, K. (2008). “Internal displacement to urban<br />
areas: the Tufts-IDMC profiling study. Khartoum,<br />
Sudan: case study 1.” Feinstein International Center,<br />
Tufts University, in collaboration with Internal Displacement<br />
Monitoring Center, Geneva.<br />
135 UNDP/World Bank. “Socio-Economic Survey 2002.”<br />
UNDP/World Bank, 2003.<br />
136 United Nations Statistics Division.<br />
137 USAID. “USAID Country Profile: Property Rights and<br />
Resource Governance: Yemen.” USAID. 2010.<br />
138 USAID, 2010.<br />
139 World Bank. “Project Appraisal Document on a<br />
Proposed Grant in the Amount of SDR 14.5 Million<br />
(US$22 Equivalent) to the Republic of Yemen for an<br />
Integrated Urban Development Project.” April 22,<br />
2010.<br />
140 <strong>Cities</strong> <strong>Alliance</strong>/World Bank/Government of Yemen/<br />
Secretariat Capital of Sana’a (2010). “Sana’a: a City<br />
Development Strategy.”<br />
141 <strong>Cities</strong> <strong>Alliance</strong>/World Bank/Government of Yemen/<br />
Secretariat Capital of Sana’a (2010).<br />
142 Republic of Djibouti. “PAPFAM – Rapport Final.” April<br />
2004.<br />
143 UNDP/World Bank. “Socio-Economic Survey 2002.”<br />
UNDP/World Bank, 2003.<br />
144 Puntland Development research Centre (2004), Draft<br />
Report on Socio-Economic Assessment in Puntland,<br />
p.7.<br />
145 Urban Development Programme for the Somali<br />
Region. “Berbera: First Steps towards Strategic<br />
Urban Planning.” United Nations Haibitat. 2008.<br />
146 Jacobsen, K. (2008). ‘Internal displacement to urban<br />
areas: the Tufts-IDMC profiling study.’ Khartoum,<br />
Sudan: case study 1, p.49. Feinstein International<br />
Center, Tufts University, in collaboration with Internal<br />
Displacement monitoring Center, Geneva.<br />
147 1970 Unregistered Land Act.<br />
148 Norton, G. with UN-Habitat / Norwegian Refugee<br />
Council / UNHCR (2008).<br />
149 Norton, G. with UN-Habitat / Norwegian Refugee<br />
Council / UNHCR (2008), Land, Property and Housing<br />
in Somalia, p.111.<br />
150 Norton, G. with UN-Habitat / Norwegian Refugee<br />
Council / UNHCR (2008).<br />
151 Norton, G. with UN-Habitat / Norwegian Refugee<br />
Council / UNHCR (2008).<br />
152 Norton, G. with UN-Habitat / Norwegian Refugee<br />
Council / UNHCR (2008).<br />
153 “Gestion de l’Habitat: le Contexte Djiboutien.” La<br />
Nation, August 15, 2010.<br />
154 <strong>Cities</strong> <strong>Alliance</strong>/World Bank/Government of Yemen/<br />
Secretariat Capital of Sana’a (2010).<br />
155 Yemen Armed Violence Assessment (2010), ‘Under<br />
pressure: Social violence over land and water in<br />
Yemen’, p.4. Issue Brief No. 2, prepared by Gavin<br />
Hales.<br />
156 Office of the Commissioner General for<br />
Planning, Government of Yemen. “Action Plan<br />
for Implementation of the 2010-2014 Poverty<br />
Reduction and Growth Strategy.” Washington D.C.:<br />
International Monetary Fund, 2009.<br />
157 Creative Associates International, Inc. “Juba<br />
Assessment: Town Planning and Administration.”<br />
USAID, 2005.<br />
158 UN Human Settlements Programme, 2009.<br />
159 UN Human Settlements Programme, 2009.<br />
160 Hales, G. “Under pressure: Social violence over<br />
land and water in Yemen.” Yemen Armed Violence
ENDNOTES<br />
Assessment, Issue Brief No. 2, 2010.<br />
161 USAID. “USAID Country Profile: Property Rights and<br />
Resource Governance: Yemen.” USAID. 2010.<br />
162 IMF. “Union of the Comoros: Poverty Reduction<br />
and Growth Strategy Paper.” Washington, D.C.:<br />
International Monetary Fund, 2010.<br />
163 Saeed, A., ‘Only four per cent of Yemeni have bank<br />
accounts’. Yemen Times, January 24, 2011. Retrieved<br />
January 31, 2011 at: http://yementimes.com/defaultdet.aspx?SUB_ID=35463<br />
164 IMF. “Union of the Comoros: Poverty Reduction<br />
and Growth Strategy Paper.” Washington, D.C.:<br />
International Monetary Fund, 2010.<br />
165 IMF. “Djibouti: Poverty Reduction Strategy Paper.”<br />
Washington, D.C.: International Monetary Fund,<br />
2009.<br />
166 IMF. “Union of the Comoros: Poverty Reduction<br />
and Growth Strategy Paper.” Washington, D.C.:<br />
International Monetary Fund, 2010.<br />
167 Maimbo, S. M, ed. “Remittances and Economic<br />
Development in Somalia: an Overview.” World Bank<br />
Social Development Papers on Conflict Prevention<br />
and Reconstruction, Paper. No. 38: 2006.<br />
168 Maimbo, 2006.<br />
169 State Department<br />
170 UNDP/World Bank (2006), Somalia Joint Needs<br />
Assessment: Infrastructure Cluster Report, p.4.<br />
171 World Bank. “Sudan: the Road toward Sustainable<br />
and Broad-Based Growth.” Washington, D.C.: The<br />
World Bank, 2009.<br />
172 Central Statistical Office. Transport & Travel<br />
173 Library of Congress, Federal Research Division,<br />
‘Country profile: Yemen’. August 2008.<br />
174 World Health Organization. “Global Status Report on<br />
Road Safety: Time for Action.” Geneva: World Health<br />
Organization, 2009.<br />
175 Trans-Africa Consortium, 2008.<br />
176 Pantuliano, S., et al. “City Limits: Urbanisation and<br />
Vulnerability in Sudan: Synthesis Report.” London:<br />
Overseas Development Institute, 2011.<br />
177 US Embassy – Sudan. “About Sudan.” United States<br />
State Department.<br />
178 Trans-Africa Consortium. “Overview of Public<br />
Transport in Sub-Saharan Africa.” International<br />
Association of Public Transport, Brussels: 2008.<br />
179 Trans-Africa Consortium, 2008.<br />
180 World Bank. “Republic of Yemen: Urban Transport in<br />
Sana’a Strategy Note.” World Bank, 2010.<br />
181 World Health Organization, 2009.<br />
182 Central Statistical Office. Transport & Travel , table 6<br />
183 “Djibouti Face a un Probleme de Penurie d’Eau.”<br />
Agence Djiboutienne d’Information, Mar. 17, 2006.<br />
184 World Bank. “Making the Most of Scarcity: Accountability<br />
for Better Water Management Results in the<br />
Middle East and North Africa.” Washington, D.C.:<br />
The World Bank, 2007.<br />
185 UN FAO. “Water Profile of Somalia.” In Encyclopaedia<br />
of Earth. C.J. Cleveland, ed. Washington, D.C.:<br />
Environmental Information Coalition, National Council<br />
for Science and the Environment, 2008.<br />
186 World Bank. “Yemen: Assessing the Impacts of<br />
Climate Change and Variability on the Water and<br />
Agricultural Sectors and the Policy Implications.”<br />
Washington, D.C.: World Bank, 2010.<br />
187 OCHA, Policy Studies and Development Branch<br />
(2010), Water Scarcity and Humanitarian Action:<br />
Key Emerging Trends and Challenges, p.7. OCHA<br />
Occasional Policy Briefing Series – No. 4.<br />
188 <strong>Cities</strong> <strong>Alliance</strong>/World Bank/Government of Yemen/<br />
Secretariat Capital of Sana’a (2010), Sana’a: a City<br />
Development Strategy, p.18.<br />
189 <strong>Cities</strong> <strong>Alliance</strong>/World Bank/Government of Yemen/<br />
Secretariat Capital of Sana’a (2010), Sana’a: a City<br />
Development Strategy, p.18.<br />
190 <strong>Cities</strong> <strong>Alliance</strong>/World Bank/Government of Yemen/<br />
Secretariat Capital of Sana’a (2010), Sana’a: a City<br />
Development Strategy, p.18.<br />
191 Union of the Comoros- Director General of<br />
Energy, Mines, and Water. “Projet Alimentation<br />
en Eau Potable et d’Assainissement.” The African<br />
Development Bank, 2010.<br />
192 World Health Organization / Global Health<br />
Observatory Database. Online at: http://apps.<br />
who.int/ghodata.<br />
193 Ministry of Health. “Enquete Djiboutienne a<br />
Indicateurs Multiple: Rapport Final.” Republic of<br />
Djibouti, 2007.<br />
194 The International Monetary Fund. “Comoros:<br />
Poverty Reduction and Growth Strategy Paper.” The<br />
International Monetary Fund, Washington, D.C., July<br />
2010. Paper 10/90<br />
195 World Bank/UNDP/Government of Yemen (2007),<br />
Poverty Assessment: Volume 4, p.24.<br />
196 Central Statistical Office. Retrieved January<br />
31, 2011 at: www.cso-yemen.org/<br />
content.php?lng=arabic&id=545 (Construction &<br />
Building & Housing, table 5-5)<br />
197 USAID (2008), Somalia: Water and Sanitation Profile’.<br />
198 UN Joint Program on Local Governance and<br />
Decentralised Service Delivery. “Third Quarterly<br />
Report 2010.” United Nations Somalia. November<br />
2010.<br />
199 World Bank. “Country Brief: Middle East & North<br />
Africa Region (MENA) – Yemen.” World Bank, 2009.<br />
200 Al-Harithi, Nadia. “Decentralization of formal<br />
water sector institutions in Yemen from IWRM<br />
perspectives.” 34th WEDC International Conference.<br />
Addis Ababa, Ethiopia, 2009. Also, The World Bank.<br />
“Implementation Status & Results: Yemen-Water<br />
Sector Support (P107037).” The World Bank Group.<br />
11 January 2011.<br />
201 World Health Organization / Global Health<br />
Observatory Database. Online at: http://apps.<br />
who.int/ghodata<br />
202 UN Human Settlements Programme. “Urban Sector<br />
Studies and Capacity Building for Khartoum State.”<br />
United Nations Habitat. 2009.<br />
203 Union of the Comoros- Director General of<br />
Energy, Mines, and Water. “Projet Alimentation<br />
en Eau Potable et d’Assainissement.” The African<br />
Development Bank, 2010.<br />
204 The International Monetary Fund. “Comoros:<br />
Poverty Reduction and Growth Strategy Paper.” The<br />
International Monetary Fund, Washington, D.C., July<br />
2010. Paper 10/90<br />
205 <strong>Cities</strong> <strong>Alliance</strong>/World Bank/Government of Yemen/<br />
Secretariat Capital of Sana’a (2010), Sana’a: a City<br />
Development Strategy, p.20.<br />
206 McCarthy, M., ‘Why Canada is the best haven for climate<br />
change’. The Independent, July 4, 2008.<br />
207 Poverty Reduction and Growth Strategy Paper (2009 ), p.47. Office of the<br />
Commissioner General For Planning, Presidency of the<br />
Union of the Comoros.<br />
208 WHO, ‘Weekly highlights 29 Jan – 4 Feb 2011’.<br />
209 UNEP. “Sudan: Post-Conflict Environmental<br />
Assessment.’ Nairobi: UNEP, 2007.<br />
210 http://www.km.undp.org/sgp.htm<br />
211 United Nations Development Programme - Union des<br />
Comores. “Changements Climatiques: 22 accords<br />
de congestion dans 22 villages.” United Nations<br />
Development Programme. December 2010. http://<br />
www.km.undp.org/cog_22.htm<br />
212 Freedom House. “Djibouti.” http://<br />
www.freedomhouse.org/template.<br />
cfm?page=363&year=2010<br />
213 Global Information and Early Warning System.<br />
“Somalia.” UN Food and Agriculture Organization, 11<br />
Feb. 2011.<br />
214 Global Information and Early Warning System.<br />
“Sudan.” UN Food and Agriculture Organization. 13<br />
Jan.2011.<br />
215 Global Information and Early Warning System.<br />
“Yemen.” UN Food and Agriculture Organization. 10<br />
January 2011.<br />
216 World Bank. “Improving Food Security in <strong>Arab</strong><br />
Countries.” Washington, D.C.: World Bank, 2009.<br />
217 Country and Regional Department- East. “Union of<br />
the Comoros: Interim Country Strategy Paper 2009-<br />
2010.” The African Development Bank. March 2009.<br />
218 Office of the Commissioner General For Planning,<br />
Presidency of the Union of the Comoros. “Poverty<br />
Reduction and Growth Strategy Paper.” 2009.<br />
219 UNEP. “Sudan: Post-Conflict Environmental Assessment.’<br />
Nairobi: UNEP, 2007.<br />
220 UNDP/World Bank (2006), Somalia Joint Needs<br />
Assessment: Infrastructure Cluster Report, p.xiv.<br />
221 UNEP. “Sudan: Post-Conflict Environmental<br />
Assessment.” Nairobi: UNEP, 2007.<br />
222 Ministry of Health, Republic of Djibouti. “Enquete<br />
Djiboutienne a Indicateurs Multiple: Rapport Final.”<br />
Republic of Djibouti, 2007.<br />
223 International Monetary Fund. “Comoros: Poverty<br />
Reduction and Growth Strategy Paper.” International<br />
Monetary Fund, Washington, D.C., July 2010. Paper<br />
10/90<br />
224 International Monetary Fund. “Comoros: Poverty<br />
Reduction and Growth Strategy Paper.” International<br />
Monetary Fund, Washington, D.C., July 2010. Paper<br />
10/90<br />
225 World Bank. “Sudan: the Road toward Sustainable<br />
and Broad-Based Growth.” Washington, D.C.: World<br />
Bank, 2009.<br />
226 African Economic Outlook. Comoros Profile.<br />
227 Ministry of Health, Republic of Djibouti. “Enquete<br />
Djiboutienne a Indicateurs Multiple: Rapport Final.”<br />
Republic of Djibouti, 2007.<br />
228 UN-Habitat (2007), Hargeisa: First Steps Towards<br />
Strategic Urban Development Planning.<br />
229 UNDGO/World Bank, Joint Assessment Mission.<br />
Retrieved October 20, 2010 at: Volume 1, Synthesis:<br />
Framework for Sustained Peace, Development and<br />
Poverty Eradication. March, 2005.Retrieved October<br />
20, 2010.<br />
230 World Bank. “Sudan: the Road toward Sustainable<br />
and Broad-Based Growth.” Washington, D.C.: World<br />
Bank, 2009.<br />
231 World Bank, ‘Project information document (PID)<br />
appraisal stage’. May 19, 2009. Retrieved January<br />
31, 2011.<br />
232 UNDP/World Bank. “Somalia Joint Needs<br />
Assessment: Infrastructure Cluster Report.” World<br />
Bank, 2006.<br />
233 The International Monetary Fund. “Comoros:<br />
Poverty Reduction and Growth Strategy Paper.” The<br />
International Monetary Fund, Washington, D.C., July<br />
2010. Paper 10/90<br />
234 Richter, L. “Gafo Energy NZ Invests in Comoros<br />
Geothermal Development.” Gafo Energy Press<br />
Release, June 4, 2010. Available online at http://<br />
gafoen.com/site/index.php?page=News.<br />
235 UNEP. “Sudan: Post-Conflict Environmental Assessment.”<br />
Nairobi: UNEP, 2007.<br />
236 UNEP (2007), Sudan: post-conflict Environmental<br />
Assessment, p.133.<br />
237 The International Monetary Fund. “Comoros:<br />
Poverty Reduction and Growth Strategy Paper.” The<br />
International Monetary Fund, Washington, D.C., July<br />
2010. Paper 10/90<br />
238 Ministère de l’Economie, des Finances, et de la<br />
Planification, chargé de la Privatisation/UNDP, Profil<br />
de la pauvreté à Djibouti, p.26. December 2002.<br />
239 GTZ: http://www.gtz.de/en/themen/umweltinfrastruktur/abfall/11520.htm#top<br />
240 Sana’a Office. “Yemen Quarterly Economic Review:<br />
Spring 2010.” The World Bank. 2010<br />
241 UN-Habitat. “State of the African <strong>Cities</strong> 2008.”<br />
Nairobi: UN-Habitat, 2008.<br />
242 USAID. “USAID Country Profile: Property Rights and<br />
219
220<br />
ENDNOTES<br />
Resource Governance: Yemen.” USAID. 2010.<br />
243 UN Human Settlements Programme. “Urban Sector<br />
Studies and Capacity Building for Khartoum State.”<br />
UN-Habitat. 2009.<br />
244 USAID. “USAID Country Profile: Property Rights and<br />
Resource Governance: Yemen.” USAID. 2010.<br />
245 Pantuliano, S., et al. “City Limits: Urbanisation and<br />
Vulnerability in Sudan: Synthesis Report.” London:<br />
Overseas Development Institute, 2011.<br />
246 Pantuliano, S., et al. “City Limits: Urbanisation and<br />
Vulnerability in Sudan: Synthesis Report.” London:<br />
Overseas Development Institute, 2011.<br />
247 H.E. Mr. Abdel Kareem Al-Arhabi, Deputy Prime<br />
Minister for Economic Affairs, Minister of Planning<br />
and International Cooperation, ‘Foreword’. In<br />
<strong>Cities</strong> <strong>Alliance</strong>/World Bank/Government of Yemen/<br />
Secretariat Capital of Sana’a (2010), Sana’a: a City<br />
Development Strategy. Retrieved January 31, 2011.<br />
248 <strong>Cities</strong> <strong>Alliance</strong>/World Bank/Government of Yemen/<br />
Secretariat Capital of Sana’a (2010), Sana’a: a City<br />
Development Strategy, pp.25-26. Retrieved January<br />
31, 2011.<br />
249 Library of Congress, Federal Research Division,<br />
‘Country profile: Yemen’. August 2008.<br />
250 The International Monetary Fund. “Comoros:<br />
Poverty Reduction and Growth Strategy Paper.” The<br />
International Monetary Fund, Washington, D.C., July<br />
2010. Paper 10/90<br />
251 IRIN, Comoros: Referendum approves downscaling<br />
of government’. May 19, 2009.<br />
252 United States Government, Department of States,<br />
Human Rights Report 2009: Djibouti.<br />
253 African Development Bank Group. “Urban Poverty<br />
Reduction Project.” The African Development Bank<br />
Group. 2011.<br />
254 World Bank/Licus (2007). Assessment of Localities’<br />
Compliance with Minimum Qualifying Criteria and<br />
Identification of their Capacity Needs in Northern<br />
Sudan<br />
255 UN-Habitat. “State of <strong>Cities</strong> Background Report:<br />
Sudan.” Nairobi: UN-Habitat, 2011.<br />
256 UNDP Sudan. “Support to Public Sector, Decentralization<br />
and Capacity Building Project.” 2010.<br />
257 UNDP-POGAR. “Somalia Country Profile.”<br />
258 UNDP. “The Association of Local Government<br />
Authorities for Somaliland: a Strong Voice for Local<br />
Authorities.”<br />
259 EU/UN-Habitat (2002), Somalia Urban Sector Profile<br />
Study.<br />
260 Freedom House. Somalia Country Report 2010.<br />
261 Norton, G. with UN-Habitat / Norwegian Refugee<br />
Council / UNHCR. Land, Property and Housing in<br />
Somalia. Nairobi: UN-Habitat, 2008.<br />
262 UNDP-POGAR. Yemen Country Profile.<br />
263 <strong>Cities</strong> <strong>Alliance</strong>/World Bank/Government of Yemen/<br />
Secretariat Capital of Sana’a (2010), Sana’a: a City<br />
Development Strategy.<br />
264 Franz Gerner and Silvana Tordo, Republic of Yemen:<br />
A Natural Gas Incentive Framework (Formal Report<br />
327/07. Energy Sector Management Assistance<br />
Program, World Bank, 2008).<br />
265 World Bank. “Sudan: the Road Toward Sustainable<br />
and Broad-Based Growth.” Washington, D.C.: World<br />
Bank, 2009.<br />
266 UN-Habitat. “Field Report-Africa: Best Practices.”<br />
Urban World Vol. 1(3): 2009.<br />
267 “Best Practices – Africa Field Report” in UN-<br />
Habitat’s Urban World, Vol. 1 (3), 2009.<br />
268 Freedom House (2010), Comoros Country Report.<br />
Retrieved October 30, 2010.<br />
269 Department of State, United States Government<br />
(2010), 2009 Human Rights Report: Yemen.<br />
Retrieved January 31, 2011 at: http://www.state.<br />
gov/g/drl/rls/hrrpt/2009/nea/136083.htm<br />
270 Freedom House. Djibouti Country Report. Retrieved<br />
December 12, 2010.<br />
271 UNDP-POGAR. Somalia Report. Retrieved February<br />
10, 2011.<br />
272 United States Government, Department of State.<br />
2009 Human Rights Report: Somalia. Retrieved February<br />
10, 2011.<br />
273 UN OCHA Somalia (2010), Somalia Humanitarian<br />
Overview, 3 (9). September 2010. Retrieved<br />
February 10, 2011.<br />
274 UN OCHA (2010), Humanitarian Access : update<br />
01 to 30 November 2010. Retrieved February 10,<br />
2011.<br />
275 UN-Habitat. “State of <strong>Cities</strong> Background Report.”<br />
Nairobi: UN-Habitat, 2011.<br />
276 Freedom House. 2010 Djibouti Country Report.<br />
Retrieved December 12, 2010.<br />
277 UNDP. “Women select women councilors in<br />
Puntland.” United Nations Development Programme<br />
Somalia. August 2009.<br />
278 Parline. “Sudan: National Assembly.” Inter-<br />
Parliamentary Union. 19 November 2010.<br />
279 United States Government, Department of State.<br />
2009 Human Rights Report: Somalia.<br />
280 United States Government, Department of State.<br />
2009 Human Rights Report: Somalia.<br />
281 UNDP/World Bank (2003), Socio-Economic Survey<br />
2002, p.94.<br />
282 Parline. “Yemen: House of Representatives.” Inter-<br />
Parliamentary Union. 27 January 2010.<br />
283 UNHCR. Country operations profile – Somalia. 2011.<br />
284 UNHCR. Djibouti 10-point Plan of Action. 2008.<br />
285 International Organization for Migration. 2011.<br />
Yemen. Sana’a: IOM.<br />
286 UNHCR. Country operations profile – Yemen. 2011.<br />
287 World Bank. Migration and Remittances Factbook.<br />
2011.<br />
288 World Bank/UNDP/Government of Yemen (2007),<br />
Poverty Assessment, pp.75-76.<br />
289 UNDP. Human Development Report – Somalia. 2001.<br />
290 World Bank. Migration and Remittances Factbook.<br />
2011.<br />
291 UNHCR. “Where do Somalis Flee?”<br />
292 WB. Yemen Quarterly Economic Review. Summer<br />
2010.<br />
293 Madagascar and The Comoros US Embassy.<br />
Comoros Human Rights Report 2010.<br />
294 UNHCR. “2011 UNHCR Country Operations Profile –<br />
Sudan.” Geneva: UNHCR, 2011<br />
295 UNHCR. “2011 UNHCR Country Operations Profile –<br />
Sudan.” Geneva: UNHCR, 2011<br />
296 International Organization for Migration. 2011.<br />
Sudan. Khartoum: IOM.<br />
297 Oxfam. “Rescuing the Peace in Southern Sudan:<br />
Briefing Paper.” January 2010<br />
298 UN-Habitat. (2011). State of the <strong>Cities</strong> Background<br />
Paper: Sudan. Nairobi: UN-Habitat.<br />
299 UNHCR. “Country Operations Profile-Sudan.”<br />
Geneva: UNHCR, 2011.<br />
300 UNHCR. “Country Operations Profile-Sudan.”<br />
Geneva: UNHCR, 2011.<br />
301 De Geoffroy, A. (2009) ‘Fleeing war and relocating<br />
to the urban fringe – issues and actors: the cases of<br />
Khartoum and Bogota. International Review of the<br />
Red Cross: 91/875, pp.517.<br />
302 2011 UNHCR country operations profile – Somalia<br />
http://www.unhcr.org/pages/49e483ad6.html<br />
303 UNHCR. “Where do Somalis Flee?”<br />
304 Global Information and Early Warning System/FAO.<br />
« Somalia Country Brief. « August 2011.<br />
305 World Bank. “Yemen Quarterly Economic Review.”<br />
Summer 2010.<br />
306 International Organization for Migration. 2011.<br />
Yemen. Sana’a: IOM.<br />
307 <strong>Cities</strong> <strong>Alliance</strong>/World Bank/Government of Yemen/<br />
Secretariat Capital of Sana’a (2010), Sana’a: a City<br />
Development Strategy<br />
308 UN-Habitat. “State of the World <strong>Cities</strong>: 2010/2011-<br />
<strong>Cities</strong> for All: Bridging the Urban Divide.” UN-Habitat.<br />
2010<br />
309 UNESCO. Index web-update site accessed on 19 July<br />
2010.
Bibliography<br />
$500 Million Mortgage Facility Launched<br />
in Palestine.’ Overseas Private Investment<br />
Corporation. June 2 2010.<br />
2009 Statistical Yearbook, Ministry of National<br />
Economy, Sultanate of Oman, 2009.<br />
2009 Annual Report. Ar-Riyadh Development<br />
Authority, Kingdom of Saudi <strong>Arab</strong>ia, 2009.<br />
2010 Census. Kingdom of Bahrain, Central<br />
Informatics Organization, 2010.<br />
2010 Census. Qatar Information Exchange and<br />
Qatar Statistics Authority, 2010.<br />
‘A National Spatial Strategy for Saudi <strong>Arab</strong>ia’ Al-<br />
Imam Muhammad Ibn Saud Islamic University.<br />
Ababsa, M. “The Evolution of Upgrading<br />
Policies in Amman.” in proceedings of the<br />
2nd International Conference on Sustainable<br />
Architecture and Urban Development in Amman,<br />
Jordan.<br />
Abdelkader, Z.B. ‘Express Metro and Light Rail<br />
Will Support Capital’s Growth.’ Railway Gazette,<br />
April 1 2007.<br />
Abdillahi, H.Y., ‘Maîtriser la gestion urbaine’. La<br />
Nation, April 29, 2010.<br />
‘Abu Dhabi 2030: The blueprint.’ AMEInfo, March<br />
24, 2008<br />
‘Abu Dhabi Plans Tourism Makeover.’ AMEInfo,<br />
March 24, 2008.<br />
Abu Dhabi Urban Planning Council, ‘Plan Abu<br />
Dhabi 2030: Urban Structure Framework Plan,’<br />
2007.<br />
Advancing the Blue Revolution Initiative. ‘Somalia:<br />
Water and Sanitation Profile.’ USAID, 2008.<br />
‘AECOM hired as Diyar al Muharraq master<br />
planner.’ Construction Week Online, March 14,<br />
2010.<br />
African Development Bank. ‘Djibouti: Urban<br />
Poverty Reduction Project.’ 2011.<br />
__. ‘Tunisia: Country Strategy Paper 2007-2011.’<br />
2007.<br />
__. Union of the Comoros: Interim Country<br />
Strategy Paper 2009-2010. Country and Regional<br />
Department- East, 2009.<br />
__. ‘Urban Poverty Reduction Project Overview.’<br />
2008.<br />
African Development Bank and Union of the<br />
Comoros. “Projet Alimentation en Eau Potable<br />
et d’Assainissement.” The African Development<br />
Bank, 2010.<br />
AFP. ‘In Cairo the Noise Pollution Can Be a Killer.’<br />
Daily News Egypt, January 25 2008.<br />
Agence de Réhabilitation et de Rénovation<br />
Urbaine. Tunisia: ARRU, 2011.<br />
Agence Française de Developpement.<br />
“Managing the Social Dimensions of Climate<br />
Change in MENA: Climate Change and Human<br />
Mobility Concept Note”, in proceedings of the<br />
First Workshop on Climate Induced Migration<br />
and Displacement in MENA, Marseille, France.<br />
Al-Abdullah, M., ‘Mortgage options urged as<br />
realtors gather in Dammam.’ Saudi Gazette,<br />
October 25, 2010.<br />
Al-Awadhi, J., Misak, R. and Omar, S., ‘Causes<br />
and consequences of desertification of Kuwait:<br />
a Case Study of Land Degradation.’ Bulletin of<br />
Engineering Geology and the Environment, 2003.<br />
Al-Awadhi, Y., “Informal Settlements in Sana’a.”,<br />
in proceedings of the UN ESCWA Expert Group<br />
Meeting on Bridging the Urban Divide in the<br />
ESCWA Region: Towards Inclusive <strong>Cities</strong>, Beirut,<br />
Lebanon.<br />
Aleppo City Development Strategy, 2010 http://<br />
madinatuna.com/urbanform/vision#vision<br />
Viewed on 6 September 2011.<br />
Aleppo Informal Settlements Task Force.<br />
Informal Settlements in Aleppo: Rapid Profiles of<br />
All Informal Settlements in Aleppo. Municipality<br />
of Aleppo and GTZ, 2009.<br />
Al-Harithi, N., “Decentralization of formal water<br />
sector institutions in Yemen from IWRM”, in<br />
proceedings of the 34th WEDC International<br />
Conference, Addis Ababa, Ethiopia.<br />
Al-Hourani, H., “Civil Society in Jordan: a Literature<br />
Review”, Foundation for the Future, 2010.<br />
Al-Lawati, J. and Jousilahti, P., “Prevalence and<br />
10-year secular trend of obesity in Oman”, Saudi<br />
Medical Journal, 25 2004 346-351.<br />
Al-Manni, A. et al., “Urban growth and land use<br />
change detection in Using Remote Sensing and<br />
Geographic Information System Techniques in Doha<br />
City, State of Qatar”, <strong>Arab</strong> Gulf Journal of Scientific<br />
Research, 25 2007 190-198.<br />
Al Masri, H.A., Property Tax Project – Jordan:<br />
Project Performance Evaluation Report. UNDP,<br />
2007.<br />
Al-Maymouni, R. & Afit, N., ‘Riyadh mayor calls<br />
on government, businesses to assist home<br />
ownership.’ Saudi Gazette, October 19 2010.<br />
Al-Najjar, S.M., Country Reports: Oman. Chapter<br />
in Women’s Rights in the Middle East and North<br />
Africa: Citizenship and Justice Special Report.<br />
Freedom House, 2010.<br />
Al-Rashidi, T., El-Gamily, H., Amos, C. & Rakha, K.,<br />
‘Sea surface temperature trends in Kuwait Bay,<br />
<strong>Arab</strong>ian Gulf’. Natural Hazards, 50 2009 73-82.<br />
Al-Sahhaf, N.A., “The use of remote sensing and<br />
geographic information system technologies to<br />
detect, monitor, and model urban change in Riyadh,<br />
Saudi <strong>Arab</strong>ia,” Thesis of University of California,<br />
Santa Barbara, California, 2000<br />
Al-Sahili, K. “Patterns of the Israeli New Road<br />
Measures and Their Impacts of the Transport<br />
Sector”, An-Najah University Journal, 18 2007.<br />
Al-Sulami, M., ‘Migration from urban to rural areas<br />
on the rise.’ <strong>Arab</strong> News, February 26 2010.<br />
‘Alger, classée en avant-dernière position dans la<br />
liste des villes au monde ayant subies une évaluation<br />
du cadre de vie.’ Echorouk Online, June 12 2009.<br />
221
222<br />
Algerie: 2eme Rapport Nationale sur les Objectifs<br />
du Millenaire pour le Developpement. Republic of<br />
Algeria, 2005.<br />
Amin, K. and Ebel, R., Egyptian Intergovernmental<br />
Relations and Fiscal Decentralization: Diagnostics<br />
and an Agenda for Reform. The World Bank, 2006.<br />
Amnesty International. ‘As Safe as Houses?<br />
Israel’s Demolition of Palestinian Homes.’<br />
Amnesty International, 2010.<br />
Analytical Report on Economic and Social<br />
Dimensions in the United <strong>Arab</strong> Emirates 2009.<br />
National Bureau of Statistics, United <strong>Arab</strong><br />
Emirates, 2010.<br />
Annual Bulletin for Vital Statistics – Marriage &<br />
Divorce. Kuwait, Ministry of Planning. 2008.<br />
Annual Report 2009. Permanent Population<br />
Committee, 2010.<br />
Annual Statistical Abstract: 2009. State of Kuwait<br />
Central Statistical Bureau, 2009.<br />
‘April 2010: Another Bloody Month for Migrant<br />
Workers in Kuwait.’ Migrant Rights, May 8 2010.<br />
“<strong>Arab</strong> Environment Climate Change: Impact of<br />
Climate Change on <strong>Arab</strong> Countries”, <strong>Arab</strong> Forum<br />
for Environment and Development, 2009.<br />
‘Atkins wins role to shape Bahrain’s economic<br />
growth.’ Atkins, June 25, 2010.<br />
Azaz, L.K., “Using Remote Sensing and GIS for<br />
Damage Assessment after Flooding, the Case of<br />
Muscat, Oman, after Gonu Tropical Cyclone 2007:<br />
Urban Planning Perspective”, in proceedings of<br />
the REAL CORP 2010, Tagungsband, Vienna.<br />
Azlitni, B. R. Kh., “The Development of<br />
Physical and Urban Planning Systems in Libya<br />
Sustainability of Planning Projects”, in proceedings<br />
of the World Congress on Housing Transforming<br />
Housing Environments through Design, Pretoria,<br />
South Africa.<br />
Baby, S., ‘Sea barriers.’ Gulf Daily News, May 24<br />
2010.<br />
‘Bahrain labor camps unsafe: India, Pakistan<br />
diplomats.’ Indo-Asian News Service, August<br />
22 2008.<br />
‘Bahrain plans “labor town” for workers.’ Trade<br />
<strong>Arab</strong>ia, April 3 2010.<br />
‘Bahrain: Solving the Housing Problem in<br />
Kingdom.’ Bahrain Tribune, September 12, 2008.<br />
Barendse, J., Hiddink, C., Janszen, A., and<br />
Stavast, A., ‘The Remittance Corridor of the<br />
Netherlands-Morocco: Review of Obstacles and<br />
Recommendations on How to Increase Use of<br />
the Bank Channel.’ Nederland: ECORYS, October<br />
27 2006.<br />
Baxter, E., ‘10 facts about construction in Saudi<br />
<strong>Arab</strong>ia.’ Construction Week Online, May 16 2009.<br />
__. ‘Kuwait signs deals for capital city expansion<br />
plan.’ <strong>Arab</strong>ian Business, August 4 2010.<br />
Belghazi, S., ‘Local Governance, Development<br />
and Service Delivery’ in proceedings of the <strong>Arab</strong><br />
States Local Governance Forum, Sana’a, Yemen.<br />
Bellal, T., ‘Housing Supply in Algeria: Affordability<br />
Matters than Availability.’ Theoretical and<br />
Empirical Researches in Urban Management,<br />
2009.<br />
Berbera: First Steps towards Strategic Urban<br />
Planning. Urban Development Programme for the<br />
Somali Region. UN-Habitat 2008.<br />
Benabderrazik, H., ‘Chapter 11: Opportunities<br />
for Logistical Improvements through Maghreb<br />
Integration.’ Maghreb Regional and Global<br />
Integration: a Dream to be Fulfilled, Washington<br />
D.C.: Peterson Institute for International<br />
Economics, 2008.<br />
Bigio, A., ‘Adapting for Climate Change and<br />
Preparing for Natural Disasters in the Coastal<br />
<strong>Cities</strong> of North Africa.’ The World Bank, 2009.<br />
Bitar, Z., ‘Gulf Rail Network Awaits Approval.’<br />
Zawya, December 1, 2010.<br />
Blackman, S., ‘Construction waste destroys<br />
Bahrain’s coral reef.’ Construction Week Online,<br />
June 15 2010.<br />
Bou-Zeid, E. and El-Fadel, M., “Climate Change<br />
and Water Resources in the Middle East: a<br />
Vulnerability and Adaptation Assessment”,<br />
Journal of Water Resources Planning and<br />
Management, 128 2002 343-55.<br />
Brief Report on the Ninth Development Plan 2010-<br />
2014. Riyadh: Kingdom of Saudi <strong>Arab</strong>ia, Ministry<br />
of Economy and Planning, 2010.<br />
Brown, O. and Crawford, A. ‘Rising<br />
Temperatures, Rising Tensions: Climate Change<br />
and the Risk of Violent Conflict in the Middle<br />
East.’ International Institute for Sustainable<br />
Development, 2009.<br />
Bseiso, R., ‘Brief Report on Adequate Housing and<br />
Housing Rights in Kuwait for Low-Wage Laborers.’<br />
UN-Habitat, 2010.<br />
‘Build barriers to hold back sea.’ Gulf Daily News,<br />
May 18 2009.<br />
‘Building Our Future: Annual Report 2009’ Bahrain<br />
Economic Development Board, 2009<br />
‘Building the capital of the future.’ AMEInfo,<br />
March 24 2008.<br />
Case Study on the Twizé programme.’ Center for<br />
Urban Development Studies, 2001.<br />
Census 2007. Palestinian National Authority,<br />
Palestinian Central Bureau of Statistics, 2008<br />
http://www.pcbs.gov.ps/Portals/_pcbs/<br />
PressRelease/census2007_e.pdf Viewed on 15<br />
September 2011.<br />
CIA World Factbook.Yemen, 2010. https://www.<br />
cia.gov/library/publications/the-world-factbook/<br />
geos/ym.html Viewed on 7 September 2011.<br />
__. Syria, 2009. https://www.cia.gov/library/<br />
publications/the-world-factbook/geos/<br />
sy.htmlViewed on 7 September 2011.<br />
__. Morocco, 2010. https://www.cia.gov/library/<br />
publications/the-world-factbook/geos/mo.html<br />
Viewed on 7 September 2011.<br />
__. Tunisia, 2010. https://www.cia.gov/library/<br />
publications/the-world-factbook/geos/ts.html<br />
Viewed on 7 September 2011.<br />
__. Saudi <strong>Arab</strong>ia, 2010. https://www.cia.gov/<br />
library/publications/the-world-factbook/geos/<br />
sa.html Viewed on 7 September 2011.<br />
<strong>Cities</strong> <strong>Alliance</strong>; World Bank. Tunisie: Evaluation<br />
des Programmes de Rehabilitation Urbaines.<br />
Washington D.C.: The World Bank, 2003.
Choplin, A., ‘Répondre au défi de l’habitat social<br />
dans les villes du Sud: l’exemple du programme<br />
Twise en Mauritanie.’ Les Editions du Gret: Etudes<br />
et Travaux en Ligne #23, 2009.<br />
Chapter Two: Challenges of the Future - National<br />
Physical Master Plan of the Lebanese Territory.<br />
Committee for Development and Reconstruction,<br />
2005 http://www.cdr.gov.lb/study/sdatl/English/<br />
NPMPLT-Chapt2.PDF Viewed on 7 September<br />
2011.<br />
Characteristics of Housing – Possession of Capital<br />
Goods: Habitat Characteristics. Republic of Djibouti.<br />
Colton, N. A. The International Political Economy<br />
of Gulf Migration. Washington, D.C.: Middle East<br />
Institute Viewpoints, 2010.<br />
Communauté Urbaine de Nouakchott. Household<br />
Survey. 2008.<br />
Comoros Human Rights Report 2010. The<br />
Comoros and US Embassy, 2010.<br />
Comoros: Referendum approves downscaling<br />
of government.’ Integrated Regional Information<br />
Networks. May 19 2009.<br />
‘Consumption of water at highest levels.’ Kuwait<br />
Times, September 7 2010.<br />
Country profile: Yemen. Library of Congress,<br />
Federal Research Division, 2008.<br />
“Creating a Bright Future.” International Airport<br />
Review, (4) August 1 2008.<br />
Creative Associates International, Inc. Juba<br />
Assessment: Town Planning and Administration.<br />
USAID, 2005.<br />
Crude Marriage Rate. Qatar Statistics Authority,<br />
2008.<br />
Cultural Heritage, Tourism, and Urban<br />
Development Project: Environmental Impact<br />
Assessment and Environmental Management<br />
Plan. Jordan: Ministry of Tourism and Antiquities,<br />
2006.<br />
Cyberpark of Sidi Abdellah. Government of<br />
Algeria, National Agency for Promotion and<br />
Development of Technology Parks http://<br />
www.anpt.dz/index_en.php# Viewed on 14<br />
September 2011.<br />
De Geoffroy, A., Fleeing war and relocating to the<br />
urban fringe – issues and actors: the cases of<br />
Khartoum and Bogota. International Review of the<br />
Red Cross: 91/875, 2009.<br />
De Haas, H., Trans-Saharan Migration to North<br />
Africa and the EU: Historical Roots and Current<br />
Trends. Washington, D.C.: Migration Policy<br />
Institute, 2006.<br />
De Soto, H., “Dead Capital and the Poor,” SAIS<br />
Review, 21 2001 13-43.<br />
DFID. Country Programme Evaluation: Sudan.<br />
London: Department For International<br />
Development, 2010.<br />
Department of State, United States Government.<br />
‘2009 Human Rights Report: Bahrain,’<br />
Washington, D.C.: Department of State, 2010.<br />
__. ‘2009 Human Rights Report: Djibouti,’<br />
Washington, D.C.: Department of State, 2010.<br />
__. ‘2009 Human Rights Report: Kuwait,’<br />
Washington, D.C.: Department of State, 2010.<br />
__. ‘2009 Human Rights Report: Lebanon,’<br />
Washington, D.C.: Department of State, 2009.<br />
__. ‘2009 Human Rights Report: Qatar,’<br />
Washington, D.C.: Department of State, 2010.<br />
__. ‘2009 Human Rights Report: Saudi <strong>Arab</strong>ia,’<br />
Washington, D.C.: Department of State, 2010.<br />
__. ‘2009 Human Rights Report: Somalia,’<br />
Washington, D.C.: Department of State, 2010.<br />
__. ‘2009 Human Rights Report: Syria,’<br />
Washington, D.C.: Department of State, 2010.<br />
__. ‘2009 Human Rights Report: Yemen,’<br />
Washington, D.C.: Department of State, 2010.<br />
__. ‘Trafficking in Persons Report: 10th edition,’<br />
Washington, D.C.: Department of State, 2010.<br />
__. Background Note: Lebanon. Washington D.C.:<br />
U.S. Department of State, 2011.<br />
Department of Transport, ‘Surface Transport<br />
Master Plan: A Vision for Connecting.’ 2009.<br />
Dhaher, N., “Espaces traditionnels et fonctions<br />
contemporaines : Le cas de la mise en tourisme<br />
des quartiers historiques de la ville de Tozeur<br />
en Tunisie” in proceedings of the international<br />
conference, ‘Les quartiers historiques: Pressions,<br />
enjeux, actions’ Montréal, Canada.<br />
__. ‘L’aménagement du territoire tunisien : 50 ans<br />
de politiques à l’épreuve de la mondialisation.’<br />
EchoGéo September 14 2010<br />
Di Bartolomeo, A., Fakhoury, T., and Perrin, D.,<br />
CARIM – Migration Profile: Morocco. European<br />
University Institute Consortium for Applied<br />
Research on International Migration, 2010.<br />
Dimireva, I. ‘Libya Investment Climate 2009.” EU<br />
Business, February 15 2010.<br />
Dimitrovova, B., Reshaping Civil Society in<br />
Morocco: Boundary Setting, Integration and<br />
Consolidation. Centre for European Policy Studies,<br />
2009.<br />
‘Djibouti Face à un Probleme de Penurie d’Eau.’<br />
Agence Djiboutienne d’Information, March 17,<br />
2006.<br />
Dokoupil, M., ‘Table – Gulf <strong>Arab</strong> States’<br />
Dependence on Oil Revenue.’ Reuters March 8<br />
2011.<br />
Doumato, E.A., Saudi <strong>Arab</strong>ia; Chapter in Women’s<br />
Rights in the Middle East and North Africa:<br />
Citizenship and Justice. Washington, D.C.:<br />
Freedom House, 2010.<br />
‘Dubai plans waste-to-energy project.’ Khaleej<br />
Times, September 28 2010.<br />
Economic Review 2009. Ministry of National<br />
Economy, Sultanate of Oman, 2010 http://www.<br />
moneoman.gov.om/PublicationAttachment/<br />
April%202010%20Eng%20Econ%20Review.pdf<br />
Viewed on 19 November 2010.<br />
Economist Intelligence Unit. Country Report:<br />
Qatar: May 2011. The Economist Intelligence Unit<br />
Ltd, 2011.<br />
“Egypt’s Housing Market Recovers!”<br />
Global Property Guide, 2010 http://www.<br />
globalpropertyguide.com/Middle-East/Egypt/Price-<br />
History Viewed on 6 September 2011.<br />
‘Elaboration d’une Strategie Nationale du<br />
Developpement du Commerce (2010-2015).’ BKP<br />
Development Research and Consulting. 2010.<br />
223
224<br />
El Gamal, R., ‘Thousands live in the slums of<br />
Kuwait.’ Kuwait Times, June 1 2007.<br />
El Sayed, T., El-Husseini, I., Fayad, W., Zywietz,<br />
D., ‘A New Source of Power: the Potential for<br />
Renewable Energy in the MENA Region.’ Booz &<br />
Company, March 17 2009.<br />
El Shammaa, D., ‘Capital will invest $68b in<br />
transport.’ Gulf News, April 22 2010.<br />
Ellis, E., ‘Dubai’s rags-to-riches miracle built on<br />
the toil of exploited foreign workers.’ The Age,<br />
February 9 2008.<br />
Eltayab, G.E., ‘The Case of Khartoum, Sudan.’<br />
2003, http://www.ucl.ac.uk/dpu-projects/<br />
Global_Report/pdfs/khartoum.pdf Viewed on 7<br />
September 2011.<br />
Encyclopaedia Britannica. Djibouti. Chicago:<br />
Encyclopaedia Britannica, 2011.<br />
Environment Agency. ‘Climate Change and the<br />
UAE: Impacts, Vulnerability and Adaption.’ Abu<br />
Dhabi: Environment Agency, 2009.<br />
Enquete Djiboutienne a Indicateurs Multiple:<br />
Rapport Final. Ministry of Health, Republic of<br />
Djibouti, 2007.<br />
Enquete Nationale a Indicateurs Multiples.<br />
Republic of Algeria, 2008.<br />
ESMAP. ‘ESMAP Launches Program to Support<br />
Development of Energy-Efficient City Transport<br />
Plan in Jordan.’ Washington, D.C.: Energy Sector<br />
Management Assistance Program (ESMAP),<br />
2010.<br />
European Commission. ECHO Situation Map -<br />
August 2011. EU, 2011.<br />
European Union. Yemen-European Union<br />
Strategy Paper for the Period 2007-2013.<br />
European Union, 2007<br />
EuroMed. Status Report on the Implementation<br />
of RTAP Rail Transport Actions in the MEDA<br />
Mashrek Countries, 2010.<br />
European Commission on the Environment.<br />
Support to the DG Environment for Development<br />
of the Mediterranean De-Pollution Initiative<br />
“Horizon 2020”. Brussels: European<br />
Commission, 2006.<br />
Facts & Figures 2009, Ministry of National<br />
Economy, Sultanate of Oman, 2009 http://www.<br />
moneoman.gov.om/viewPublication.aspx?id=561<br />
Viewed on 19 November 2010.<br />
FAO. Aquastat Database. Food and Agriculture<br />
Organization of the United Nations, 2011.<br />
__. Water Resource Information by Country/<br />
Territory and MDG Water Indicator. FAO, 2009.<br />
__. Food Price Index, Food and Agriculture<br />
Organization of the United Nations, 2011.<br />
Faramaoui, A., Meeting with the Director<br />
General of the Facility for Upgrading Informal<br />
Settlements, 2009.<br />
‘Farmers abandon land due to water salinity.’ The<br />
Peninsula, July 29 2008.<br />
Fawaz, M. and Peillen, I., ‘The Case of Beirut,<br />
Lebanon.’ Understanding Slums: Case Studies for<br />
the Global Report on Human Settlements 2003.<br />
UN-Habitat, 2003.<br />
Fernandes, E., Informal Settlements in Syria:<br />
a General Framework for Understanding and<br />
Confronting the Phenomenon. Damascus:<br />
Municipal Administration Modernisation<br />
(MAM), 2008.<br />
“Forced Migration: Countries with Most<br />
Refugees and the Burden on Their Populations.”<br />
The Economist, June 17 2009<br />
Forni, N., Land Tenure Policies in the Near East.<br />
Rome: FAO, 2003.<br />
Freedom House. Country Report - Bahrain.<br />
Washington, D.C.: Freedom House, 2010.<br />
__. Country Report - Comoros. Washington, D.C.:<br />
Freedom House, 2010.<br />
__. Country Report - Djibouti. Washington, D.C.:<br />
Freedom House, 2010.<br />
__. Country Report - Lebanon. Washington, D.C.:<br />
Freedom House, 2010.<br />
__. Country Report - Qatar. Washington, D.C.:<br />
Freedom House, 2010.<br />
__. Country Report - Saudi <strong>Arab</strong>ia. Washington,<br />
D.C.: Freedom House, 2010.<br />
__. Country Report - Somalia. Washington, D.C.:<br />
Freedom House, 2010.<br />
__. Country Report - Yemen. Washington, D.C.:<br />
Freedom House, 2010.<br />
__. Freedom in the World 2010: Oman.<br />
Washington, D.C.: Freedom House, 2010.<br />
__. Freedom in the World 2010: Saudi <strong>Arab</strong>ia.<br />
Washington, D.C.: Freedom House, 2010.<br />
__. Freedom in the World 2010: United <strong>Arab</strong><br />
Emirates. Washington, D.C.: Freedom House, 2010.<br />
__. Women’s Rights in the Middle East and North<br />
Africa: Citizenship and Justice. Washington, D.C.:<br />
Freedom House, 2010.<br />
‘From Regional Pioneer to Global Contender:<br />
the Economic Vision 2030 for Bahrain.’ Bahrain<br />
Economic Development Board, 2008.<br />
Gardner, A., City of Strangers: Gulf Migration and<br />
the Indian Community in Bahrain, Cornell University<br />
Press 2010.<br />
‘Gaza goes green.’ UN-Habitat News , October 12<br />
2010.<br />
GCC Real Estate Overview, Second Quarter 2009.<br />
Colliers International. 2009.<br />
General Census 2004 and 2009. Tunis: Haut<br />
Commissariat au Plan, Royaume du Maroc.<br />
General Census of Population. Government of<br />
Dubai, Housing and Establishments, 2005.<br />
General Presentation of Sophia Antipolis.’ Sophia-<br />
Antipolis Foundation, 2011.<br />
General Secretariat of Planning, Qatar National<br />
Vision 2030, Doha: General Secretariat of Planning,<br />
2008.<br />
Gerner, F. and Tordo, S., Formal Report 327/07:<br />
Republic of Yemen: A Natural Gas Incentive<br />
Framework. Washington, D.C.: Energy Sector<br />
Management Assistance Program (ESMAP), 2008.<br />
‘Gestion de l’Habitat: le Contexte Djiboutien.’ La<br />
Nation, August 15, 2010.<br />
Ghaddar, H., ‘Beirut’s Public Space (or lack<br />
thereof).’ NOW Lebanon, July 31 2007.
Ghzala, A., “Regional Cross-Border Trade<br />
Facilitation and Infrastructure Project for Mashreq<br />
Countries” in proceedings of the Euromed<br />
Transport Forum, Brussels, Belgium.<br />
GIZ. ‘Decentralisation of Solid Waste<br />
Management Project Description.’<br />
Global Information and Early Warning System.<br />
Saudi <strong>Arab</strong>ia. FAO, 2011.<br />
__. Somalia. FAO, 2011.<br />
__. Sudan. FAO, 2011.<br />
__. Yemen. FAO, 2011.<br />
Global Water Intelligence. 10 2009 16, http://<br />
www.globalwaterintel.com/archive/10/11/<br />
Viewed on 7 September 2011.<br />
__. Market Profile: the 2005 GWI Water Tariff<br />
Survey. Global Water Intelligence, 2005.<br />
Government of Yemen, WB, UNDP. Yemen<br />
Poverty Assessment, 4 2007.<br />
Groupe de recherche et d’échanges<br />
technologiques. GRET Annual Report. Nogentsur-Marne:<br />
GRET, 2009.<br />
‘Gulf Rail Network ‘Will Start in 2017.’ The Saudi<br />
Gazette, January 10 2009.<br />
Habib, R.R., Mahfoud Z., Fawaz, M., Basma, S.H.,<br />
and Yeretzian, J.S., “Housing quality and ill health<br />
in a disadvantaged urban community.” Public<br />
Health, 123 (2) 2009 174-181.<br />
Hajeeh, M., “Water conservation in Kuwait: a<br />
fuzzy analysis approach” in proceedings of the<br />
SIGEF 2006: The XIII Congress of International<br />
Association for Fuzzy-Set Management and<br />
Economy, Hammamet, Tunisia.<br />
Halabi, S., ‘Running out of Steam.’ Executive<br />
Magazine, July 2 2010.<br />
Hales, G., Muggah, R., and LeBrun, E., ‘Under<br />
pressure: Social violence over land and water in<br />
Yemen.’ Yemen Armed Violence Assessment,<br />
Issue Brief No. 2, 2010.<br />
Hall, C. and Salama, V., ‘Bahrain’s King Orders<br />
Increase in Main Food Subsidies.’ Bloomberg.<br />
February 3 2011.<br />
Hall, C.M., ‘Tourism Urbanization and global<br />
environmental change’ in Gosling, S. and Hall,<br />
C.M. (eds.) Tourism & Global Environmental<br />
Change: Ecological, Social, Economic and<br />
Political Interrelationships. London , Routledge,<br />
2004.<br />
Hamdi, M.R., Bdour, A., and Z. Tarawneh, Z.,<br />
“Diesel Quality in Jordan: Impacts of Vehicular<br />
and Industrial Emissions on Urban Air Quality”,<br />
Environmental Engineering Science, 25(9)<br />
2008.<br />
Hammal, F. , “Settling with danger:<br />
conditions and health problems in peri-urban<br />
neighbourhoods in Aleppo, Syria”, Environment<br />
and Urbanization, 17 (2) 2005 113-125.<br />
Hamouche, M., “The changing morphology of<br />
the Gulf cities in the age of globalisation: the<br />
case of Bahrain”, Habitat International, 28(4)<br />
2004 521-540.<br />
Hanouz, M.D., and Khatib, S., “The <strong>Arab</strong> World<br />
Competitiveness Review 2010” in proceedings<br />
of the World Economic Forum, Geneva,<br />
Switzerland.<br />
Hasan, O., ‘Kuwait MPs pass privatisation<br />
law, exclude energy production’. AFP, May 12,<br />
2010.”<br />
Haughton, J., “An Assessment of the Tax<br />
System of Lebanon.” Suffolk University and the<br />
Beacon Hill Institute for Public Policy, 2004.<br />
Hemming, D., Betts, R., and Ryall D.,<br />
“Environmental stresses from detailed climate<br />
model simulations for the Middle East and<br />
Gulf region.” Met Office Hadley Centre for<br />
UK Ministry of Defence project‘Defence and<br />
Security Implications of Climate Change, 2007.<br />
High Commission for the Development of<br />
Arriyadh, 2010 http://www.ada.gov.sa/<br />
Eng/ADA/Left/ADA/getdocument.aspx?f=/<br />
openshare/Eng/ADA/Left/ADA/The-High-<br />
Commission-for-the-Developm.doc_cvt.htm<br />
Viewed on 14 September 2011.<br />
Highlights of the Demographic Survey 1428H.<br />
Kingdom of Saudi <strong>Arab</strong>ia, Central Department<br />
of Statistics and Information, 2007.<br />
Highlights: Dubai Strategic Plan 2015. Dubai,<br />
United <strong>Arab</strong> Emirates.<br />
Hirst, M., ‘Reformed Libya eyes eco-tourism boom.’<br />
London: BBC News, 2007 .<br />
‘How Long Can Lebanon’s Real Estate Boom Last?’<br />
Global Property Guide, December 17 2009.<br />
Housing in Bahrain. Kingdom of Bahrain eGovernment<br />
Authority, 2008.<br />
Human Rights Watch. ‘As If I Am Not Human.’<br />
Abuses against Asian domestic workers in Saudi<br />
<strong>Arab</strong>ia. New York: HRW, 2008.<br />
__. ‘The Island of Happiness: Exploitation of Migrant<br />
Workers on Saadiyat Island.’ Abu Dhabi: HRW, 2009.<br />
__. ‘Slow Reform: Protection of Migrant Domestic<br />
Workers in Asia and the Middle East.’ New York:<br />
HRW, 2010.<br />
__. ‘World Report 2011.’ New York: HRW, 2010.<br />
Husrieh, A.K., ‘Realising the Syrian Dream.’ Syria<br />
Today, September 2009.<br />
__. ‘The Housing Crisis: Affordability First.’ Syria<br />
Today, September 2010.<br />
Ibrahim, A.,’Housing Rights Sought for ‘Kuwaiti<br />
Women’: Plan to Raise CSB Capital.’ <strong>Arab</strong> Times,<br />
August 31 2010.<br />
Iman, P. and Kpodar, K., Working Paper: Islamic<br />
Banking: How Has It Diffused? International Monetary<br />
Fund, 2010.<br />
‘Importance of climate change to Oman coastline<br />
highlighted.’ Khaleej Times, August 1 2010.<br />
Indicateurs Trimestriels D’Activité et de Chômage par<br />
Milieu de Résidence. Rabat: Haut Commissariat au<br />
Plan, 2010.<br />
International Company for Training and Development<br />
and Transparency International. National Integrity<br />
System Study: Egypt 2009. Transparency<br />
International and USAID, 2009.<br />
International Energy Agency. “World Energy Outlook:<br />
2006.” Paris: IEA, 2006.<br />
__. “World Energy Outlook: 2008.” Paris: IEA, 2008.<br />
International Monetary Fund. Djibouti: Poverty<br />
Reduction Strategy Paper. Washington, D.C.: IMF,<br />
2009.<br />
225
226<br />
__. Union of the Comoros: Action Plan for<br />
Implementation of the 2010–2014 Poverty<br />
Reduction and Growth Strategy. Washington,<br />
D.C.: IMF, July 2010.<br />
__. Union of the Comoros: Poverty Reduction and<br />
Growth Strategy Paper. Washington, D.C.: IMF,<br />
2010.<br />
International Organization for Migration. Somalia.<br />
Hargeisa: IOM, 2011.<br />
__. Sudan. Khartoum: IOM, 2011.<br />
__. Yemen. Sana’a: IOM, 2011.<br />
__. Bahrain. Manama: IOM, 2011.<br />
__. Increasing Numbers of Stranded Migrants<br />
Dying on Yemeni-Saudi Border. IOM, 2010.<br />
__. Migration Crisis from Libya: Daily Statistical<br />
Report. IOM, 2011.<br />
International Trade Union Confederation. 2010<br />
Annual Survey of violations of trade union rights –<br />
Saudi <strong>Arab</strong>ia. June 9 2010.<br />
IUCN Eastern Africa Regional Office. Somalia<br />
Joint Strategy Paper - for the period 2008 –<br />
2013. Nairobi: European Commission Somalia<br />
Operations Unit, 2009.<br />
Investment Climate in Ar-Riyadh City 2009. Ar-<br />
Riyadh Development Authority 2009, http://www.<br />
arriyadh.com/openshare/ar/StrPlan2/Content/<br />
Investment-Climate-in-Arriyadh-2009.pdf Viewed<br />
on 30 October 2010.<br />
Jacobsen, K. , Feinstein International Center, Tufts<br />
University, and Internal Displacement Monitoring<br />
Center, “Internal Displacement to Urban Areas:<br />
the Tufts-IDMC profiling study, Case 1: Khartoum,<br />
Sudan,” 2008.<br />
Jamrah, A., Al-Omari, A., and Sharabi, R.,<br />
“Evaluation of Traffic Noise Pollution in Amman,<br />
Jordan.” Environmental Monitoring and<br />
Assessment, 120(1-3) 2006 499-525.<br />
Janahi, S., ‘Road accidents down 29% in Dubai<br />
as awareness drive makes impact’. Gulf News,<br />
October 31 2010.<br />
Jeddah Strategic Plan. Jeddah Municipality, 2009.<br />
Jordan in Figures. Department of Statistics,<br />
Amman, Jordan, 2008.<br />
Khallaf, M., “Civil Society in Egypt: a Literature<br />
Review.” Foundation for the Future, 2010.<br />
Kharfi, R., “Les Pôles de Compétitivité en Algérie,<br />
Problématiques et Demarches” in proceedings of<br />
the Innovative Metropolitan Territories: Technology<br />
Parks and Competitiveness Clusters Workshop,<br />
Tunis, Tunisia.<br />
‘King orders SR1.2bn aid for the poor.’ <strong>Arab</strong><br />
News, September 2 2010.<br />
Kingdom of Bahrain. Ministry of Municipalities<br />
Affairs and Agriculture, Urban Planning Affairs.<br />
Kingdom of Saudi <strong>Arab</strong>ia, Central Department of<br />
Statistics and Information.<br />
Kingdom of Saudi <strong>Arab</strong>ia: Millennium<br />
Development Goals Report 5: 2010. Ministry of<br />
Economy and Planning; UNDP; UNDESA, 2010.<br />
Kola, A., ’30-year road map for all-round<br />
prosperity.’ Times of Oman, August 3 2010.<br />
Kraemer, S., ‘With Peak Oil Looming, Gulf States<br />
Consider Ending Fossil Fuel Subsidies.’ Green<br />
Prophet Online News, December 16, 2010.<br />
Kundell, J. and Cleveland, C.J. (eds.), ‘Water<br />
Profile of Somalia.’ Encyclopedia of Earth.<br />
Washington, D.C.: Environmental Information<br />
Coalition, National Council for Science and the<br />
Environment, 2008.<br />
Kuwait Country Report on The Millennium<br />
Development Goals: Achievements and<br />
Challenges 2010. State of Kuwait; UNDP;<br />
General Secretariat for the Supreme Council on<br />
Development Planning, 2010.<br />
‘Kuwait: Still Stalling on Statelessness.’<br />
Refugees International, May 11 2010.<br />
La Nouvelle Strategie Agricole au Maroc<br />
(Plan Vert): Les Clés de la Réussite. Rabat:<br />
Government of Morocco, 2008.<br />
Lachaud, J-P., UNDP and Ministère du Plan et<br />
de l’Aménagement du Territoire. Pauvreté,<br />
Inégalité et Marché du Travail dans l’Union des<br />
Comores. 2005.<br />
Lahouel, M.H., ‘Chapter 8: The success of propoor<br />
growth in rural and urban Tunisia’, in Besley,<br />
T. and Cord, L.J. (eds.), Delivering on the Promise<br />
of Pro-Poor Growth. World Bank and Palgrave<br />
Macmillan, 2006.<br />
‘Latest population and the labor force.’ Kuwait<br />
Times, May 16 2010.<br />
‘Le conseil municipal de Djibouti planche sur les<br />
questions de l’état-civil et du développement<br />
intégré de la capitale.’ Agence Djiboutienne<br />
d’Information. November 11, 2010.<br />
Le Tellier, J., Debbi, F., and Amzil, L., La Mobilite<br />
Urbaine dans L’Agglomeration de Tanger: Evolutions<br />
et Perspectives. Sophia Antipolis: Plan Bleu, 2009.<br />
Les Indicateurs Sociaux du Maroc en 2007.<br />
Rabat: Haut-Commissariat au Plan (Direction de la<br />
Statistique), 2007.<br />
Lebanese Transparency Association and<br />
Transparency International. National Integrity<br />
System Study: Lebanon 2009. Transparency<br />
International and USAID, 2009.<br />
Lebanon Ministry of Transport, Office of Railways &<br />
Collective Transport, 2007.<br />
Liverani, A., Civil Society in Algeria: the Political<br />
Functions of Associational Life, New York:<br />
Routledge Studies in Middle Eastern Politics, 2008.<br />
Living Conditions Survey. Statistics of South<br />
Africa, 2007.<br />
Luck, T., ‘Municipality, residents prepare for Salt<br />
renaissance.’ Jordan Times, August 24 2009.<br />
__. ‘Year-long campaign to highlight health<br />
challenges posed by increasing urbanization.’<br />
Jordan Times, April 8 2010.<br />
M’Hassni, M., Feljy, M., and Khalali H., L’évolution<br />
de la Propriété Foncière. Copenhagen: Fédération<br />
Internationale des Géomètres, 2003.<br />
Mahdi, M., ‘Bahrain Ends Sponsor System.’ The<br />
National, May 5 2009.<br />
Mahgoub, Y., ‘Chapter 7: Kuwait: learning from<br />
a globalised city,’ in Elsheshtawy, Y. (ed.) The<br />
Evolving <strong>Arab</strong> City: Tradition, Modernity and Urban<br />
Development, 2008.
__, (ed.), ‘Architecture and the expression<br />
of cultural identity in Kuwait.’ The Journal of<br />
Architecture, 12 (20) 2007 165 – 182.<br />
Maimbo, S. M., Remittances and Economic<br />
Development in Somalia: An Overview. World<br />
Bank Social Development Papers on Conflict<br />
Prevention and Reconstruction, Paper No. 38,<br />
2006.<br />
‘Making Bricks without Straw: the Jerusalem<br />
Municipality’s New Planning Policy for East<br />
Jerusalem.’ Bimkom, 2010.<br />
“MarketView: Kingdom of Bahrain, Q2, 2010.” CB<br />
Richard Ellis, 2010 http://www.cbre.bh/bh_en/<br />
research Viewed on 7 September 2011.<br />
Marzouki, N., “Algeria.” Chapter in Sanja, K. and<br />
Breslin, J. (eds.) Women’s Rights in the Middle<br />
East and North Africa: Progress amid Resistance.<br />
New York: Freedom House, 2010.<br />
McCarthy, M., ‘Why Canada is the best haven for<br />
climate change.’ The Independent, July 4, 2008.<br />
McGinley, S., ‘Dubai water and electricity costs<br />
to rise around 15% in 2011.’ <strong>Arab</strong>ian Business,<br />
December 9, 2010.<br />
__. ‘Kuwait to set up $1.7bn housing fund for<br />
women’. <strong>Arab</strong>ian Business, Aug. 22, 2010.<br />
“MENA in Focus”, NBK Capital, 2010.<br />
MENA Real Estate Overview, 4th Quarter of 2008.<br />
Colliers International, 2008.<br />
Menon, K.S.R., ‘16 Indians killed in Bahrain.’ The<br />
Times of India, July 30 2006.<br />
‘Middle East: GCC, SA, UAE.’ University of<br />
California Davis. USA 2009.<br />
Millington, B., ‘Camp conditions in Bahrain<br />
questioned.’ Construction Week Online, March<br />
28 2009.<br />
Ministère de l’Habitat, de l’Urbanisme, de<br />
l’Environnement et de l’Aménagement du<br />
Territoire . UNHCR, 2008.<br />
Ministry of Planning and International<br />
Cooperation, Republic of Yemen, Second Port<br />
<strong>Cities</strong> Development Project. Washington, D.C.:<br />
The World Bank, 2010.<br />
Misselwitz, P. and Rieneits, T., ‘<strong>Cities</strong> of collision.’<br />
The Magazine for Urban Documentation, Opinion<br />
and Theory, Issue 5, 2006.<br />
More than 3.8 million pilgrims have arrived in the<br />
Kingdom. Ministry of Hajj, Saudi <strong>Arab</strong>ia, 2010.<br />
Morooka, I., ‘Child Health Days Reach Displaced<br />
Communities in Somalia’s Afgoye Corridor’.<br />
UNICEF Newsline, November 24, 2009.<br />
Mubarak, F.,”Urban growth boundary policy and<br />
residential suburbanization: Riyadh, Saudi <strong>Arab</strong>ia”,<br />
Habitat International 28(4) 2004 567-591.<br />
Municipal Administration Modernisation. Closure<br />
of the Municipal Administration Modernisation<br />
Programme-Launching the Decentralisation and<br />
Local Development Programme. Damascus:<br />
MAM, 2010.<br />
Municipal Administration Modernisation. MAM<br />
Work on Urban Planning and Informal Settlement.<br />
Damascus: MAM, 2010.<br />
__. The Regional Spatial Development Plan for the<br />
Eastern Region. Damascus: MAM, 1 2008.<br />
Municipality of Kuwait. “Future Urban<br />
Development in Kuwait: an overview of the third<br />
Kuwait master plan review” in proceedings of<br />
the Planning Sustainable <strong>Arab</strong> <strong>Cities</strong> Networking<br />
Event, World Urban Forum V, Rio de Janeiro,<br />
Brazil.<br />
Murphy, C., ‘Saudi <strong>Arab</strong>ians use Facebook to<br />
vent fury over Jeddah flood deaths.’ The Christian<br />
Science Monitor, November 30, 2009.<br />
Mustapha, M., “The ONEP Experience for<br />
Wastewater Treatment in Small Communities:<br />
Current Situation and Prospects”, Desalination,<br />
246 2009 613-616.<br />
Nagy, S. , ”Making room for migrants, making<br />
sense of difference: Spatial and Ideological<br />
Expressions of Social Diversity in Urban Qatar”,<br />
Urban Studies, 43 (1) 2006 119-137.<br />
__. “Affordable Mortgage Finance in Egypt:<br />
Challenges and Prospects” in proceedings of<br />
the Oxford Business and Economics Conference<br />
Program, Oxford, UK.<br />
National Bureau of Statistics. Government of<br />
United <strong>Arab</strong> Emirates, 2010.<br />
National Intelligence Council. North Africa: the<br />
Impact of Climate Change to 2030, Geopolitical<br />
Implications. Washington, D.C.: NIC, 2009.<br />
National Institute of Statistics- Tunisia, 2011<br />
http://www.ins.nat.tn/ Viewed on 2 February<br />
2011.<br />
__. Employment and unemployment indicators.<br />
Tunis: INS, 2010.<br />
__. Statistical Yearbook of Tunisia 2008. Tunis:<br />
INS, 2008.<br />
National Physical Master Plan of the Lebanese<br />
Territory. Beirut: Government of Lebanon, 2005.<br />
National Millennium Development Goals Report<br />
2009. Ministry of Economy and Planning and<br />
UNDP, 2009.<br />
Naufal, G., and Termos, A., ‘Remittances from<br />
the GCC: a Brief Outlook.’ Middle East Institute<br />
Viewpoints, 2010.<br />
Newly Opened ‘Salman Industrial City’ to play<br />
important role in attracting foreign investment.<br />
Bahrain Economic Development Board, 2010.<br />
‘New Loans Broaden Syria’s Credit Lines.’ Syria<br />
Today, No. 67, December 2010.<br />
Norton, G.; UN-Habitat; Norwegian Refugee<br />
Council; UNHCR. Land, Property and Housing in<br />
Somalia. Nairobi: UN-Habitat, 2008.<br />
‘North Africa: the Impact of Climate Change,<br />
Geopolitical Implications.’ National Intelligence<br />
Council, December 2009.<br />
OECD Development Centre. African Economic<br />
Outlook-Morocco. Issy les Moulineaux: OECD<br />
Development Centre, 2010.<br />
OECD. Competitiveness and Private Sector<br />
Development: Egypt Business Climate<br />
Development Strategy. Paris: OECD, 2010.<br />
__. Africa Economic Outlook: Comoros.<br />
Washington D.C.: OECD, 2011.<br />
__. Africa Economic Outlook: Djibouti.<br />
Washington D.C.: OECD, 2011.<br />
__. Africa Economic Outlook: Djibouti.<br />
Washington D.C.: OECD, 2011.<br />
227
228<br />
__. Africa Economic Outlook: Algeria. Paris: OECD,<br />
2011.<br />
__. Africa Economic Outlook: Libya. Paris: OECD,<br />
2011.<br />
Office National des Statistiques. Enquête Emploi<br />
auprès des Ménages. Algiers: ONS, 2007.<br />
__. Algerie: Tableau synoptique de la population<br />
active en milliers. Algiers: ONS, 2011.<br />
Office of the Commissioner General for<br />
Planning, Government of Yemen. Action Plan<br />
for Implementation of the 2010-2014 Poverty<br />
Reduction and Growth Strategy. Washington D.C.:<br />
IMF, 2009.<br />
Office of the Commissioner General For Planning,<br />
Presidency of the Union of the Comoros. Poverty<br />
Reduction and Growth Strategy Paper. Washington<br />
D.C.: IMF, 2009.<br />
“Oman, after Gonu tropical cyclone 2007: Urban<br />
Planning Perspective”, GIS and Science, May 28<br />
2010.<br />
Omanisation Policy. Ministry of Information, Oman,<br />
2002.<br />
‘Overview.’ Al Areen Holding Company, 2010.<br />
Ouroussoff, N., ‘In <strong>Arab</strong>ian Desert, a Sustainable City<br />
Rises.’ New York Times, September 25 2010.<br />
Oxfam. Rescuing the Peace in Southern Sudan:<br />
Briefing Paper. Oxfam, 2010.<br />
Pantuliano, S., Buchanan-Smith, M., Murphy, P.,<br />
Mosel, I., The Long Road Home: Opportunities and<br />
obstacles to the reintegration of IDPs and refugees<br />
returning to Southern Sudan and the Three Rivers.<br />
London: Humanitarian Policy Group, Overseas<br />
Development Institute, 2008.<br />
Pantuliano, S., et al. “City Limits: Urbanization and<br />
Vulnerability in Sudan: Synthesis Report.” London:<br />
Overseas Development Institute, 2011.”<br />
PAPFAM – Rapport Final. Republic of Djibouti,<br />
2004.<br />
Pargeter, A. “Libya.” Chapter in Sanja, K. and<br />
Breslin, J. (eds.) Women’s Rights in the Middle East<br />
and North Africa: Progress amid Resistance. New<br />
York: Freedom House, 2010.<br />
Plan d’Action du Gouvernement pour la mise<br />
en œuvre du Programme du Président de la<br />
République. Republic of Algeria.<br />
‘Planning in Jerusalem: the Implications of the<br />
New Outline Plan of Jerusalem for Palestinian<br />
Neighbour.’ Bimkom, 2009.<br />
Portail de la Région du Grand Casablanca,<br />
2007 http://www.casablanca.ma Viewed on 9<br />
January 2010.<br />
Presentation de la Strategie Future. Office<br />
National de L’Assainissement, République<br />
Tunisienne.<br />
Profil de la pauvreté à Djibouti. Ministère<br />
de l’Economie, des Finances, et de la<br />
Planification, chargé de la Privatisation, UNDP,<br />
and Republic of Djibouti, 2002.<br />
Profil de la Pauvrete en Mauritanie.<br />
Ministère des Affaires Economiques et du<br />
Développement and Office National de la<br />
Statistique, 2009.<br />
‘Programmes finances: Résorption de l’habitat<br />
précaire’ Caisse National du Logement, 2011.<br />
Public Review of Finance 2009. Ministry of<br />
Finance. Beirut: Government of Lebanon,<br />
2009.<br />
Puntland Development research Centre<br />
(2004), Draft Report on Socio-Economic<br />
Assessment in Puntland, p.7.”<br />
Qatar Electricity and Water Company.’ Taib<br />
Research, GCC First Reaction Report, April 3,<br />
2009.<br />
Qatar General Secretariat for Development<br />
Planning http://www.gsdp.gov.qa/portal/page/<br />
portal/GSDP_Vision_Root/GSDP_EN Viewed<br />
on 15 September 2011.<br />
Rapport du Comité Technique Sectoriel, Emploi<br />
pour l’actualisation du plan d’action du CSLP<br />
2011-2015.<br />
Rapport National sur le Developpement<br />
Humain 2006. Republic of Algeria, 2006.<br />
Registered Marriages by Governorate.<br />
Department of Statistics (DOS), Hashemite<br />
Kingdom of Jordan, 2008.<br />
REN21. Renewables 2007 Global Status Report.<br />
REN21, 2007.<br />
‘Research Study on Urban Mobility in Greater Cairo:<br />
Trends and Prospects.’ Cairo University: Development<br />
Research and Technological Planning Center, 2009.<br />
Richter, F., ‘Bahrain seeks UNESCO listing for pearl<br />
diving plan.’ Reuters, January 27 2010.<br />
Richter, L., ‘Gafo Energy NZ Invests in Comoros<br />
Geothermal Development.’ Gafo Energy Press<br />
Release, June 4, 2010.<br />
Rifki, M., “Programme National d’Assainissement<br />
Liquide et d’Epuration des Eaux Usees.”, in<br />
proceedings of presentation at Situation et<br />
Perspectives d’Assainissement au Maroc Workshop,<br />
Agadir, Morocco.<br />
Rishmawi, M. and Morris, T., Overview of Civil<br />
Society in the <strong>Arab</strong> World. Oxford: INTRAC, 2007.<br />
Roy, M.A., ‘Amman-Zarqa Light Rail Project<br />
Derailed.’ CPCS Metro Report International, 2009.<br />
Saberi, M., ‘Diabetes presents a major challenge.’<br />
Gulf News, November 15 2010.<br />
Sadiqi, F., ‘Morocco.” Chapter in Sanja, K. and<br />
Breslin, J. (eds.) Women’s Rights in the Middle East<br />
and North Africa: Progress amid Resistance. New<br />
York: Freedom House, 2010.<br />
Saeed, A., ‘Only four per cent of Yemeni have bank<br />
accounts.’ Yemen Times, January 24 2011.<br />
Safar Zitoun, M. and Tabti-Talamali, A., ‘La Mobilite<br />
Urbaine dans l’Agglomeration d’Alger: Evolutions et<br />
Perspectives.’ Algiers: Plan Bleu, 2009.<br />
Saleh, B. and Al Rawashdeh, S., “Study of Urban<br />
Expansion in Jordanian <strong>Cities</strong> Using GIS and Remoth<br />
Sensing”, International Journal of Applied Science<br />
and Engineering, 5(1) 2007 41-52.<br />
Salman, M., ‘Walls at Every Turn: Abuse of Migrant<br />
Domestic Workers through Kuwait’s Sponsorship<br />
System.’ New York: HRW, 2010.<br />
Sambidge, A., ‘Doha traffic congestion is main<br />
concern – survey.’ <strong>Arab</strong>ian Business, March 20<br />
2010.<br />
Sambidge, A., ‘Expat remittances from Qatar soar<br />
to nearly $7 bn.’ <strong>Arab</strong>ian Business, July 27 2010.
‘Sana’a: a City Development Strategy.’ <strong>Cities</strong><br />
<strong>Alliance</strong>; World Bank; Government of Yemen;<br />
Secretariat Capital of Sana’a, 2010.<br />
‘SAR3bn Jeddah slum compensation.’<br />
Construction Week Online, July 3, 2010.<br />
Sarra, A., ‘La Bruit dans les Grandes Villes: Une<br />
Pollution Negligee.’ Webmanagercenter.com,<br />
July 7 2008. http://www.webmanagercenter.<br />
com/management/article.php?id=44388<br />
Accessed on November 1, 2010.”<br />
‘Saudi <strong>Arab</strong>ia to allow foreigners to own<br />
property.’ AME Info, June 3 2010.<br />
‘Saudi eyes nuclear energy to boost power<br />
production.’ Reuters, October 4 2010.<br />
‘Scale of Gaza destruction emerges.’ BBC,<br />
January 19 2009.<br />
‘Sector Briefing: Environment Opportunities<br />
in Saudi <strong>Arab</strong>ia.’ UK Trade & Investment,<br />
September 29 2010.<br />
Serageldin, M., et al, Land Tenure Systems and<br />
Development Controls in the <strong>Arab</strong> Countries of<br />
the Middle East. Housing Process and Physical<br />
Form, Jakarta, 1979.<br />
Shah, M., ‘Gulf Cooperation Council Food<br />
Security: Balancing the Equation.’ Nature.com,<br />
April 25 2010.<br />
Shariff, O., ‘Dubai traffic woes inflict losses of<br />
Dh4.6b a year.’ Gulf News, December 13 2007.<br />
Shaumann, R., ‘Practical Guide For Housing<br />
Microfinance In Morocco.’ CHF International.<br />
June 15 2005.<br />
Silvey, R., ‘In the Margins of Riyadh: Indonesian<br />
domestic workers in Saudi <strong>Arab</strong>ia’ in Price, M.<br />
and Benton-Short, L. (eds.), Migrants to the<br />
Metropolis: The Rise of Immigrant Gateway<br />
<strong>Cities</strong>. Syracuse, NY: Syracuse University Press,<br />
2008.<br />
Slackman, M., ‘Social issues clown their way to<br />
centre stage in Libya.’ New York Times, March<br />
12 2007. http://nytimes.com/2007/03/12/world/<br />
africa/12libya.html?_r=1”<br />
Socio-Demographic Indicators Bulletin- Dubai.<br />
Dubai Statistics Center, 2007.<br />
Soliman, A., “Diversity of Ethnicity and State<br />
Involvement on Urban Informality in Beirut”,<br />
Theoretical and Empirical Researches in Urban<br />
Management, 2008.<br />
Sorel, M., ‘Statelessness in Kuwait: Kuwait’s<br />
bidoon.’ Foreign Policy Digest, June 1 2010.<br />
Southwick, K. and Lynch, M., ‘Nationality Rights<br />
for All: a Progress Report and Global Survey on<br />
Statelessness.’ Washington, D.C.: Refugees<br />
International, 2010.<br />
SSCCSE, Food and Nutrition Security<br />
Assessment in Sudan: Analysis of 2009 National<br />
Baseline Household Survey. SSCCSE, ADBP,<br />
UNDP, Statistics Norway, EU, and FAO, 2010.<br />
Statistical Yearbook 2010. Ministry of National<br />
Economy, Oman, 2010.<br />
Statistical Yearbook of Abu Dhabi 2010.<br />
Statistics Center – Abu Dhabi, 2010.<br />
Strategy and National Environmental Action<br />
Plan for the Syrian <strong>Arab</strong> Republic. Ministry of<br />
State for Environmental Affairs, Syrian <strong>Arab</strong><br />
Republic. 2003.<br />
Sudan: Wajlis Watani (National Assembly).<br />
Inter-Parliamentary Union, 2010.<br />
Surface Transport Master Plan: A Vision for<br />
Connecting Abu Dhabi, Government of Abu<br />
Dhabi, Department of Transport, 2009.<br />
Sustainable Development Indicators in the State<br />
of Qatar. Qatar Statistics Authority; Permanent<br />
Population Committee, 2010.<br />
‘Tanger-Med Expansion: King Launches<br />
Construction Works.’ Morocco Business News,<br />
June 18 2009.<br />
‘Temperature rise above global average: Kuwait<br />
must be more concerned about phenomenon<br />
than rest of the world.’ <strong>Arab</strong> Times, February<br />
15 2010.<br />
‘The Humanitarian Impact on Palestinians of<br />
Israeli Settlements and Other Infrastructure in<br />
the West Bank.’ UN-OCHA, July 2007.<br />
The Palestinian National Early Recovery and<br />
Reconstruction Plan for Gaza 2009-2010.<br />
Palestinian National Authority, 2009.<br />
The State of the Population in Syria: First National<br />
Report 2008. Syrian Commission on Family Affairs,<br />
Republic of Syria, 2008.<br />
Thibault, H-L., “Les Arbitrages Concernant l’Eau<br />
Agricole dans un Contexte de Raréfaction de la<br />
Ressource”, in proceedings of the Crise Alimentaire<br />
et Raréfaction de L’Eau au Maghreb Conference,<br />
Paris, France.<br />
‘Thousands displaced by volcano in Comoros.’ Afrol<br />
News, December 2 2005.<br />
Tolba, M.K. and N.W. Saab, “<strong>Arab</strong> Environment<br />
Future Challenges Report 2008”, <strong>Arab</strong> Forum for<br />
Environment and Development, 2008.<br />
‘Top WHO award for Manama.’ Trade <strong>Arab</strong>ia, March<br />
23 2010.<br />
Tosun, M.S., and Yilmaz, S., Centralization,<br />
Decentralization and Conflict in the Middle East<br />
and North Africa. Washington, D.C.: The World<br />
Bank, 2008.<br />
Toumi, H., ‘Qatar considers move to secure financial<br />
protection for laborers.’ Gulf News, October 5 2010.<br />
Toumi, M., ‘Qatar to draft law on domestic workers.’<br />
Gulf News, November 23 2010.<br />
‘Tourism contributes 18% to Dubai’s GDP per year.’<br />
UAE Interact, February 14, 2007.<br />
Trans-Africa Consortium. Overview of Public<br />
Transport in Sub-Saharan Africa. International<br />
Association of Public Transport, Brussels: 2008.<br />
Transparency International. National Integrity<br />
System: Morocco. 2009.<br />
Trofimov, Y., ‘Upon sober reflection, Bahrain<br />
reconsiders the wages of sin.’ Wall Street Journal,<br />
June 9 2009.<br />
‘Tunisia-France-Technopoles’ Tunisia News and Press<br />
Reviews, 2009 http://news.marweb.com/tunisia/<br />
politics/tunisia-france-technopoles.html Viewed on<br />
6 September 2011.<br />
‘Under Pressure: Social violence over land and water<br />
in Yemen.’ Issue Brief No. 2. Yemen Armed Violence<br />
Assessment, 2010.<br />
‘UAE keen to cut energy demand.’ UAE Interact,<br />
November 18, 2010.<br />
229
230<br />
‘UAE Has over 2,800 sq km in Sudan Farms.’<br />
Emirates 24/7, October 13, 2010.<br />
UN-DESA. World Urbanization Prospects: The<br />
2009 Revision Population Database. New York:<br />
United Nations, 2009.<br />
__. Trends in International Migration Stock: The<br />
2008 Revision. New York: United Nations, 2008.<br />
__. The World Population Prospects: The 2008<br />
Revision. New York: UN-DESA, 2009.<br />
__. The World Population Prospects: The 2010<br />
Revision. New York: UN-DESA, 2011.<br />
__. International Migration, 2009 Wallchart. New<br />
York: Population Division, United Nations, 2009.<br />
__. World Urbanization Prospects: The 2009<br />
Revision. New York: UN-ECOSOC, 2010.<br />
UNDGO, World Bank, and Joint Assessment<br />
Mission. Volume 1, Synthesis: Framework for<br />
Sustained Peace, Development and Poverty<br />
Eradication. 2005.<br />
UNDP. <strong>Arab</strong> Human Development Report:<br />
Towards the Rise of Women in the <strong>Arab</strong> World.<br />
New York, NY: UNDP, 2006.<br />
__. Association of Local Government Authorities<br />
for Somaliland: a Strong Voice for Local<br />
Authorities.<br />
__. Elections: Qatar. Programme on Governance<br />
in the <strong>Arab</strong> Region.<br />
__. Lebanon Human Development Report:<br />
Towards a Citizen’s State, 2008.<br />
__. Local Government: Bahrain. Programme on<br />
Governance in the <strong>Arab</strong> Region.<br />
__. Local Government: United <strong>Arab</strong> Emirates.<br />
Programme on Governance in the <strong>Arab</strong> Region.<br />
__. Millennium Development Goals: Lebanon<br />
Report 2008, 2008.<br />
__. Republique de Djibouti: Initiative Nationale<br />
pour le Développement Social (INDS 2008-2012).<br />
Djibouti: UNDP, 2010.<br />
__. “The Third <strong>Arab</strong> Report on the Millennium<br />
Development Goals 2010 and the Impact of<br />
the Global Economic Crises.” New York: United<br />
Nations 2009.<br />
__. Somalia Country Profile. Programme on<br />
Governance in the <strong>Arab</strong> Region.<br />
__. ‘Women select women councilors in<br />
Puntland.’ UNDP Somalia, 2009.<br />
__. Yemen Country Profile. Programme on<br />
Governance in the <strong>Arab</strong> Region.<br />
UNDP and Government of Denmark. Human<br />
Development Report – Somalia. Nairobi: UNDP<br />
and Denmark, 2001.<br />
UNDP and Government of Djibouti. Enquete<br />
Djiboutienne a Indicateurs Multiples. Djibouti: UN,<br />
Djibouti, 2007.<br />
UNDP and Government of Sudan. Support to<br />
Public Sector, Decentralization and Capacity<br />
Building Project. Khartoum: UNDP, Government of<br />
Sudan, 2010.<br />
UNDP and Government of Yemen. Millennium<br />
Development Goals 2010: Yemen Report. UNDP<br />
and Government of Yemen, 2010.<br />
UNDP and Hashemite Kingdom of Jordan,<br />
Ministry of Planning and International<br />
Cooperation. Jordan Human Development Report<br />
2004. Amman: UNDP MoPIC, 2004.<br />
UNDP and Kingdom of Bahrain. Regional<br />
consultative meeting on ‘Towards sustainable<br />
energy’ under UNDP’s ‘<strong>Arab</strong> resilience initiative.’<br />
2010.<br />
__. ‘Human Development Achievements of the<br />
Kingdom of Bahrain: a Ten Year Review’, 2011.<br />
UNDP and Kingdom of Saudi <strong>Arab</strong>ia. Launch of<br />
Urban Planning Programme. UNDP and Kingdom<br />
of Saudi <strong>Arab</strong>ia, 2010.<br />
__. National Energy Efficiency Programme.<br />
2009.<br />
UNDP and Local Governance Forum in the<br />
<strong>Arab</strong> Region. Decentralized Governance for<br />
Development in the <strong>Arab</strong> States: a Background<br />
Paper on Decentralization and Local Governance<br />
Policies, Legal Frameworks, Programmes,<br />
Lessons Learned and Good Practices. Beirut/<br />
Sana’a: UNDP/LGFAR, 2003.<br />
UNDP and Qatar Statistics Authority, Population<br />
Committee. Millennium Development Goals In<br />
Qatar 2010. 2010. http://www.qsa.gov.qa/eng/pdf/<br />
Millinum_development_goals/MDG_Eng2010.pdf<br />
Viewed on 24 November 2010.<br />
UNDP and UNIFEM. TOR for an International Expert<br />
on Evaluation and Women Political Participation.<br />
UNDP and UNIFEM, 2010.<br />
UNDP and Union of Comoros. Changements<br />
Climatiques: 22 Accords de Congestion dans 22<br />
Villages. UNDP and Union of Comoros, 2010.<br />
__. Genre et Developpement Humain. UNDP and<br />
Union of Comoros, 2006.<br />
__. Micro-Financement du Fonds pour<br />
l’Environnement Mondial, 2009<br />
UNDP and World Bank. Socio-Economic Survey<br />
2002. UNDP and World Bank, 2003.<br />
__. Somalia Joint Needs Assessment:<br />
Infrastructure Cluster Report. UNDP and World<br />
Bank, 2006.<br />
UNDP Regional Bureau for <strong>Arab</strong> States: United<br />
<strong>Arab</strong> Emirates, and Mohammed Bin Rashid Al<br />
Makoum Foundation, <strong>Arab</strong> Knowledge Report<br />
2009: Towards Productive Intercommunication<br />
for Knowledge. Abu Dhabi: UNDP, 2009.UNEP.<br />
Partnership for Clean Fuels and Vehicles Core<br />
Campaigns: Global Phase-out of Leaded Petrol.<br />
UNEP. Sudan: Post-Conflict Environmental<br />
Assessment. Nairobi: UNEP, 2007.<br />
UNESCO. UIS Statistics in Brief: Education (all<br />
levels) Profile – Djibouti.<br />
__. UNESCO Institute for Statistics. Paris:<br />
UNESCO, 2008.<br />
UN-ESCWA. Annual Review of Developments in<br />
Globalization and Regional Integration in the <strong>Arab</strong><br />
Countries. New York City: United Nations, 2008.<br />
UN General Assembly. Rapport National Présenté<br />
Conformément au Paragraphe 15 A) de l’Annexe<br />
à la Resolution 5/1 du Conseil des Droits de<br />
l’Homme: Djibouti. Geneva: UN General Assembly,<br />
2009.<br />
UN-Habitat. Best Practices – Africa Field Report.<br />
UN-Habitat, Urban World, 1 (3), 2009.
__. City Development Strategy for Tunis. Nairobi:<br />
UN-Habitat, 2002.<br />
__. Field Report-Africa: Best Practices. Urban<br />
World 1(3) 2009.<br />
__. Financing Urban Shelter: Global Report on<br />
Human Settlements 2005. UN-Habitat, 2005.<br />
__. Global Urban Indicators. 1998.<br />
__. Hargeisa: First Steps Towards Strategic Urban<br />
Development Planning. UN-Habitat, 2007.<br />
__. Libya Urban Planning, Second Newsletter.<br />
Nairobi: UN-Habitat, 2007.<br />
__. Mogadishu Community-Based District<br />
Rehabilitation and Upgrading Programme. UN-<br />
Habitat, 2010.<br />
__. Paper 7: Waqf (Endowment) and Islamic<br />
Philanthropy. Islam. Land and Property Research<br />
Series. UN-Habitat, 2005.<br />
__. State of African <strong>Cities</strong> Report 2008. Nairobi:<br />
UN-Habitat, 2008.<br />
__. State of African <strong>Cities</strong> Report 2010. Nairobi:<br />
UN-Habitat, 2010.<br />
__. State of the <strong>Cities</strong> Background Report: Oman.<br />
Nairobi: UN-Habitat, 2011.<br />
__. State of the <strong>Cities</strong> Background Report: Saudi<br />
<strong>Arab</strong>ia. Nairobi: UN-Habitat, 2011.<br />
__. State of the <strong>Cities</strong> Background Report: Sudan.<br />
Nairobi: UN-Habitat, 2011.<br />
__. State of the <strong>Cities</strong> Background Report: Yemen.<br />
Nairobi: UN-Habitat, 2011<br />
__. State of the World <strong>Cities</strong> 2008/2009. Nairobi:<br />
UN-Habitat, 2009.<br />
__. State of the World <strong>Cities</strong>: 2010/2011- <strong>Cities</strong><br />
for All: Bridging the Urban Divide. UN-Habitat,<br />
2010.<br />
__. Urban Sector Studies and Capacity Building for<br />
Khartoum State. UN-Habitat, 2009.<br />
UN-Habitat and Great Socialist People’s Libyan<br />
<strong>Arab</strong> Jamahiriya, Libya Urban Planning Newsletter,<br />
Issue No. 1. Tripoli: UN-Habitat, 2006.<br />
UNHCR. As Fighting Escalates in Mogadishu,<br />
Deportations to the Capital Continue. July 30<br />
2010.<br />
__. Country operations profile – Somalia. UNHCR,<br />
2011.<br />
__. Country Operations Profile – Sudan. Geneva:<br />
UNHCR, 2011.<br />
__. Country operations profile – Yemen. UNHCR,<br />
2011.<br />
__. Djibouti 10-point Plan of Action. UNHCR,<br />
2008.<br />
__. “Promotion and Protection of all Human<br />
Rights, Civil, Political, Economic, Social, and<br />
Cultural Human Rights, including the Right to<br />
Development: Mission to Saudi <strong>Arab</strong>ia”, in<br />
proceedings of the 11th session of the Human<br />
Rights Council, Geneva, Switzerland.<br />
__. ‘Where Do Somalis Flee?’ http://www.<br />
givethemshelter.org/get-involved/where-dosomalis-flee<br />
Viewed on 21 September 2011.<br />
UNICEF. Somalia: Multiple Indicator Cluster Survey.<br />
UNICEF, 2006.<br />
UN Joint Program on Local Governance and<br />
Decentralised Service Delivery. Third Quarterly<br />
Report 2010. Somalia: United Nations, 2010.<br />
UN Statistics Division and Central Bureau of<br />
Statistics, Syria. (1994 & 2004). National Census.<br />
UN-OCHA. ‘The Humanitarian Impact on<br />
Palestinians of Israeli Settlements and Other<br />
Infrastructure in the West Bank.’ UN-OCHA: 2007<br />
__. ‘Somalia Humanitarian Overview’, 3 (9).<br />
September 2010.<br />
UN-OCHA Policy Studies and Development<br />
Branch. ‘Water Scarcity and Humanitarian Action:<br />
Key Emerging Trends and Challenges.’ UN-OCHA<br />
Occasional Policy Briefing Series – No. 4, 2010.<br />
UNRWA. Palestinian Refugees. Gaza: UN-RWA,<br />
2011.<br />
U.S. Census Bureau, International Data Base.<br />
U.S. Embassy – Sudan. “About Sudan.” United<br />
States State Department.<br />
USAID. ‘Somalia: Water and Sanitation Profile’,<br />
2008.<br />
__. ‘Djibouti Ville Urban Baseline Study.’ 2003.<br />
USAID. ‘Housing Study for Urban Egypt.’ USAID<br />
and TAPR II, Dec. 2008.<br />
USAID. ‘USAID Country Profile: Property Rights<br />
and Resource Governance: Yemen.’ USAID. 2010.<br />
World Bank. 2008 Economic Development and<br />
Prospects: MENA Region. 2008<br />
__. Analysis of Housing Supply Mechanisms.<br />
Washington, D.C.: The World Bank, 2007.<br />
__. <strong>Arab</strong> Republic of Egypt: Towards an Urban<br />
Sector Strategy. Washington, D.C: The World<br />
Bank, 2008.<br />
__. Building Knowledge Economies: Advanced<br />
Strategies for Development. Washington, D.C.:<br />
The World Bank, 2007.<br />
__. Cluster project performance assessment. The<br />
World Bank, 2010.<br />
__. Country Assistance Strategy Progress Report.<br />
Washington D.C.: The World Bank, 2005.<br />
__. Country Brief: Middle East & North Africa<br />
Region (MENA) – Yemen. The World Bank, 2009.<br />
__. Country Strategy for the Kingdom of Morocco<br />
for the Period FY 10-13. Washington D.C.: World<br />
Bank, 2009.<br />
__. Country Strategy for Tunisia for the Period FY<br />
10-13. Washington D.C.: The World Bank, 2009.<br />
__. Country Partnership Strategy for Lebanese<br />
Republic for the Period FY11-FY14. Washington<br />
D.C.: The World Bank, 2010.<br />
__. Djibouti Urban Poverty Reduction Project.<br />
2010.<br />
__. Doing Business 2010. Washington, D.C.: The<br />
World Bank, 2009.<br />
__. Economic Integration in the Mashreq.<br />
Washington, D.C.: The World Bank, 2010.<br />
__. Economic Integration in MENA: the GCC, the<br />
Maghreb, and the Mashreq. MENA Knowledge<br />
231
232<br />
and Learning Quick Notes Series. Washington, D.C.:<br />
The World Bank, 2010.<br />
__. Egypt Urban Sector Update. Washington, D.C.:<br />
The World Bank, 2008.<br />
__. From Privilege to Competition: Unlocking Private-<br />
Led Growth in the Middle East and North Africa.<br />
Washington, D.C.: The World Bank, 2009.<br />
__. Housing Policies and Sector Performances in<br />
MENA Countries. 2005.<br />
__. Housing Sector Development Policy Loan.<br />
Washington D.C. : The World Bank, 2005.<br />
__. ‘Implementation Status & Results: Yemen-Water<br />
Sector Support (P107037).’ The World Bank Group,<br />
January 11 2011.<br />
__. Improving Food Security in <strong>Arab</strong> Countries.<br />
Washington, D.C.: The World Bank, 2009.<br />
__. Improving Food Security in <strong>Arab</strong> Countries.<br />
Washington, D.C.: The World Bank, 2009.<br />
__. Is There a New Vision for Maghreb Economic<br />
Integration? Volume 1: Main Report. Washington,<br />
D.C.: The World Bank, 2006.<br />
__. Les poles de competitivite en Tunisie : Note de<br />
problematique. Washington D.C. : The World Bank,<br />
2010.<br />
__. Making the Most of Scarcity: Accountability for<br />
Better Water Management Results in Middle East<br />
and North Africa. Washington, D.C.: The World Bank,<br />
2007.<br />
__. Maghreb Department. Morocco: National<br />
Initiative for Human Development Support Project.<br />
Washington, D.C.: The World Bank, 2006.<br />
__. Migration and Remittances Factbook.<br />
Washington, D.C.: The World Bank, 2008.<br />
__. Poor Places, Thriving People: How the Middle East<br />
and North Africa Can Rise Above Spatial Disparities,<br />
p.27. Retrieved February 20, 2011 at: http://<br />
siteresources.worldbank.org/INTMENA/Resources/<br />
OverviewENprintersversionspatialdisparities.pdf<br />
__. Program Document for a Proposed Loan to the<br />
Kingdom of Morocco for a Municipal Solid Waste<br />
Sector Development Policy Loan. Washington, D.C.:<br />
The World Bank, 2009.<br />
__. Project Appraisal Document on a<br />
Proposed Grant in the Amount of SDR 14.5<br />
Million (US$22 Equivalent) to the Republic of<br />
Yemen for an Integrated Urban Development<br />
Project. Washington, D.C.: The World Bank,<br />
2010.<br />
__. Project Appraisal Document on a<br />
Proposed Loan in the Amount of Euros<br />
16.8 Million to the Republic of Tunisia<br />
for a Sustainable Municipal Solid Waste<br />
Management Project. Washington, D.C.: The<br />
World Bank, 2007.<br />
__. Project Appraisal Document on a<br />
Proposed Loan in the Amount of US$ 20<br />
Million to the Hashemite Kingdom of Jordan<br />
for the Regional and Local Development<br />
Project. Washington, D.C.: The World Bank,<br />
2006.<br />
__. Project Information document (PID)<br />
Appraisal Stage. The World Bank, 2009.<br />
__. Project Information Document (PID)<br />
Concept Stage: MNA – Mashreq Trade<br />
Facilitation and Infrastructure – Phase I.<br />
Washington, D.C.: The World Bank, 2010.<br />
__. Rapport du Pays – Algerie. The World<br />
Bank Mediterranean Environmental Technical<br />
Assistance Programme (METAP), 2004.<br />
__. Rapport du Pays – Maroc. The World<br />
Bank Mediterranean Environmental Technical<br />
Assistance Programme (METAP), 2004.<br />
__. Republic of Tunisia: Health Sector Study.<br />
Washington D.C.: The World Bank, 2006.<br />
__. Republic of Yemen: Urban Transport in<br />
Sana’a Strategy Note. The World Bank, 2010.<br />
__. Sector brief: Urban Development in<br />
MENA. Washington, D.C.: The World Bank,<br />
2008.<br />
__. Sector Brief: Transportation in MENA.<br />
Washington, D.C.: The World Bank, 2008.<br />
__. Somalia: from Resilience towards<br />
Recovery and Development. Washington,<br />
D.C.: The World Bank, 2006.<br />
__. Somalia Socio-Economic Survey 2002.<br />
Nairobi: The World Bank, 2003.<br />
__. Sudan: the Road toward Sustainable and<br />
Broad-Based Growth. Washington, D.C.: The World<br />
Bank, 2009.<br />
__. The Macroeconomic and Sectoral Performance<br />
of Housing Supply Policies in Selected MENA<br />
Countries: a Comparative Analysis of Algeria,<br />
Egypt, Iran, Jordan, Lebanon, Morocco, Tunisia and<br />
Yemen. Washington, D.C.: The World Bank, 2005.<br />
__. Towards an Urban Sector Strategy.<br />
Washington, D.C.: The World Bank, 2009.<br />
__. Yemen Quarterly Economic Review. The World<br />
Bank, 2010.<br />
__. Yemen: Assessing the Impacts of Climate<br />
Change and Variability on the Water and<br />
Agricultural Sectors and the Policy Implications.<br />
Washington, D.C.: The World Bank, 2010.<br />
__. World Development Indicators Online Database.<br />
Washington, D.C.: The World Bank, 2011.<br />
World Bank and the Agence Française de<br />
Developpement. “Managing the Social Dimensions<br />
of Climate Change in MENA: Climate Change and<br />
Human Mobility Concept”, in proceedings of the<br />
First Workshop on Climate Induced Migration and<br />
Displacement in MENA, Marseille, France.<br />
World Bank and ESMAP. Potential for Energy<br />
Integration in Mashreq and Neighboring Countries.<br />
The World Bank and ESMAP, 2010.<br />
World Bank and Licus. Assessment of Localities’<br />
Compliance with Minimum Qualifying Criteria and<br />
Identification of their Capacity Needs in Northern<br />
Sudan. The World Bank and Licus, 2007.<br />
World Bank and IMF. Algeria Financial Sector<br />
Assessment. The World Bank amd IMF, 2004.<br />
World Gazetteer. Jordan: Largest cities and towns<br />
and statistics of their population.<br />
Yemen Ministry of Planning and International<br />
Cooperation Website. Tourism Sector Background<br />
Information.<br />
Zayed, D. and Dziadosz, A., ‘Egypt Eyes Mortgage<br />
Law to Boost Property Sector.’ The African Report,<br />
June 15 2010.
The <strong>Arab</strong> world has played a very important role in the history of urbanization. It is the region where urban civilization was born and where urban<br />
matters have been addressed for centuries. The <strong>Arab</strong> urban civilization, as it has evolved over the past millennium, has generated some of the most<br />
beautiful cities in the world.<br />
This publication is the first ever to comprehensively analyze urbanization processes in the <strong>Arab</strong> States through the review of its four sub-regions: the<br />
Maghreb, the Mashreq, the Gulf Cooperation Council countries and the least-developed <strong>Arab</strong> countries of the Southern Tier.<br />
Although the region has the world’s safest urban areas, these cities are also confronting daunting social, economic and political challenges. Western<br />
style democracy remains hard to adopt as <strong>Arab</strong> patterns of governance remain highly centralized. The availability of water and food poses similarly<br />
large challenges - especially at the urban level – as the future security of these two commodities could become one of the greatest risk factors to some<br />
<strong>Arab</strong> nations’ social stability.<br />
The region also needs to accommodate large numbers of urban in-migrants. Traditionally the source for this flow of people was rural to urban<br />
migration, but at present this only remains an issue in the least-developed <strong>Arab</strong> nations. Migration has become an international matter that directly<br />
affects urban development throughout the <strong>Arab</strong> world, whether it are economic migrants from Asia and other <strong>Arab</strong> States to the oil-rich Gulf<br />
Countries, migration from sub-Saharan Africa to the Maghreb in the hope of travelling on to the European Union, migration away from conflict<br />
and environmental degradation within the <strong>Arab</strong> region, or domestic migrations as in Sudan.<br />
The overarching challenge for <strong>Arab</strong> States’ governments is to reshape social and urban policies towards sustainable economic growth and adequate<br />
living conditions for rapidly expanding numbers of young and poor urban dwellers. But the confrontation with urbanity and modernity can only<br />
be resolved by the region itself, while the outcomes of policies to better integrate the <strong>Arab</strong> States among themselves and in the global economy will<br />
determine its future.<br />
HS Number: HS/021/12E<br />
ISBN Number (Series): 978-92-1-133397-8<br />
ISBN Number (Volume): 978-92-1-132436-5<br />
United Nations Human Settlements Programme, UN-Habitat<br />
P.O. Box 30030, Nairobi 00100, Kenya<br />
Tel: +254 20 7623 120<br />
Fax: +254 20 7623 904<br />
habitat.publications@unhabitat.org<br />
Printed in Kuwait<br />
www.unhabitat.org