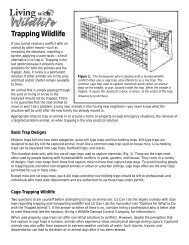
Download Document - Washington Department of Fish & Wildlife
Download Document - Washington Department of Fish & Wildlife
Download Document - Washington Department of Fish & Wildlife

You also want an ePaper? Increase the reach of your titles
YUMPU automatically turns print PDFs into web optimized ePapers that Google loves.
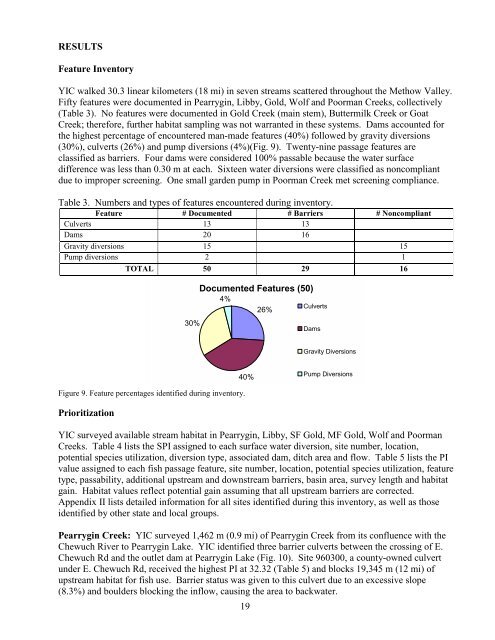
RESULTS<br />
Feature Inventory<br />
YIC walked 30.3 linear kilometers (18 mi) in seven streams scattered throughout the Methow Valley.<br />
Fifty features were documented in Pearrygin, Libby, Gold, Wolf and Poorman Creeks, collectively<br />
(Table 3). No features were documented in Gold Creek (main stem), Buttermilk Creek or Goat<br />
Creek; therefore, further habitat sampling was not warranted in these systems. Dams accounted for<br />
the highest percentage <strong>of</strong> encountered man-made features (40%) followed by gravity diversions<br />
(30%), culverts (26%) and pump diversions (4%)(Fig. 9). Twenty-nine passage features are<br />
classified as barriers. Four dams were considered 100% passable because the water surface<br />
difference was less than 0.30 m at each. Sixteen water diversions were classified as noncompliant<br />
due to improper screening. One small garden pump in Poorman Creek met screening compliance.<br />
Table 3. Numbers and types <strong>of</strong> features encountered during inventory.<br />
Feature # <strong>Document</strong>ed # Barriers # Noncompliant<br />
Culverts 13 13<br />
Dams 20 16<br />
Gravity diversions 15 15<br />
Pump diversions 2 1<br />
TOTAL 50 29 16<br />
30%<br />
Figure 9. Feature percentages identified during inventory.<br />
Prioritization<br />
<strong>Document</strong>ed Features (50)<br />
4%<br />
26%<br />
40%<br />
19<br />
Culverts<br />
Dams<br />
Gravity Diversions<br />
Pump Diversions<br />
YIC surveyed available stream habitat in Pearrygin, Libby, SF Gold, MF Gold, Wolf and Poorman<br />
Creeks. Table 4 lists the SPI assigned to each surface water diversion, site number, location,<br />
potential species utilization, diversion type, associated dam, ditch area and flow. Table 5 lists the PI<br />
value assigned to each fish passage feature, site number, location, potential species utilization, feature<br />
type, passability, additional upstream and downstream barriers, basin area, survey length and habitat<br />
gain. Habitat values reflect potential gain assuming that all upstream barriers are corrected.<br />
Appendix II lists detailed information for all sites identified during this inventory, as well as those<br />
identified by other state and local groups.<br />
Pearrygin Creek: YIC surveyed 1,462 m (0.9 mi) <strong>of</strong> Pearrygin Creek from its confluence with the<br />
Chewuch River to Pearrygin Lake. YIC identified three barrier culverts between the crossing <strong>of</strong> E.<br />
Chewuch Rd and the outlet dam at Pearrygin Lake (Fig. 10). Site 960300, a county-owned culvert<br />
under E. Chewuch Rd, received the highest PI at 32.32 (Table 5) and blocks 19,345 m (12 mi) <strong>of</strong><br />
upstream habitat for fish use. Barrier status was given to this culvert due to an excessive slope<br />
(8.3%) and boulders blocking the inflow, causing the area to backwater.