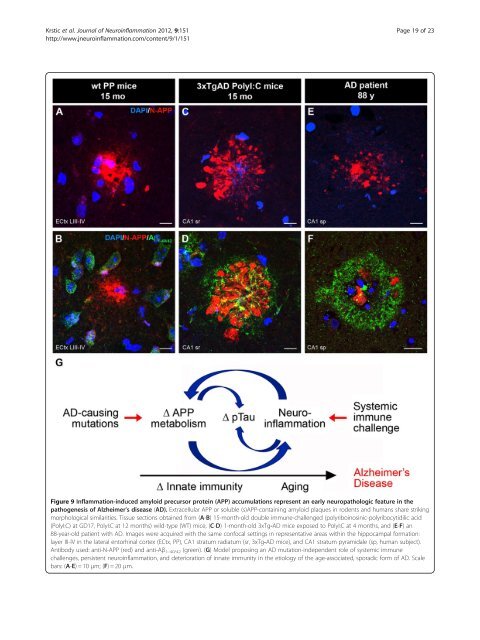
Krstic et al. <strong>Journal</strong> <strong>of</strong> <strong>Neuroinflammation</strong> 2012, 9:151 Page 19 <strong>of</strong> 23 http://www.jneuroinflammation.com/content/9/1/151 Figure 9 Inflammation-induced amyloid precursor protein (APP) accumulations represent an early neuropathologic feature in the pathogenesis <strong>of</strong> Alzheimer’s disease (AD). Extracellular APP or soluble (s)APP-containing amyloid plaques in rodents and humans share striking morphological similarities. Tissue sections obtained from (A-B) 15-month-old double immune-challenged (polyriboinosinic-polyribocytidilic acid (PolyI:C) at GD17, PolyI:C at 12 months) wild-type (WT) mice, (C-D) 1-month-old 3xTg-AD mice exposed to PolyI:C at 4 months, and (E-F) an 88-year-old patient with AD. Images were acquired with the same confocal settings in representative areas within the hippocampal formation: layer III-IV in the lateral entorhinal cortex (ECtx, PP), CA1 stratum radiatum (sr, 3xTg-AD mice), and CA1 stratum pyramidale (sp, human subject). Antibody used: anti-N-APP (red) and anti-Aβ 1–40/42 (green). (G) Model proposing an AD mutation-independent role <strong>of</strong> systemic immune challenges, persistent neuroinflammation, and deterioration <strong>of</strong> innate immunity in the etiology <strong>of</strong> the age-associated, sporadic form <strong>of</strong> AD. Scale bars: (A-E)=10 μm; (F)=20 μm.
Krstic et al. <strong>Journal</strong> <strong>of</strong> <strong>Neuroinflammation</strong> 2012, 9:151 Page 20 <strong>of</strong> 23 http://www.jneuroinflammation.com/content/9/1/151 Conclusion We provide experimental evidence for a causative and exacerbating role <strong>of</strong> systemic immune challenges on the development <strong>of</strong> AD-like neuropathology in vivo, thereby supporting recent genome-wide association studies [4], retrospective epidemiological human studies [5,6,12], and the long-standing infection/neuroinflammation-based AD hypotheses [11,22,33,61]. Furthermore, our data support the use <strong>of</strong> anti-inflammatory drugs [12] in the treatment <strong>of</strong> patients during the initial asymptomatic stages <strong>of</strong> AD [16], and confirm the importance <strong>of</strong> identifying early molecular markers <strong>of</strong> the disease. Finally, with the novel findings <strong>of</strong> focal accumulations <strong>of</strong> APP and its proteolytic fragments preceding senile plaque deposition, we <strong>of</strong>fer a very suitable mouse model to elucidate the molecular mechanisms underlying the earliest stages <strong>of</strong> the typical neuropathologic changes characteristic <strong>of</strong> sporadic AD. Additional files Additional file 1: Figure 1. Chronic increase in proinflammatory cytokines following a prenatal immune challenge in the hippocampus but not neocortex. (A-C) ELISA <strong>of</strong> neocortical (Ctx) and hippocampal (Hip) brain lysates obtained from 15-month-old polyriboinosinicpolyribocytidilic acid (PolyI:C)-treated and NaCI-treated mice (n = 4–7 per treatment group). Values represent mean ± SEM. *P < 0.05, Mann–Whitney U-test. (D-K) Immunohistochemical staining using anti-CD68 antibodies to visualize microglia in the hippocampus. Representative images are taken at different magnification from the dorsal CA1 <strong>of</strong> 15-month-old mice treated with (D,F,H) NaCI and (E,G,I) PolyI:C. Higher-magnification images show the activated stage (arrow) in microglia in the CA1 stratum lacunosum moleculare (slm) in 15-month-old mice (H) treated with PolyI:C compared with (I) control mice. (J,K) Anti-CD68 immunoreactivity (IR) in young (8 weeks) and old (15 months) naive wild-type (WT) mice. Whereas very small somata and thin processes dominated in young mice (J), microglia in old naive mice covered larger areas (K), very similar to the situation in old NaCI-exposed mice. Scale bars: (D) = 500 μm; (F) = 100 μm; (H, J)=20μm. Additional file 2: Figure 2. Changes in amyloid precursor protein (APP) processing and Tau phosphorylation across aging after a single prenatal immune challenge in non-transgenic mice. Longitudinal study involving murine hippocampal brain lysates obtained from (A,D) 3-month-old, (B,E) 6-month-old, and (C,F) 2-month-old non-transgenic mice exposed in utero at gestation day (GD)17 to either polyriboinosinic-polyribocytidilic acid (PolyI:C) or NaCI. The latter cohort also received a single NaCI injection at 9 months, and constituted the control group for the double immune-challenged mice. Western blots were performed using the following antibodies: (A-C) mouse anti-APP A4 (clone 22 C11, recognizing full-length APP, and soluble α- orβ-secretase-cleaved APP ectodomains (sAPP); rabbit anti-C-terminal APP (A8717, recognizing α- orβ-secretasegenerated C-terminal fragments (CTFs) and γ-secretase-cleaved APP intracellular domains (AICD)); and mouse anti-β-Actin (clone 4). (D-F) Western blots using mouse anti-paired helical filaments (PHFs, clone AT100), rabbit anti-phosphorylated Tau 205 , and mouse anti-total Tau (Tau-5) antibodies. Quantitative analysis involved the measurement <strong>of</strong> the integrated pixel brightness <strong>of</strong> the immunoreactive bands, corrected for non-specific background and equal loading using β-actin as control. Please note that the pTau blot in E has been overexposed for visual display. Western blot lanes show the different subjects. Values represent mean relative, β-actin-corrected optical density expressed in arbitrary units (AU) (mean ± SEM, n = 4 to 6 per treatment and age). *P < 0.05, **P < 0.01, # P = 0.053, Mann–Whitney U-test. Additional file 3: Figure 3. (A) Schematic representation <strong>of</strong> the domain structure <strong>of</strong> the amyloid precursor protein (short form, APP695), indicating α-, β- and γ-secretase cleavage sites and antibody binding sites. Note that antibody Aβ1–16 (6E10) recognizes both Aβ/C-terminal fragments (CTFs) as well as full-length APP on western blots and tissue sections (see Figure 5). By contrast, antibody Aβ1–40/42 has very low affinity for fulllength APP but strongly binds to Aβ/CTF fragments. (B) Schematic representation <strong>of</strong> the human Tau protein (441 amino acid, longest is<strong>of</strong>orm). Alternative splicing <strong>of</strong> mRNA from a single gene located on the long arm <strong>of</strong> chromosome 17 yields six different is<strong>of</strong>orms that are expressed in the adult human brain [62]. They differ by the presence <strong>of</strong> one to two amino-terminal inserts (blue) and three to four tandem repeats (purple) in the carboxyterminal region. The sequence common to all known is<strong>of</strong>orms is shown in gray. The phosphorylation-dependent anti-Tau antibodies used are listed (including their alternative names) along with the respective phosphorylation-site and flanking sequences. As can be seen from the alignment <strong>of</strong> the tau sequences in five species, there is a high level <strong>of</strong> homology between mouse and human tau. Note that pTau T205 antibody also crossreacts with Ser199 in mouse Tau, an epitope that can also be detected with the AT100 (PHF) antibody [63] Abbreviations:CTF, C-terminal fragment; AICD, APP intracellular domain; PM, plasma membrane; sAPPα/β,soluble α- orβ-secretase-cleaved. Additional file 4: Figure 4. Microglia responses in double immunechallenged non-transgenic mice. (A-D) Low-magnification images <strong>of</strong> immunoperoxidase staining using anti-CD68 antibody (MCA 341R) <strong>of</strong> coronal brain sections obtained from 18-month-old control mice (NN; NaCI at gestational day (GD) and 15 months), and prenatal (PN; polyriboinosinic-polyribocytidilic acid (PolyI:C) at GD17 and NaCI at 15 months), adult (NP; NaCI at GD17 and PolyI:C at 15 months), and double (PP, PolyI:C at GD17 and 15 months) immune-challenged mice. (D) A pronounced increase in the density <strong>of</strong> activated CD68positive microglia with hypertrophied and ameboid morphology was found throughout the hippocampal formation <strong>of</strong> double immunechallenged mice compared with control subjects. Note that also immune challenge (B) prenatally and (C) in adulthood alone had a stimulating effect on microglia OD. (E-F) Quantitative analysis <strong>of</strong> the immunoreactive signals labeled with antibodies against rat CD68. (E) ANOVA yielded a main effect <strong>of</strong> treatment for the quantification <strong>of</strong> percentage area covered by anti-CD68 immunoreactivity (IR) in the hippocampus (F3,16 = 4.4, P = 0.019) with significant differences between NN versus PP (P = 0.004), NP versus PP (P = 0.015), and PN versus PP (P = 0.026). (F) A significant main effect also emerged for the mean area (F3,16 =3.2, P = 0.049) with significantly higher levels <strong>of</strong> hypertrophied microglia in NN versus PP (P = 0.007). Values represent mean ± SEM (background corrected, n = 4 to 6 per treatment). *P < 0.05, **P < 0.01; Fisher's least significant difference post-hoc analysis. Scale bar = 200 μm. Additional file 5: Figure 5. Reactive astrogliosis following a double immune challenge in aged non-transgenic mice. (A-D) Lowmagnification images <strong>of</strong> immunoperoxidase staining using rabbit anti-glial fibrillary acidic protein (GFAP) antibody (AB5804) <strong>of</strong> coronal brain sections obtained from 18-month-old control mice (NN; NaCI at gestational day (GD) and 15 months), and prenatal (PN; polyriboinosinic-polyribocytidilic acid (PolyI:C) at GD17 and NaCI at 15 months), adult (NP; NaCI at GD17 and NaCI at 15 months), and double (PP, PolyI:C at GD17 and 15 months) immune-challenged mice. (D) A pronounced increase in the density <strong>of</strong> GFAP-positive astrocytes was evident in the hippocampal formation <strong>of</strong> double immune-challenged mice compared with control subjects. Note that also an immune challenge (B) prenatally and (C) in adulthood alone showed a trend towards elevated/reactive astrogliosis. (E) ANOVA yielded a main effect <strong>of</strong> treatment for the quantification <strong>of</strong> percentage area covered by anti-GFAP immunoreactivity (IR) in the hippocampus (F3,16 =3.4, P = 0.040) with significant differences between NN versus PP (P = 0.011) and NP versus PP (P = 0.021). (F) Volumetric analysis <strong>of</strong> the hippocampus revealed no significant differences between the treatment groups at this age. Values are givenasmean±SEM, n=4 to 6 pertreatment; *P < 0.05; statistical significance based on Fisher’s least significant difference post-hoc analysis. Scale bar = 500 μm. Additional file 6: Figure 6. Grayscale version <strong>of</strong> the lowmagnification images shown in Figure 5 (anti-Aβ1–16) and Figure 8