Two Reputedly Opposed Approaches: On the Integration of ...
Two Reputedly Opposed Approaches: On the Integration of ...
Two Reputedly Opposed Approaches: On the Integration of ...

You also want an ePaper? Increase the reach of your titles
YUMPU automatically turns print PDFs into web optimized ePapers that Google loves.
<strong>Two</strong> <strong>Reputedly</strong> <strong>Opposed</strong> <strong>Approaches</strong>: <strong>On</strong> <strong>the</strong> <strong>Integration</strong> <strong>of</strong> Business Rules and Data Mining<br />
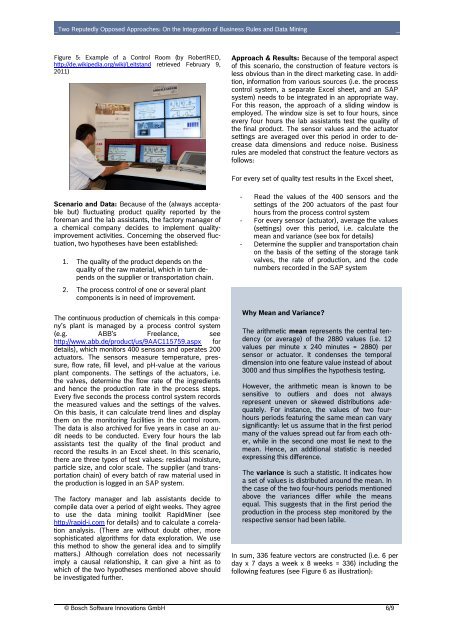
Figure 5: Example <strong>of</strong> a Control Room (by RobertRED,<br />
http://de.wikipedia.org/wiki/Leitstand retrieved February 9,<br />
2011)<br />
Scenario and Data: Because <strong>of</strong> <strong>the</strong> (always acceptable<br />
but) fluctuating product quality reported by <strong>the</strong><br />
foreman and <strong>the</strong> lab assistants, <strong>the</strong> factory manager <strong>of</strong><br />
a chemical company decides to implement qualityimprovement<br />
activities. Concerning <strong>the</strong> observed fluctuation,<br />
two hypo<strong>the</strong>ses have been established:<br />
1. The quality <strong>of</strong> <strong>the</strong> product depends on <strong>the</strong><br />
quality <strong>of</strong> <strong>the</strong> raw material, which in turn depends<br />
on <strong>the</strong> supplier or transportation chain.<br />
2. The process control <strong>of</strong> one or several plant<br />
components is in need <strong>of</strong> improvement.<br />
The continuous production <strong>of</strong> chemicals in this company’s<br />
plant is managed by a process control system<br />
(e.g. ABB’s Freelance, see<br />
http://www.abb.de/product/us/9AAC115759.aspx<br />
details), which monitors 400 sensors and operates 200<br />
actuators. The sensors measure temperature, pressure,<br />
flow rate, fill level, and pH-value at <strong>the</strong> various<br />
plant components. The settings <strong>of</strong> <strong>the</strong> actuators, i.e.<br />
<strong>the</strong> valves, determine <strong>the</strong> flow rate <strong>of</strong> <strong>the</strong> ingredients<br />
and hence <strong>the</strong> production rate in <strong>the</strong> process steps.<br />
Every five seconds <strong>the</strong> process control system records<br />
<strong>the</strong> measured values and <strong>the</strong> settings <strong>of</strong> <strong>the</strong> valves.<br />
<strong>On</strong> this basis, it can calculate trend lines and display<br />
<strong>the</strong>m on <strong>the</strong> monitoring facilities in <strong>the</strong> control room.<br />
The data is also archived for five years in case an audit<br />
needs to be conducted. Every four hours <strong>the</strong> lab<br />
assistants test <strong>the</strong> quality <strong>of</strong> <strong>the</strong> final product and<br />
record <strong>the</strong> results in an Excel sheet. In this scenario,<br />
<strong>the</strong>re are three types <strong>of</strong> test values: residual moisture,<br />
particle size, and color scale. The supplier (and transportation<br />
chain) <strong>of</strong> every batch <strong>of</strong> raw material used in<br />
<strong>the</strong> production is logged in an SAP system.<br />
The factory manager and lab assistants decide to<br />
compile data over a period <strong>of</strong> eight weeks. They agree<br />
to use <strong>the</strong> data mining toolkit RapidMiner (see<br />
http://rapid-i.com for details) and to calculate a correlation<br />
analysis. (There are without doubt o<strong>the</strong>r, more<br />
sophisticated algorithms for data exploration. We use<br />
this method to show <strong>the</strong> general idea and to simplify<br />
matters.) Although correlation does not necessarily<br />
imply a causal relationship, it can give a hint as to<br />
which <strong>of</strong> <strong>the</strong> two hypo<strong>the</strong>ses mentioned above should<br />
be investigated fur<strong>the</strong>r.<br />
for<br />
Approach & Results: Because <strong>of</strong> <strong>the</strong> temporal aspect<br />
<strong>of</strong> this scenario, <strong>the</strong> construction <strong>of</strong> feature vectors is<br />
less obvious than in <strong>the</strong> direct marketing case. In addition,<br />
information from various sources (i.e. <strong>the</strong> process<br />
control system, a separate Excel sheet, and an SAP<br />
system) needs to be integrated in an appropriate way.<br />
For this reason, <strong>the</strong> approach <strong>of</strong> a sliding window is<br />
employed. The window size is set to four hours, since<br />
every four hours <strong>the</strong> lab assistants test <strong>the</strong> quality <strong>of</strong><br />
<strong>the</strong> final product. The sensor values and <strong>the</strong> actuator<br />
settings are averaged over this period in order to decrease<br />
data dimensions and reduce noise. Business<br />
rules are modeled that construct <strong>the</strong> feature vectors as<br />
follows:<br />
For every set <strong>of</strong> quality test results in <strong>the</strong> Excel sheet,<br />
- Read <strong>the</strong> values <strong>of</strong> <strong>the</strong> 400 sensors and <strong>the</strong><br />
settings <strong>of</strong> <strong>the</strong> 200 actuators <strong>of</strong> <strong>the</strong> past four<br />
hours from <strong>the</strong> process control system<br />
- For every sensor (actuator), average <strong>the</strong> values<br />
(settings) over this period, i.e. calculate <strong>the</strong><br />
mean and variance (see box for details)<br />
- Determine <strong>the</strong> supplier and transportation chain<br />
on <strong>the</strong> basis <strong>of</strong> <strong>the</strong> setting <strong>of</strong> <strong>the</strong> storage tank<br />
valves, <strong>the</strong> rate <strong>of</strong> production, and <strong>the</strong> code<br />
numbers recorded in <strong>the</strong> SAP system<br />
Why Mean and Variance?<br />
The arithmetic mean represents <strong>the</strong> central tendency<br />
(or average) <strong>of</strong> <strong>the</strong> 2880 values (i.e. 12<br />
values per minute x 240 minutes = 2880) per<br />
sensor or actuator. It condenses <strong>the</strong> temporal<br />
dimension into one feature value instead <strong>of</strong> about<br />
3000 and thus simplifies <strong>the</strong> hypo<strong>the</strong>sis testing.<br />
However, <strong>the</strong> arithmetic mean is known to be<br />
sensitive to outliers and does not always<br />
represent uneven or skewed distributions adequately.<br />
For instance, <strong>the</strong> values <strong>of</strong> two fourhours<br />
periods featuring <strong>the</strong> same mean can vary<br />
significantly: let us assume that in <strong>the</strong> first period<br />
many <strong>of</strong> <strong>the</strong> values spread out far from each o<strong>the</strong>r,<br />
while in <strong>the</strong> second one most lie next to <strong>the</strong><br />
mean. Hence, an additional statistic is needed<br />
expressing this difference.<br />
The variance is such a statistic. It indicates how<br />
a set <strong>of</strong> values is distributed around <strong>the</strong> mean. In<br />
<strong>the</strong> case <strong>of</strong> <strong>the</strong> two four-hours periods mentioned<br />
above <strong>the</strong> variances differ while <strong>the</strong> means<br />
equal. This suggests that in <strong>the</strong> first period <strong>the</strong><br />
production in <strong>the</strong> process step monitored by <strong>the</strong><br />
respective sensor had been labile.<br />
In sum, 336 feature vectors are constructed (i.e. 6 per<br />
day x 7 days a week x 8 weeks = 336) including <strong>the</strong><br />
following features (see Figure 6 as illustration):<br />
© Bosch S<strong>of</strong>tware Innovations GmbH 6/9