Highs & Lows Stocks & Storage Biotech Varieties Floriculture ...
Highs & Lows Stocks & Storage Biotech Varieties Floriculture ...
Highs & Lows Stocks & Storage Biotech Varieties Floriculture ...

You also want an ePaper? Increase the reach of your titles
YUMPU automatically turns print PDFs into web optimized ePapers that Google loves.
Counties and<br />
Districts<br />
Planted All<br />
Purposes<br />
Harvested for<br />
Grain<br />
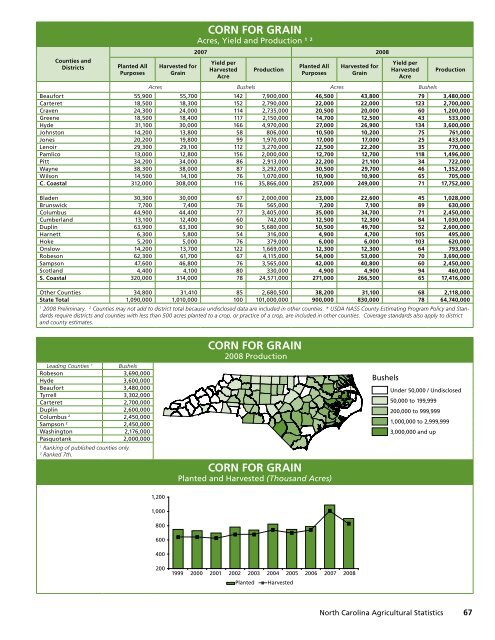
CORN FOR GRAIN<br />
Acres, Yield and Production 1 2<br />
2007 2008<br />
Yield per<br />
Harvested<br />
Acre<br />
Production<br />
Planted All<br />
Purposes<br />
Harvested for<br />
Grain<br />
Yield per<br />
Harvested<br />
Acre<br />
Acres Bushels Acres Bushels<br />
Production<br />
Beaufort 55,900 55,700 142 7,900,000 46,500 43,800 79 3,480,000<br />
Carteret 18,500 18,300 152 2,790,000 22,000 22,000 123 2,700,000<br />
Craven 24,300 24,000 114 2,735,000 20,500 20,000 60 1,200,000<br />
Greene 18,500 18,400 117 2,150,000 14,700 12,500 43 533,000<br />
Hyde 31,100 30,000 166 4,970,000 27,000 26,900 134 3,600,000<br />
Johnston 14,200 13,800 58 806,000 10,500 10,200 75 761,000<br />
Jones 20,200 19,800 99 1,970,000 17,000 17,000 25 433,000<br />
Lenoir 29,300 29,100 112 3,270,000 22,500 22,200 35 770,000<br />
Pamlico 13,000 12,800 156 2,000,000 12,700 12,700 118 1,496,000<br />
Pitt 34,200 34,000 86 2,913,000 22,200 21,100 34 722,000<br />
Wayne 38,300 38,000 87 3,292,000 30,500 29,700 46 1,352,000<br />
Wilson 14,500 14,100 76 1,070,000 10,900 10,900 65 705,000<br />
C. Coastal 312,000 308,000 116 35,866,000 257,000 249,000 71 17,752,000<br />
Bladen 30,300 30,000 67 2,000,000 23,000 22,600 45 1,028,000<br />
Brunswick 7,700 7,400 76 565,000 7,200 7,100 89 630,000<br />
Columbus 44,900 44,400 77 3,405,000 35,000 34,700 71 2,450,000<br />
Cumberland 13,100 12,400 60 742,000 12,500 12,300 84 1,030,000<br />
Duplin 63,900 63,300 90 5,680,000 50,500 49,700 52 2,600,000<br />
Harnett 6,300 5,800 54 316,000 4,900 4,700 105 495,000<br />
Hoke 5,200 5,000 76 379,000 6,000 6,000 103 620,000<br />
Onslow 14,200 13,700 122 1,669,000 12,300 12,300 64 793,000<br />
Robeson 62,300 61,700 67 4,115,000 54,000 53,000 70 3,690,000<br />
Sampson 47,600 46,800 76 3,565,000 42,000 40,800 60 2,450,000<br />
Scotland 4,400 4,100 80 330,000 4,900 4,900 94 460,000<br />
S. Coastal 320,000 314,000 78 24,571,000 271,000 266,500 65 17,416,000<br />
Other Counties 34,800 31,410 85 2,680,500 38,200 31,100 68 2,118,000<br />
State Total 1,090,000 1,010,000 100 101,000,000 900,000 830,000 78 64,740,000<br />
1 2008 Preliminary. 2 Counties may not add to district total because undisclosed data are included in other counties. * USDA NASS County Estimating Program Policy and Standards<br />
require districts and counties with less than 500 acres planted to a crop, or practice of a crop, are included in other counties. Coverage standards also apply to district<br />
and county estimates.<br />
Leading Counties 1 Bushels<br />
Robeson 3,690,000<br />
Hyde 3,600,000<br />
Beaufort 3,480,000<br />
Tyrrell 3,302,000<br />
Carteret 2,700,000<br />
Duplin 2,600,000<br />
Columbus 2 2,450,000<br />
Sampson 2 2,450,000<br />
Washington 2,176,000<br />
Pasquotank 2,000,000<br />
1 Ranking of published counties only.<br />
2 Ranked 7th.<br />
1,200<br />
1,000<br />
800<br />
600<br />
400<br />
200<br />
CORN FOR GRAIN<br />
2008 Production<br />
CORN FOR GRAIN<br />
Planted and Harvested (Thousand Acres)<br />
1999 2000 2001 2002 2003 2004 2005 2006 2007 2008<br />
Planted Harvested<br />
Bushels<br />
Under 50,000 / Undisclosed<br />
50,000 to 199,999<br />
200,000 to 999,999<br />
1,000,000 to 2,999,999<br />
3,000,000 and up<br />
North Carolina Agricultural Statistics 67