Highs & Lows Stocks & Storage Biotech Varieties Floriculture ...
Highs & Lows Stocks & Storage Biotech Varieties Floriculture ...
Highs & Lows Stocks & Storage Biotech Varieties Floriculture ...

Create successful ePaper yourself
Turn your PDF publications into a flip-book with our unique Google optimized e-Paper software.
Year<br />
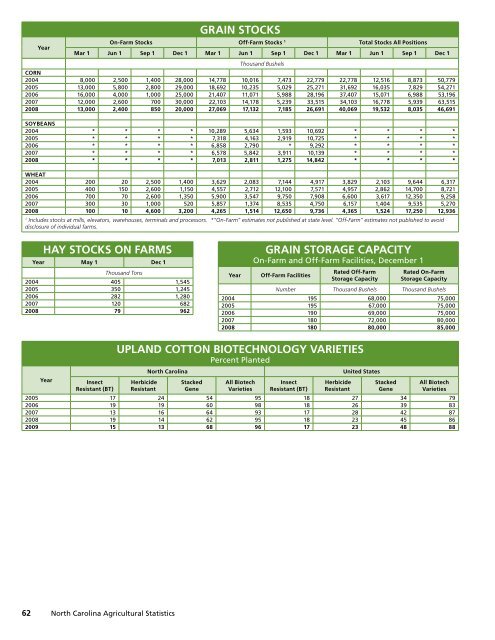
62 North Carolina Agricultural Statistics<br />
GRAIN STOCKS<br />
On-Farm <strong>Stocks</strong> Off-Farm <strong>Stocks</strong> 1 Total <strong>Stocks</strong> All Positions<br />
Mar 1 Jun 1 Sep 1 Dec 1 Mar 1 Jun 1 Sep 1 Dec 1 Mar 1 Jun 1 Sep 1 Dec 1<br />
Thousand Bushels<br />
CORN<br />
2004 8,000 2,500 1,400 28,000 14,778 10,016 7,473 22,779 22,778 12,516 8,873 50,779<br />
2005 13,000 5,800 2,800 29,000 18,692 10,235 5,029 25,271 31,692 16,035 7,829 54,271<br />
2006 16,000 4,000 1,000 25,000 21,407 11,071 5,988 28,196 37,407 15,071 6,988 53,196<br />
2007 12,000 2,600 700 30,000 22,103 14,178 5,239 33,515 34,103 16,778 5,939 63,515<br />
2008 13,000 2,400 850 20,000 27,069 17,132 7,185 26,691 40,069 19,532 8,035 46,691<br />
SOYBEANS<br />
2004 * * * * 10,289 5,634 1,593 10,692 * * * *<br />
2005 * * * * 7,318 4,163 2,919 10,725 * * * *<br />
2006 * * * * 6,858 2,790 * 9,292 * * * *<br />
2007 * * * * 6,578 5,842 3,911 10,139 * * * *<br />
2008 * * * * 7,013 2,811 1,275 14,842 * * * *<br />
WHEAT<br />
2004 200 20 2,500 1,400 3,629 2,083 7,144 4,917 3,829 2,103 9,644 6,317<br />
2005 400 150 2,600 1,150 4,557 2,712 12,100 7,571 4,957 2,862 14,700 8,721<br />
2006 700 70 2,600 1,350 5,900 3,547 9,750 7,908 6,600 3,617 12,350 9,258<br />
2007 300 30 1,000 520 5,857 1,374 8,535 4,750 6,157 1,404 9,535 5,270<br />
2008 100 10 4,600 3,200 4,265 1,514 12,650 9,736 4,365 1,524 17,250 12,936<br />
1 Includes stocks at mills, elevators, warehouses, terminals and processors. *“On-Farm” estimates not published at state level. “Off-Farm” estimates not published to avoid<br />
disclosure of individual farms.<br />
HAY STOCKS ON FARMS<br />
Year May 1 Dec 1<br />
Thousand Tons<br />
2004 405 1,545<br />
2005 350 1,245<br />
2006 282 1,280<br />
2007 120 682<br />
2008 79 962<br />
Year<br />
Insect<br />
Resistant (BT)<br />
GRAIN STORAGE CAPACITY<br />
On-Farm and Off-Farm Facilities, December 1<br />
Year Off-Farm Facilities<br />
Rated Off-Farm<br />
<strong>Storage</strong> Capacity<br />
Rated On-Farm<br />
<strong>Storage</strong> Capacity<br />
Number Thousand Bushels Thousand Bushels<br />
2004 195 68,000 75,000<br />
2005 195 67,000 75,000<br />
2006 190 69,000 75,000<br />
2007 180 72,000 80,000<br />
2008 180 80,000 85,000<br />
UPLAND COTTON BIOTECHNOLOGY VARIETIES<br />
Percent Planted<br />
Herbicide<br />
Resistant<br />
North Carolina United States<br />
Stacked<br />
Gene<br />
All <strong>Biotech</strong><br />
<strong>Varieties</strong><br />
Insect<br />
Resistant (BT)<br />
Herbicide<br />
Resistant<br />
Stacked<br />
Gene<br />
All <strong>Biotech</strong><br />
<strong>Varieties</strong><br />
2005 17 24 54 95 18 27 34 79<br />
2006 19 19 60 98 18 26 39 83<br />
2007 13 16 64 93 17 28 42 87<br />
2008 19 14 62 95 18 23 45 86<br />
2009 15 13 68 96 17 23 48 88