- Page 1 and 2: Firms, Prices, And Markets Timothy
- Page 3 and 4: Table of Contents Math Review 1 M.1
- Page 5 and 6: Table of Contents iii 7 Pricing wit
- Page 7: Table of Contents v 16.5 Comparison
- Page 11 and 12: M.1 What math? Math Review Microeco
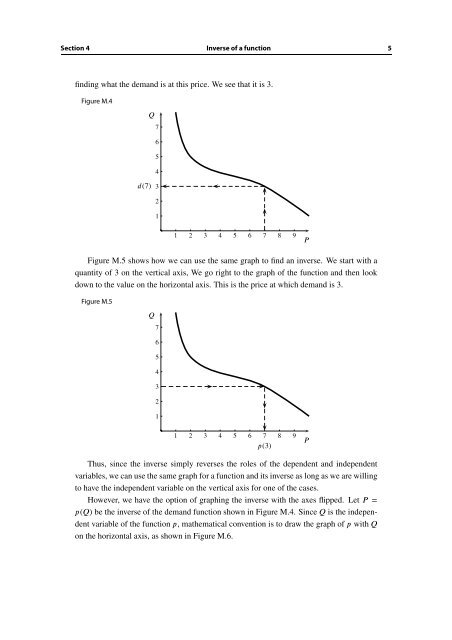
- Page 13: Section 3 Graphs 3 M.3 Graphs To gr
- Page 17 and 18: Section 6 Some nonlinear functions
- Page 19 and 20: Section 8 Slope of a nonlinear func
- Page 21 and 22: Preliminaries Analytic Methods for
- Page 23 and 24: Section 2 The economist’s notion
- Page 25 and 26: Section 4 Decomposition of decision
- Page 27 and 28: Section 5 Marginal analysis 17 Marg
- Page 29 and 30: Section 5 Marginal analysis 19 •
- Page 31 and 32: Section 6 The mathematics of margin
- Page 33 and 34: Section 7 Wrap-up 23 Observe that a
- Page 35 and 36: 1.1 Motives and objectives Broadly
- Page 37 and 38: Section 3 Valuation, cost, and surp
- Page 39 and 40: Section 5 Many buyers and many sell
- Page 41 and 42: Section 5 Many buyers and many sell
- Page 43 and 44: Section 6 Very many buyers and very
- Page 45 and 46: Section 8 Wrap-up 35 1.8 Wrap-up Th
- Page 47 and 48: Chapter 2 Supply, Demand, and Marke
- Page 49 and 50: Section 3 Many buyers and many sell
- Page 51 and 52: Section 4 Demand and supply: Graphi
- Page 53 and 54: Section 5 Consumer and producer sur
- Page 55 and 56: Section 6 Gains from trade in equil
- Page 57 and 58: Section7 Changesincostsorvaluations
- Page 59 and 60: Section7 Changesincostsorvaluations
- Page 61 and 62: Section 8 Taxes on transaction 51 s
- Page 63 and 64: Section 9 Wrap-up 53 ation curve (m
- Page 65 and 66:
Additional exercises 55 Exercise 2.
- Page 67 and 68:
Chapter 3 Consumer Choice and Deman
- Page 69 and 70:
Section 3 A model of consumer choic
- Page 71 and 72:
Section 4 Interpretation of demand
- Page 73 and 74:
Section 4 Interpretation of demand
- Page 75 and 76:
Section 5 Wrap-up 65 Linear and log
- Page 77 and 78:
Chapter 4 Production and Costs 4.1
- Page 79 and 80:
Section 3 What to include in the co
- Page 81 and 82:
Section 3 What to include in the co
- Page 83 and 84:
Section 4 Economies of scale 73 Sou
- Page 85 and 86:
Section 5 A typical cost curve 75 M
- Page 87 and 88:
Section 6 When are fixed costs impo
- Page 89 and 90:
Section 6 When are fixed costs impo
- Page 91 and 92:
Section 7 Pitfalls to avoid regardi
- Page 93 and 94:
Section 8 The leading examples of c
- Page 95 and 96:
Section 8 The leading examples of c
- Page 97 and 98:
Section 8 The leading examples of c
- Page 99 and 100:
Section 8 The leading examples of c
- Page 101:
Additional exercises 91 Additional
- Page 104 and 105:
94 Competitive Supply and Market Pr
- Page 106 and 107:
96 Competitive Supply and Market Pr
- Page 108 and 109:
98 Competitive Supply and Market Pr
- Page 110 and 111:
100 Competitive Supply and Market P
- Page 112 and 113:
102 Competitive Supply and Market P
- Page 114 and 115:
104 Competitive Supply and Market P
- Page 116 and 117:
106 Competitive Supply and Market P
- Page 118 and 119:
108 Competitive Supply and Market P
- Page 120 and 121:
110 Competitive Supply and Market P
- Page 122 and 123:
112 Competitive Supply and Market P
- Page 124 and 125:
114 Short-Run Costs and Prices Chap
- Page 126 and 127:
116 Short-Run Costs and Prices Chap
- Page 128 and 129:
118 Short-Run Costs and Prices Chap
- Page 130 and 131:
120 Short-Run Costs and Prices Chap
- Page 132 and 133:
122 Short-Run Costs and Prices Chap
- Page 134 and 135:
124 Short-Run Costs and Prices Chap
- Page 136 and 137:
126 Short-Run Costs and Prices Chap
- Page 138 and 139:
128 Short-Run Costs and Prices Chap
- Page 141 and 142:
Chapter 7 Pricing with Market Power
- Page 143 and 144:
Section 3 Profit-maximizing output
- Page 145 and 146:
Section 3 Profit-maximizing output
- Page 147 and 148:
Section 4 Profit maximization versu
- Page 149 and 150:
Section 4 Profit maximization versu
- Page 151 and 152:
Section 4 Profit maximization versu
- Page 153 and 154:
Section 5 The effect of a long-run
- Page 155 and 156:
Additional exercises 145 produces l
- Page 157 and 158:
Chapter 8 Elasticity of Demand 8.1
- Page 159 and 160:
Section 2 Measuring elasticity 149
- Page 161 and 162:
Section 4 Elasticity of special dem
- Page 163 and 164:
Section 4 Elasticity of special dem
- Page 165 and 166:
Section 6 Wrap-up 155 For example,
- Page 167 and 168:
Chapter 9 How Pricing Depends on th
- Page 169 and 170:
Section 3 Marginal revenue and elas
- Page 171 and 172:
Section 4 The effect of an increase
- Page 173 and 174:
Section 5 The price-sensitivity eff
- Page 175 and 176:
Section 6 The volume effect 165 Alt
- Page 177 and 178:
Section 8 Wrap-up 167 The shift in
- Page 179:
Additional exercises 169 Figure E9.
- Page 182 and 183:
172 Explicit Price Discrimination C
- Page 184 and 185:
174 Explicit Price Discrimination C
- Page 186 and 187:
176 Explicit Price Discrimination C
- Page 188 and 189:
178 Explicit Price Discrimination C
- Page 190 and 191:
180 Implicit Price Discrimination (
- Page 192 and 193:
182 Implicit Price Discrimination (
- Page 194 and 195:
184 Implicit Price Discrimination (
- Page 196 and 197:
186 Implicit Price Discrimination (
- Page 198 and 199:
188 Implicit Price Discrimination (
- Page 200 and 201:
190 Implicit Price Discrimination (
- Page 202 and 203:
192 Implicit Price Discrimination (
- Page 204 and 205:
194 Implicit Price Discrimination (
- Page 206 and 207:
196 Implicit Price Discrimination (
- Page 208 and 209:
198 Implicit Price Discrimination (
- Page 210 and 211:
200 Nonlinear Pricing Chapter 12 On
- Page 212 and 213:
202 Nonlinear Pricing Chapter 12 tw
- Page 214 and 215:
204 Nonlinear Pricing Chapter 12 fu
- Page 216 and 217:
206 Nonlinear Pricing Chapter 12 We
- Page 218 and 219:
208 Nonlinear Pricing Chapter 12 Fi
- Page 220 and 221:
210 Nonlinear Pricing Chapter 12
- Page 222 and 223:
212 Static Games and Nash Equilibri
- Page 224 and 225:
214 Static Games and Nash Equilibri
- Page 226 and 227:
216 Static Games and Nash Equilibri
- Page 228 and 229:
218 Static Games and Nash Equilibri
- Page 230 and 231:
220 Static Games and Nash Equilibri
- Page 232 and 233:
222 Static Games and Nash Equilibri
- Page 234 and 235:
224 Static Games and Nash Equilibri
- Page 236 and 237:
226 Static Games and Nash Equilibri
- Page 238 and 239:
228 Static Games and Nash Equilibri
- Page 240 and 241:
230 Imperfect Competition Chapter 1
- Page 242 and 243:
232 Imperfect Competition Chapter 1
- Page 244 and 245:
234 Imperfect Competition Chapter 1
- Page 246 and 247:
236 Imperfect Competition Chapter 1
- Page 248 and 249:
238 Imperfect Competition Chapter 1
- Page 250 and 251:
240 Imperfect Competition Chapter 1
- Page 252 and 253:
242 Imperfect Competition Chapter 1
- Page 255 and 256:
Chapter 15 Explicit and Implicit Co
- Page 257 and 258:
Section 3 Individual vs. collective
- Page 259 and 260:
Section 3 Individual vs. collective
- Page 261 and 262:
Section 4 Achieving cooperation thr
- Page 263:
Section 5 Wrap-up 253 of a social n
- Page 266 and 267:
256 Strategic Commitment Chapter 16
- Page 268 and 269:
258 Strategic Commitment Chapter 16
- Page 270 and 271:
260 Strategic Commitment Chapter 16
- Page 272 and 273:
262 Strategic Commitment Chapter 16
- Page 274 and 275:
264 Strategic Commitment Chapter 16
- Page 276 and 277:
266 Strategic Commitment Chapter 16
- Page 278 and 279:
268 Strategic Commitment Chapter 16
- Page 280 and 281:
270 Strategic Commitment Chapter 16
- Page 282 and 283:
272 Strategic Commitment Chapter 16
- Page 284:
274 Strategic Commitment Chapter 16